9/3/2015 ieng 486 statistical quality & process control 1 ieng 486 - lecture 11 hypothesis tests...
TRANSCRIPT

04/19/23IENG 486 Statistical Quality & Process
Control 1
IENG 486 - Lecture 11
Hypothesis Tests to Control Charts

04/19/23 IENG 486 Statistical Quality & Process Control 2
Assignment:
Exam: It was supposed to be a long, difficult exam … I’m assuming
that you prepared well … Exam Results … 1st page of hypothesis tests looks grim.
Reading: CH5: 5.3 (already read 5.1-5.2 & 5.4) Start on CH6: all except 6.3.2 & 6.4
Homework 4: Textbook Problems CH5: 9, 11, 13, 23, and 24

04/19/23 IENG 486 Statistical Quality & Process Control 3
Process for Statistical Control Of Quality
Removing special causes of variation
Hypothesis Tests
Ishikawa’s Tools
Managing the process with control charts
Process Improvement
Process Stabilization
Confidence in “When to Act”
Reduce Variability
Identify Special Causes - Good (Incorporate)
Improving Process Capability and Performance
Characterize Stable Process Capability
Head Off Shifts in Location, Spread
Identify Special Causes - Bad (Remove)
Continually Improve the System
Statistical Quality Control and Improvement
Time
Center the ProcessLSL 0 USL

04/19/23 IENG 486 Statistical Quality & Process Control 4
Moving from Hypothesis Testing to Control Charts
A control chart is like a sideways hypothesis test Detects a shift in the process Heads-off costly errors by detecting trends
0
2
2
0
2
2
2-Sided Hypothesis Test Shewhart Control ChartSideways Hypothesis Test
CL
LCL
UCL
Sample Number
04/19/23 IENG 486 Statistical Quality & Process Control 5
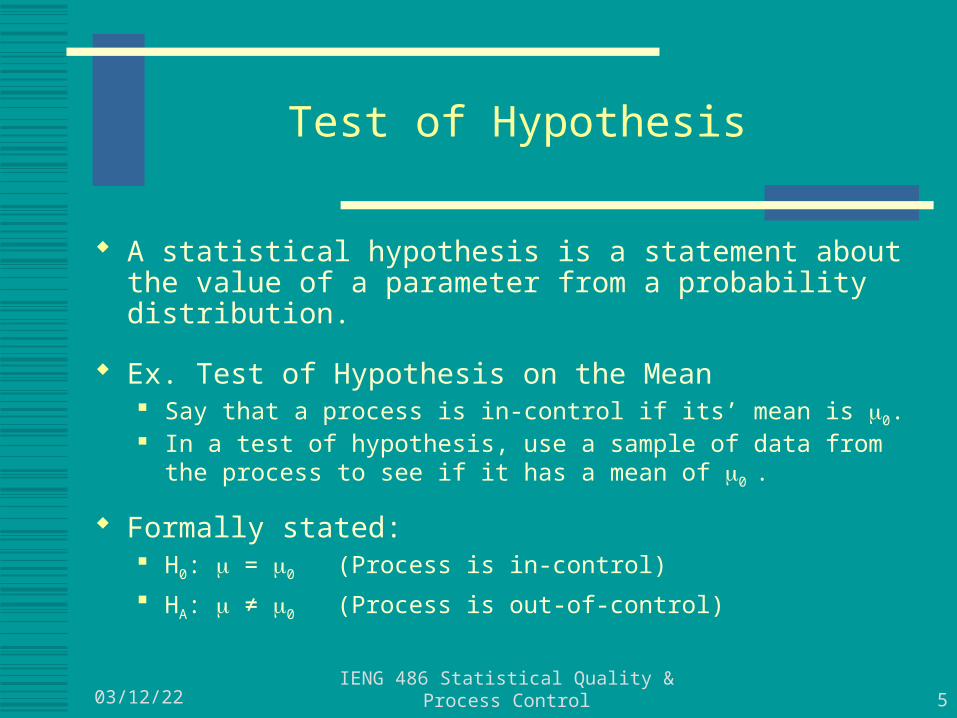
Test of Hypothesis
A statistical hypothesis is a statement about the value of a parameter from a probability distribution.
Ex. Test of Hypothesis on the Mean Say that a process is in-control if its’ mean is 0. In a test of hypothesis, use a sample of data from the process
to see if it has a mean of 0 .
Formally stated: H0: = 0 (Process is in-control) HA: ≠ 0 (Process is out-of-control)
04/19/23 IENG 486 Statistical Quality & Process Control 6
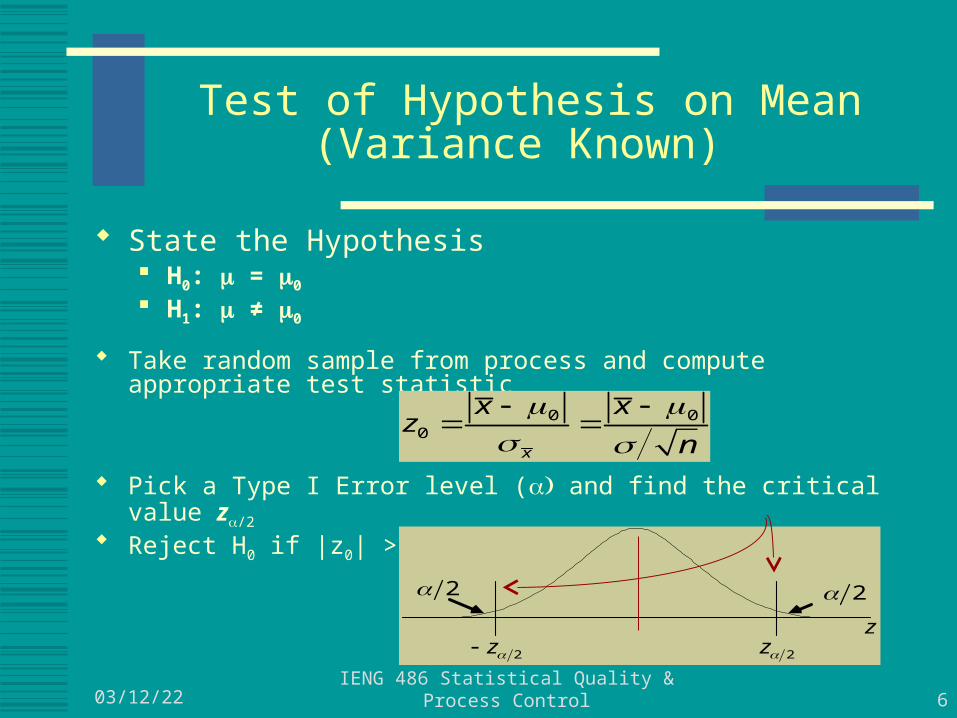
Test of Hypothesis on Mean (Variance Known)
State the Hypothesis H0: = 0 H1: ≠ 0
Take random sample from process and compute appropriate test statistic
Pick a Type I Error level ( and find the critical value z/2
Reject H0 if |z0| > z/2
0 00
x
x xz
n
22
z2z2z
04/19/23 IENG 486 Statistical Quality & Process Control 7
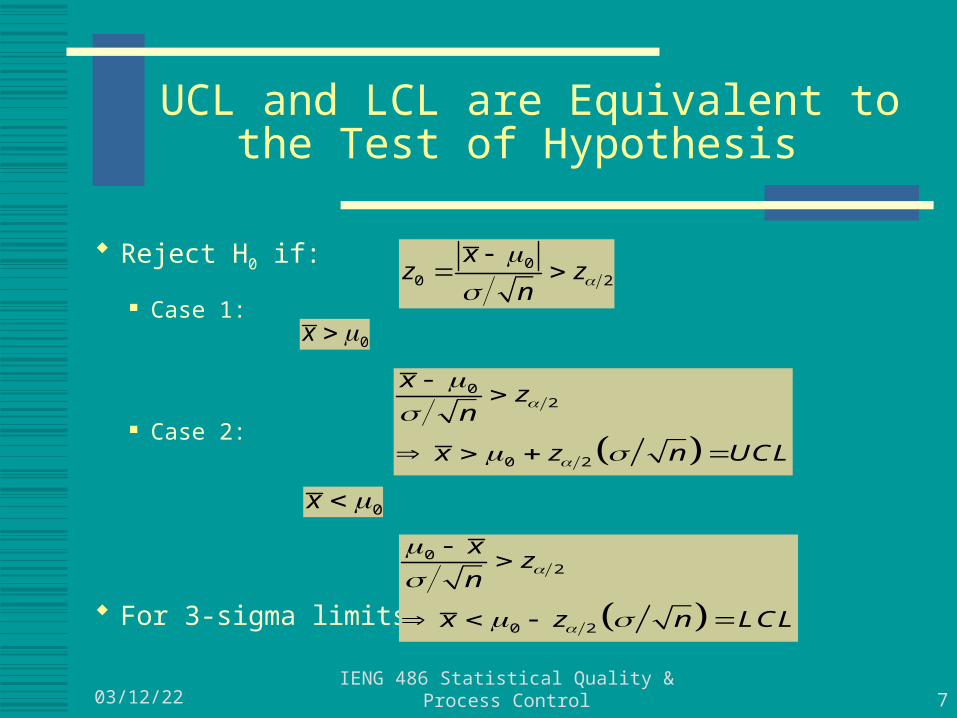
UCL and LCL are Equivalent to the Test of Hypothesis
Reject H0 if:
Case 1:
Case 2:
For 3-sigma limits z/2 = 3
00 2
xz z
n
0x
02
0 2
xz
n
x z n UCL
0x
02
0 2
xz
n
x z n LCL

04/19/23 IENG 486 Statistical Quality & Process Control 8
Two Types of Errors May Occur When Testing a Hypothesis
Type I Error - Reject H0 when we shouldn't
Analogous to false alarm on control chart, i.e., point lays outside control limits but process is truly in-control
Type II Error - Fail to reject H0 when we should Analogous to insensitivity of control chart to problems, i.e.,
point does not lay outside control limits but process is never-the-less out-of-control

04/19/23 IENG 486 Statistical Quality & Process Control 9
Choice of Control Limits:Trade-off Between Wide or Narrow Control Limits
Moving limits further from the center line Decreases risk of false alarm, BUT increases risk of insensitivity
Moving limits closer to the center line Decreases risk of insensitivity, BUT increases risk of false alarm
Sample
x
UCL
LCLCL
Sample
x UCL
LCL
CL
Sample
x UCL
LCL
CL

04/19/23 IENG 486 Statistical Quality & Process Control 10
Consequences of Incorrect Control Limits
NOT GOOD: A control chart that never finds anything wrong
with process, but the process produces bad product
NOT GOOD: Too many false alarms destroys the operating
personnel’s confidence in the control chart, and they stop using it
04/19/23 IENG 486 Statistical Quality & Process Control 11
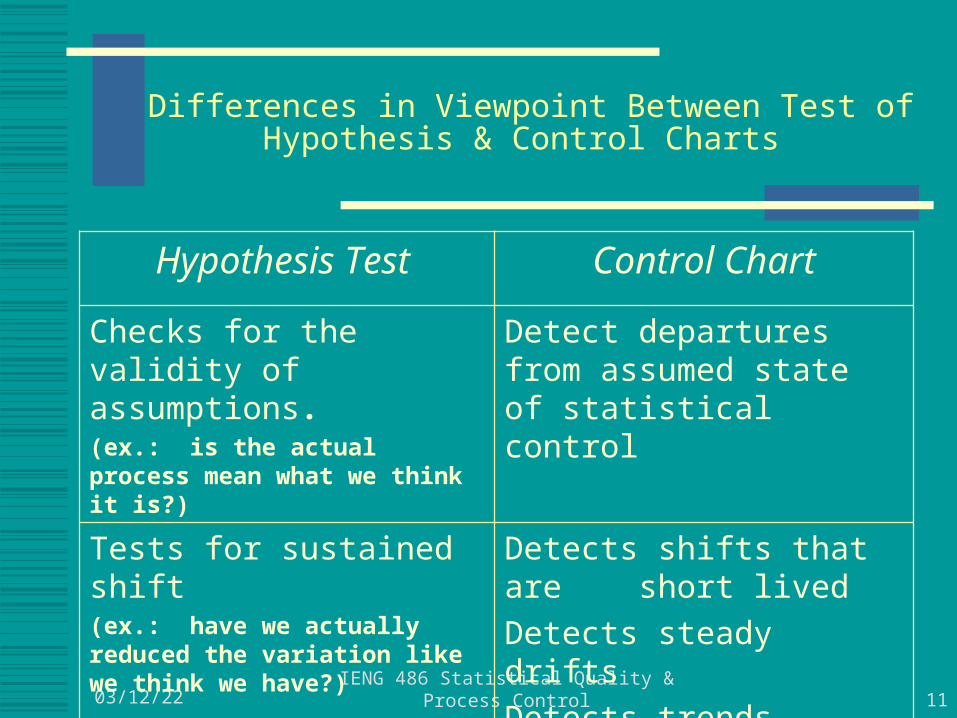
Differences in Viewpoint Between Test of Hypothesis & Control Charts
Hypothesis Test Control Chart
Checks for the validity of assumptions. (ex.: is the actual process mean what we think it is?)
Detect departures from assumed state of statistical control
Tests for sustained shift(ex.: have we actually reduced the variation like we think we have?)
Detects shifts that are short lived
Detects steady drifts
Detects trends
04/19/23 IENG 486 Statistical Quality & Process Control 12
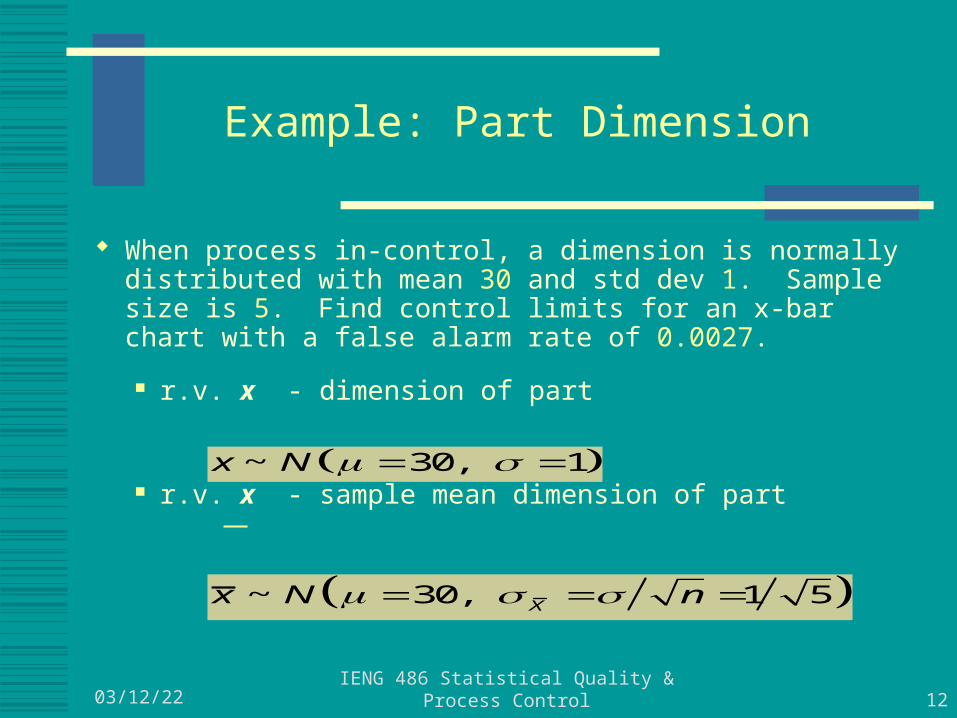
Example: Part Dimension
When process in-control, a dimension is normally distributed with mean 30 and std dev 1. Sample size is 5. Find control limits for an x-bar chart with a false alarm rate of 0.0027.
r.v. x - dimension of part
r.v. x - sample mean dimension of part ~ 30, 1x N
~ 30, 1 5Xx N n

04/19/23 IENG 486 Statistical Quality & Process Control 13
Distribution of
individual
measurements :
,
x
N
Distribution of
sample mean :
, x
x
N n
3 xUCL
3 xLCL
CL
Distribution of x vs. Distribution of x

04/19/23 IENG 486 Statistical Quality & Process Control 14
Ex. Part DimensionCont'd
Find UCL:
The control limits are:
2
0.00135UCL
P zn
2 2
1 0.00135 0.99865UCL
P z zn
2
3 3 3UCL
z UCL nn
0.0027 / 2 0.00135P x UCL
30CL
3 30 3 1 5 31.34UCL n
3 30 3 1 5 28.66LCL n
04/19/23 IENG 486 Statistical Quality & Process Control 15
Ex. Modified Part Limits
Consider an in-control process. A process measurement has mean 30 and std dev 1 and n = 5.
Design a control chart with prob. of false alarm = 0.005
If the control limits are not 3-Sigma, they are called "probability limits".