a bibliometric analysis of emergency management using ...web.hku.hk/~samchu/docs/du (in press) a...
TRANSCRIPT
Cited as: Du, H.S., Ke, X., Chu, S.K.W. & Chan, L.T. (in press). A bibliometric analysis of emergency management using information systems (2000-2016). Online Information Review.
A bibliometric analysis of emergency management using information systems
(2000-2016)
Helen S. Du and Xiaobo Ke
School of Management, Guangdong University of Technology, China
andInstitute of Big Data Strategic Research,
Guangdong University of Technology, China
Samuel K. W. Chu
Faculty of Education,The University of Hong Kong, Pokfulam, Hong Kong
Lok Ting Chan
Faculty of Arts,The University of Hong Kong, Pokfulam, Hong Kong
Abstract Purpose – This paper presents a statistical analysis of research into emergency management using information systems for the period 2000-2016. Design/methodology/approach – In this study, research trends in the area of emergency management using information systems are analysed using various parameters, including trends on publications and citations, disciplinary distribution, journals, research institutions and regional cooperation. Through a keyword co-occurrence analysis, this study identifies the evolution of the main keywords in this area, and examines the changes and developments in the main focus of scholars in this period. The study also explores the main research orientations in the field by analysing and integrating the results of two cluster analyses conducted from keyword- and reference-based perspectives, respectively.Findings – The area of emergency management using information systems have received increased attention and interest by researchers and practitioners. It is suggested that more cooperation between research institutions is required to help facilitate the further development of the area. Six main research orientations are identified: namely Web 2.0-enabled research,
/tt/file_convert/5a792ff27f8b9a9a188d0595/document.docx 03/05/2017 10:29 1
geographic information technology, information technology-based research, the contextual use of information technology, crisis collaboration research and mass media communication research, since the research area first became popular in 2006.Originality/value – This study is the first to comprehensively map the landscape of emergency management by conducting a bibliometric analysis of the research using information systems. Our findings can help academics and emergency managers gain a comprehensive understanding of the research area, and guide scholars towards producing more effective findings.Keywords Information systems, emergency management, bibliometric analysisPaper type Research paper
Introduction The recent increase in incidents and hazards (such as the 911 terrorist attack, the 2008 Wenchuan earthquake and the 2011 Fukushima nuclear accident) has caused severe social destruction and a huge loss of human life. This highlights the importance of addressing how our abilities to handle natural and manmade emergency situations can be improved. The field of emergency management (EM) has thus emerged to study how to cope with various crises and disasters, reduce and minimise the loss of lives and property, help governments and victims to recover from tragedies and reconstruct society to restart their lives after accidents (Waugh & Streib, 2006). Emergencies by nature require organisations and emergency managers to communicate and collaborate effectively. Hence, EM can refer to the capabilities of a person, a community or an institution in dealing with urgent situations in various EM phases (Dusse et al., 2016; Waugh & Streib, 2006). Under chaotic and unknown conditions, emergency managers must make informed and immediate decisions based on current information, and to engage citizens and local communities in joint efforts to prepare, respond and recover from emergency situations (Comfort et al., 2004; Fleischer, 2013; Manoj & Baker, 2007). In view of this, broad and sufficient information sources relating to the incident along with various information systems (IS) are crucial for emergency managers to accomplish their tasks and to achieve effective collaboration in emergency situations (Dusse et al., 2016; Yang et al., 2012).
Effective and efficient use of IS and related information technology (IT) is essential when dealing with unexpected emergency events (Chen et al., 2013; Van & Turoff, 2008). Hence, many emergency departments have adopted various advanced IS to improve their capabilities in EM (Engelbrecht et al., 2011; Sutcliffe et al., 2006). Correspondingly, EM using IS has received increasing attention from scholars, and the number of research papers published demonstrates this rapid development, as the potential for IS to enhance EM is realised (e.g., Hu & Kapucu, 2014; Han et al., 2015; Chou et al., 2014; Ling et al., 2015; Lu & Yang, 2011). Research into EM using IS is thus an expanding area, and systematic and comprehensive information is required for its further development and to help scholars understand the current status of the field (Peng et al., 2013). Dusse et al. (2016) mapped the landscape of virtualised IT for EM, providing insights for researchers and developers in EM systems. Leidig and Teeuw (2015) examined the characteristics of geographic information software used in a disaster context, providing insights for further studies. Garg and Kumar (2016) reviewed research on the role of social media in spreading information and attracting attention during emergency situations. However, these studies focused solely on one specific IT, and comprehensive research mapping the landscape of the research area
/tt/file_convert/5a792ff27f8b9a9a188d0595/document.docx 03/05/2017 10:29 2

is still lacking.
To bridge this gap, we conduct a bibliometric analysis of EM using IS to gain an extensive and comprehensive understanding of the area, strengthen the contributions of specific studies and enable scholars to extend the research (Akhavan et al., 2016). This study can therefore be of particular value to scholars and practitioners in the EM and IS fields. The specific research questions that examine the intellectual mapping of the area are as follows:
RQ1: What is the general state of the current research of EM using IS?RQ2: What are the popular keywords, and how have they evolved over time (2000-2016) in the research of EM using IS? RQ3: What are the main research orientations in the research of EM using IS?
In summary, by analysing a bibliometric dataset of 743 articles retrieved from the Web of Science (WoS) (apps.webofknowledge.com), this study offers a comprehensive overview of the current research landscape, discusses the main keywords and their evolution over time and provides six main research orientations as outcomes.
Research methodsBibliometric analysis refers to the combining of different frameworks, tools and methods to study and analyse the literature (Ponce & Lozano, 2010) and provides statistical analysis that summarises research publications. It allows researchers to generate quantitative information from large amounts of historical data, according to various descriptors and indicators (Gireesh & Gowda, 2008). Data and patterns within the bibliographic records of a network of scientific documents are mapped out with statistical and mathematical tools (Santos & Kobashi, 2009; De Bellis, 2009). The analysis in this study refers to the workflow proposed by Cobo et al. (2011a) and Heradio et al. (2016), which includes data retrieval, filtering and analysis.
Data retrieval Relevant articles for this research were gathered from the WoS platform, as this is the most authoritative of the scholarship databases, offering powerful features and covering a wide variety of subjects in various disciplines (Meho & Yang, 2007). The core collection database of WoS was chosen, as it gathers journals from the SCI-E, SSCI and A&HCI, ensuring that the articles retrieved are of high quality.
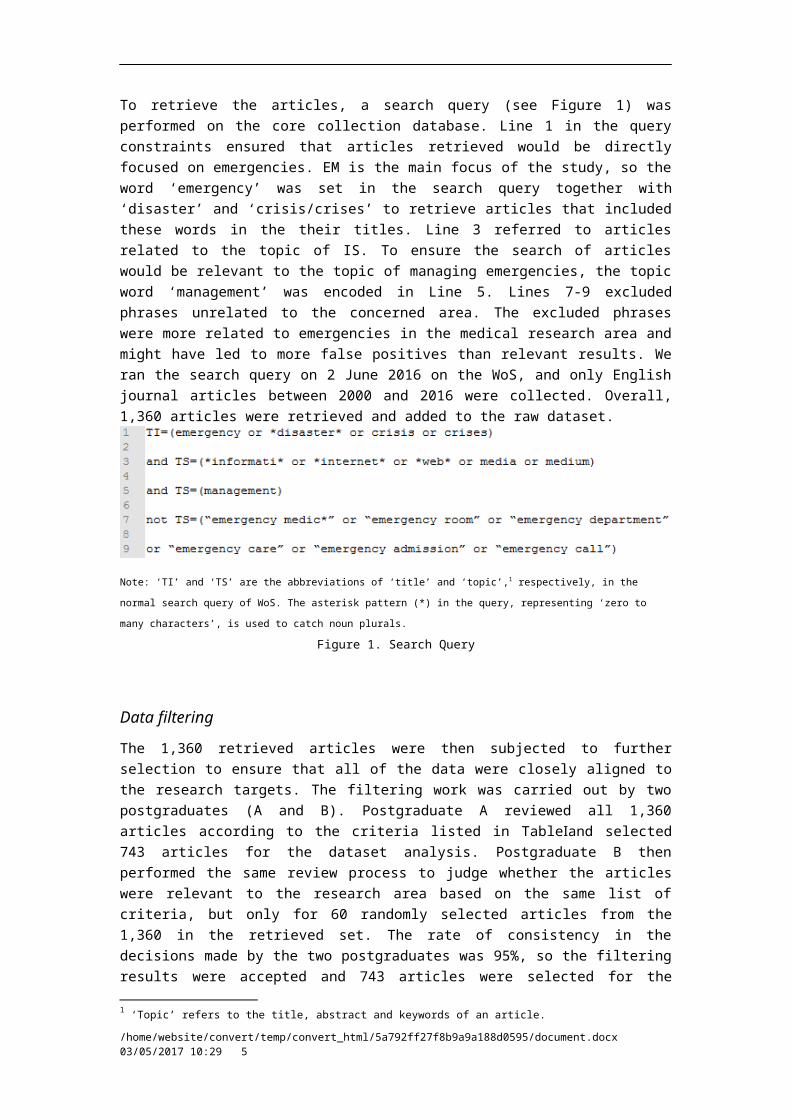
To retrieve the articles, a search query (see Figure 1) was performed on the core collection database. Line 1 in the query constraints ensured that articles retrieved would be directly focused on emergencies. EM is the main focus of the study, so the word ‘emergency’ was set in the search query together with ‘disaster’ and ‘crisis/crises’ to retrieve articles that included these words in the their titles. Line 3 referred to articles related to the topic of IS. To ensure the search of articles would be relevant to the topic of managing emergencies, the topic word ‘management’ was encoded in Line 5. Lines 7-9 excluded phrases unrelated to the concerned area. The excluded phrases were more related to emergencies in the medical research area and might have led to more false positives than relevant results. We ran the search query on 2 June 2016 on the WoS, and only
/tt/file_convert/5a792ff27f8b9a9a188d0595/document.docx 03/05/2017 10:29 3
English journal articles between 2000 and 2016 were collected. Overall, 1,360 articles were retrieved and added to the raw dataset.
Note: ‘TI’ and ‘TS’ are the abbreviations of ‘title’ and ‘topic’,1 respectively, in the normal search query of WoS. The asterisk pattern (*) in
the query, representing ‘zero to many characters’, is used to catch noun plurals.
Figure 1. Search Query
Data filteringThe 1,360 retrieved articles were then subjected to further selection to ensure that all of the data were closely aligned to the research targets. The filtering work was carried out by two postgraduates (A and B). Postgraduate A reviewed all 1,360 articles according to the criteria listed in Table and selected 743 articles for the dataset analysis. Postgraduate B then performed the sameⅠ review process to judge whether the articles were relevant to the research area based on the same list of criteria, but only for 60 randomly selected articles from the 1,360 in the retrieved set. The rate of consistency in the decisions made by the two postgraduates was 95%, so the filtering results were accepted and 743 articles were selected for the final dataset analysis.
Table I. Filtering Criteria
Inclusion
Criteria
I1 Information quality, trust and credibility aspects of EM
I2 Theory and practice of using IS in emergency decision management
I3 Novel techniques, methods and strategies in handling hazard-related IS
I4 Social, political and ethical aspects of using IS for EM
I5 The role and effect of IS in disaster-related situations
I6 Big data for EM
I7 E-education for EM
I8 Research method(s) employing IT
Exclusion
Criteria
E1 Study related to emergency medicine in the hospital
E2 Study focused on company crisis management
E3 Study focused on medical research
E4 Study with no abstract
Data analysis strategiesBibliometric analyses strategies can be divided into two categories. One category provides descriptive information on the statistical analysis relating to the effect and influence of the research efforts, and the other portrays the networks of links and cooperation between different components of the research articles (Ramos-Rodríguez & Ruíz-Navarro, 2004). The end results of the two categories of technologies offer insights and give a comprehensive picture of the research
1 ‘Topic’ refers to the title, abstract and keywords of an article.
/tt/file_convert/5a792ff27f8b9a9a188d0595/document.docx 03/05/2017 10:29 4
efforts and developments in the research area (Callon et al., 1993).
Based on the first category, a performance analysis was conducted to discover the overall research pattern and to quantify the effect of scientific actors in the research area of EM using IS to answer RQ1. The second analysis strategy was then conducted to answer RQ2. The emergence and evolution of popular keywords in the research field throughout the timespan was investigated, using keyword co-occurrence analysis. Two cluster analyses, including keyword- and reference-based analyses, were processed to generate candidate research orientations in the area. By further combining the results from the two cluster analyses, we classified six major research orientations to answer RQ3.
Data analysis toolsThree main bibliometric software tools were used to facilitate the data analysis processes: VOSviewer (www.vosviewer.com, Van Eck & Waltman, 2010), Bibexcel (www.umu.se/inforsk/Bibexcel, Persson et al., 2009) and CiteSpace (cluster.cis.drexel.edu/~cchen/citespace, Chen, 2006). VOSviewer is a tool specifically designed for constructing and visualising bibliometric maps (Cobo et al., 2011b) and specialises in graphical representation. It was used in this study for visualising the keyword co-occurrence analyses. Bibexcel performs strong pre-processing functions on bibliometric data and offers various export options for further analysis in other external software, such as SPSS (Cobo et al., 2011b). A keyword co-occurrence matrix was exported for analysis in SPSS to conduct the keyword-based cluster analysis. CiteSpace provides effective processing in detecting clusters based on references and allows for the visualisation of cluster results (Song et al., 2016; Chen, 2006); as such, it was used for geographical visualisation and reference-based cluster analysis.
Findings of performance analysisFrom the 743 articles, a comprehensive overview of the research into EM using IS is provided in this section, along with an identification of trends and patterns from five main perspectives: publications and citations, disciplinary distribution, journals, research institutions and regional cooperation.
Publications and citationsFigure 2 depicts the evolution of paper performance throughout the years 2000-2016. It shows (i) the number of papers published per year in the concerned research area and (ii) the number of citations those papers received. An increasing trend can be seen in the number of published papers and their citations over time, which reflects a growing interest in the topic of EM using IS.
We conduct an expectation and power curve fitting regression analysis of the trends of publications and citations. The trend of publications is more similar with the expectation curve (P<0.001, R2 = 0.959), while the trend of citations is more similar with the power curve (P<0.001, R2 = 0.910). The two regression formulas are displayed in Figure 2. Examining the increased rate, the curve representing the citations has a steeper slope than that of publications, suggesting that the number of citations per year increased at a faster rate than the number of publications over the past few years. In short, the increasing trend for both publications and citations shown in Figure 2
/tt/file_convert/5a792ff27f8b9a9a188d0595/document.docx 03/05/2017 10:29 5

reflects that the research area of EM using IS has enjoyed an increasing influence and effect over time.
Note: based on the formulas of these two trends, the projected number of publications and citations by the end of 2016 is 159 and 2306
respectively.
Figure 2. Numbers of Publications and Citations (2000-2016) in SCI-E/SSCI/A&HCI Databases
Disciplinary distributionThis subsection categorises papers according to their disciplines,2 and the 15 disciplines with the most number of papers are given in Figure 3. The figure shows that the discipline of Geosciences Multidisciplinary tops the list with the highest number of articles at over 100 publications, followed by Water Resources and Meteorology Atmospheric Sciences, all of which are related to the field of geology. The next three disciplines are Computer Science Information Systems, Computer Science Interdisciplinary Applications and Management, respectively. The figure shows that most articles belong to four main disciplines: geology, computer science, IS and management. These four disciplines have therefore contributed the most to the development of the research on EM using IS.
Figure 3. Distributions of Popularity Disciplines
2 With reference to WoS classifications, selected papers may belong to more than one discipline.
/tt/file_convert/5a792ff27f8b9a9a188d0595/document.docx 03/05/2017 10:29 6
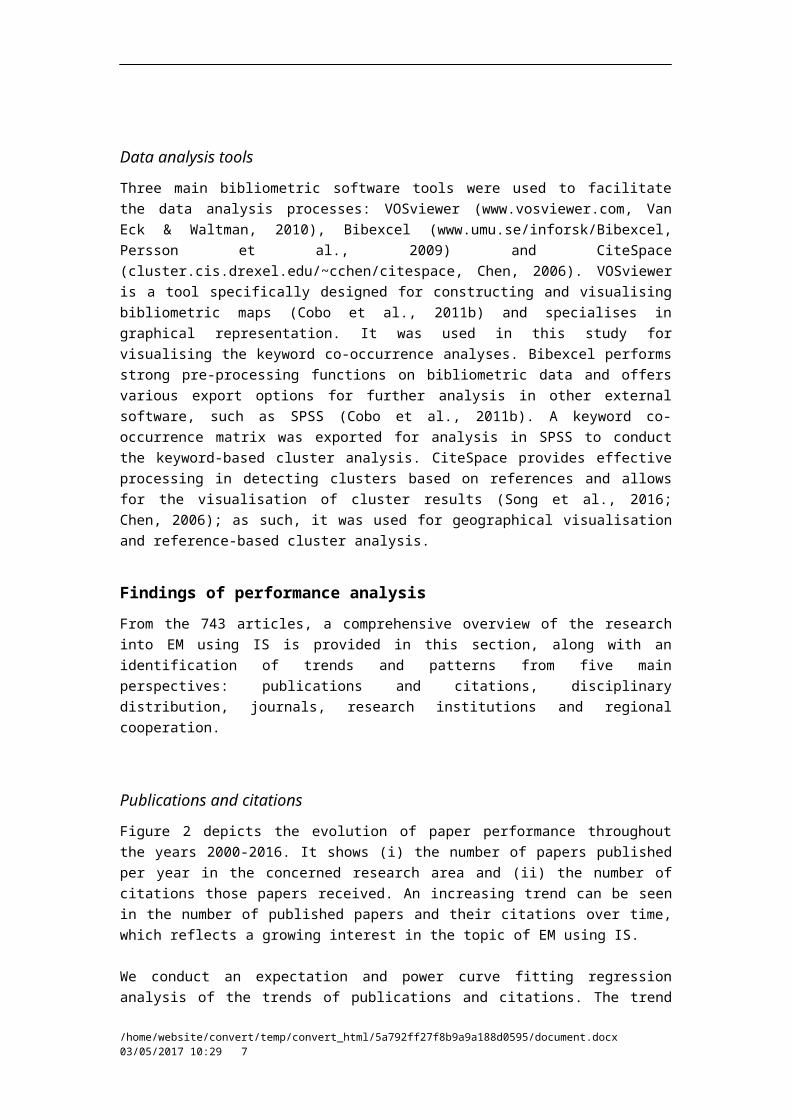
Highly cited journalsThe results of the most cited journals are listed in Table . The journals ‘Disasters’, ‘NaturalⅡ Hazards’ and ‘Communications of ACM’, with 114, 108 and 85 citations, respectively, received the highest number of citations from researchers. These journals are from the disciplines of geoscience, computer science, public management and mathematics. Regarding the 5-year impact factor (IF) in 2015 and the IF without self-citation, most journals on the list have an index of over 1.00. To further enhance the credibility of the journal quality measure, the H-index is included for consideration, which Martinez et al. (2014) proposed adapting to support the analysis of citation classics. The H-index can be explained as follows: ‘a research area has index h if h of the n papers published in the area have at least h citations each and the other (n-h) papers have ≤ h citations each’. The H-index is an important indicator in assessing the quality of journals and the influence of authors. Table II illustrates that the H-index of most journals is over 40. Hence, most of the studies cite journals of high quality and ranking, and the influence of these studies has gradually attracted the attention of an increasing number of researchers.
Table . Highly Cited Journal DistributionⅡ
Rank* Citations Publications Journal5-year IF
(2015)
IF without
self-citation
H-
index
1 114 17 Disasters 1.407 1.040 41
2 108 33 Natural Hazards 2.054 1.373 60
3 85 2 Communications of the ACM 4.425 3.115 57
4 80 1 Public Administration Review 2.707 1.876 97
5 65 7 Decision Support System 3.271 2.300 75
6 63 18 Disaster Prevention and Management 0.855 1.010 10
7 62 0 Science 34.921 34.212 1133
7 62 5 Journal of Contingencies and Crisis Management N/A 0.878 7
9 59 4 European Journal of Operational Research 2.139 3.109 156
10 52 4 Natural Hazards Review 1.172 1.586 14
Note: *: ranked by citations.
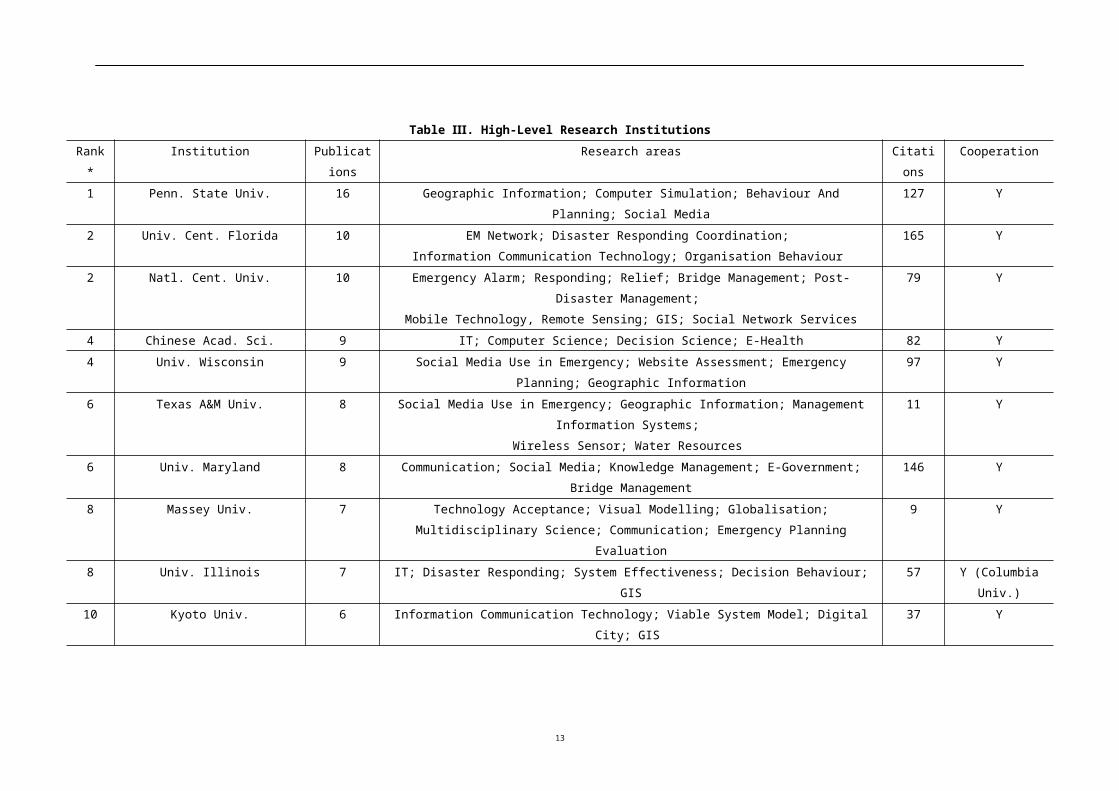
Productive research institutions and their cooperation From our institution samples, Pennsylvania State University, with 16 published articles, is the most productive research institution. The university has published studies on aspects from both a technical perspective (e.g., geographic information computing, computer stimulation) and an empirical perspective (e.g., behaviour and planning, use of social media). The University of Central Florida and the National Central University are jointly second on the list, with 10 published articles each. Of the top 10 most productive institutions, 7 are from the US, 4 from Asia, 2 from Europe and 2 from Oceania. Researchers from the US and Asia thus have the highest levels of interest in the research area of EM using IS.
Table shows that all productive research institutions cooperate with other institutions.Ⅲ However, cooperation between the most highly productive institutions is very limited, and is only found between the University of Illinois and Columbia University.
/tt/file_convert/5a792ff27f8b9a9a188d0595/document.docx 03/05/2017 10:29 7

Figure 4 depicts the cooperation network of research institutions, and provides an overview of the relationship among institutions. The results in the diagram correspond to those listed in Table .Ⅲ Figure 4 shows that the overall cooperation network among these institutions is relatively loose. A more established network can be found among the University of Illinois, Columbia University and University of Maryland than for other networks in the figure. Complex and multiple research networks are, however, still lacking. The cooperation between different research institutions is believed to be highly effective in facilitating high-level and fruitful research, which can also help develop the research field into a more established area. These research institutions should therefore engage in tighter cooperative relationships with more institutions on different topics and research questions in the field of EM using IS.
Note: the nodes represent institutions and the lines refer to the linkage across institutions.
Figure 4. The Cooperation Network of Research Institutions
Regional cooperation The development and cooperation of countries/districts is analysed to identify the geographical connections between researchers. Figure 5 presents a geographic visualisation of scholar/institution cooperation between countries and districts. The left diagram portrays countries and districts in Asia and Australia and the right shows those in North America, Europe, South America and Africa. Cooperation of scholars/institutions is mainly found in America and Europe, where numbers of publications and citations are also significantly higher. In comparison, China and Australia show relatively less frequent cooperation with other countries or districts worldwide.
/tt/file_convert/5a792ff27f8b9a9a188d0595/document.docx 03/05/2017 10:29 8

Note: the nodes represent the locations of scholars/institutions and the lines refer to the linkages across scholars/institutions.
Figure 5. Geographic Visualisation of Cooperation Relationships
/tt/file_convert/5a792ff27f8b9a9a188d0595/document.docx 03/05/2017 10:29 9
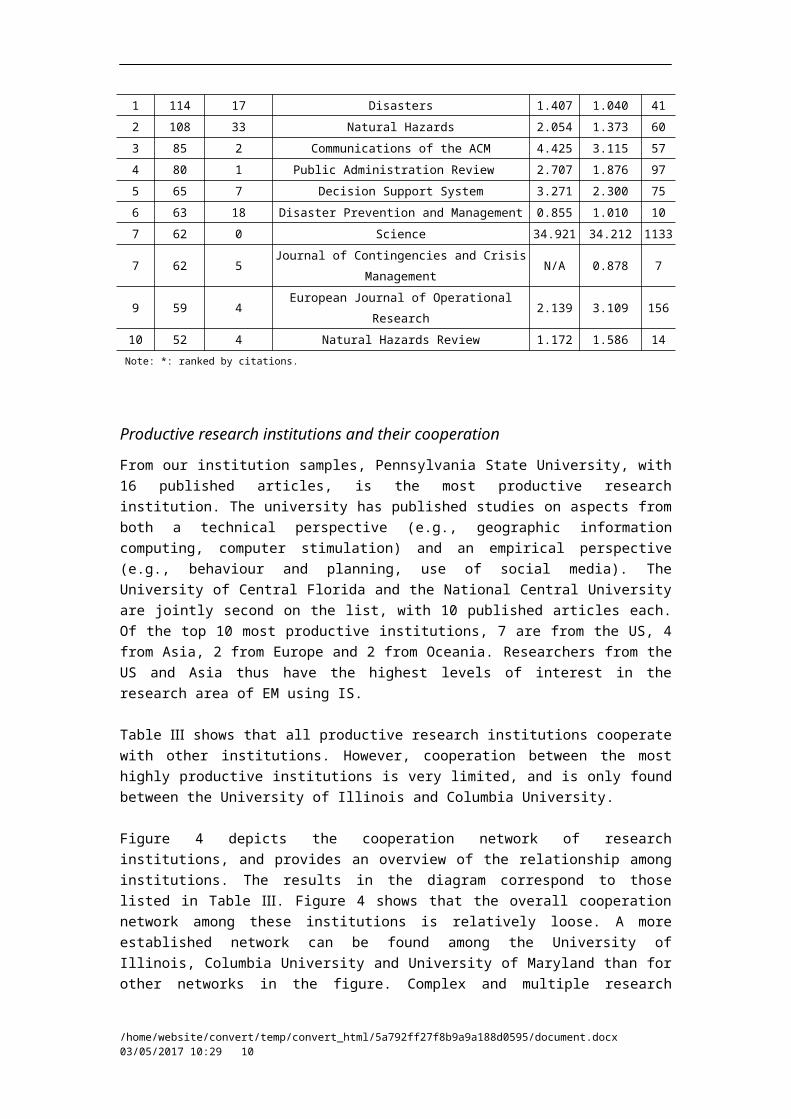
Table . High-Level Research InstitutionsⅢRank* Institution Publications Research areas Citations Cooperation
1 Penn. State Univ. 16 Geographic Information; Computer Simulation; Behaviour And Planning; Social Media 127 Y
2 Univ. Cent. Florida 10 EM Network; Disaster Responding Coordination;
Information Communication Technology; Organisation Behaviour
165 Y
2 Natl. Cent. Univ. 10 Emergency Alarm; Responding; Relief; Bridge Management; Post-Disaster Management;
Mobile Technology, Remote Sensing; GIS; Social Network Services
79 Y
4 Chinese Acad. Sci. 9 IT; Computer Science; Decision Science; E-Health 82 Y
4 Univ. Wisconsin 9 Social Media Use in Emergency; Website Assessment; Emergency Planning; Geographic Information 97 Y
6 Texas A&M Univ. 8 Social Media Use in Emergency; Geographic Information; Management Information Systems;
Wireless Sensor; Water Resources
11 Y
6 Univ. Maryland 8 Communication; Social Media; Knowledge Management; E-Government; Bridge Management 146 Y
8 Massey Univ. 7 Technology Acceptance; Visual Modelling; Globalisation; Multidisciplinary Science;
Communication; Emergency Planning Evaluation
9 Y
8 Univ. Illinois 7 IT; Disaster Responding; System Effectiveness; Decision Behaviour; GIS 57 Y (Columbia
Univ.)
10 Kyoto Univ. 6 Information Communication Technology; Viable System Model; Digital City; GIS 37 Y
10 NE Normal Univ. 6 Fuzzy Theory; Dynamic Risk; Risk Assessment; GIS 37 Y
10 Lund Univ. 6 Emergency Relief; Decision Making Behaviour; System Application; Web Application 10 Y
10 Commiss. European Communities 6 System Technology; Remote Sensing; Risk Assessment; Knowledge Management; Digital Earth 37 Y
10 Columbia Univ. 6 Disaster Responding and Recovery; Mobile Technology; Social Network; Information Management 44 Y( Univ. Illinois)
10 Univ. Melbourne 6 Information Computing; 3D Technology; Web Application; User Behaviour 64 Y
Note: *: ranked by publications. ‘Y’ represents that the institution has cooperated with other institutions that are not on the list, while cooperation between institutions on the list is included in brackets.
10

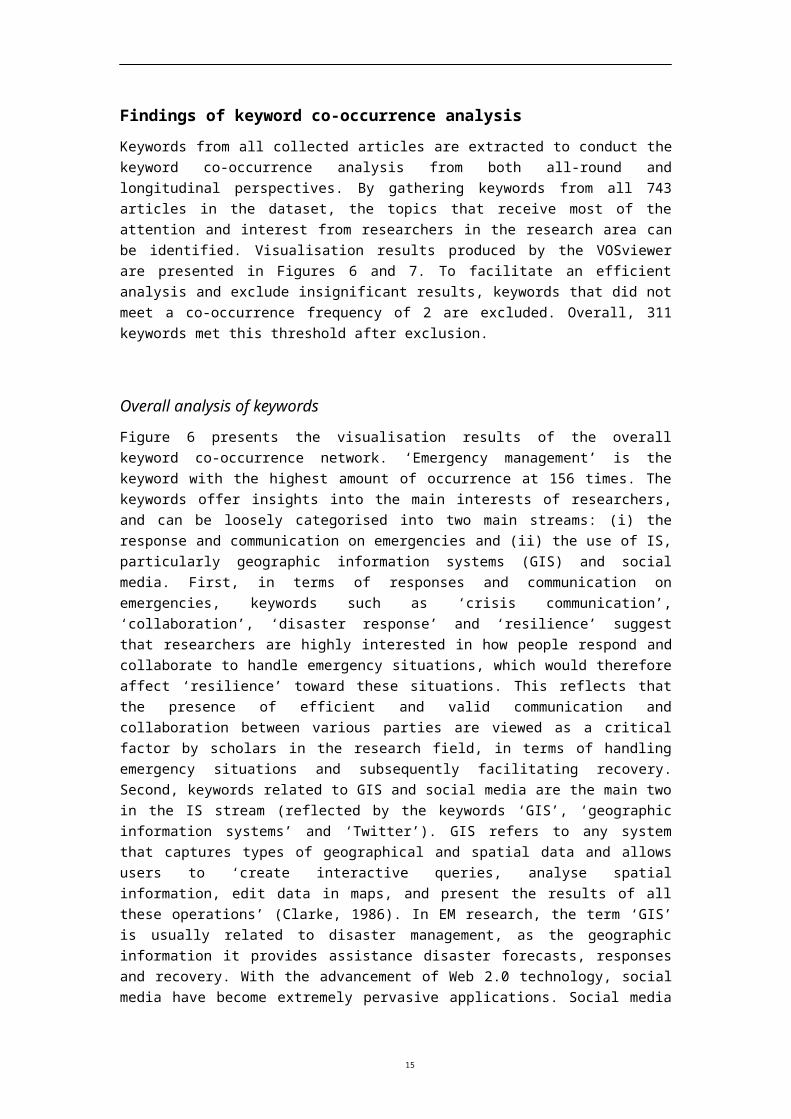
Findings of keyword co-occurrence analysisKeywords from all collected articles are extracted to conduct the keyword co-occurrence analysis from both all-round and longitudinal perspectives. By gathering keywords from all 743 articles in the dataset, the topics that receive most of the attention and interest from researchers in the research area can be identified. Visualisation results produced by the VOSviewer are presented in Figures 6 and 7. To facilitate an efficient analysis and exclude insignificant results, keywords that did not meet a co-occurrence frequency of 2 are excluded. Overall, 311 keywords met this threshold after exclusion.
Overall analysis of keywordsFigure 6 presents the visualisation results of the overall keyword co-occurrence network. ‘Emergency management’ is the keyword with the highest amount of occurrence at 156 times. The keywords offer insights into the main interests of researchers, and can be loosely categorised into two main streams: (i) the response and communication on emergencies and (ii) the use of IS, particularly geographic information systems (GIS) and social media. First, in terms of responses and communication on emergencies, keywords such as ‘crisis communication’, ‘collaboration’, ‘disaster response’ and ‘resilience’ suggest that researchers are highly interested in how people respond and collaborate to handle emergency situations, which would therefore affect ‘resilience’ toward these situations. This reflects that the presence of efficient and valid communication and collaboration between various parties are viewed as a critical factor by scholars in the research field, in terms of handling emergency situations and subsequently facilitating recovery. Second, keywords related to GIS and social media are the main two in the IS stream (reflected by the keywords ‘GIS’, ‘geographic information systems’ and ‘Twitter’). GIS refers to any system that captures types of geographical and spatial data and allows users to ‘create interactive queries, analyse spatial information, edit data in maps, and present the results of all these operations’ (Clarke, 1986). In EM research, the term ‘GIS’ is usually related to disaster management, as the geographic information it provides assistance disaster forecasts, responses and recovery. With the advancement of Web 2.0 technology, social media have become extremely pervasive applications. Social media are significant in that they allow users to generate and share content on the Internet. User-generated content (UGC) is a primary channel enabling anyone to find out about events in different parts of the world. Social media also serve as an important channel for governments, assisting them in releasing timely information about emergency situations to the public.
The lower panel of Figure 6 offers an alternative perspective of keyword co-occurrences using a thermodynamic diagram. The darker areas represent keywords that have received more attention from researchers, while the lighter shades are those that are comparatively less popular. Briefly, most researchers appear to be interested in studies of GIS- and social-media-related IT for communication and collaboration in EM. This is particularly apparent in the areas of emergency response and recovery.
11
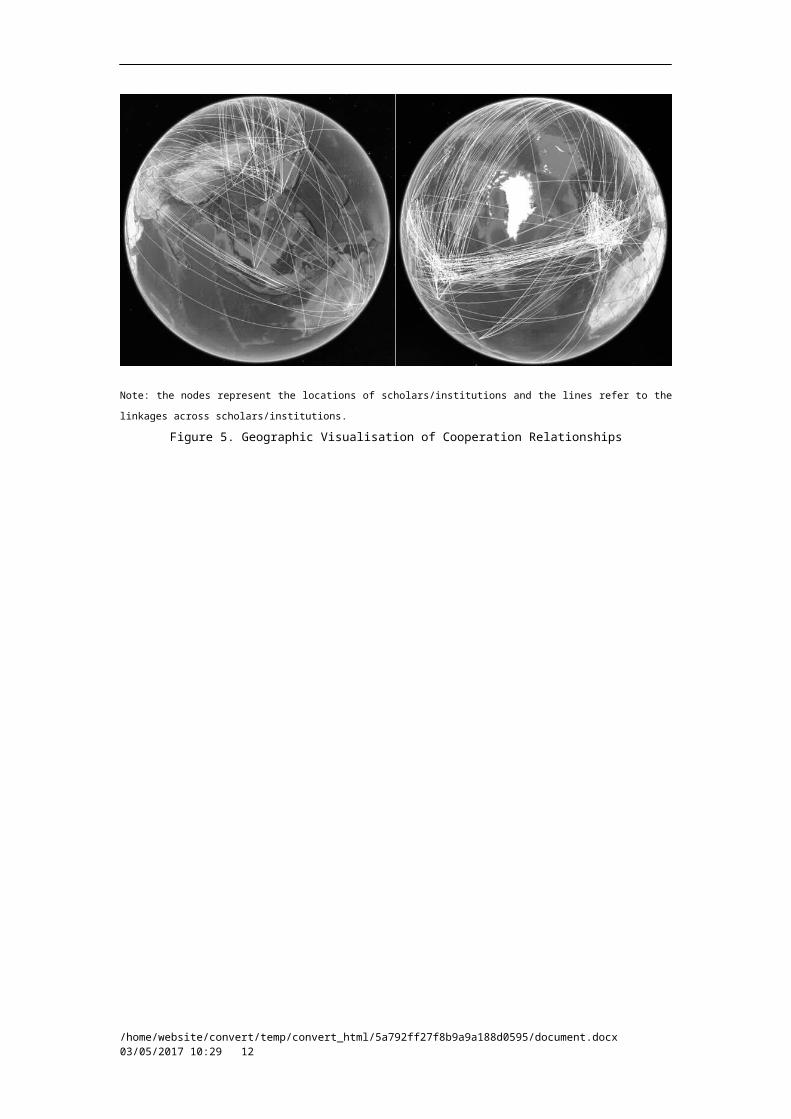
Figure 6. Keyword Co-Occurrence Analysis
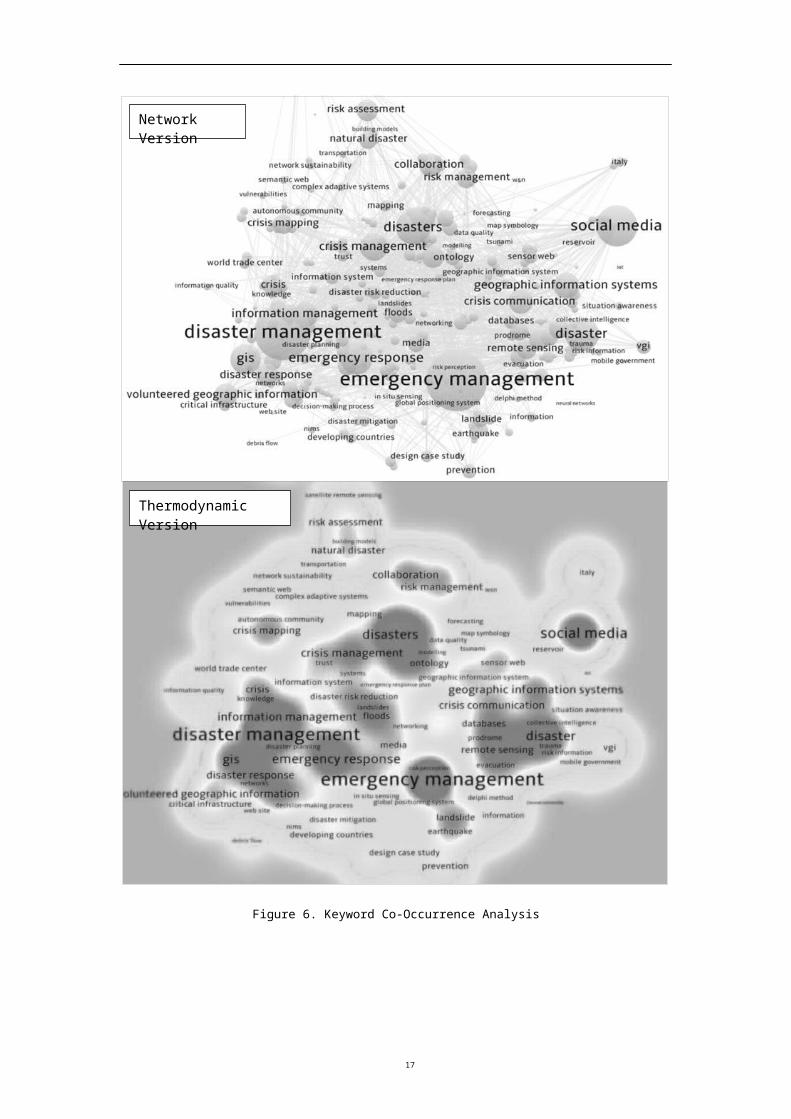
Longitudinal analysis of keywordsTo investigate the evolution of keyword relationships, the period 2000-2016 is divided into three stages for another round of co-word analysis, including 2000~2005, 2006~2011 and 2012~2016,
12
Thermodynamic Version
Network Version
respectively. The results are presented in Figure 7. In the first stage, when there is less research on EM using IS, few connections between keywords can be seen, and they are rather dispersed. Since the 9/11 terrorist attack in 2001, the keywords ‘World Trade Center’ have appeared in the first stage. Research conducted during this stage was mainly focused and motivated by the occurrence of this attack. As the diagrams show, the research field began to flourish after 2006. In the second stage (2006~2011), there was significant growth in the number of keywords and their relationships and links from the levels before 2006. The top 5 keywords of stage 2 are ‘disaster management’, ‘emergency management’, ‘crisis management’, ‘emergency response’ and ‘GIS’. For the third stage of 2012~2016, the research area was further developed, and both the relationships between keywords and the number of keywords show a clear increase. The top five keywords in the stage 2012~2016 are ‘emergency management’, ‘disaster management’, ‘social media’, ‘emergency response’ and ‘crisis management’. These largely correspond with the list of keywords in the results of the overall co-word analysis (see the section on overall analysis of keywords). The research interests in the stage 2012~2016 thus set the main trend of the overall research area. Although the keyword ‘social media’ emerges in the second stage of 2005~2011, it becomes a hot topic in the third stage of 2012~2016. This is in parallel with the development of Web 2.0, suggesting that EM has taken advantage of the development of popular IT and is applying it in research and practice.
Figure 7. Keyword Co-Occurrence in 2000-2005, 2006-2011 and 2012-2016
13
2000~2005
2006~2011 2012~2016

Cluster analysis of major research orientationsThe technique of cluster analysis is widely applied to ascertain the research orientations of a particular field (Peng et al., 2013). Cluster analysis can be conducted on various elements of bibliometric data, such as keywords and references in the retrieved articles set. In this study, two cluster analyses, including keyword- and reference-based analyses, are conducted. The keywords and references quoted in all 743 articles are selected as the analysis materials. The results of the two analyses are then combined for further interpretation to confirm the final research orientations. Detailed cluster results are presented in the Supplementary File.
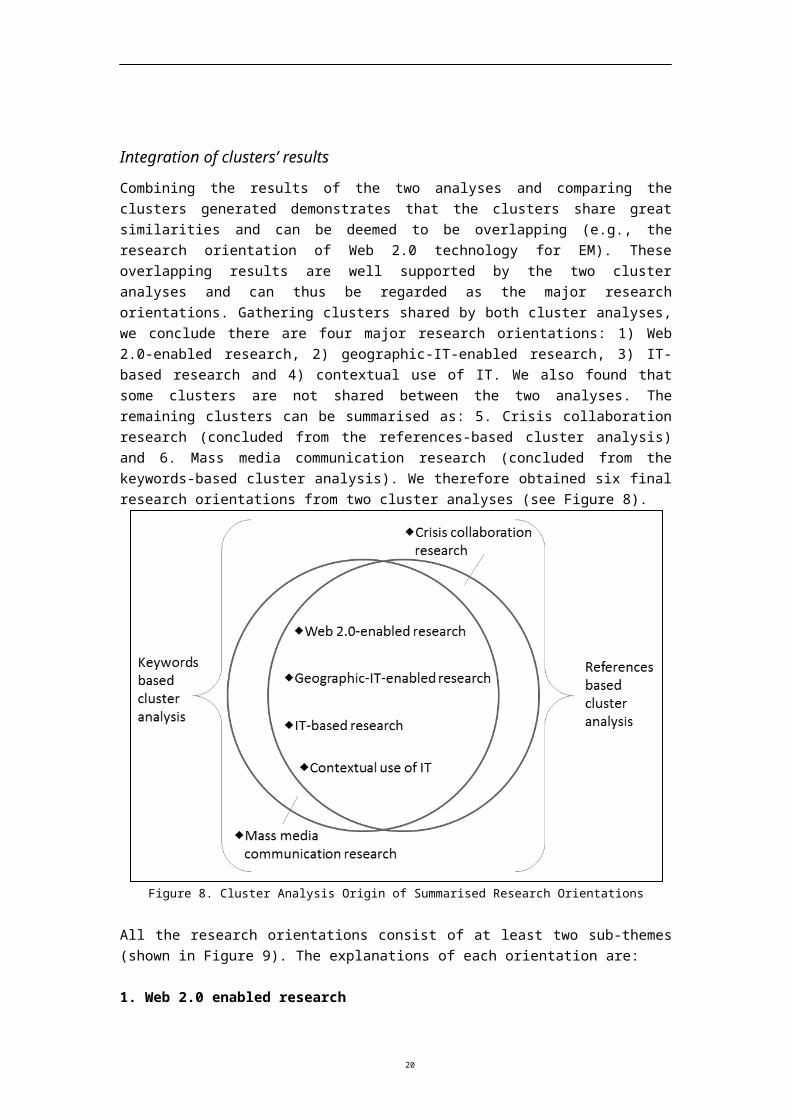
Integration of clusters’ results Combining the results of the two analyses and comparing the clusters generated demonstrates that the clusters share great similarities and can be deemed to be overlapping (e.g., the research orientation of Web 2.0 technology for EM). These overlapping results are well supported by the two cluster analyses and can thus be regarded as the major research orientations. Gathering clusters shared by both cluster analyses, we conclude there are four major research orientations: 1) Web 2.0-enabled research, 2) geographic-IT-enabled research, 3) IT-based research and 4) contextual use of IT. We also found that some clusters are not shared between the two analyses. The remaining clusters can be summarised as: 5. Crisis collaboration research (concluded from the references-based cluster analysis) and 6. Mass media communication research (concluded from the keywords-based cluster analysis). We therefore obtained six final research orientations from two cluster analyses (see Figure 8).
Figure 8. Cluster Analysis Origin of Summarised Research Orientations
All the research orientations consist of at least two sub-themes (shown in Figure 9). The explanations of each orientation are:
14
1. Web 2.0 enabled research This research orientation focuses on the use of Web 2.0 technology and social media platforms during emergency situations (e.g., voluntary sharing of geographic information on social media platforms). The topics of e-government and crisis crowdsourcing are also included in this orientation, as they discuss the involvement and capabilities of both the government and the general public during EM. Four sub-themes from the keywords based and references based cluster analyses are included here: ‘social media use in the EM’ (e.g., Yates & Paquette, 2011), ‘volunteer geographic information use and social media’ (e.g., Haworth, 2016), ‘e-government and social media’ (e.g., Jaeger et al., 2007), and ‘crisis crowdsourcing’ (e.g., Goodchild & Glennon, 2010).
2. Geographic-IT-enabled research This research orientation centres on the topics of geographic IT used in disaster management, emergency preparedness and risk assessment. Sub-themes in this orientation are: ‘information facilitating city intelligence’ (e.g., Monares et al., 2011), ‘the use of satellite and virtualization systems’ (e.g., Voigt et al., 2007), ‘GIS for EM’ (e.g., Tsai et al., 2008) and ‘sensor web for EM’ (e.g., Kussul et al., 2014).
3. IT-based researchThis research orientation comprises essential topics on the use of IT in EM. For example, improving the algorithm of decision support systems for efficient decision making in emergency situations is a main concern in this research. Three sub-themes are included: ‘decision support systems’ (e.g., Yu & Lai, 2011), ‘emerging IT’ (e.g., Kim et al., 2016) and ‘network sustainability and information communication technology’ (e.g., Moynihan, 2008).
4. Contextual use of IT This research orientation focuses on the use of IT in an EM institution or agency (e.g., a public health department). The orientation includes two sub-themes: ‘IT for public health in disaster’ (e.g., Devita et al., 2005) and ‘IT for local department’ (e.g., Zheng et al., 2010).
5. Crisis collaboration research This research orientation emphasises the importance of communication and information exchange for collaborative management in emergency situations. The sub-themes identified from the cluster analysis are: ‘multi-agency management’ (e.g., Bharosa et al., 2010), ‘information for emergency response’ (e.g., Manno et al., 2015), ‘interagency communication’ (e.g., Kapucu, 2006) and ‘information sharing within responder organizations’ (e.g., Ginige et al., 2014).
15

6. Mass media communication researchThe role and power of the mass media in disseminating emergency information to the public is emphasised in this research orientation (e.g., Barnes et al., 2008). The ‘state-media relationship’ is another main concern of this research orientation (e.g., Chen, 2008).
Figure 9. Research Orientations
Matching test To investigate whether the six orientations are indicative of the major research interests, we extract articles from the dataset and match them to the orientations. The calculated H-index of the dataset from the 743 articles is 29. We therefore select the 29 most-cited articles (‘H core articles’) to match them with the research orientations proposed earlier. As Table IV shows (see the Supplementary File), the ‘Web 2.0-enabled research’ orientation can match 4 H core articles with 344 citations. The ‘geographic-IT-enabled research’ orientation matches 12 H core articles with 553 citations. The ‘IT-based research’ orientation matches 5 H core articles with 241 citations. The ‘contextual use of IT’ orientation matches 4 H core articles with 296 citations. The ‘crisis collaboration research’ orientation matches 3 H core articles with 152 citations. The final orientation, ‘mass media communication research’, matches 2 H core articles with 60 citations. These results show that the ‘geographic-IT-enabled research’ orientation enjoys the most attention from scholars, followed by the ‘Web 2.0-enabled research’ orientation and the ‘contextual use of IT’ orientation. These top three research orientations focus on the use of specific types of technology or the contextual use of technology in EM. Based on these findings, we suggest that applied specialised technologies and the highly contextual use of technologies in emergency situations have the greatest appeal to researchers.
16
DiscussionIn the ‘Performance Analysis’ section, a series of analyses is conducted to offer an overview of the current landscape of the research area in EM using IS from various angles to identify the current state of the research field (RQ1). These results help to identify the main trends in the research field, and indicate that it is enjoying growing interest and development, with a high level of growth in the number of publications and citations. Furthermore, four main disciplines, including geology, computer science, IS and management, respectively, are found to contribute the most to the field of EM using IS. However, the results also reveal a limited cooperation between research institutions. Although some high-level research institutions cooperate with other institutions, collaborations between these institutions are rare. The research area is also most well established in developed countries, and research institutions should further involve developing countries, offer expertise in the research area and address emergency situations through joint efforts.
To provide an overview of the development of the keywords (RQ2), a keyword co-occurrence analysis is conducted and the results are presented in visualisation diagrams. Based on the visualisation results, the most popular keywords in the research area can be identified. The longitudinal analysis reveals that an apparent link between keywords first appeared during the period 2006-2012, suggesting that the research field of EM using IS first emerged at the beginning of 2006. The research area is thus a relatively new field that is undergoing continual development and evolution.
Finally, two cluster analyses from keyword- and reference-based perspectives are conducted and the results integrated to identify the major research orientations (RQ3). The results of the two types of cluster analysis are integrated and reconfigured to generate six major orientations in the current research: Web 2.0-enabled research, geographic-IT-enabled research, IT-based research, contextual use of IT, crisis collaboration research and mass media communication research. A match test is then conducted on the dataset using the H core articles. All of the articles can be classified into a corresponding research orientation, which indicates that these six research orientations cover all of the most popular and significant topics of the papers in the research area. In addition, some research papers can be classified into two or more research orientations, such as the research conducted by Mansourian et al. (2006) on the development and implementation of Web-based geographic information (geographic-IT-enabled research) and the spatial-data-based information systems (IT-based research). These articles indicate that the research orientations are related to one another instead of mutually exclusive. However, the research orientations defined by this study are temporal, as the landscape of the research area of EM using IS is rapidly changing and evolving. Our findings on research orientations do offer useful insights to scholars, helping them to understand the current research landscape of the field. Based on these findings, scholars can develop new research ideas and produce cutting edge research output.
LimitationsIn this study, a bibliometric analysis was conducted on the research involving both EM and IS areas. Before summarising this analysis, some limitations and suggested improvements should first be acknowledged. First, the objective of this research is to explore the relevant research of
17
EM using IS as a whole, rather than focusing on specific theories (e.g., Di Stefano et al., 2010) or technology (e.g., Dusse et al., 2016), so the dataset used for analysis does not cover all related articles. Therefore, in the ‘Data Retrieval’ section, the process of data filtering is implemented to enhance the relevance of the data. Other data retrieval approaches can be considered in the future to improve data quality and thus the analysis results. Second, the bibliometric data in this study were collected from only one source (WoS), so the exclusion of other academic research databases in the collection process may influence the representativeness of the data. Hence, it is suggested that more academic research databases be integrated so more comprehensive data can be collected, thus avoiding possible data bias. Third, although extensive analyses are carried out on the research area, other bibliometric analysis techniques, such as multidimensional scaling analysis, are not conducted. Other analysis technologies can be applied in future studies to acquire findings from a more comprehensive perspective.
ConclusionTo summarise, in this study, an analysis of the current research landscape in the area of EM using IS is first conducted by identifying different trends and patterns in publications and citations. Further analysis of the keywords within the research area is then conducted to investigate popular keywords and their evolution over time. The links between keywords suggest that EM using IS research emerged in 2006. A keyword- and reference-based cluster analysis is then conducted to examine the major research orientations, and six are finally identified. The findings from the analysis thus reveal the mapping of the research on EM using IS, and offer an extensive overview for scholars, enabling them to conduct further studies.
AcknowledgementsThis research was supported by the National Natural Science Foundation of China under Grant No. 71572050, 71571052.
Supplementary File
18
ReferencesAkhavan, P., Ebrahim, N. A., Fetrati, M. A., & Pezeshkan, A. (2016). Major trends in
knowledge management research: A bibliometric study. Scientometrics, 107(3), 1249-1264.
Barnes, M. D., Hanson, C. L., Novilla, L. M., Meacham, A. T., Mcintyre, E., & Erickson, B. C. (2008). Analysis of media agenda setting during and after Hurricane Katrina: Implications for emergency preparedness, disaster response, and disaster policy. American Journal of Public Health, 98(4), 604-610.
Bharosa, N., Lee, J. K., & Janssen, M. (2010). Challenges and obstacles in sharing and coordinating information during multi-agency disaster response: Propositions from field exercises. Information Systems Frontiers, 12(1), 49-65.
Callon, M., Courtial, J. P., & Penan, H. (1993). Cienciometrıa. La medición de la actividad cientıfica: de la bibliometrıa a la vigilancia tecnológica. Ediciones Trea: Gijón, Spain.
Chen, C. (2006). CiteSpace II: Detecting and visualizing emerging trends and transient patterns in scientific literature. Journal of the American Society for Information Science and Technology, 57(3), 359-377.
Chen, L. (2008). Open information system and crisis communication in China. Chinese Journal of Communication, 1(1), 38-54.
Chen, R., Sharman, R., Rao, H. R., & Upadhyaya, S. J. (2013). Data model development for fire related extreme events: An activity theory approach. MIS Quarterly, 37(1), 125-147.
Chou, C. H., Zahedi, F. M., & Zhao, H. (2014). Ontology-based evaluation of natural disaster management websites: A multistakeholder perspective. MIS Quarterly, 38(4), 997-1016.
Clarke, K. C. (1986). Advances in geographic information systems. Computers, Environment and Urban Systems, 10,175-184.fma
Cobo, M. J., López-Herrera, A. G., Herrera-Viedma, E., & Herrera, F. (2011a). An approach for detecting, quantifying, and visualizing the evolution of a research field: A practical application to the fuzzy sets theory field. Journal of Informetrics, 5(1), 146-166.
Cobo, M. J., López-Herrera, A. G., Herrera-Viedma, E., & Herrera, F. (2011b). Science mapping software tools: Review, analysis, and cooperative study among tools. Journal of the American Society for Information Science & Technology, 62(7), 1382-1402.
Comfort, L. K., Ko, K., & Zagorecki, A. (2004). Coordination in rapidly evolving disaster response systems the role of information. American Behavioral Scientist, 48(3), 295-313.
De Bellis, N. (2009). Bibliometrics and citation analysis: From the science citation index to cybermetrics. Scarecrow Press.
Devita, M. A., Schaefer, J., Lutz, J., Wang, H., & Dongilli, T. (2005). Improving medical emergency team (MET) performance using a novel curriculum and a computerized human patient simulator. Quality & Safety in Health Care, 14(5), 326-331.
Di Stefano, G., Peteraf, M., & Verona, G. (2010). Dynamic capabilities deconstructed: A bibliographic investigation into the origins, development, and future directions of the research domain. Industrial and Corporate Change, dtq027.
Dusse, F., Júnior, P. S., Alves, A. T., Novais, R., Vieira, V., & Mendonça, M. (2016). Information visualization for emergency management: A systematic mapping study. Expert Systems with Applications, 45, 424-437. doi:10.1016/j.eswa.2015.10.007
19
Engelbrecht, A., Borges, M. R., & Vivacqua, A. S. (2011, June). Digital tabletops for situational awareness in emergency situations. In Computer Supported Cooperative Work in Design (CSCWD), 2011 15th International Conference on (pp. 669-676). IEEE.
Fleischer, J. (2013). Time and crisis. Public Management Review, 15(3), 313-329.Garg, M., & Kumar, M. (2016). Review on event detection techniques in social multimedia.
Online Information Review, 40(3).Ginige, A., Paolino, L., Romano, M., Sebillo, M., Tortora, G., & Vitiello, G. (2014).
Information sharing among disaster responders - An interactive spreadsheet-based collaboration approach. Computer Supported Cooperative Work (CSCW), 23(4), 547-583.
Gireesh, A. G., & Gowda, M. P. (2008). ACM transactions on information systems (1989-2006): A bibliometric study. Information Studies, 14(4), 223-234.
Goodchild, M. F., & Glennon, J. A. (2010). Crowdsourcing geographic information for disaster response: A research frontier. International Journal of Digital Earth, 3(3), 231-241.
Han, W., Ada, S., Sharman, R., & Rao, H. R. (2015). Campus emergency notification systems: An examination of factors affecting compliance with alerts. MIS Quarterly, 39(4), 909-929.
Haworth, B. (2016). Emergency management perspectives on volunteered geographic information: Opportunities, challenges and change. Computers, Environment and Urban Systems, 57, 189-198.
Heradio, R., de la Torre, L., Galan, D., Cabrerizo, F. J., Herrera-Viedma, E., & Dormido, S. (2016). Virtual and remote labs in education: A bibliometric analysis. Computers & Education, 98, 14-38.
Hu, Q., & Kapucu, N. (2014). Information communication technology utilization for effective emergency management networks. Public Management Review, 18(3), 323-348. doi:10.1080/14719037.2014.969762
Jaeger, P. T., Shneiderman, B., Fleischmann, K. R., Preece, J., Qu, Y., & Wu, P. F. (2007). Community response grids: E-government, social networks, and effective emergency management. Telecommunications Policy, 31(10), 592-604.
Kapucu, N. (2006). Interagency communication networks during emergencies boundary spanners in multiagency coordination. American Review of Public Administration, 36(36), 207-225.
Kim, J. C., Jung, H., Kim, S., & Chung, K. (2016). Slope based intelligent 3D disaster simulation using physics engine. Wireless Personal Communications, 86(1), 183-199.
Kussul, N., Skakun, S., Shelestov, A. Y., Kussul, O., & Yailymov, B. (2014). Resilience aspects in the sensor Web infrastructure for natural disaster monitoring and risk assessment based on Earth observation data. IEEE Journal of Selected Topics in Applied Earth Observations and Remote Sensing, 7(9), 3826-3832.
Leidig, M., & Teeuw, R. (2015). Free software: A review, in the context of disaster management. International Journal of Applied Earth Observation and Geoinformation, 42, 49-56.
Ling, C. L. M., Pan, S. L., Ractham, P., & Kaewkitipong, L. (2015). ICT-enabled community empowerment in crisis response: Social media in Thailand flooding 2011. Journal of the Association for Information Systems, 16(3), 174-212.
20
Lu, Y., & Yang, D. (2011). Information exchange in virtual communities under extreme disaster conditions. Decision Support Systems, 50(2), 529-538.
Manno, G., Smari, W. W., Spalazzi, L., & Taccari, G. (2015). A semantic-based federated cloud system for emergency response. Concurrency and Computation: Practice and Experience, 27(13), 3316-3344.
Manoj, B. S., & Baker, A. H. (2007). Communication challenges in emergency response. Communications of the ACM, 50(3), 51-53.
Mansourian, A., Rajabifard, A., Zoej, M. J. V., & Williamson, I. (2006). Using SDI and Web-based system to facilitate disaster management. Computers & Geosciences, 32(3), 303-315.
Martínez, M. A., Herrera, M., López-Gijón, J., & Herrera-Viedma, E. (2014). H-Classics: Characterizing the concept of citation classics through H-index. Scientometrics, 98(3), 1971-1983.
Meho, L. I., & Yang, K. (2007). Impact of data sources on citation counts and rankings of LIS faculty: Web of Science versus Scopus and Google Scholar. J. Am. Soc. Inf. Sci. Journal of the American Society for Information Science and Technology, 58(13), 2105-2125.
Monares, Á., Ochoa, S. F., Pino, J. A., Herskovic, V., Rodriguez-Covili, J., & Neyem, A. (2011). Mobile computing in urban emergency situations: Improving the support to firefighters in the field. Expert Systems with Applications, 38(2), 1255-1267.
Moynihan, D. P. (2008). Learning under uncertainty: Networks in crisis management. Public Administration Review, 68(2), 350-365.
Peng, T. Q., Zhang, L., Zhong, Z. J., & Zhu, J. J. H. (2013). Mapping the landscape of internet studies: Text mining of social science journal articles 2000-2009. New Media & Society, 15(5), 644-664.
Persson, O., Danell, R., & Schneider, J. W. (2009). How to use Bibexcel for various types of bibliometric analysis. Celebrating scholarly communication studies: A Festschrift for Olle Persson at his 60th Birthday, 9-24.
Ponce, F. A., & Lozano, A. M. (2010). Highly cited works in neurosurgery. Part I: The 100 top-cited papers in neurosurgical journals: A review. Journal of Neurosurgery, 112(2), 223-232.
Ramos-Rodríguez, A. R., & Ruíz-Navarro, J. (2004). Changes in the intellectual structure of strategic management research: A bibliometric study of the Strategic Management Journal, 1980–2000. Strategic Management Journal, 25(10), 981-1004.
Santos, R. N. M. D., & Kobashi, N. Y. (2009). Bibliometria, cientometria, infometria: conceitos e aplicações. Pbcib, 2(1).
Song, J., Zhang, H., & Dong, W. (2016). A review of emerging trends in global PPP research: Analysis and visualization. Scientometrics, 1-37.
Sutcliffe, A., Gault, B., Fernando, T., & Tan, K. (2006). Investigating interaction in CAVE virtual environments. ACM Transactions on Computer-Human Interaction (TOCHI), 13(2), 235-267.
Tsai, C. H., Chen, C. W., Chiang, W. L., & Lin, M. L. (2008). Application of geographic information system to the allocation of disaster shelters via fuzzy models. Engineering Computations, 25(1), 86-100.
21

Van de Walle, B., & Turoff, M. (2008). Decision support for emergency situations. Information Systems and E-Business Management, 6(3), 295-316.
Van Eck, N. J., & Waltman, L. (2010). Software survey: VOSviewer, a computer program for bibliometric mapping. Scientometrics, 84(2), 523-538.
Voigt, S., Kemper, T., Riedlinger, T., Kiefl, R., Scholte, K., & Mehl, H. (2007). Satellite image analysis for disaster and crisis-management support. IEEE transactions on geoscience and remote sensing, 45(6), 1520-1528.
Waugh, W. L., & Streib, G. (2006). Collaboration and leadership for effective emergency management. Public Administration Review, 66(s1), 131-140.
Yang, L., Su, G., & Yuan, H. (2012). Design principles of integrated information platform for emergency responses: The case of 2008 Beijing Olympic Games. Information Systems Research, 23(3-part-1), 761-786.
Yates, D., & Paquette, S. (2011). Emergency knowledge management and social media technologies: A case study of the 2010 Haitian earthquake. International Journal of Information Management, 31(1), 6-13.
Yu, L., & Lai, K. K. (2011). A distance-based group decision-making methodology for multi-person multi-criteria emergency decision support. Decision Support Systems, 51(2), 307-315.
Zheng, X. F., Yao, Z. X., Liang, J. H., & Zheng, J. (2010). The role played and opportunities provided by IGP DMC of China National Seismic Network in Wenchuan earthquake disaster relief and researches. Bulletin of the Seismological Society of America, 100(5), 2866-2872.
22