a comparative study of bio-based and conventional rail … papers/paper-1 biobased rail...lou honary...
TRANSCRIPT

Lou Honary UNI-NABL Center - 2013 1
A comparative study of bio-based and conventional rail curve grease
Lou Honary – UNI-NABL Centre USA
April 2013
Lou Honary UNI-NABL Center - 2013 2
A comparative study of bio-based and conventional rail curve grease
Introduction
This report is based on a currently on-going research project funded by the US Department of Transportation. The main objective of the project is to "Study of the Use of Bio-Base Technologies (Lubricant and Grease) in Locomotives, Rolling Stock and Maintenance of Way Equipment". A number of commercially available rail curve greases were identified and tested, but three mineral oil based and three biobased rail curve greases were selected for comparative testing. Each grease included a summer and a winter version. The testing was based on laboratory tests that included tests considered desirable for evaluation of rail curve greases, testing in an environmental chamber using two grease dispensers from two Original Equipment Manufacturers (OEMs) at different temperatures; and field testing at two different sites on a revenue service railroad. This project has an expected completion date of September 2013. The current report present partial data on the performance of the test greases with the idea of dissemination the final completed report in the future. Railway Curve Lubricants
There are several established methods for lubricating the railway tracks or wheel flanges. The track
lubrication or friction modification is either applied to the wheel flange and gage face or to top of rail.
The friction modifier could be in several forms including grease, oil, water and polymer based mixtures
combined with solids such as graphite or molybdenum disulfide, solid stick lubricants, pastes, and
sprays. They are applied to the track or to the wheel flange via various applicators including wayside, on-
board [locomotive], hi-rail [on-board of a hi-rail truck], drilled oil galleries in track, and hand brush
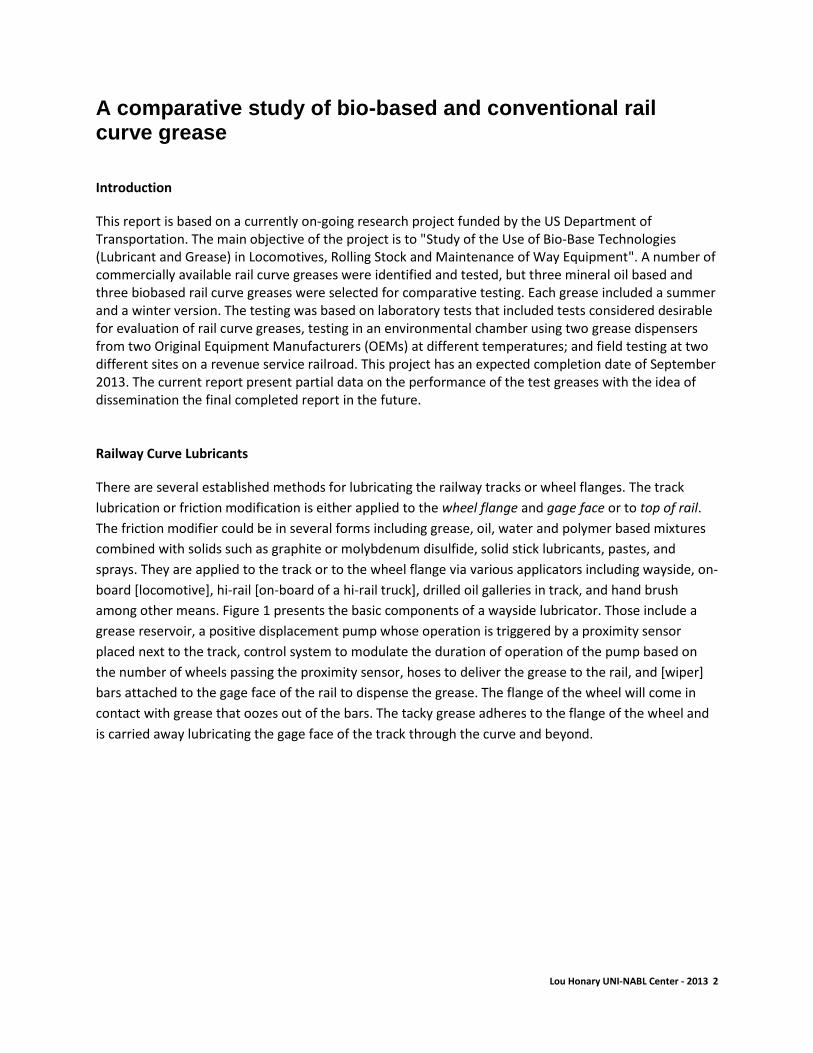
among other means. Figure 1 presents the basic components of a wayside lubricator. Those include a
grease reservoir, a positive displacement pump whose operation is triggered by a proximity sensor
placed next to the track, control system to modulate the duration of operation of the pump based on
the number of wheels passing the proximity sensor, hoses to deliver the grease to the rail, and [wiper]
bars attached to the gage face of the rail to dispense the grease. The flange of the wheel will come in
contact with grease that oozes out of the bars. The tacky grease adheres to the flange of the wheel and
is carried away lubricating the gage face of the track through the curve and beyond.

Lou Honary UNI-NABL Center - 2013 3
Figure 1: Basic components of a wayside grease dispenser (lubricator) & grease at the gage face of
track
1. High extreme pressure property
2. Adequate level of adhesiveness for adherence to the wheel flange and subsequently to the gage
face of the track
3. Adequate level of cohesiveness necessary for "Carry" down the track; and for preventing pump
cavitation
4. Good cold temperature flowability in hoses and lines from the reservoir to the distribution bars
5. Adequate flowability within the reservoir for continued flow into the pump inlet at lower grease
levels in the reservoir
6. Acceptable anti-rust and anti-corrosion properties
7. Desired level of conductivity so as to not interfere with electrical signals
8. High thin film strength for base oil
9. High Viscosity Index for base oil
10. High flash and fire point for base oil
11. Biodegradable so as to not persist under the ballasts which could render the track unstable due
to floating
In the United States, since the majority of the railway transportation is for heavy freight transport, the
use of rail curve grease is prevalent. Also, since over 80% of the approximately 220,000 miles of tracks
are operated by only 5-6 Class I railroads, each major railroad has its own requirements of the rail curve
grease based on the degree of difficulty of track locations. A Class I railroad may be operating along the
eastern coast of the US, for example, carrying large volumes of coal. Another Class I, on the other hand
may be operating in the western US and in some of the dry and mountainous regions of Colorado, thus
requiring slightly different performance characteristics for their rail curve grease. Any specification used

Lou Honary UNI-NABL Center - 2013 4
for freight railroad rail curve grease should include the property specifications of greases currently used
by the major railroad companies operating in the United States. Experience has shown that properties of
the base oil impact the quality of the grease for this and other applications. Test methods identified to
evaluate the above properties include the following:
1. General properties including Worked (60-stroke) and Un-Worked penetrometer values,
Dropping Point, color, and thickener type etc.
These properties are often listed in the technical data sheets for most grease as presented in Table
1.
Table 1: General properties including Worked (60-stroke) and Un-Worked penetrometer values,
Dropping Point, color, and thickener type
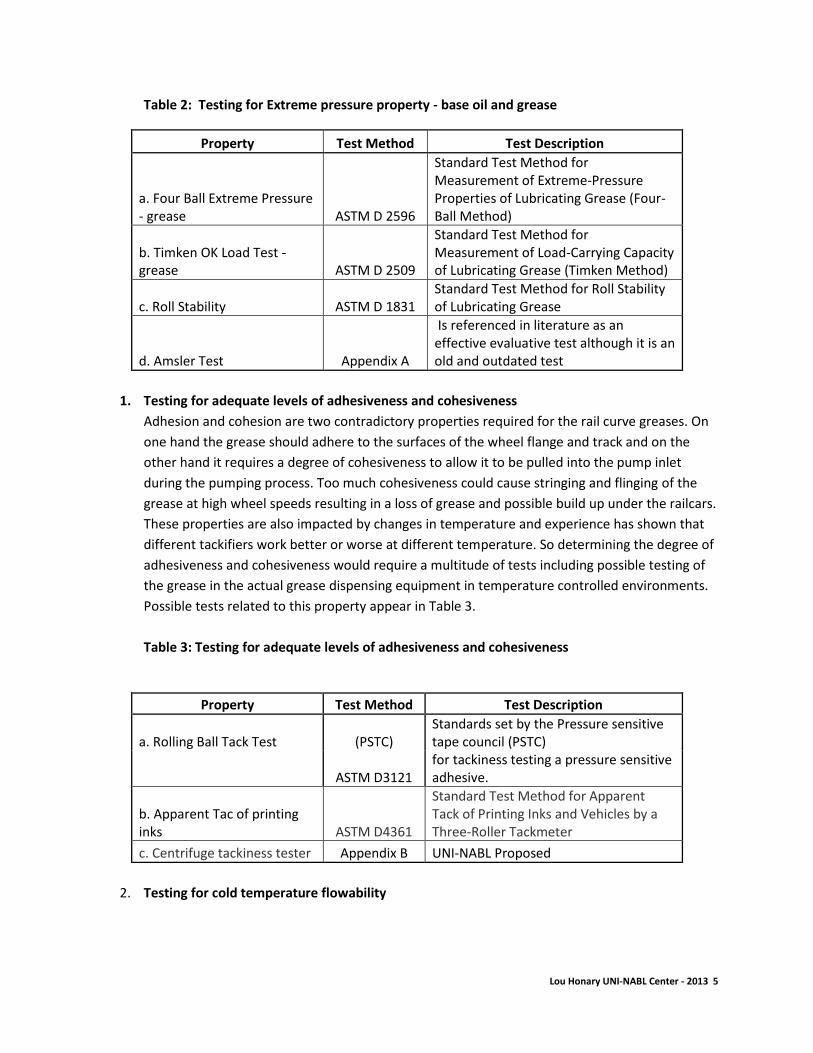
2. Testing for Extreme pressure property - base oil and grease
Perhaps the most important property for rail curve grease is its extreme pressure property. A
high extreme pressure property assures that the grease creates metal to metal separation
around the curves thus reducing friction. Within the extreme pressure performance efforts will
be made to evaluate various motions including sliding friction, rolling friction, and static friction.
For the extreme pressure property, the following tests in Table 2 are recommended:
Property Test Method Test Description
a. NLGI Grade Report
b. Thickener Types Report
c. Color ASTM D156
Standard Test Method for Saybolt Color of Petroleum Products (Saybolt Chromometer Method)
d. Cone Penetration Unworked ASTM D 217
Standard Test Methods for Cone Penetration of Lubricating Grease
e. Cone Penetration 60X Worked ASTM D 217
Standard Test Methods for Cone Penetration of Lubricating Grease
f. Dropping Point ASTM D 2265
Standard Test Method for Dropping Point of Lubricating Grease Over Wide Temperature Range
g. Oil Separation ASTM D 1742 Standard Test Method for Oil Separation from Lubricating Grease During Storage
Lou Honary UNI-NABL Center - 2013 5
Table 2: Testing for Extreme pressure property - base oil and grease
Property Test Method Test Description
a. Four Ball Extreme Pressure - grease ASTM D 2596
Standard Test Method for Measurement of Extreme-Pressure Properties of Lubricating Grease (Four-Ball Method)
b. Timken OK Load Test - grease ASTM D 2509
Standard Test Method for Measurement of Load-Carrying Capacity of Lubricating Grease (Timken Method)
c. Roll Stability ASTM D 1831 Standard Test Method for Roll Stability of Lubricating Grease
d. Amsler Test Appendix A
Is referenced in literature as an effective evaluative test although it is an old and outdated test
1. Testing for adequate levels of adhesiveness and cohesiveness
Adhesion and cohesion are two contradictory properties required for the rail curve greases. On
one hand the grease should adhere to the surfaces of the wheel flange and track and on the
other hand it requires a degree of cohesiveness to allow it to be pulled into the pump inlet
during the pumping process. Too much cohesiveness could cause stringing and flinging of the
grease at high wheel speeds resulting in a loss of grease and possible build up under the railcars.
These properties are also impacted by changes in temperature and experience has shown that
different tackifiers work better or worse at different temperature. So determining the degree of
adhesiveness and cohesiveness would require a multitude of tests including possible testing of
the grease in the actual grease dispensing equipment in temperature controlled environments.
Possible tests related to this property appear in Table 3.
Table 3: Testing for adequate levels of adhesiveness and cohesiveness
Property Test Method Test Description
a. Rolling Ball Tack Test (PSTC) Standards set by the Pressure sensitive tape council (PSTC)
ASTM D3121 for tackiness testing a pressure sensitive adhesive.
b. Apparent Tac of printing inks ASTM D4361
Standard Test Method for Apparent Tack of Printing Inks and Vehicles by a Three-Roller Tackmeter
c. Centrifuge tackiness tester Appendix B UNI-NABL Proposed
2. Testing for cold temperature flowability

Lou Honary UNI-NABL Center - 2013 6
The testing for cold temperature should include flowability through long lines as well as
slumping in the reservoir. The following standard test methods in Table 4 are considered for rail
curve grease.
Table 4: Testing for cold temperature flowability
Property Test Method Test Description
Grease Mobility -30°C (g/sec:g/min) US Steel
This would be for the winter version unless the product is considered all-year grease
Grease Mobility -18°C (g/sec:g/min) US Steel
This would be for the winter version unless the product is considered all-year grease
Grease Mobility -10°C (g/sec:g/min) US Steel
Grease Mobility 0°C (g/sec:g/min) US Steel
Low Temp Torque Test Wheel Bearing ASTM D4693
Standard Test Method for Low-Temperature Torque of Grease-Lubricated Wheel Bearings
Low Temp Torque Test Ball Bearing ASTM D1478
Standard Test Method for Low-Temperature Torque of Ball Bearing Grease
Temp Controlled Chamber Test Appendix C UNI-NABL Proposed
3. Oil Separation Property: This property needs to be tested because the presence of the
separated oil could play a role in the pumping action within the reservoir and the dispensing
action at the grease dispensing bars. Table 5 shows test methods used for determining this
property of greases.
Table 5: Test methods for determining the oil separation property of rail curve greases
Property Test Method Test Description
Oil Separation ASTM D1742 Standard Test Method for Oil Separation from Lubricating Grease During Storage
Oil Separation ASTM D6184
Standard Test Method for Oil Separation from Lubricating Grease (Conical Sieve Method)
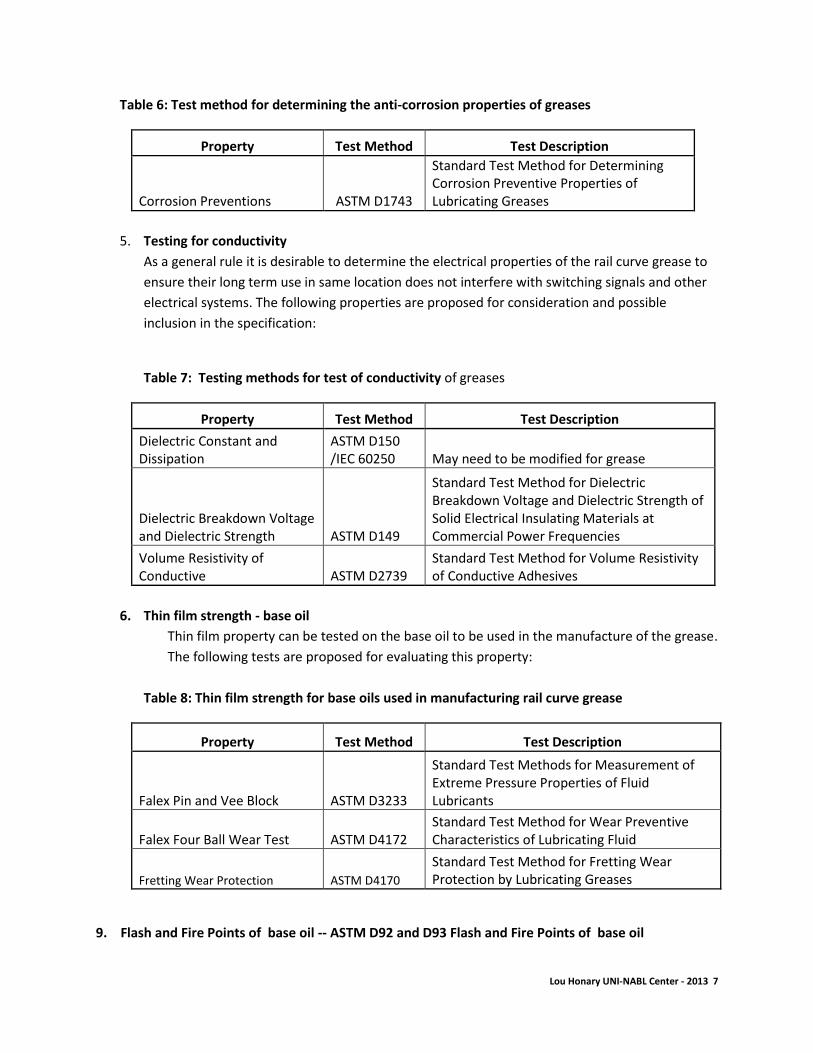
4. Anti-corrosion properties. As a general rule it is desirable to determine the corrosion and rust
prevention properties of the rail curve grease to ensure the additive compositions are not
causing undue rusting or corrosion on the rail surfaces.
Lou Honary UNI-NABL Center - 2013 7
Table 6: Test method for determining the anti-corrosion properties of greases
Property Test Method Test Description
Corrosion Preventions ASTM D1743
Standard Test Method for Determining Corrosion Preventive Properties of Lubricating Greases
5. Testing for conductivity
As a general rule it is desirable to determine the electrical properties of the rail curve grease to
ensure their long term use in same location does not interfere with switching signals and other
electrical systems. The following properties are proposed for consideration and possible
inclusion in the specification:
Table 7: Testing methods for test of conductivity of greases
Property Test Method Test Description
Dielectric Constant and Dissipation
ASTM D150 /IEC 60250 May need to be modified for grease
Dielectric Breakdown Voltage and Dielectric Strength ASTM D149
Standard Test Method for Dielectric Breakdown Voltage and Dielectric Strength of Solid Electrical Insulating Materials at Commercial Power Frequencies
Volume Resistivity of Conductive ASTM D2739
Standard Test Method for Volume Resistivity of Conductive Adhesives
6. Thin film strength - base oil
Thin film property can be tested on the base oil to be used in the manufacture of the grease.
The following tests are proposed for evaluating this property:
Table 8: Thin film strength for base oils used in manufacturing rail curve grease
Property Test Method Test Description
Falex Pin and Vee Block ASTM D3233
Standard Test Methods for Measurement of Extreme Pressure Properties of Fluid Lubricants
Falex Four Ball Wear Test ASTM D4172 Standard Test Method for Wear Preventive Characteristics of Lubricating Fluid
Fretting Wear Protection ASTM D4170
Standard Test Method for Fretting Wear Protection by Lubricating Greases
9. Flash and Fire Points of base oil -- ASTM D92 and D93 Flash and Fire Points of base oil

Lou Honary UNI-NABL Center - 2013 8
10. Pour Point of base oil -- ASTM D97
11. Viscosity Index of base oil -- ASTM D2270
12. Other possible tests –
Spreadability
Thermal Resistance
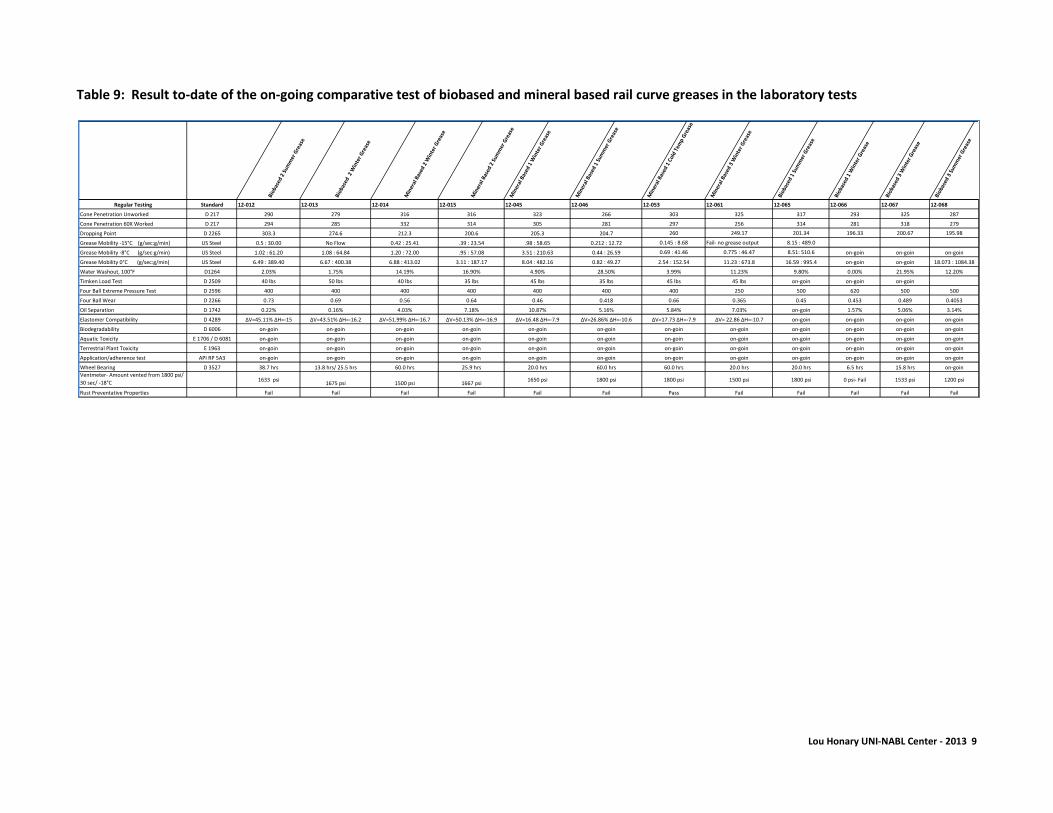
Laboratory Testing and Results
Twelve commercially available mineral oil based and biobased greases were identified and acquired for
testing. These greases were known to be commercially available and in use by US railroads. By
performing the tests in the same laboratory, the side by side results provide an insight into the
performance of these existing products. Table 1 present the results to-date for this on-going
comparative testing. The time table for this research activity requires all activities to be completed by
September 2013. A white paper will be published to report the results of the completed study.
Lou Honary UNI-NABL Center - 2013 9
Table 9: Result to-date of the on-going comparative test of biobased and mineral based rail curve greases in the laboratory tests
Biob
ased
2 S
umm
er G
reas
e
Biob
ased
2 W
inte
r G
reas
e
Min
eral
Bas
ed 2
Win
ter
Gre
ase
Min
eral
Bas
ed 2
Sum
mer
Gre
ase
Min
eral
Bas
ed 1
Win
ter
Gre
ase
Min
eral
Bas
ed 1
Sum
mer
Gre
ase
Min
eral
Bas
ed 1
Col
d Te
mp
Gre
ase
Min
eral
Bas
ed 3
Win
ter
Gre
ase
Biob
ased
1 S
umm
er G
reas
e
Biob
ased
1 W
inte
r G
reas
e
Biob
ased
3 W
inte
r G
reas
e
Biob
ased
3 S
umm
er G
reas
e
Regular Testing Standard 12-012 12-013 12-014 12-015 12-045 12-046 12-053 12-061 12-065 12-066 12-067 12-068
Cone Penetration Unworked D 217 290 279 316 316 323 266 303 325 317 293 325 287
Cone Penetration 60X Worked D 217 294 285 332 314 305 281 297 256 314 281 318 279
Dropping Point D 2265 303.3 274.6 212.3 200.6 205.3 204.7 260 249.17 201.34 196.33 200.67 195.98
Grease Mobility -15°C (g/sec:g/min) US Steel 0.5 : 30.00 No Flow 0.42 : 25.41 .39 : 23.54 .98 : 58.65 0.212 : 12.72 0.145 : 8.68 Fail- no grease output 8.15 : 489.0
Grease Mobility -8°C (g/sec:g/min) US Steel 1.02 : 61.20 1.08 : 64.84 1.20 : 72.00 .95 : 57.08 3.51 : 210.63 0.44 : 26.59 0.69 : 41.46 0.775 : 46.47 8.51: 510.6 on-goin on-goin on-goin
Grease Mobility 0°C (g/sec:g/min) US Steel 6.49 : 389.40 6.67 : 400.38 6.88 : 413.02 3.11 : 187.17 8.04 : 482.16 0.82 : 49.27 2.54 : 152.54 11.23 : 673.8 16.59 : 995.4 on-goin on-goin 18.073 : 1084.38
Water Washout, 100°F D1264 2.03% 1.75% 14.19% 16.90% 4.90% 28.50% 3.99% 11.23% 9.80% 0.00% 21.95% 12.20%
Timken Load Test D 2509 40 lbs 50 lbs 40 lbs 35 lbs 45 lbs 35 lbs 45 lbs 45 lbs on-goin on-goin on-goin
Four Ball Extreme Pressure Test D 2596 400 400 400 400 400 400 400 250 500 620 500 500
Four Ball Wear D 2266 0.73 0.69 0.56 0.64 0.46 0.418 0.66 0.365 0.45 0.453 0.489 0.4053
Oil Separation D 1742 0.22% 0.16% 4.03% 7.18% 10.87% 5.16% 5.84% 7.03% on-goin 1.57% 5.06% 3.14%
Elastomer Compatibility D 4289 ΔV=45.11% ΔH=-15 ΔV=43.51% ΔH=-16.2 ΔV=51.99% ΔH=-16.7 ΔV=50.13% ΔH=-16.9 ΔV=16.48 ΔH=-7.9 ΔV=26.86% ΔH=-10.6 ΔV=17.73 ΔH=-7.9 ΔV= 22.86 ΔH=-10.7 on-goin on-goin on-goin on-goin
Biodegradability D 6006 on-goin on-goin on-goin on-goin on-goin on-goin on-goin on-goin on-goin on-goin on-goin on-goin
Aquatic Toxicity E 1706 / D 6081 on-goin on-goin on-goin on-goin on-goin on-goin on-goin on-goin on-goin on-goin on-goin on-goin
Terrestrial Plant Toxicity E 1963 on-goin on-goin on-goin on-goin on-goin on-goin on-goin on-goin on-goin on-goin on-goin on-goin
Application/adherence test API RP 5A3 on-goin on-goin on-goin on-goin on-goin on-goin on-goin on-goin on-goin on-goin on-goin on-goin
Wheel Bearing D 3527 38.7 hrs 13.8 hrs/ 25.5 hrs 60.0 hrs 25.9 hrs 20.0 hrs 60.0 hrs 60.0 hrs 20.0 hrs 20.0 hrs 6.5 hrs 15.8 hrs on-goin
Ventmeter- Amount vented from 1800 psi/
30 sec/ -18°C1633 psi
1675 psi 1500 psi 1667 psi1650 psi 1800 psi 1800 psi 1500 psi 1800 psi 0 psi- Fail 1533 psi 1200 psi
Rust Preventative Properties Fail Fail Fail Fail Fail Fail Pass Fail Fail Fail Fail Fail

Lou Honary UNI-NABL Center - 2013 10
Testing in Environmental Chamber and Results
Two OEM lubricators are also tested in an environmental chamber where the temperature of the
equipment and grease is changed from about 37.8 °C (100 °F) down to -23 °C (-10 °F). The performance of
the grease in the equipment at various temperatures is documented. The summer and winter versions of
petroleum and biobased greases are tested. Figure 3 shows the two lubricators in the environmental
chamber.
Figure 2: Environmental chamber with grease dispensing equipment from two manufacturers are used to
test petroleum based grease and soybean based grease at different temperatures
The lubricators were manufactured by Portec Rail Products and by Lincoln. The following settings were
used in order to pump approximately 0.4 pounds of grease per 100 wheels passing by the sensor. This was
based on a general rule of thumb of trying to pump 0.8 lbs of grease per 100 wheels on both tracks. Since,
the lubricator was attached to one bar then the goal was set to pump ½ as much grease or 0.4 pounds per
100 wheels. The two units used one single train simulator to operate.
1. Portec PIV settings: 0.35 Seconds every 5 axles
2. Lincoln Settings: 3.5 Seconds every one axle (this unit turns on every time the Portec unit pumps)
3. Simulator settings: 50 Trains at 5 mph 25 Cars (100 wheels per train)
4. Start each test with 9 pails of grease (315 lbs)
5. At each test (temperature) make sure grease is leveled with trowel. 6. At end of each test (temperature) add back the same amount of grease that was pumped out in the previous test.

Lou Honary UNI-NABL Center - 2013 11
Fifty trains were simulated using the digital Train Simulator. Twenty-five car trains with 60 ft truck centers were run at 5 mph. After each train there was a 1 minute delay before the next starts. It was determined that the Portec Protector IV unit set to pump for 0.35 seconds every 5 axles outputs .3778 pounds of grade 1 grease at 100°F during one train pass using the simulator. The Lincoln unit is set to pump for 3.5 seconds on every axle. The settings on the Lincoln unit are such because a relay is used to simulate a wheel count every time the Portec unit’s pump engages. It is also determined that these settings on the Lincoln unit output .3908 lbs at the same conditions above. The output for each lubricator is similar in like conditions and is close to a desirable 8/10 pound per 100 wheels (figuring one bar system should be half of that). After each simulation, the environmental chamber will be cooled to the next lower temperature and the grease allowed to acclimate for a minimum of 24 hrs. The same simulation were run at each temperature.
Figure 3: 45 gallons of grease were leveled inside each reservoir – left Portec and right Lincoln
Figure 4: Each lubricator would pump through a respective dispensing bar into a drum

Lou Honary UNI-NABL Center - 2013 12
Table 10: An example of test results of train simulation in the environmental chamber for grease pumped per train for a biobased winter grease
GREASE ID Test Temperature/ Lubricator Axle count Axle Count
Grease
Tare
Grease
End Grease Grease Level Grease Level Grease Level Δ Grease Tank Unwk Pen/
Adherence to Observations (cavitation,
Actual (°F) Begin End
Weight
(lbs)
Weight
(lbs)
Pumped
(lbs) Begining (in) Highest (in) Lowest (in) Level (in) Temp (C) steel? (Y/N) port plugging etc?)
Biobased 2 Winter Grease 100 / 105.8 Portec PIV 18464 23463 45 64 19 21.25 20.875 24 3.125 320 / 40 YShows some funneling towards the Inlet,
ports clear
100 / 105.8 Lincoln 0 1000 43 62 19 16.25 17.5 18.25 0.75 320 / 40 Y looks normal, ports clear
Unworked Pen= 302 @ 20C 50 / 57 Portec PIV 23463 28461 64 82 18 20.5 21 25.25 4.25 285 / 14 Y
Worked Pen= 50 / 57 Lincoln 1000 2001 62 79 17 17 17 19.25 2.25 285 / 14 Y
Set point =15 32 / 32 Portec PIV 28461 33460 82 98 16 20.5 20.75 25.25 4.5 262 / -1 YBoth units clear ports, grease took 2 days
to get to temp.
32 / 32 Lincoln 2001 2995 79 96 17 16.75 16.75 19.375 2.625 262 / -1 Y
Seemed it did not pump during the first
couple of actuations (could not hear
motor)
Set point = -15 0 / 1 Portec PIV 33460 38460 98 110 12 21 21 24 3 227 / -17 YFunnel less drastic. More bowl shaped
rather than cone shaped - no final pics
0 / 1 Lincoln 0 969 96 110 14 16.75 17 19.25 2.25 227 / -17 Y No final pics
Set Point = -25 (-10) / Portec PIV 38460 43453 110 120 10 21.25 21 23.5 2.5 214 / -21 Somewhat
(-10 ) / Lincoln 0 981 110 121 11 17.125 17.25 19.25 2 214 / -21 Somewhat
Measured at end of each test.
Lou Honary UNI-NABL Center - 2013 13
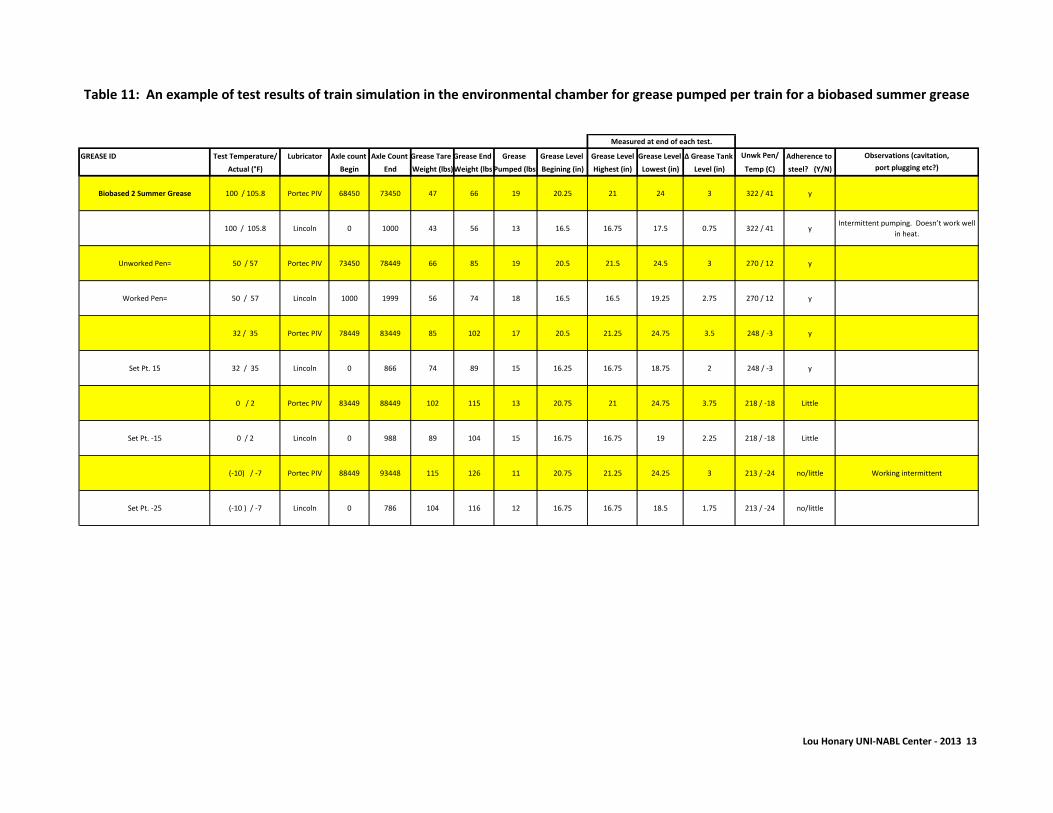
Table 11: An example of test results of train simulation in the environmental chamber for grease pumped per train for a biobased summer grease
GREASE ID Test Temperature/ Lubricator Axle count Axle Count Grease Tare Grease End Grease Grease Level Grease Level Grease Level Δ Grease Tank Unwk Pen/ Adherence to Observations (cavitation,
Actual (°F) Begin End Weight (lbs)Weight (lbs)Pumped (lbs) Begining (in) Highest (in) Lowest (in) Level (in) Temp (C) steel? (Y/N) port plugging etc?)
Biobased 2 Summer Grease 100 / 105.8 Portec PIV 68450 73450 47 66 19 20.25 21 24 3 322 / 41 y
100 / 105.8 Lincoln 0 1000 43 56 13 16.5 16.75 17.5 0.75 322 / 41 yIntermittent pumping. Doesn’t work well
in heat.
Unworked Pen= 50 / 57 Portec PIV 73450 78449 66 85 19 20.5 21.5 24.5 3 270 / 12 y
Worked Pen= 50 / 57 Lincoln 1000 1999 56 74 18 16.5 16.5 19.25 2.75 270 / 12 y
32 / 35 Portec PIV 78449 83449 85 102 17 20.5 21.25 24.75 3.5 248 / -3 y
Set Pt. 15 32 / 35 Lincoln 0 866 74 89 15 16.25 16.75 18.75 2 248 / -3 y
0 / 2 Portec PIV 83449 88449 102 115 13 20.75 21 24.75 3.75 218 / -18 Little
Set Pt. -15 0 / 2 Lincoln 0 988 89 104 15 16.75 16.75 19 2.25 218 / -18 Little
(-10) / -7 Portec PIV 88449 93448 115 126 11 20.75 21.25 24.25 3 213 / -24 no/little Working intermittent
Set Pt. -25 (-10 ) / -7 Lincoln 0 786 104 116 12 16.75 16.75 18.5 1.75 213 / -24 no/little
Measured at end of each test.

Lou Honary UNI-NABL Center - 2013 14
Field Testing and Results
Field testing begun in early February at two different sites in Cedar Rapids and in Cedar Falls, Iowa with two
dispensers/lubricators at each site. One dispenser was set to pump petroleum grease to one track and the
other was set to pump biobased grease to the other track. The location is almost S shape with curves on
both sides of lubricator. Each site has lubricators from a different manufacturer. The petroleum grease was
selected because it is the most commonly known used grease by US railroads and this grease was
considered reference test grease. Testing included taking tribometer readings for the measurements of
friction at one mile intervals up to five miles on each side of the lubricators. The results will show how
grease can handle the very cold Iowa temperatures and how far each of the test greases is carried down
the track in a revenue service railroad. Figures X and Y show the lubricators in the Cedar Rapids test site.
Figure 5 left and right: Two Lincoln Lubricators one having petroleum based grease and one Biobased
grease. One track receives the conventional grease and the other the biobased grease
Figure 6: Location of the wheel sensor and track mats placed to reduce environmental impact of
petroleum based grease at the lubricator site
Lou Honary UNI-NABL Center - 2013 15
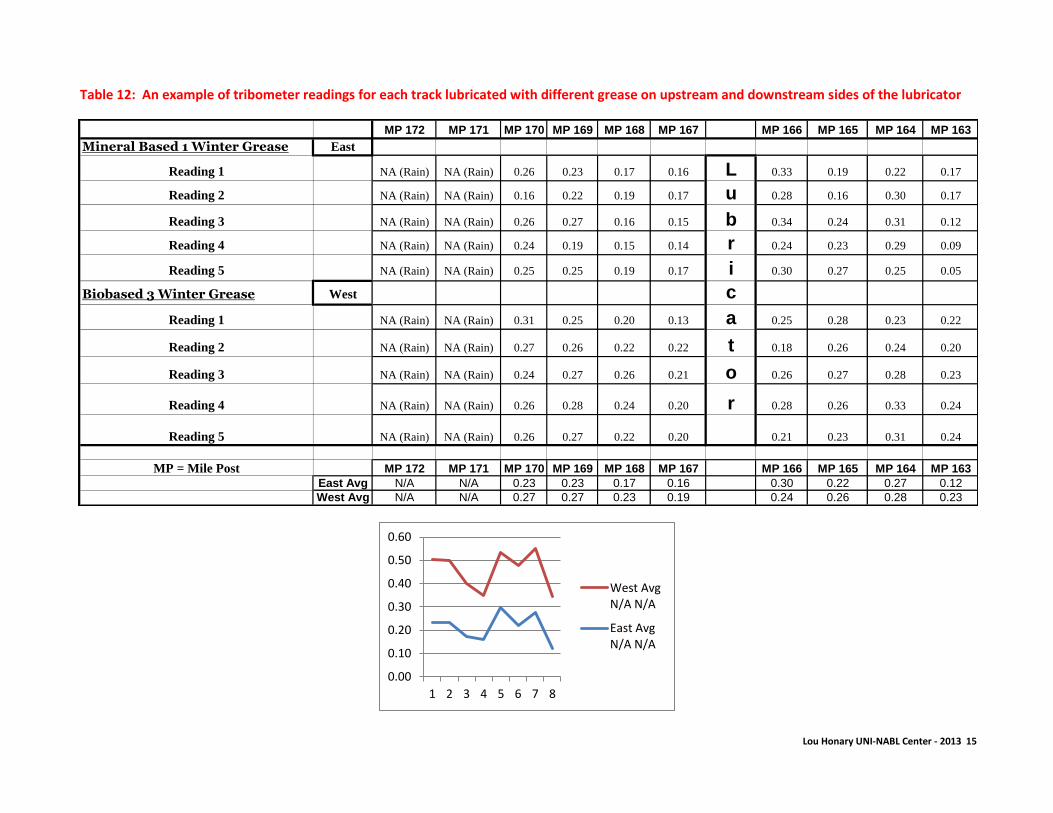
Table 12: An example of tribometer readings for each track lubricated with different grease on upstream and downstream sides of the lubricator
MP 172 MP 171 MP 170 MP 169 MP 168 MP 167 MP 166 MP 165 MP 164 MP 163
Mineral Based 1 Winter Grease East
Reading 1 NA (Rain) NA (Rain) 0.26 0.23 0.17 0.16 L 0.33 0.19 0.22 0.17
Reading 2 NA (Rain) NA (Rain) 0.16 0.22 0.19 0.17 u 0.28 0.16 0.30 0.17
Reading 3 NA (Rain) NA (Rain) 0.26 0.27 0.16 0.15 b 0.34 0.24 0.31 0.12
Reading 4 NA (Rain) NA (Rain) 0.24 0.19 0.15 0.14 r 0.24 0.23 0.29 0.09
Reading 5 NA (Rain) NA (Rain) 0.25 0.25 0.19 0.17 i 0.30 0.27 0.25 0.05
Biobased 3 Winter Grease West c
Reading 1 NA (Rain) NA (Rain) 0.31 0.25 0.20 0.13 a 0.25 0.28 0.23 0.22
Reading 2 NA (Rain) NA (Rain) 0.27 0.26 0.22 0.22 t 0.18 0.26 0.24 0.20
Reading 3 NA (Rain) NA (Rain) 0.24 0.27 0.26 0.21 o 0.26 0.27 0.28 0.23
Reading 4 NA (Rain) NA (Rain) 0.26 0.28 0.24 0.20 r 0.28 0.26 0.33 0.24
Reading 5 NA (Rain) NA (Rain) 0.26 0.27 0.22 0.20 0.21 0.23 0.31 0.24
MP = Mile Post MP 172 MP 171 MP 170 MP 169 MP 168 MP 167 MP 166 MP 165 MP 164 MP 163
East Avg N/A N/A 0.23 0.23 0.17 0.16 0.30 0.22 0.27 0.12
West Avg N/A N/A 0.27 0.27 0.23 0.19 0.24 0.26 0.28 0.23
0.00
0.10
0.20
0.30
0.40
0.50
0.60
1 2 3 4 5 6 7 8
West Avg N/A N/A
East Avg N/A N/A
Lou Honary UNI-NABL Center - 2013 16
The field tests are on-going and only one winter grease was evaluated over a three months period due to
various problems with lubricators not pumping, changes needed in the setting of the lubricator etc. In Table
___ the results are inconclusive as the average readings are far above the desired 0.25 coefficient of friction.
As greasing is continued and the tracks build a layer of lubricant on the gage face this coefficient of friction
would look smaller closer to the lubricator which gradually increase the farther away the measurements are
taken from the lubricators.
Test for adhesion and cohesion
The UNI-NABL Center has been experimenting with the use of a modified centrifuge for the purpose of
comparing the adhesiveness and cohesiveness of different greases. This test method is proposed for
discussion only. If the method is accepted then a smaller bench top model can be adapted for future use.
The tackiness, adhesion and cohesion of rail curve grease are critical prosperities that require discussion
and consideration.
In the UNI-NABL proposed test method, a centrifuge is fitted with an 18-inch (45.72-cm) balanced
aluminum disk. Grease samples are placed at different points on the radius of this disk and the disk is
rotated at a given RPM for certain period of time. An example would be to place a sample of 2.5 grams of
grease at 4 inches (10.16 cm) from the center of the disk and running the disk at 500 RPM for 10 seconds.
The amount of grease sprayed on the walls of centrifuge can be collected and weighed. Also, the pattern of
the grease on the disk can be compared with a reference grease. Figure X shows a picture of two grease
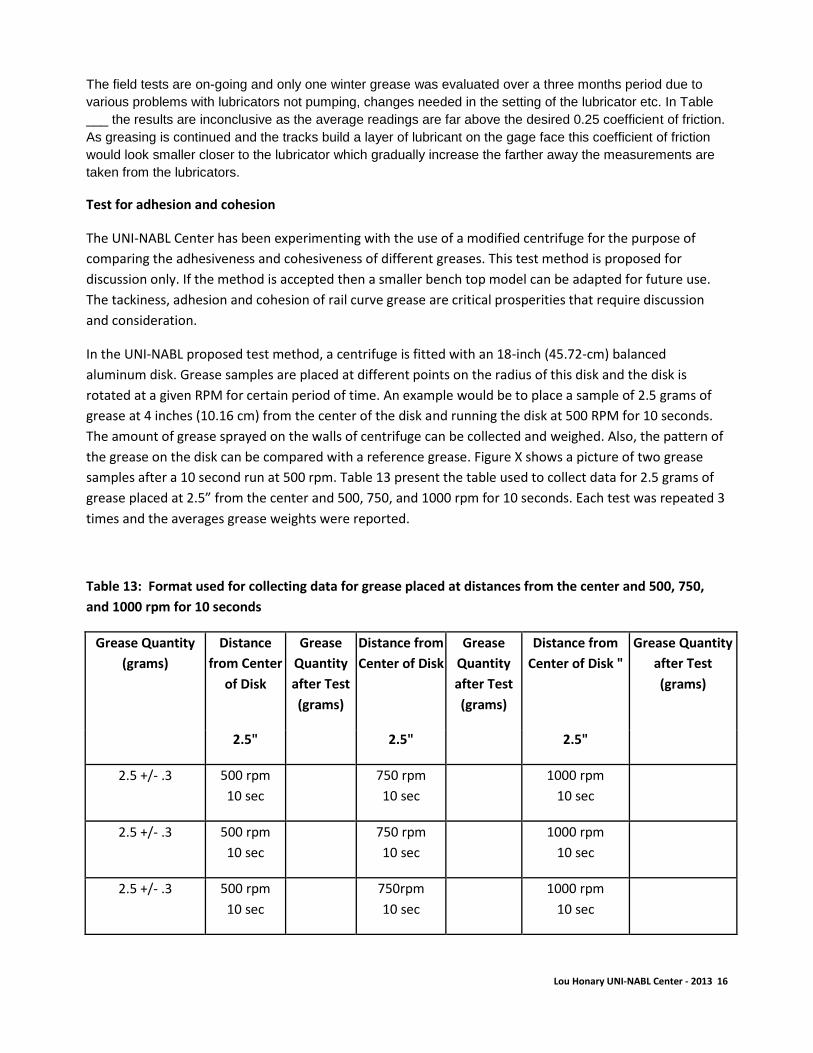
samples after a 10 second run at 500 rpm. Table 13 present the table used to collect data for 2.5 grams of
grease placed at 2.5” from the center and 500, 750, and 1000 rpm for 10 seconds. Each test was repeated 3
times and the averages grease weights were reported.
Table 13: Format used for collecting data for grease placed at distances from the center and 500, 750,
and 1000 rpm for 10 seconds
Grease Quantity
(grams)
Distance
from Center
of Disk
Grease
Quantity
after Test
(grams)
Distance from
Center of Disk
Grease
Quantity
after Test
(grams)
Distance from
Center of Disk "
Grease Quantity
after Test
(grams)
2.5" 2.5" 2.5"
2.5 +/- .3 500 rpm
10 sec
750 rpm
10 sec
1000 rpm
10 sec
2.5 +/- .3 500 rpm
10 sec
750 rpm
10 sec
1000 rpm
10 sec
2.5 +/- .3 500 rpm
10 sec
750rpm
10 sec
1000 rpm
10 sec

Lou Honary UNI-NABL Center - 2013 17
The samples were all tested at room temperature. Since the goal was also to help in optimizing the test
procedure, the grease samples were also tested at different radii and different speeds. The radii selected
were 2.5” from the center, 4” from the center and 80 in from the center. Of course, the farther away from
the center would increase the centrifugal forces applied to the grease resulting in more spray off and a
different pattern on the surface of the disk. The rpm was also varied to 500, 750 and 1000 rpm for each
distance from the center. Additionally, the time the centrifuge was operated was varied to include a 20
second time for comparison with the results when the disk was operated for 10 seconds. Figure Y shows a
sample grease at 2.5” from the center that was run for 20 second at 1000 rpm; and one grease that was run
at 4” from the center and run at 500 rpm for 20 seconds.
Figure 7: sample greases tested at 2.5” from the center for 20 second at 1000 rpm; and at 4” from the center at 500 rpm for 20 seconds; and sprayed off grease on centrifuge walls

Lou Honary UNI-NABL Center - 2013 18
Figure 8: Sample greases tested at 2.5”, 4”, and 8” from the center at 500, 750, and 1000 rpm for 10 seconds
Figure 9: Sample greases tested at 2.5”, 4”, and 8” from the center at 500, 750, and 1000 rpm for 20 seconds
500 RPM 2.5 in
500 RPM 4 in
500 RPM 8 in
750 RPM 2.5 in
750 RPM 4 in
750 RPM 8 in
1000 RPM 2.5 in
1000 RPM 4 in
1000 RPM 8 in
0
0.25
0.5
0.75
1
1.25
1.5
1.75
2
2.25
2.5
500 R
PM
2.5
in
500 R
PM
4 in
500 R
PM
8 in
750 R
PM
2.5
in
750 R
PM
4 in
750 R
PM
8 in
1000 R
PM
2.5
in
1000 R
PM
4 in
1000 R
PM
8 in
Gra
ms
Distance & RPM
Biobased 2 Grease Summer 10 Sec Average
500 RPM 2.5 in
500 RPM 4 in
500 RPM 8 in
750 RPM 2.5 in
750 RPM 4 in
750 RPM 8 in
1000 RPM 2.5 in
1000 RPM 4 in
1000 RPM 8 in
0
0.25
0.5
0.75
1
1.25
1.5
1.75
2
2.25
2.5
2.75
Gra
ms
Distance & RPM
Biobased 2 Grease Summer 20 Sec Average

Lou Honary UNI-NABL Center - 2013 19
Figure 10: sample biobased 2 grease tested at 2.5” from the center for 20 second at 750 rpm; and at 4” from the center at 500 rpm for 20 seconds
Table 14: An example of test results for the biobased 2 winter grease run at different distances from the
center for 20 seconds
RPM 500
Trial 1 Trial 2 Trial 3
Biobased 2 Grease
Winter 20 Sec Average
Distance
2.5 2.693 2.708 2.658
500 RPM 2.5 in 2.6863333
4 2.633 2.556 2.591
500 RPM 4 in 2.5933333
8 0.821 0.742 0.811
500 RPM 8 in 0.7913333
Finally, in order to determine the flowability of these greases in cold temperatures, in addition to the
testing in the environmental chamber, each grease was tested in a Lincoln ventmeter as well as in the
Grease Mobility test. Figure ____ shows one of 5 Lincoln ventmeters built for this project. Since, biobased
greases tend to behave differently at cold temperature than mineral based greases, the ventmeters were
held at the test temperature for 24 hours instead of the standard 4 hours. The results of testing of those
greases in the Lincoln ventmeter and Grease Mobility tester appear in table ____.

Lou Honary UNI-NABL Center - 2013 20
Figure 11: Lincoln Ventmeters used for testing sample greases at different temperatures
.
Lu
bri
ca
tors
Coe
ffic
ient
of F
riction