a comparison of pisa and timss 2003 achievement results · pdf filea comparison of pisa and...
TRANSCRIPT
A Comparison of PISA and TIMSS 2003 achievement results
1
A Comparison of PISA and TIMSS 2003 achievement results in Mathematics and Science
Margaret Wu, University of Melbourne, [email protected]
Abstract
This study compares PISA 2003 Mathematics and Science results with TIMSS 2003 Grade 8 Mathematics and Science results, using country mean scores for 22 participants of both studies. In Mathematics, it is found that Western countries generally performed better in PISA than in TIMSS, and Eastern European and Asian countries generally performed better in TIMSS than in PISA. Furthermore, two factors, content balance and years of schooling can account for 94% of the variation between the differential performance of countries in PISA and TIMSS. Consequently, the rankings of countries in the two studies can be reconciled to a reasonable degree of accuracy. In Science, the correlation between PISA and TIMSS country mean scores is 0.95, much higher than for Mathematics. That is, TIMSS country mean scores can explain 90% of the variation in PISA country mean scores.
Keywords: International study, Mathematics, PISA, TIMSS
Introduction
Over the past few years, two large international surveys have been conducted in parallel: the OECD’s Programme for International Student Assessment (PISA) (Turner & Adams, 2007) and the International Association for the Evaluation of Educational Achievement (IEA)’sTrends in International Mathematics and Science Study (TIMSS)(http://timss.bc.edu/index.html). Both PISA and TIMSS assess students’ achievement levels in Mathematics and Science. There has been considerable interest in comparing the two surveys, as the results from these two surveys have not always been consistent (AIR, 2005; Brown, Micklewright, Schnepf & Waldmann, 2007; Gronmo & Olsen, 2008). To be able to fully utilise the results from these surveys, it is essential to gain a clear understanding of what each survey assesses, as well as similarities and differences between the survey designs. To date, a number of studies have focused on the comparison of aspects of survey designs and assessment frameworks, but no study has directly linked the differences in survey designs and frameworks to differences in the results other than conjecture. This paper seeks not only to compare the two surveys, but also to identify factors that contribute to the differences in the results. The main focus is on the comparisons of Mathematics results. Comparisons of Science results are also presented, but not as extensively as for Mathematics, as Science was a minor
A Comparison of PISA and TIMSS 2003 achievement results
2
test domain in PISA 2003.
Methodology
Twenty-two countries/regions participated in both TIMSS 2003 (grade 8) and PISA 2003. This paper focuses on the comparison of Mathematics and Science country mean scores for PISA and TIMSS Grade 8 cohort. PISA tests 15 year-old students who are typically in Grades 9 and 10.
Both PISA and TIMSS report results on a scale with the average of the country mean scores set to 500, and the standard deviation of country mean scores set to 100, for a group of selected countries (IEA, 2003; OECD, 2003). However, as the participating countries in the two studies are not identical, the mean and the standard deviation, and consequently, countries scores, from the two studies are not directly comparable. For example, Australia’s PISA Mathematics mean score was 524, and TIMSS mean score was 505. But it is not appropriate to draw the conclusion that Australia performed better in PISA than in TIMSS simply because 524 is higher than 505 (even with confidence intervals of mean scores taken into account).
However, if we are concerned with correlating TIMSS and PISA country mean scores instead of a direct comparison of the magnitudes of the mean scores, then the differences in the location and scale parameters of the TIMSS and PISA reporting scales will not have any impact on the comparisons, since correlation coefficients and R2 in regressions are invariant to scale and location changes to the variables in the regression model. That is, if we use regression analysis to find the association between TIMSS and PISA country mean scores, and/or associations with any other explanatory variables, we will have invariant results in terms of correlation coefficients and R2, irrespective of how TIMSS and PISA set their means and standard deviations for their respective reporting scale.
In this paper, we focus on identifying factors for explaining the observed differences in country performances in TIMSS and PISA. We will use regression techniques to do this and use R2 as the measure for the impact of the factors. In this way, the TIMSS and PISA mean scores as reported by IEA and OECD can be used directly without transformation. More specifically, two factors, Years of schooling in PISA and Content balance of the two tests, are used as predictors for the observed differences in each country’s performance in PISA and TIMSS. The analyses will begin with the constructions of these two variables (Years of schooling in PISA and Content balance) for Mathematics.
A Comparison of PISA and TIMSS 2003 achievement results
3
ResultsA First look at differences in Mathematics performance in PISA and TIMSS, with no
explanatory factors
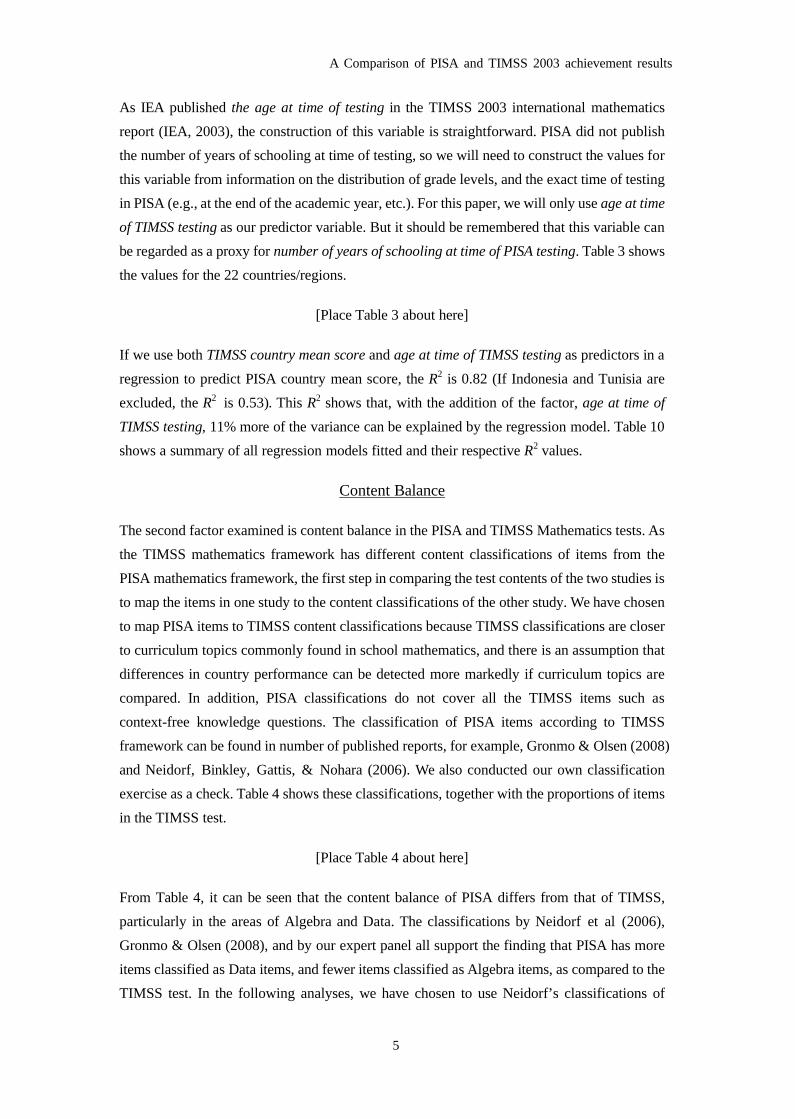
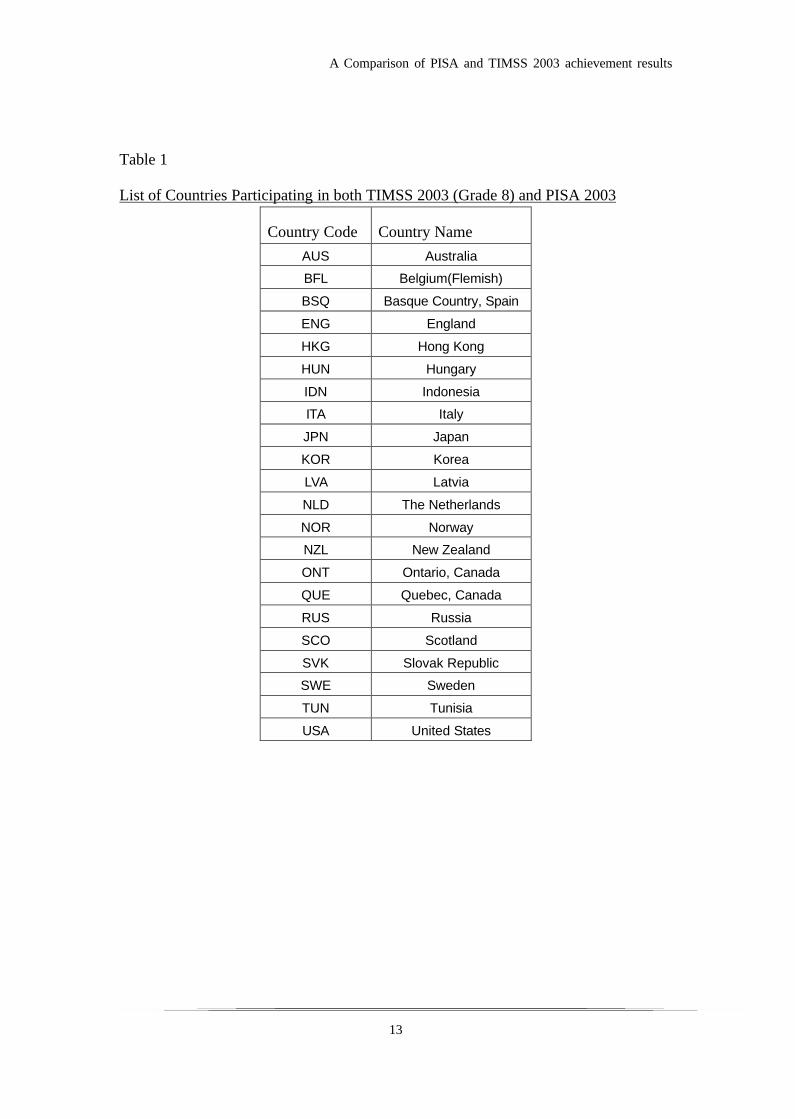
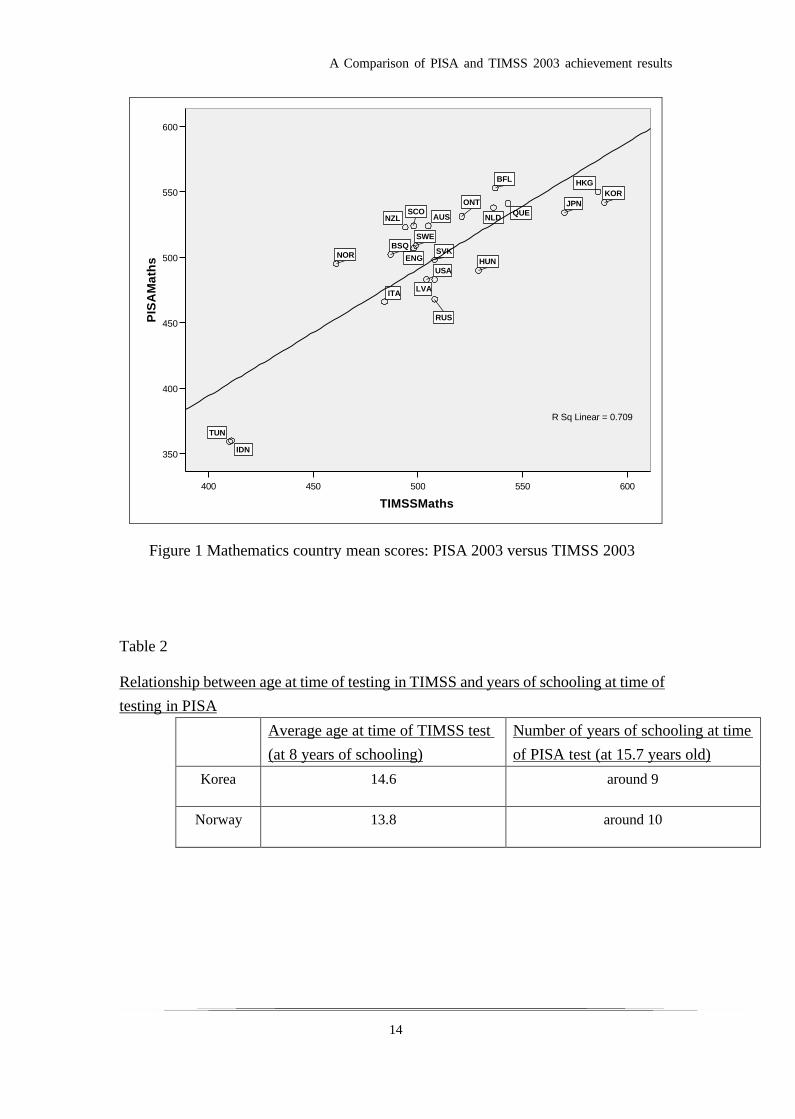
To show how closely PISA and TIMSS results are correlated, Figure 1 shows a plot of PISA and TIMSS mathematics country mean scores for the 22 countries/regions participated in both studies. A list of the country names and abbreviated country codes are shown in Table 1.
[Place Table 1 about here]
[Place Figure 1 about here]
In Figure 1, the correlation between PISA and TIMSS country mean scores is 0.84. As Indonesia and Tunisia have mean scores far below those of other countries, they have a lot of leverage on this correlation coefficient. If Indonesia and Tunisia are removed from the data set, the correlation is 0.66. In all analyses carried out, results are provided for the whole data set, as well as for the data set with Indonesia and Tunisia removed, so that we also have a more conservative estimation of the effect of various factors.
The line shown in Figure 1 is the line of best fit (regression line) for the data points. That is, if we were to predict PISA mathematics mean score using TIMSS mathematics mean score, the value on this line provides an estimate of the predicted PISA score as a function of TIMSS score. Consequently, countries shown below the line have predicted PISA scores higher than the observed. That is, these countries performed relatively poorer in PISA than predicted. Countries above the line performed relatively better in PISA than predicted. It can be seen that, generally, Western countries performed better in PISA than predicted, and Eastern European and Asian countries generally performed worse in PISA than predicted. This observation prompted an investigation of whether factors relating to characteristics of Western and Eastern European/Asian countries may have an impact on TIMSS and PISA results.
Finding explanatory factors for within-country performance differences in PISA and TIMSS
Two factors have often been suggested to explain why within-country performance in PISA and TIMSS may be different (e.g., AIR, 2005; NECS, 2008). The first factor is that PISA sample is age-based, and TIMSS sample is grade-based. The second factor is that TIMSS test is curriculum-based, while PISA test is about the application of mathematics to everyday life, rather than covering all curriculum content. However, the actual impact of these two factors on TIMSS and PISA results has never been quantitatively substantiated. This paper sets out to establish whether these factors indeed have an impact on the results, and, if so, how much impact is associated with each factor. More specifically, we examine the impact of these
A Comparison of PISA and TIMSS 2003 achievement results
4
factors by using a regression model where PISA country mean score is the dependent variable to be predicted by a number of factors, and we use R2 as a measure of the proportion of variance explained by the factors for predicting PISA scores. To set the baseline for comparison of regression models, we note that the R2 for the base model (with TIMSS mathematics mean score as the only predictor) is 0.71 (see Figure 1). (If Indonesia and Tunisia are excluded, the R2 is 0.43.) That is, there is about 30% of the variance in PISA scores that are not explained by TIMSS scores for countries. Our aim is to check if differences in population definition and test content between the two studies can explain (at least) part of this 30% of “noise” in the base regression model.
Age-based versus Grade-based samples - “Age at time of testing in TIMSS” and “Number of years of schooling in PISA”
The difference between age-based and grade-based population definitions (and samples) is that, in PISA, all students are of similar age, but they can be in different grades across different countries, depending on the age of starting schooling in the country. On the other hand, for the grade-based samples in TIMSS, students are better aligned in terms of the number of years of schooling, but students could be of different age across countries because of the age of starting schooling. It is possible that in PISA some countries have 15 year-old students who generally have more years of schooling than students from another country. Similarly, it is possible that in TIMSS some countries have older students in Grade 8 than students from another country.
To gain a better understanding of the relationship between the age of students in the sample and the number of years of schooling, let us first consider some examples. If we define two variables: age at time of TIMSS test, and number of years of schooling at time of PISA test, we can see that these two variables are highly correlated with each other, as illustrated in Table 2.
[Place Table 2 about here]
Korea’s sample in TIMSS has an average age of 14.6. That is, students with 8 years of schooling in Korea are around 14.6 years of age. Therefore, when students in Korea reach 15.7 years old (the average of the PISA sample), one would expect the students to have 9 years of schooling. Similarly, for Norway, students are 13.8 years of age when they are in Grade 8. One would then expect 15.7 year-olds (the PISA sample) to be in Grade 10. More generally, we can write down the following relationship between the two variables:
number of years of schooling at time of PISA testing = (15.7 – age at time of TIMSS testing) + 8.
That is, these two variables are linearly related and should have a correlation close to one.
A Comparison of PISA and TIMSS 2003 achievement results
5
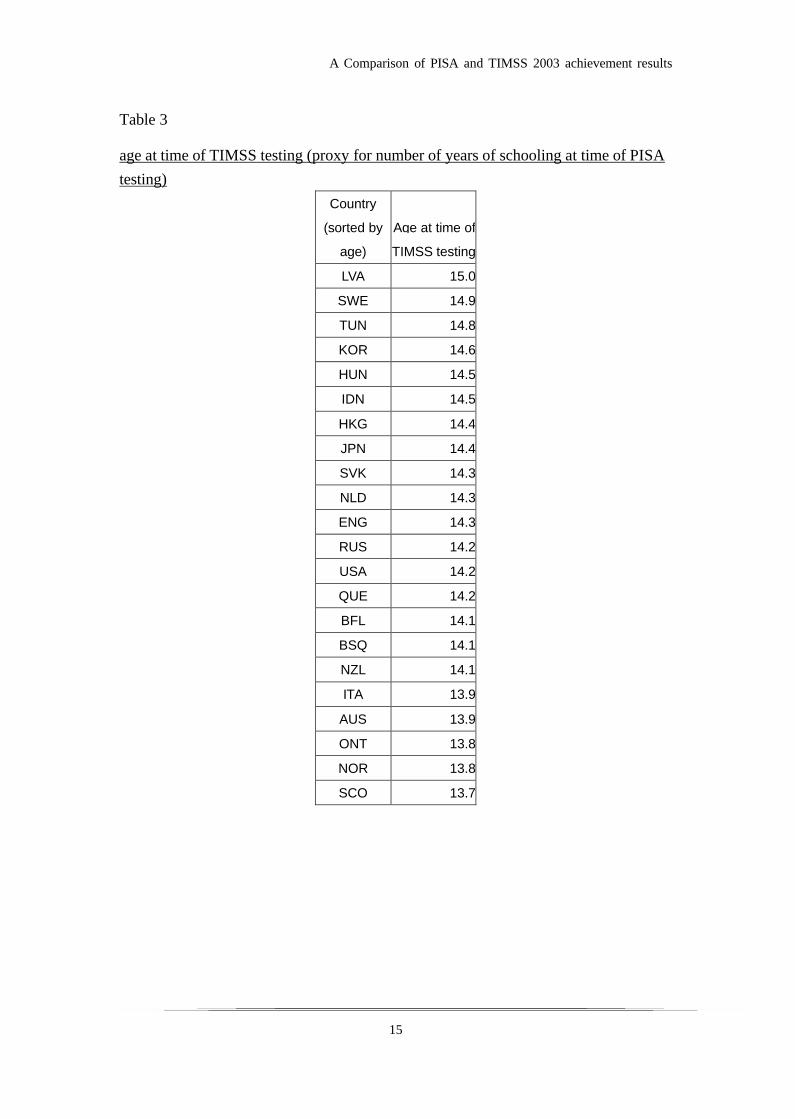
As IEA published the age at time of testing in the TIMSS 2003 international mathematics report (IEA, 2003), the construction of this variable is straightforward. PISA did not publish the number of years of schooling at time of testing, so we will need to construct the values for this variable from information on the distribution of grade levels, and the exact time of testing in PISA (e.g., at the end of the academic year, etc.). For this paper, we will only use age at time of TIMSS testing as our predictor variable. But it should be remembered that this variable can be regarded as a proxy for number of years of schooling at time of PISA testing. Table 3 shows the values for the 22 countries/regions.
[Place Table 3 about here]
If we use both TIMSS country mean score and age at time of TIMSS testing as predictors in a regression to predict PISA country mean score, the R2 is 0.82 (If Indonesia and Tunisia are excluded, the R2 is 0.53). This R2 shows that, with the addition of the factor, age at time of TIMSS testing, 11% more of the variance can be explained by the regression model. Table 10shows a summary of all regression models fitted and their respective R2 values.
Content Balance
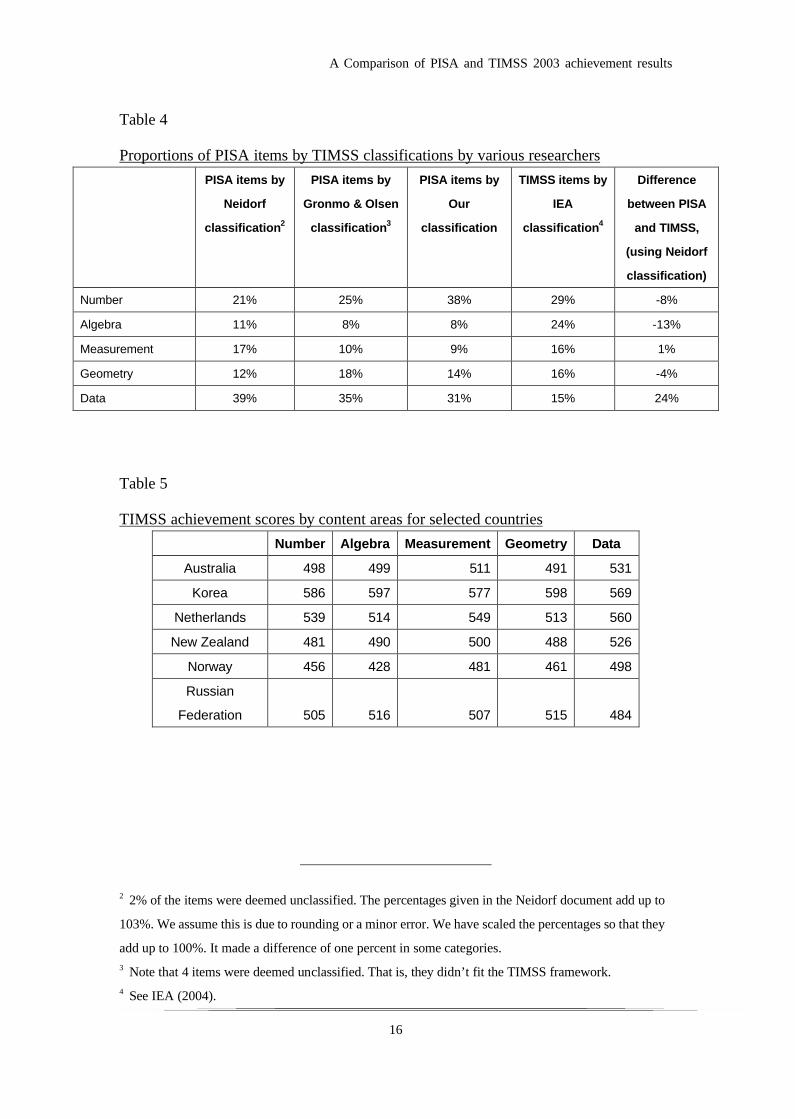
The second factor examined is content balance in the PISA and TIMSS Mathematics tests. As the TIMSS mathematics framework has different content classifications of items from the PISA mathematics framework, the first step in comparing the test contents of the two studies is to map the items in one study to the content classifications of the other study. We have chosen to map PISA items to TIMSS content classifications because TIMSS classifications are closer to curriculum topics commonly found in school mathematics, and there is an assumption that differences in country performance can be detected more markedly if curriculum topics are compared. In addition, PISA classifications do not cover all the TIMSS items such as context-free knowledge questions. The classification of PISA items according to TIMSS framework can be found in number of published reports, for example, Gronmo & Olsen (2008) and Neidorf, Binkley, Gattis, & Nohara (2006). We also conducted our own classification exercise as a check. Table 4 shows these classifications, together with the proportions of items in the TIMSS test.
[Place Table 4 about here]
From Table 4, it can be seen that the content balance of PISA differs from that of TIMSS, particularly in the areas of Algebra and Data. The classifications by Neidorf et al (2006), Gronmo & Olsen (2008), and by our expert panel all support the finding that PISA has more items classified as Data items, and fewer items classified as Algebra items, as compared to the TIMSS test. In the following analyses, we have chosen to use Neidorf’s classifications of
A Comparison of PISA and TIMSS 2003 achievement results
6
PISA items. However, the results are very similar whichever classification we use.
Differences in content balance between PISA and TIMSS may or may not have an impact on the overall performance of countries. If each country performed equally well in all content areas, then differences in content balance of a test should not affect the overall results. On the other hand, if each country has particular strengths and weaknesses in specific content areas, then the content balance of the test will have an impact on a country’s overall performance on the test.
As TIMSS and PISA both report performance by content areas, the relative strengths and weaknesses of each country can be examined. Table 5 shows six countries with their TIMSS scores by content area. It can be seen that there are some variations of performance across content areas within each country. For example, Australian students performed very well in the Data content area as compare to other content areas. If a test consists of a large proportion of Data items, then Australia could be seen as having some “advantage” over countries whose students do not perform well in the Data content area.
[Place Table 5 about here]
To formalise the idea of “content advantage” of a country so that the hypothesis of advantage and disadvantage can be tested, we constructed indices of “test advantage”. The methodology is presented below using Australia as an example.
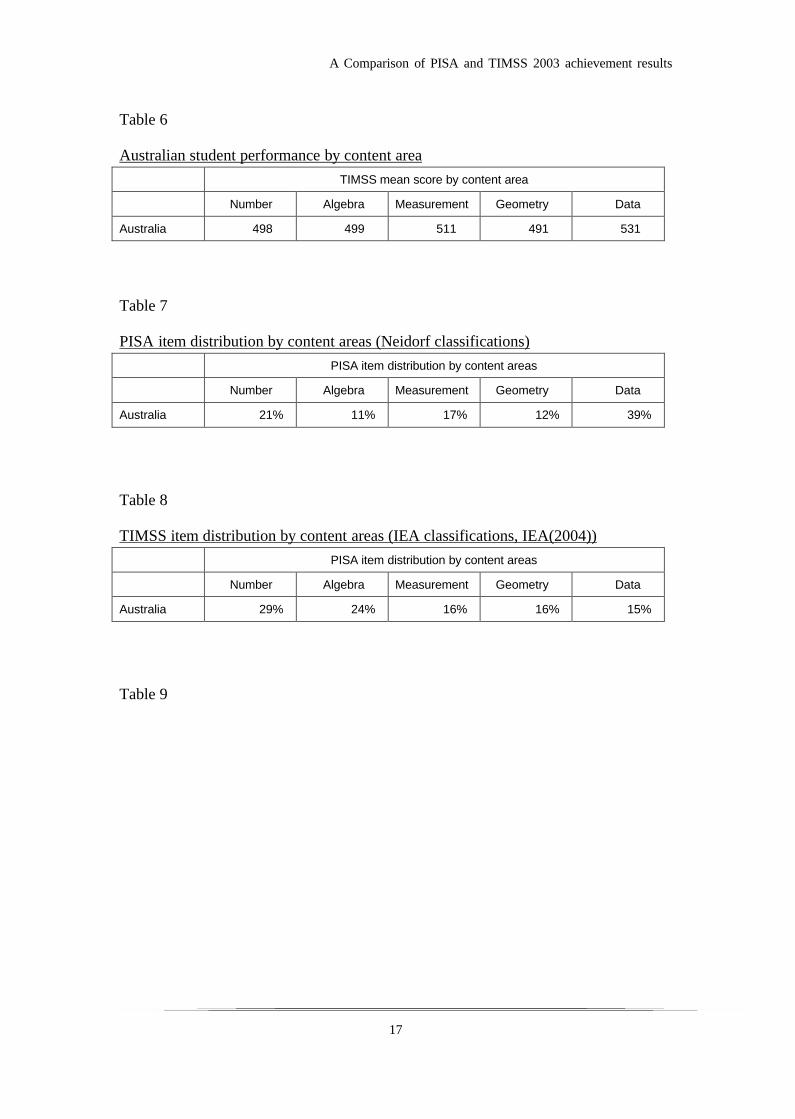
The TIMSS average scores by mathematics content areas for Australia are given in Table 6. The item distributions by content areas for PISA and for TIMSS are given in Table 7 and Table 8 respectively.
[Place Table 6, Table 7 and Table 8 about here]
If a test was assembled using the PISA item distribution by content areas (Table 7), then we would expect the overall score for Australia to be
498�21% + 499�11% + 511�17% + 491�12% + 531�39% = 512
If a test was assembled using the TIMSS item distribution by content areas (Table 8), then we would expect the overall score for Australia to be
498�29% + 499�24% + 511�16% + 491�16% + 531�15% = 505
The difference between 512 and 507 may be regarded as “content advantage” of PISA over TIMSS for Australia.
A Comparison of PISA and TIMSS 2003 achievement results
7
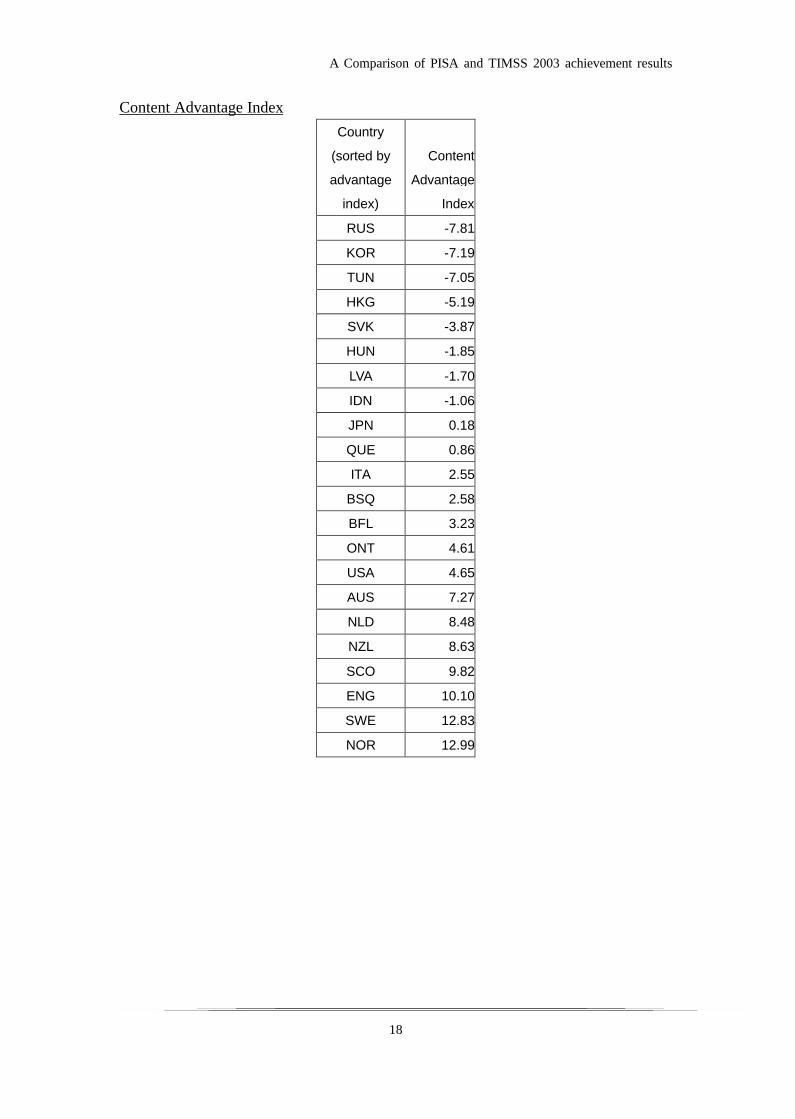
The Content Advantage Index shows how much advantage a country has in PISA as compared to in TIMSS. Thus, from the above computations, the PISA assessment gives Australia more “advantage” (7 units), than the TIMSS assessment in that Australia is likely to score higher in PISA than in TIMSS, given the composition of items from different content areas in PISA and in TIMSS.
The Content Advantage Indices were computed for all 22 countries/regions (Table 9). These indices were then used to predict PISA mathematics scores. A regression model with both TIMSS country mean scores and content advantage index as predictors for PISA country mean scores has an R2 of 0.92 (If Indonesia and Tunisia are excluded, the R2 is 0.74) (see Table 10). This R2 shows that, with the addition of the factor, content advantage, 21% more variance can be explained by the regression model than our base model which has only TIMSS country mean score as a predictor.
[Place Table 9 about here]
Combining explanatory factors
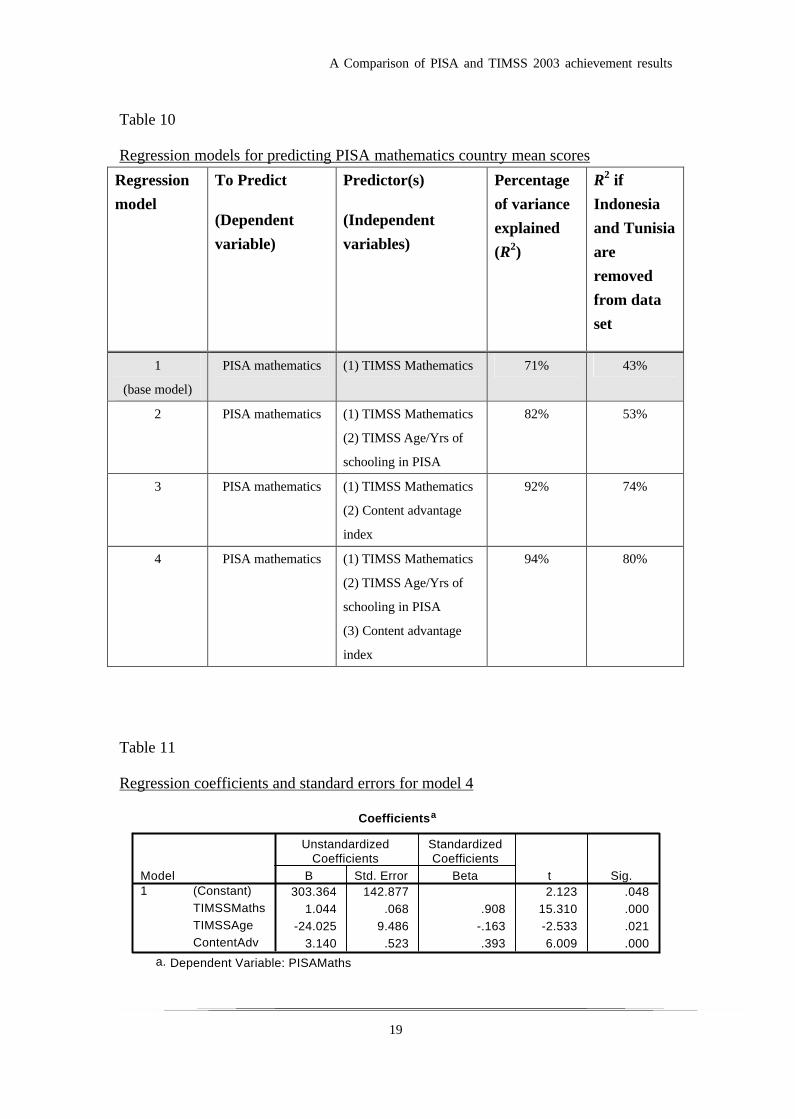
In the previous sections, two factors, Content Balance and Age at time of TIMSS testing (or Years of schooling at time of PISA testing), have been separately identified to have an association with the observed differences between countries’ TIMSS and PISA mean scores. In this section, we explore the combined impact of these two factors. To do this, multiple regression was carried out using PISA mathematics score as the dependent variable, and TIMSS Mathematics mean score, Content Balance and Age at time of TIMSS testing (or Years of schooling at time of PISA testing) as independent, or predictor, variables. The R2 from this model is 0.94 (If Indonesia and Tunisia are excluded, the R2 is 0.80).
[Place Table 10 about here]
It can be seen from Table 10 (Regression Model 4) that TIMSS Mathematics mean score, Content Balance and Age at time of TIMSS testing (or Years of schooling at time of PISAtesting) account for 94% of the variance of PISA mean scores. By including the two additional factors to the base model, an additional 23% of the variance can be account for. If Indonesia and Tunisia are excluded, the variance accounted for increases from 43% in the base model to 80% in model 4, an additional 37%.
For regression model 4, the regressions coefficients are all significantly different from zero. Table 11 shows the estimates of regression coefficients and corresponding standard errors.
A Comparison of PISA and TIMSS 2003 achievement results
8
[Place Table 11 about here]
From the above results, it would seem reasonable to conclude that both test content balance and years of schooling have an impact on country mean scores. Interestingly, both of these factors are also associated with country groups: Western versus Eastern European and Asian countries. A glance down Table 3 and Table 9 shows that, by and large, Eastern European and Asian countries have fewer years of schooling at time of PISA testing, and the PISA test content balance provides some advantage for Western countries. As cultural and educational traditions shape school systems and influence curriculum (Leung, Graf, & Lopez-Real, 2006), it is not surprising that we observed differential performance in the two studies between Western countries and Asian/Eastern European countries.
How well is the prediction at individual country level?
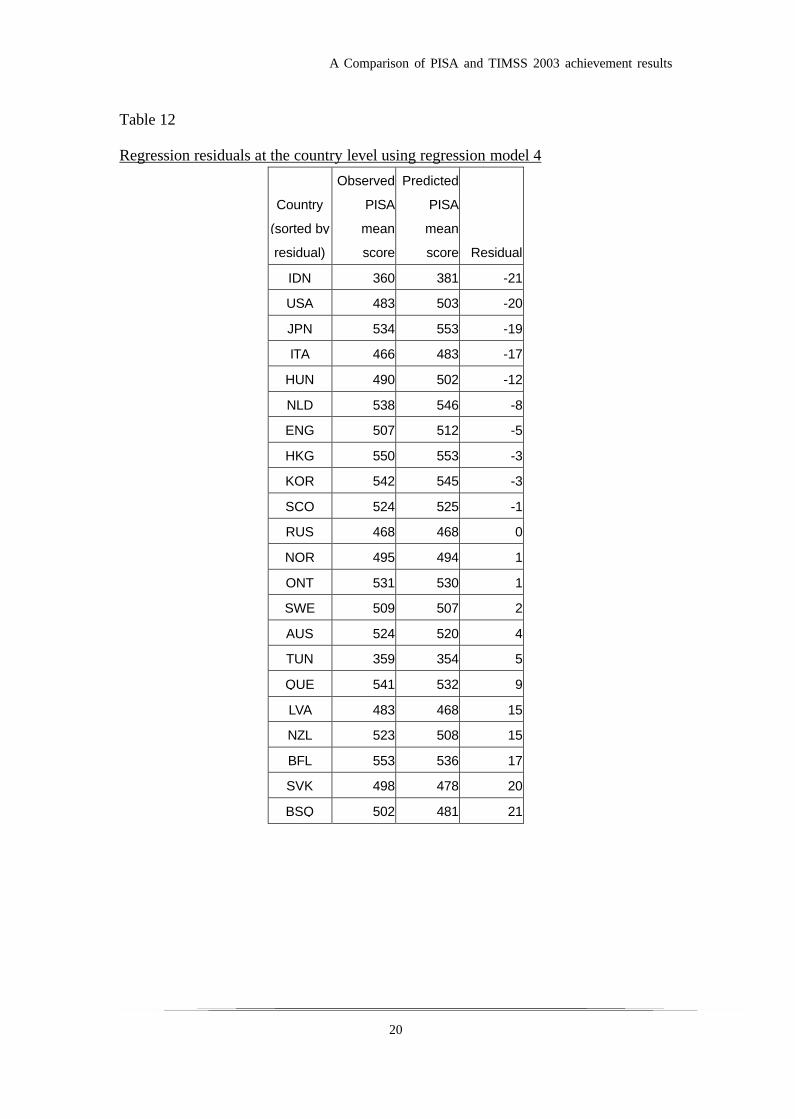
It is interesting to see how well regression model 4 can be used to predict each country’s PISA performance. Table 12 shows the observed, predicted and the residual values for the 22 participants for regression model 4.
[Place Table 12 about here]
While one cannot expect any statistical modeling to perfectly predict observed scores, it will be interesting to investigate the reasons for poor fit for some of the countries in Table 12. For example, it is possible that the indices were not well constructed for some countries, or there are other factors that have an impact on the differential performance in PISA and TIMSS.
Comparisons of Science performance in PISA and TIMSS
In comparing Science results between PISA and TIMSS, it must be remembered that Science was a minor domain in PISA 2003, with only 35 items (37 score points), while TIMSS had 189 items (211 score points). Any categorisation of PISA items will not likely provide reliable results due to the small number of items. A more comprehensive comparison could be between PISA 2006 and TIMSS 2007 surveys, where Science is the main domain in PISA 2006, when TIMSS 2007 results are released.
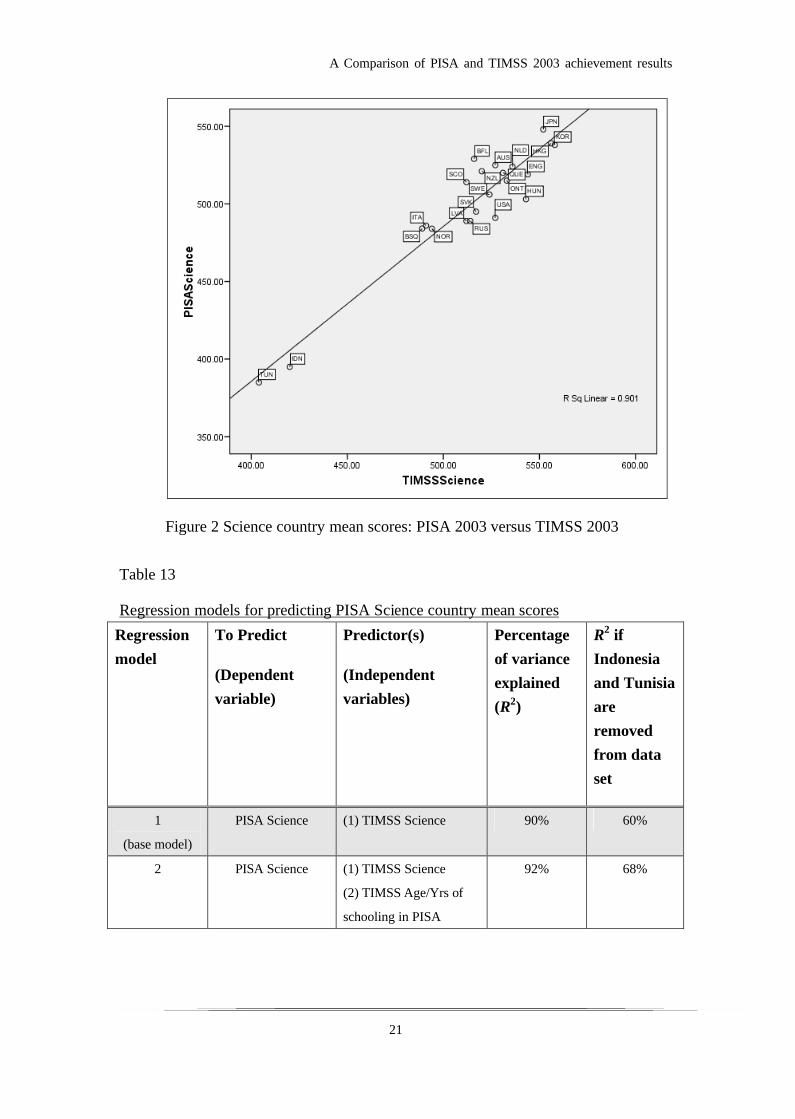
Figure 2 shows a plot of PISA Science country mean scores against TIMSS country mean scores. The line shown in Figure 2 is the line of best fit (regression line) for the data points.
[Place Figure 2 about here]
The correlation between PISA and TIMSS Science country mean scores is 0.95 (compared with 0.84 for Mathematics). If Indonesia and Tunisia are removed from the data set, the correlation is 0.79 (compared with 0.66 for Mathematics). The correlation for Science is much
A Comparison of PISA and TIMSS 2003 achievement results
9
higher than for Mathematics. The R2 is 0.90, indicating that the proportion of variance explained by TIMSS Science scores for predicting PISA scores is around 90%. If Indonesia and Tunisia are removed from the data set, the R2 is 0.60. The higher performance of Western countries in PISA Mathematics is not quite as clearly shown in PISA Science. While Eastern European countries (Russia, Latvia, Slovak Republic and Hungary) performed relatively better in TIMSS Science than in PISA Science, there is not a clear pattern of better performance in PISA Science for Western countries and Asian countries.
Table 13 summarises the proportion of variance explained from two different regression models.
[Place Table 13 about here]
The base model (TIMSS Science score as a predictor for PISA Science score) already has a high R2 value. With the additional predictor, TIMSS Age/Years of schooling in PISA, the R2
increases to 92% (68% if Indonesia and Tunisia are excluded).
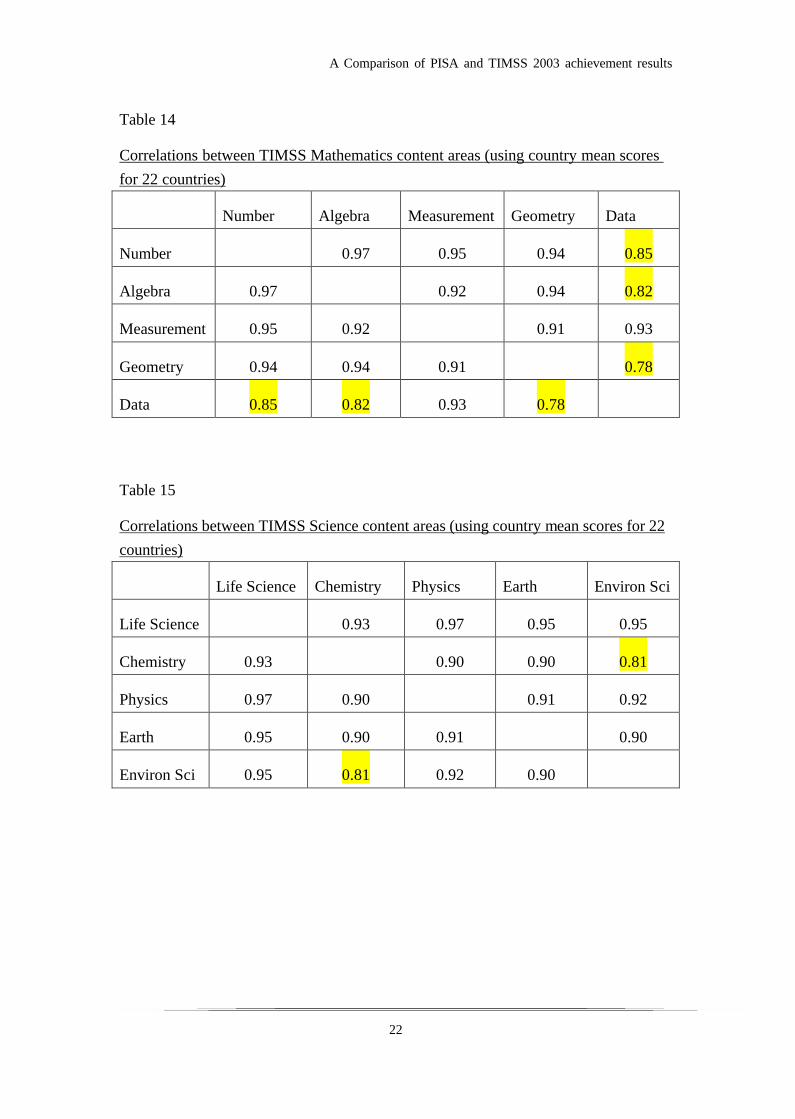
A further investigation into the reasons for the higher correlations between PISA and TIMSS Science scores as compared to Mathematic scores was carried out. It is conjectured that if variations of content area scores are small within each country, then the content balance of a test will not likely to have as severe an effect on the overall performance of a country as when there is a large within-country variation of scores by content areas. For the 22 countries/regions studied in the paper, Table 14 shows the correlations of country mean scores for content areas in Mathematics, and Table 15 shows the correlations of country mean scores for content areas in Science.
[Place Table 14 about here]
[Place Table 15 about here]
From Table 14 and Table 15, it can be seen that the correlations between Science content areasare generally higher than the correlations between Mathematics content areas. In particular, the Data content area in Mathematics appears to have the lowest correlation with the other content areas. That is, countries performing well in Data may not perform as well in the other content areas. Since there is an emphasis on the Data content area in the PISA test, it is not surprising that the overall Mathematics results at the country level are influenced by the different content balance in PISA and TIMSS. On the other hand, the differential performance in content areas in Science is less pronounced. This may account for the higher correlations between PISA and TIMSS science country mean scores.
However, we must not so hastily dismiss the importance of content balance in a Science test.
A Comparison of PISA and TIMSS 2003 achievement results
10
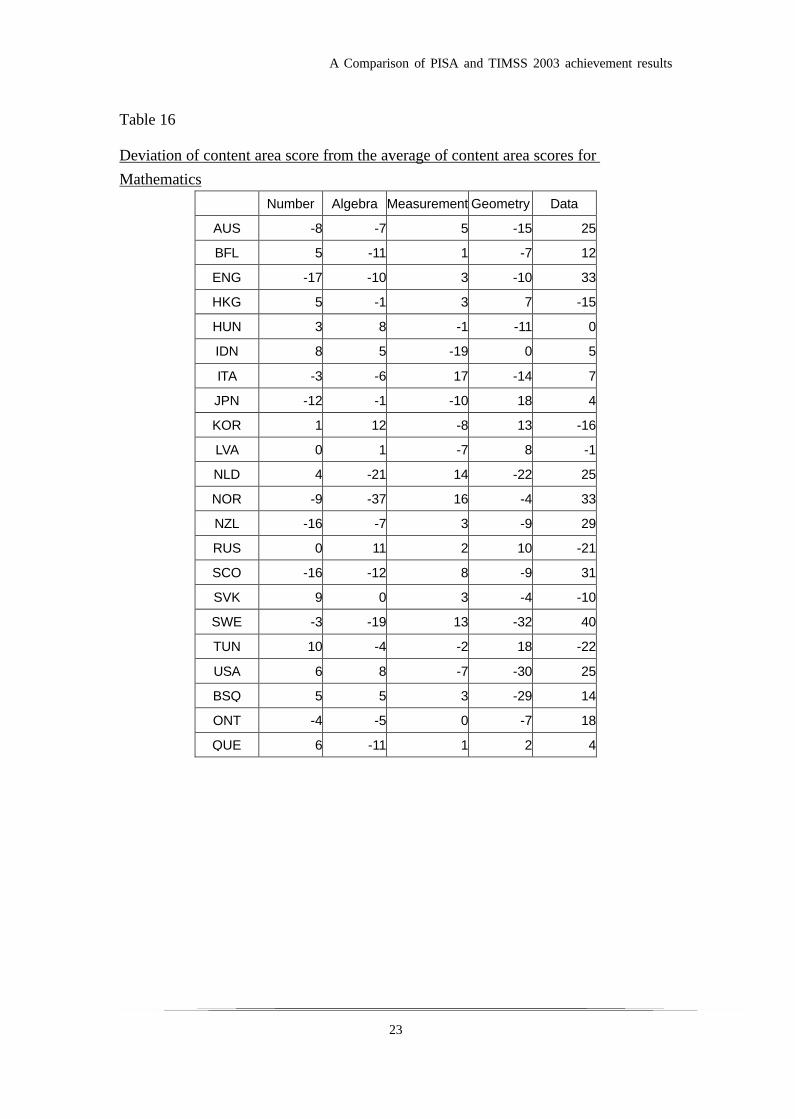
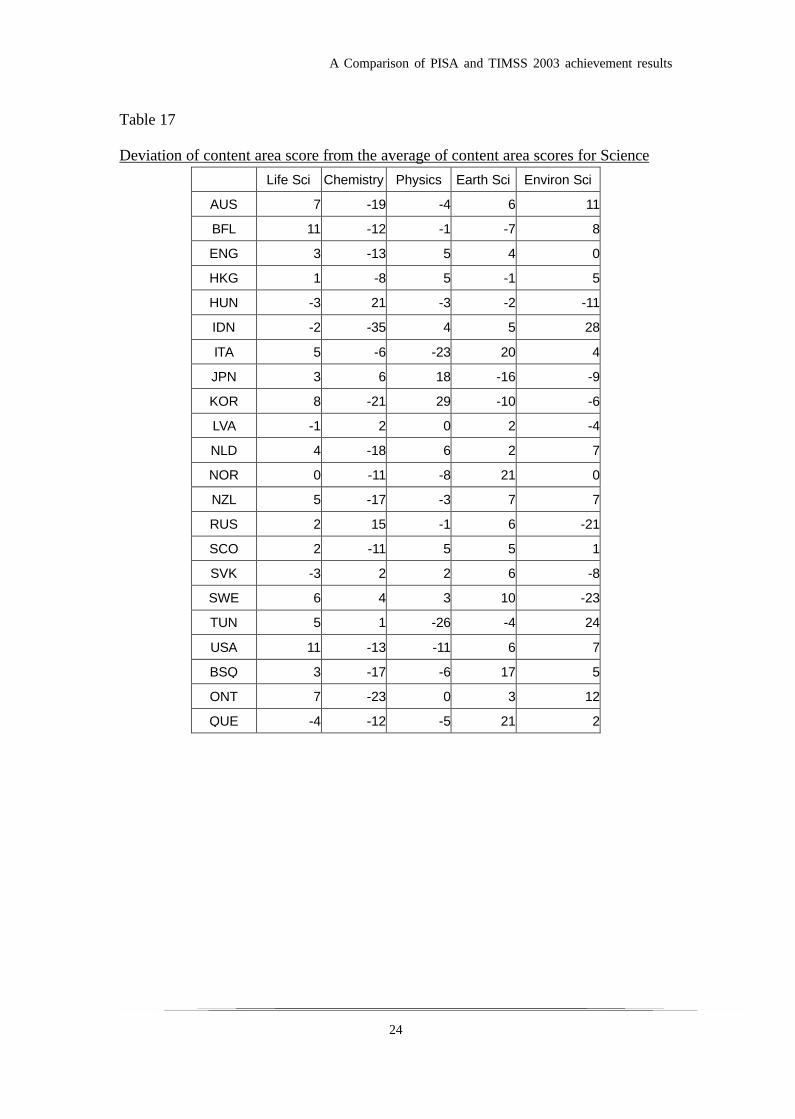
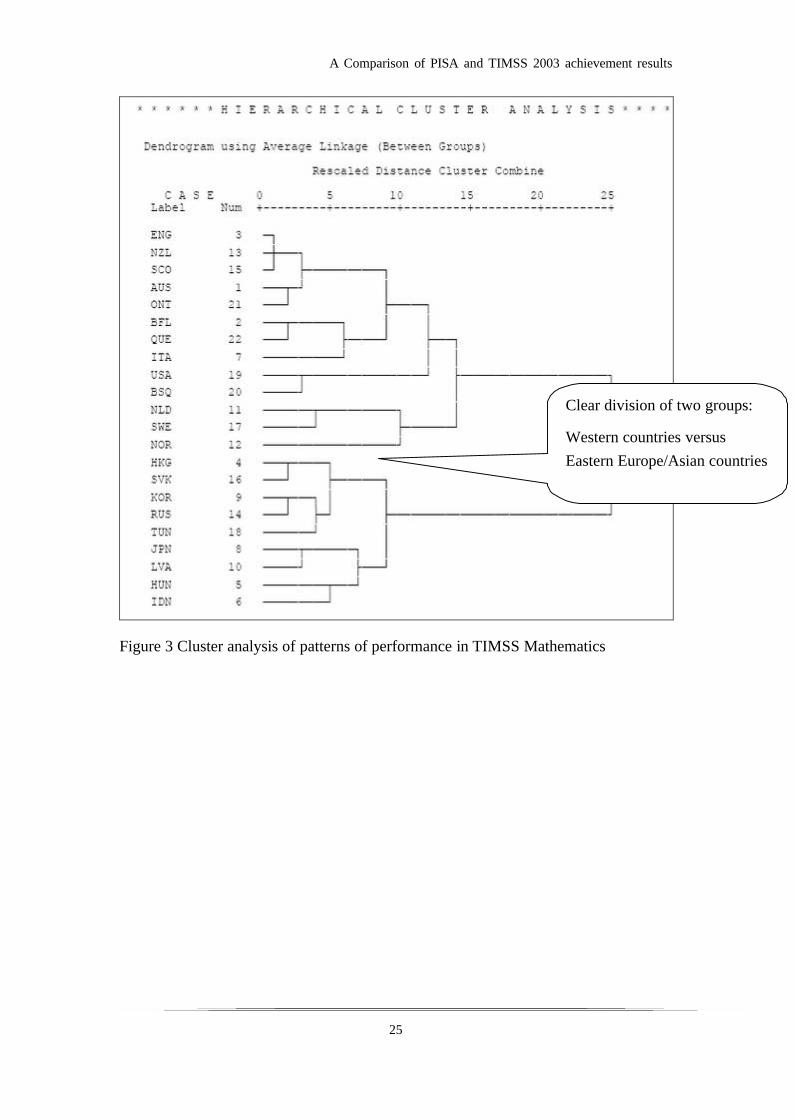
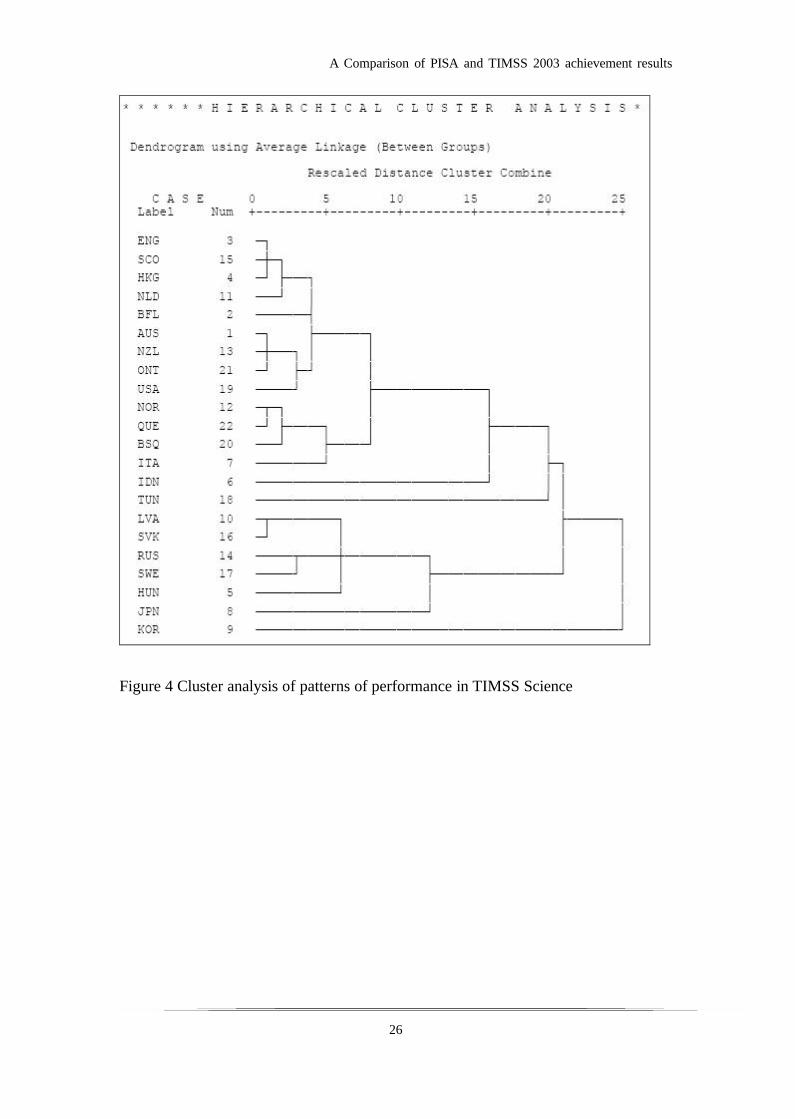
First, we have not yet established whether the PISA Science content balance is similar or different to that of TIMSS. Second, analyses of country performance patterns show that groups of countries share strengths and weaknesses in specific areas (e.g., OECD, 2007, p64-65). Table 16 and Table 17 show deviation scores of content areas from the average content area scores1 for TIMSS Mathematics and TIMSS Science respectively. Countries with similar patterns of deviation scores have similar relative strengths and weaknesses. A cluster analysis on the patterns of deviation scores for Mathematics is shown in Figure 3. It can be seen clearly that there are two groups of countries: Western countries form one group, and Eastern European and Asian countries form one group. In contrast, Figure 4 shows cluster analysis groupings of countries for TIMSS Science. There is not a clear division of West against East for Science. However, several groups of countries have been identified, such as ENG, SCO, and HKG as one group, AUS, NZL and ONT as one group, LVA and SVK as one group. These groupings seem to make sense and they could be expected.
[Place Table 16 and Table 17 about here]
[Place Figure 3 about here]
[Place Figure 4 about here]
What the cluster analysis has shown is that there are between country differences in terms of relative strengths and weaknesses across Science content areas, and therefore the contentbalance of a Science test is important, as varying the proportions of items from different content areas may have an impact on the results.
Discussions and Conclusions
The most important finding in this study is that differential performances of countries in TIMSS and PISA Mathematics can be largely accounted for by two factors. In particular, test content balance is the most significant factor. The other factor is years of schooling. While the R2 value is quite high in regression model 4 (Table 10), the model could be refined further in two ways. First, the construction of both the indices Content Balance and Years of schooling at time of PISA testing is only approximate. These indices could be re-constructed with more rigour. Second, other factors could be included in the model. For example, there is a very high correlation between PISA mathematics and PISA reading scores. As the PISA mathematics test has a higher reading load than the TIMSS mathematics test, reading ability can be used as
1 The average of the content area scores will not be the same as the overall subject score because
content areas have different number of items.
A Comparison of PISA and TIMSS 2003 achievement results
11
a predictor for PISA mathematics results. The overlap between document reading (e.g., graphs, charts and tables) and data interpretation in mathematics becomes blurred. We have carried out some initial work which indicated a high association between reading scores and scores on the Data content area in mathematics (The correlation is 0.91 between PISA country mean reading score and TIMSS Data country mean score for the 22 participants).
The identification of factors that explain differential rankings of countries in PISA and TIMSS is important in a number of ways. First, it provides a better understanding of the results in comparing country performances. We need to look beyond simple ranks of countries, and examine performances by sub-domains in the context of the population being tested. Often these details are just brushed aside, and inferences about the relative standings of countries are incorrectly drawn. Second, in monitoring trends from one study cycle to another, a country should check whether curriculum contents have shifted, and/or whether schooling systems have changed, before drawing conclusions about whether the standards have improved or declined. Third, for those who are responsible for putting together tests for monitoring student standards, it is important to realise how test content and population definition have a significant impact on the results. Any changes in student performance could easily be masked by varying test constructs and sampling methods.
The findings from this paper indicate that student achievements are closely related to what students are actually taught. On average, students with more number of years of schooling do better than students with fewer years of schooling. The comparative age of the students has less an impact on their achievement than the actual amount of instruction provided. Similarly, if a mathematics topic is not emphasised in the curriculum, the students are not likely to perform as well as for the topics that are emphasised. However, it is beyond the scope of this paper to make judgments on what should be included in a mathematics test, and how sampling should be carried out. These decisions will depend on the purposes of the assessments and how the assessment results are used.
In conclusion, this paper confirms some conjectures by researchers why country performances are not aligned between PISA and TIMSS. The paper shows that the differences between PISA and TIMSS results are not simply due to random errors in the studies. Rather, there are systematic differences in the survey designs that can explain the mismatch. We are fortunate that two international studies conducted in parallel provide us with the unique opportunity to carry out an in-depth analysis of factors that affect performance results. However, while it is reassuring that the results from the two surveys can be corroborated quantitatively, it may also suggest that there is some duplication in the outcomes of the surveys, at least in the results at the country mean score level.
A Comparison of PISA and TIMSS 2003 achievement results
12
ReferencesAIR (2005). Reassessing U.S. International Mathematics Performance: New Findings from the 2003
TIMSS and PISA. American Institutes for Research, Washington.
Brown, G., Micklewright, J., Schnepf, S., & Waldmann, R. (2007). International surveys of educational
achievement: how robust are the findings. J.R., Statis. Soc. A, 170, Part3, pp. 623-646.
Gronmo, L., & Olsen, R. (2008). TIMSS versus PISA: the case of pure and applied mathematics.
Retrieved February, 2008, from
http://www.timss.no/publications/IRC2006_Gronmo&Olsen.pdf
IEA (2003). TIMSS 2003 International Mathematics Report. Chestnut Hill, M.A: TIMSS
International Study Centre.
IEA (2004). TIMSS 2003 Technical Report. Chestnut Hill, M.A: TIMSS International Study Centre.
Leung, F.K.S., Graf, K-D., & Lopez-Real, F.J. (Eds.) (2006). Mathematics Education in Different
Cultural Traditions – A Comparative Study of East Asia and the West. The 13th ICMI Study.
Springer.
Neidorf, T.S., Binkley, M., Gattis, K., and Nohara, D. (2006). Comparing Mathematics Content in the
National Assessment of Educational Progress (NAEP), Trends in International Mathematics
and Science Study (TIMSS), and Program for International Student Assessment (PISA) 2003
Assessments (NCES 2006-029). U.S. Department of Education. Washington, DC: National
Center for Education Statistics.
OECD (2003). Learning for tomorrow’s world – First results from PISA 2003. Paris: OECD.
OECD (2007). PISA 2006 Science competencies for tomorrow’s world. Volume 1 Analysis. Paris:
OECD.
Turner, R. & Adams, R. J., (2007). The programme for international student assessment: An overview.
Journal of Applied Measurement, 8(3), 237-248.
A Comparison of PISA and TIMSS 2003 achievement results
13
Table 1
List of Countries Participating in both TIMSS 2003 (Grade 8) and PISA 2003
Country Code Country NameAUS Australia
BFL Belgium(Flemish)
BSQ Basque Country, Spain
ENG England
HKG Hong Kong
HUN Hungary
IDN Indonesia
ITA Italy
JPN Japan
KOR Korea
LVA Latvia
NLD The Netherlands
NOR Norway
NZL New Zealand
ONT Ontario, Canada
QUE Quebec, Canada
RUS Russia
SCO Scotland
SVK Slovak Republic
SWE Sweden
TUN Tunisia
USA United States
A Comparison of PISA and TIMSS 2003 achievement results
14
600550500450400
TIMSSMaths
600
550
500
450
400
350
PISA
Mat
hs
QUEONT
BSQ
USA
TUN
SWE
SVK
SCO
RUS
NZL
NOR
NLD
LVA
KORJPN
ITA
IDN
HUN
HKG
ENG
BFL
AUS
R Sq Linear = 0.709
Figure 1 Mathematics country mean scores: PISA 2003 versus TIMSS 2003
Table 2
Relationship between age at time of testing in TIMSS and years of schooling at time of testing in PISA
Average age at time of TIMSS test (at 8 years of schooling)
Number of years of schooling at time of PISA test (at 15.7 years old)
Korea 14.6 around 9
Norway 13.8 around 10
A Comparison of PISA and TIMSS 2003 achievement results
15
Table 3
age at time of TIMSS testing (proxy for number of years of schooling at time of PISA testing)
Country
(sorted by
age)
Age at time of
TIMSS testing
LVA 15.0
SWE 14.9
TUN 14.8
KOR 14.6
HUN 14.5
IDN 14.5
HKG 14.4
JPN 14.4
SVK 14.3
NLD 14.3
ENG 14.3
RUS 14.2
USA 14.2
QUE 14.2
BFL 14.1
BSQ 14.1
NZL 14.1
ITA 13.9
AUS 13.9
ONT 13.8
NOR 13.8
SCO 13.7
A Comparison of PISA and TIMSS 2003 achievement results
16
Table 4
Proportions of PISA items by TIMSS classifications by various researchersPISA items by
Neidorf
classification2
PISA items by
Gronmo & Olsen
classification3
PISA items by
Our
classification
TIMSS items by
IEA
classification4
Difference
between PISA
and TIMSS,
(using Neidorf
classification)
Number 21% 25% 38% 29% -8%
Algebra 11% 8% 8% 24% -13%
Measurement 17% 10% 9% 16% 1%
Geometry 12% 18% 14% 16% -4%
Data 39% 35% 31% 15% 24%
Table 5
TIMSS achievement scores by content areas for selected countriesNumber Algebra Measurement Geometry Data
Australia 498 499 511 491 531
Korea 586 597 577 598 569
Netherlands 539 514 549 513 560
New Zealand 481 490 500 488 526
Norway 456 428 481 461 498
Russian
Federation 505 516 507 515 484
2 2% of the items were deemed unclassified. The percentages given in the Neidorf document add up to
103%. We assume this is due to rounding or a minor error. We have scaled the percentages so that they
add up to 100%. It made a difference of one percent in some categories.3 Note that 4 items were deemed unclassified. That is, they didn’t fit the TIMSS framework.4 See IEA (2004).
A Comparison of PISA and TIMSS 2003 achievement results
17
Table 6
Australian student performance by content areaTIMSS mean score by content area
Number Algebra Measurement Geometry Data
Australia 498 499 511 491 531
Table 7
PISA item distribution by content areas (Neidorf classifications)PISA item distribution by content areas
Number Algebra Measurement Geometry Data
Australia 21% 11% 17% 12% 39%
Table 8
TIMSS item distribution by content areas (IEA classifications, IEA(2004))PISA item distribution by content areas
Number Algebra Measurement Geometry Data
Australia 29% 24% 16% 16% 15%
Table 9
A Comparison of PISA and TIMSS 2003 achievement results
18
Content Advantage IndexCountry
(sorted by
advantage
index)
Content
Advantage
Index
RUS -7.81
KOR -7.19
TUN -7.05
HKG -5.19
SVK -3.87
HUN -1.85
LVA -1.70
IDN -1.06
JPN 0.18
QUE 0.86
ITA 2.55
BSQ 2.58
BFL 3.23
ONT 4.61
USA 4.65
AUS 7.27
NLD 8.48
NZL 8.63
SCO 9.82
ENG 10.10
SWE 12.83
NOR 12.99
A Comparison of PISA and TIMSS 2003 achievement results
19
Table 10
Regression models for predicting PISA mathematics country mean scoresRegression model
To Predict
(Dependent variable)
Predictor(s)
(Independent variables)
Percentage of variance explained (R2)
R2 if Indonesia and Tunisia are removed from data set
1
(base model)
PISA mathematics (1) TIMSS Mathematics 71% 43%
2 PISA mathematics (1) TIMSS Mathematics
(2) TIMSS Age/Yrs of
schooling in PISA
82% 53%
3 PISA mathematics (1) TIMSS Mathematics
(2) Content advantage
index
92% 74%
4 PISA mathematics (1) TIMSS Mathematics
(2) TIMSS Age/Yrs of
schooling in PISA
(3) Content advantage
index
94% 80%
Table 11
Regression coefficients and standard errors for model 4
Coefficientsa
303.364 142.877 2.123 .0481.044 .068 .908 15.310 .000
-24.025 9.486 -.163 -2.533 .0213.140 .523 .393 6.009 .000
(Constant)TIMSSMathsTIMSSAgeContentAdv
Model1
B Std. Error
UnstandardizedCoefficients
Beta
StandardizedCoefficients
t Sig.
Dependent Variable: PISAMathsa.
A Comparison of PISA and TIMSS 2003 achievement results
20
Table 12
Regression residuals at the country level using regression model 4
Country
(sorted by
residual)
Observed
PISA
mean
score
Predicted
PISA
mean
score Residual
IDN 360 381 -21
USA 483 503 -20
JPN 534 553 -19
ITA 466 483 -17
HUN 490 502 -12
NLD 538 546 -8
ENG 507 512 -5
HKG 550 553 -3
KOR 542 545 -3
SCO 524 525 -1
RUS 468 468 0
NOR 495 494 1
ONT 531 530 1
SWE 509 507 2
AUS 524 520 4
TUN 359 354 5
QUE 541 532 9
LVA 483 468 15
NZL 523 508 15
BFL 553 536 17
SVK 498 478 20
BSQ 502 481 21
A Comparison of PISA and TIMSS 2003 achievement results
21
Figure 2 Science country mean scores: PISA 2003 versus TIMSS 2003
Table 13
Regression models for predicting PISA Science country mean scoresRegression model
To Predict
(Dependent variable)
Predictor(s)
(Independent variables)
Percentage of variance explained (R2)
R2 if Indonesia and Tunisia are removed from data set
1
(base model)
PISA Science (1) TIMSS Science 90% 60%
2 PISA Science (1) TIMSS Science
(2) TIMSS Age/Yrs of
schooling in PISA
92% 68%
A Comparison of PISA and TIMSS 2003 achievement results
22
Table 14
Correlations between TIMSS Mathematics content areas (using country mean scores for 22 countries)
Number Algebra Measurement Geometry Data
Number 0.97 0.95 0.94 0.85
Algebra 0.97 0.92 0.94 0.82
Measurement 0.95 0.92 0.91 0.93
Geometry 0.94 0.94 0.91 0.78
Data 0.85 0.82 0.93 0.78
Table 15
Correlations between TIMSS Science content areas (using country mean scores for 22 countries)
Life Science Chemistry Physics Earth Environ Sci
Life Science 0.93 0.97 0.95 0.95
Chemistry 0.93 0.90 0.90 0.81
Physics 0.97 0.90 0.91 0.92
Earth 0.95 0.90 0.91 0.90
Environ Sci 0.95 0.81 0.92 0.90
A Comparison of PISA and TIMSS 2003 achievement results
23
Table 16
Deviation of content area score from the average of content area scores for Mathematics
Number Algebra Measurement Geometry Data
AUS -8 -7 5 -15 25
BFL 5 -11 1 -7 12
ENG -17 -10 3 -10 33
HKG 5 -1 3 7 -15
HUN 3 8 -1 -11 0
IDN 8 5 -19 0 5
ITA -3 -6 17 -14 7
JPN -12 -1 -10 18 4
KOR 1 12 -8 13 -16
LVA 0 1 -7 8 -1
NLD 4 -21 14 -22 25
NOR -9 -37 16 -4 33
NZL -16 -7 3 -9 29
RUS 0 11 2 10 -21
SCO -16 -12 8 -9 31
SVK 9 0 3 -4 -10
SWE -3 -19 13 -32 40
TUN 10 -4 -2 18 -22
USA 6 8 -7 -30 25
BSQ 5 5 3 -29 14
ONT -4 -5 0 -7 18
QUE 6 -11 1 2 4
A Comparison of PISA and TIMSS 2003 achievement results
24
Table 17
Deviation of content area score from the average of content area scores for ScienceLife Sci Chemistry Physics Earth Sci Environ Sci
AUS 7 -19 -4 6 11
BFL 11 -12 -1 -7 8
ENG 3 -13 5 4 0
HKG 1 -8 5 -1 5
HUN -3 21 -3 -2 -11
IDN -2 -35 4 5 28
ITA 5 -6 -23 20 4
JPN 3 6 18 -16 -9
KOR 8 -21 29 -10 -6
LVA -1 2 0 2 -4
NLD 4 -18 6 2 7
NOR 0 -11 -8 21 0
NZL 5 -17 -3 7 7
RUS 2 15 -1 6 -21
SCO 2 -11 5 5 1
SVK -3 2 2 6 -8
SWE 6 4 3 10 -23
TUN 5 1 -26 -4 24
USA 11 -13 -11 6 7
BSQ 3 -17 -6 17 5
ONT 7 -23 0 3 12
QUE -4 -12 -5 21 2
A Comparison of PISA and TIMSS 2003 achievement results
25
Figure 3 Cluster analysis of patterns of performance in TIMSS Mathematics
Clear division of two groups:
Western countries versus Eastern Europe/Asian countries
A Comparison of PISA and TIMSS 2003 achievement results
26
Figure 4 Cluster analysis of patterns of performance in TIMSS Science