a cross-country empirical analysis of international...
TRANSCRIPT

A Cross-Country Empirical Analysis of International Reserves*
by
Yin-Wong Cheung
University of California, Santa Cruz, USA
and
Hiro Ito Portland State University, Portland, USA
April 2007 * We thank Menzie Chinn, Jie Li, Cedlic Tille, Joseph Gruber, and participants of the 2006 APEA conference for their helpful comments and suggestions, Dickson Tam for compiling some of the data, and Philip Lane and Gian Maria Milesi-Ferreti for making their data on external financial wealth available online. Cheung acknowledges the financial support of faculty research funds of the University of California, Santa Cruz. Ito acknowledges the financial support of faculty research funds of Portland State University and the Japan Foundation. Corresponding addresses: Yin-Wong Cheung: Department of Economics, E2, University of California, Santa Cruz, CA
95064, USA. Email: [email protected] . Hiro Ito: Department of Economics, Portland State University, 1721 SW Broadway, Portland,
OR 97201, USA. Email: [email protected] .

A Cross-Country Empirical Analysis of International reserves
Abstract
Using data from more than 100 economies for the period of 1975 to 2004, we conduct an
extensive empirical analysis of the determinants of international reserve holdings. Four groups of
determinants, namely, traditional macro variables, financial variables, institutional variables, and
dummy variables that control for individual economies’ characteristics are considered. We find
that the relationship between international reserves and their determinants is different between
developed and developing economies and is not stable over time. The estimation results indicate
that, especially during the recent period, a developed economy tends to hold a lower level of
international reserves than a developing one. Furthermore, there is only limited evidence that
East Asian economies including China and Japan are hoarding an excessive amount of
international reserves.
Keywords: Developed Vs Developing Economies, Excess Hoarding, Macro Determinants,
Financial Factors, Institutional Variables JEL Classification: F31, F34, F36

1
1. Introduction
The recent Asian financial crisis has rekindled considerable interest in examining the
behavior of international reserve hoarding. The fundamental rationale for holding international
reserves ranges from transaction demand, precautionary motives, collateral asset argument, and
mercantilist behavior. Although numerous studies have attempted to unravel the relevance of
these factors, the debate on the determinants of international reserves is far from settled. The
difficulty of explicating international reserve holding behavior may be attributed to the anecdotal
view that the role and functionality of international reserves have evolved along with
developments in global financial markets. For instance, the holding of international reserves is
now increasingly susceptible to capital account transactions because of the continuing financial
globalization and innovative advancements in international capital markets. The recent financial
crisis also signified the importance of expectations, policy credibility, and institutional structures
in determining the adequate level of international reserves.1
One of the unique features of the Asian financial crisis is that some economies in the
region have been accumulating international reserves at an astonishing rate in the aftermath of
the event. The first few years of the 21st century have witnessed an unprecedented growth of
global international reserves – a growth rate of over 89.2% between 2000 and 2004, which was
driven by a handful of economies. During the period, China, Japan, Korea, Malaysia and Taiwan
have increased their international reserve holdings by 262%, 133%, 107%, 124% and 126%,
respectively.2 Figure 1 presents the evolution of global international reserves and international
reserves held by some selected economies.
The phenomenal build-up by these economies has revived research interest in the
determinants of international reserves. Some studies focus on the buffer-stock and precautionary
demand motivation and incorporate the crisis-induced costs of output and investment
contractions (Aizenman et al. 2003; Lee, 2004). Dooley et al. (2005), in a series of papers,
resurrects the mercantilist view and suggest that international reserve accumulation in East Asia
is a consequence of export-oriented growth strategy and the absence of a well-functioning
domestic and/or regional financial system. Aizenman and Lee (2005) empirically confirm the 1 Some recent studies on the recent crisis are Krugman (1999), Corsetti, Pesenti and Roubini (1999), Chang and Velasco (1999) and Dooley (2000). 2 Japan, China, and Taiwan are the three largest holders of international reserves. During this period, Russia and India increased international reserves by 354% and 219%, respectively. Some developed countries also experienced a sharp increase such as Australia (95.7%) and Denmark (154.4%).

2
mercantilist motivation, but find that, compared with the precautionary demand, the mercantilist
motivation accounts for a relatively small amount of international reserve hoarding. Other
determinants for international reserve holding considered in recent studies include short-term
external debts, financial development, and political and institutional factors.3
The recent developments in the literature on international reserves have raised a few
questions. For instance, to what extent do these new factors help us understand the observed
holding of international reserves? Are these new factors complements or substitutes for the “old”
traditional economic variables? Do these new factors explain observed holdings of international
reserves even before they were identified in the literature? Have the determinants of international
reserve holding changed over time? Answers to these questions should shed some insight on the
evolution of the behavior of demand for international reserves. In addition, an empirical analysis
should allow us to assess whether economies are holding deficient or excessive levels of
international reserves.
To investigate these questions, we conduct an extensive empirical analysis using data
from more than 100 economies during the period of 1975 to 2004. In designing the empirical
architecture, we take into account of some known results in the literature. For instance, previous
studies have documented that developed and developing economies display different demand for
international reserves (Frenkel 1974a). Others have evidenced that the nature of the demand for
international reserves has changed in the presence of significant historical events such as the
breakdown of the Bretton Woods system and oil crises (Bahmani-Oskooee, 1988; Frenkel, 1980;
Lizondo and Mathieson 1987). Most recently, Aizenman et al. (2004) also identify structural
changes in the Korean international reserve holding after the Asian financial crisis. Hence, in this
study, we sort the economies into two groups, the developed and developing economies, and
investigate the determinants of the demand for international reserves in non-overlapping sample
periods that are partitioned by major crisis episodes.
Following the development in the theoretical literature, we consider four groups of
explanatory variables: traditional macro variables, financial variables, institutional variables, and
dummy variables that control for individual economies’ characteristics. To anticipate the results,
we confirm that the demand for international reserves of developed economies is different from
that of developing economies. The set of (significant) explanatory variables also changes across
3 See, for example, Aizenman and Marion (2001, 2003, 2004), Alfaro, et al. (2003), and Greenspan (1999).
3
different sample periods. There is evidence that the holding pattern of international reserves has
been affected by the occurrences of the debt crisis in the 1980s, and the Tequila crisis and the
Asian crisis in the 1990s.
Among the determinants of international reserves, we find that the propensity to import, a
proxy for trade openness, is the only factor that is significant in almost all the specifications and
samples under consideration. However, its explanatory power has been declining over time for
both developed and developing economies. On the other hand, the explanatory ability of
financial variables, especially those related to external financing, has been increasing over time.
Our evidence suggests that, compared with developing economies, the developed
economies enjoy a “premium” in accumulating international reserves since the early 1980s –
they could afford to hold lower levels of international reserves, ceteris paribus, than developing
ones if they faced the same economic conditions. Moreover, our estimation results present only
limited evidence that East Asian economies including China and Japan are hoarding an excessive
amount of international reserves.
A brief review of these determinants of international reserves is given in the next section.
Section 3 contains the main regression results. It presents the empirical framework and discusses
results from different sample periods and different country groups. Additional analyses are
reported in Section 4. Specifically, we compare the patterns of international reserve holdings
between developed and developing economies. Also, in view of the recent debate, we assess
whether some economies are holding an excessively high level of international reserves in the
recent period. Concluding remarks are offered in Section 5.
2. A Brief Review on the Determinants of International reserves
We first group the determinants of international reserves into three categories: traditional
macro variables, financial variables, and institutional variables, to trace the theoretical
developments and to examine how contributions of the determinants have evolved over time.
Readers familiar with the effects of these variables may like to proceed directly to Section 3.
The group of traditional macro variables consists of the propensity to import, volatility of
real export receipts, international reserve volatility, the opportunity cost of holding international
reserves, real per capita GDP, and population. These variables have been commonly considered
as determinants since the 1960s. In the early stage of theorization, the demand for international

4
reserves is mainly attributed to the need for accommodating imbalances arising from trade
account transactions, which are the main type of balance of payments transactions before the
development of modern international capital markets.
Heller (1966) argues that the demand for international reserves should be negatively
related to the marginal propensity to import because a higher propensity to import (m) implies a
smaller marginal cost of balance of payments adjustment (i.e., 1/m), and, thereby, a lower
demand for international reserves. However, most empirical exercises – including Heller (1966)
himself – use the average, and not the marginal, propensity to import. Frenkel (1974b) argues
that the average propensity to import, i.e., the imports-to-GDP ratio, measures trade openness
and, therefore, should have a positive effect on the demand for international reserves because of
the precautionary holding to accommodate external shocks through trade channels.
The role of international reserve volatility is illustrated by the buffer stock model of
international reserves. Extending the model for cash holding, Frenkel and Jovanovic (1981)
illustrate the effect of international reserve volatility in a stochastic inventory control setting. In
some studies, the volatility of real export receipts is used as an alternative proxy for the
uncertainty of balance of payments (Kelly, 1970).
The opportunity cost of holding international reserves, which is commonly measured by
the difference between the local interest rate and the US interest rate, has been included in
models that compare the costs and benefits of holding international reserves (Heller, 1966;
Frenkel and Jovanovic, 1981). The effect of the opportunity cost is quite inconspicuous in the
empirical literature, mainly due to the difficulty in assigning a single interest rate for
international reserve assets while accounting for their risks.4
Following Aizenman and Marion (2003), Edison (2003), and Lane and Burke (2001), real
per capita GDP and population are included to capture the size effect on international reserve
holding. In view of the Baumol (1952) square-root rule for transaction demand, we expect these
size variables to have a negative coefficient.
The second group of explanatory variables includes money supply, external debts, and
capital flows. The use of money in explaining the hoarding of international reserves can be dated
back to the 1950s. Courchene and Youssef (1967), for example, appeal to the monetarist model
4 The ideal proxy would be the difference in the yield between domestic government bonds and US-dollar denominated bonds. However, due to data availability, we use the differential between domestic lending rates and U.S. Treasury bill rates.

5
of balance of payments to justify the use of money in their international reserve regression
(Johnson, 1958).5 More recently, de Beaufort Wijnholds and Kapteyn (2001) argue that money
stock in an economy is a proxy for potential capital flight by domestic residents and, therefore,
can be a measure of the intensity of the “internal drain.”6
The implications of external debts and capital flows on the holding of international
reserves have received considerable attention after the Asian financial crisis. While capital
inflows can enhance economic growth by supplementing domestic savings and/or financial
intermediaries and improving the efficiency of domestic financial markets, a sudden capital flow
reversal can devastate an economy, trigger a crisis, and cause significant output losses.7
Generally, developing economies with inefficient and immature financial sectors are vulnerable
to the adverse effect of capital reversals. Thus, it is conceived that economies with a high level of
exposure to external financing, whether they are debts, FDI, or portfolio flows, should hold a
high level of international reserves to reduce its vulnerability to financial crises and to boost
confidence in their currencies (Aizenman et al., 2004; Feldstein, 1999).8
Dooley, et al. (2005) offers an alternative view on the link between capital flows and
international reserves. These authors argue that in the current international financial framework
(the “Bretton Woods II system”), emerging market economies accumulate international reserves
to secure FDI inflows from the center country, i.e., the United States. In other words, the
economies in the “periphery” hold international reserves to ensure importation of financial
intermediaries from abroad. According to this view, capital inflows are positively correlated with
holdings of international reserves.
The effect of capital flows on international reserve accumulation, however, is not
unambiguous. Besides the insurance motive, international reserves can be viewed as a substitute
for external financing. In this case, an economy may hold a lower level of international reserves
5 One version of the “global monetarism” argues that an increase in international reserves is driven by an excess demand for money, which implies a balance of payments surplus whereas a fall in international reserve holding is caused by an excess supply of money, which implies a balance of payments deficit. 6 de Beaufort Wijnholds and Kapteyn (2001) refer to the research on the Early Warning System and argue that the international reserves-to-M2 ratio is a reasonable measure of international reserve adequacy. 7 Edwards (2004) analyzes the sudden stop of capital inflows and current account performance in the last three decades. Caballero and Panageas (2004) argue that international reserve accumulation is not the best insurance against sudden stops. 8 In general, it is suggested to cover one year amortized value of various types of liabilities over a wide range of possible outcomes. The role of short-term external debts is brought to the center stage by the popular Greenspan-Guidotti-rule (Greenspan, 1999).
6
if it has secured access to international capital markets and, thus, the correlation between the two
variables is expected to be negative.
Lane and Milesi-Ferretti (2006) note that the types, volumes, and directions of capital
flows have changed over time. Hence, the use of an aggregate variable may not capture the
differential effects of different types of capital flows. In the following, we examine the individual
effects of net external liabilities (i.e., external liabilities minus assets) in debt financing, portfolio
equity financing, and FDI, as well as their growth rates.
The third group of explanatory variables is institutional variables. It has been argued that
institutional characteristics like corruption, political stability, and capital controls affect the
hoarding of international reserves. Aizenman and Marion (2003, 2004) and Alfaro et al. (2003),
for example, show that holdings of international reserves are influenced by political uncertainty
and corruption. Our empirical exercise includes a selected group of institutional variables
pertaining to financial openness and political/societal conditions.
In addition to these three groups of explanatory variables, our sample also includes four
types of dummy variables to account for other characteristics of the economies. The first type is
the exchange rate regime dummy variable.9 The common wisdom suggests that economies with
fixed exchange rates and crawling pegs have incentives to hold international reserves to fight
against exchange rate market pressures.10 The second type is a geographic dummy variable. Its
inclusion is motivated by the folklore that economies in certain geographic regions such as East
Asia tend to hoard high levels of international reserves especially after the Asian financial crisis.
The third type is the crisis dummy variable. The variable is meant to capture the effects of a
currency crisis, a banking crisis, or a twin crisis on hoarding of international reserves.11 The
9 Frenkel (1980) and Flood and Marion (2002), for example, report that exchange rate arrangements have effects on the holding of international reserves. Lane and Burke (2001), on the other hand, find no significant association between exchange rate regimes and international reserves. 10 In this study, the Reinhart-Rogoff (2002) index is used to construct the exchange rate regime dummy variable. Their index ranges from 1 “no separate legal tender,” to 14 “Freely falling” (with increasing flexibility of exchange rate movement) and is a “de facto” index in contrast to IMF’s “de jure” exchange rate regime classification. In this paper, we aggregate these categories into three; namely “floating,” “Crawling Peg,” and “Fixed/Pegged.” 11 The currency crisis dummy variable is derived from the conventional exchange rate market pressure (EMP) index pioneered by Eichengreen et al. (1996). The EMP index is defined as a weighted average of monthly changes in the nominal exchange rate, the international reserve loss in percentage, and the nominal interest rate. The weights are inversely related to the pooled variance of changes in each component over the sample countries, and adjustment is made for the countries that experienced hyperinflation following Kaminsky and Reinhart (1999). For countries without data to compute the EMP index, the currency crisis classifications in Glick and Hutchison (2001) and Kaminsky and Reinhart (1999) are used. The banking crisis dummy variable is based on Caprio and Klingebiel

7
fourth type is an interaction variable that assumes a value of one if the economy is located in a
region which is inflicted by a crisis. This dummy variable is included to evaluate the possible
contagion effect of crises on international reserve accumulation.
3. Empirical Analysis
3.1 Model Specifications
In the following empirical exercise, we consider a scaled measure of international reserves
given by ,i tr = , ,/i t i tR GDP , where ,i tR is a generic notation of economy i’s holding of international
reserves and ,i tGDP is economy i’s gross domestic product at time t. Both variables are measured
in U.S. dollars. Scaling international reserves facilitates comparison across countries of different
sizes. For brevity, we call the ratio ,i tr international reserves. The three types of determinants of
international reserves are denoted by ,i tX (= , ,{ ; 1,..., })i k t xx k N= which contains the traditional
macro variables, ,i tY (= , ,{ ; 1,..., }i k t yy k N= ) the financial variables, and ,i tZ
(= , ,{ ; 1,..., }i k t zz k N= ) the institutional variables. The dummy variables that capture other
characteristics of the economies are collected under ,i tD (= , ,{ ; 1,..., }i k t dd k N= ). The Appendix
provides a complete list of variables, their definitions, their sources, and a description of their
period averages.
We consider cross-sectional behavior for three non-overlapping sample periods; namely
1975-1981, 1983-1993, and 1999-2004. The sample periods exclude the years inflicted by the
three major financial crises; the Mexican debt crisis of 1982, the 1994 Tequila crisis, and the
1997-8 Asian financial crisis.12 For each of the three sample periods, we employ the period
averages of ,i tr , itX , ,i tY , ,i tZ , and ,i tD and label them ir , iX , iY , iZ , and ,iD
respectively. The use of period averages allows us to avoid complexity that arises from unknown
and, possibly varying dynamics, and focus on the (time-)average behavioral relationship.
The effects of these variables on hoarding of international reserves are studied using the
(2003). The twin crisis effect is examined by an interaction variable between a currency crisis and a banking crisis (Hutchison and Noy, 2002). 12 We leave out the two years between the 1994 and the 1997-98 crises since they are too short for a serious investigation. In subsection 3.3, we present robust test results using different time intervals that encompass the left-out period.

8
following regression equations:
ir = c + 'iX α + iε , (1)
ir = c + 'iX α + '
iD δ + iε , (2)
ir = c + 'iX α + '
iY β + 'iD δ + iε , and (3)
ir = c + 'iX α + '
iY β + 'iZ γ + '
iD δ + iε . (4)
The coefficient vectors α , β , γ , andδ are conformable to the associated explanatory
variables. The intercept and disturbance term are given by c and iε , respectively.
Specification (1) is an international reserve demand equation of the 1970s vintage. The
economy characteristic dummy variables are included in specification (2). Specification (3)
includes the financial variables ( iY ) that are often referred to in the recent discussion on the
demand for international reserves. The effects of institutional factors ( iZ ) are examined in
specification (4). These four specifications allow us to gauge the relative contributions of the
different groups of explanatory variables.
We divide the sample of 119 economies into two groups: one with 21 developed
economies and the other with 98 developing economies. Due to data availability, the actual
number of the economies included in the estimation varies across the three sample periods, but
for any given sample period, it is set fixed across the four specifications to facilitate comparison.
3.2 Estimation Results
The estimation results for the developed economies are presented in Table 1-1. The
estimation results pertaining to the regression equations (1) to (4) are respectively presented
under the columns labeled (1) to (4) for each of the three periods; namely 1975-1981, 1983-93,
and 1999-2004. Those for the developing economies are presented in the same format in Table
1-2. For brevity, only significant estimates are reported.
3.2.1 The 1975-1981 Period
For the developed economies, two traditional macro variables, real per capita GDP and
the propensity to import, are found to be significant in the 1975-81 period. They explain over
40% of variations in international reserves held by the developed economies. The signs of

9
coefficient estimates are consistent with those predicted in the literature. The transaction demand
for international reserves, on a per capita basis, falls as the real per capita income level rises
(Heller 1968). The proxy for trade openness and the degree of external vulnerability given by the
(average) propensity to import has the expected positive coefficient (Frenkel, 1974b).
The significant 1982 crisis dummy variable indicates that, in retrospect, the developed
economies that experienced a currency crisis in 1982 held lower levels of international reserves
than the non-crisis economies before the event.
The significant money effect (M2/GDP) is in accordance with the monetary interpretation
of the balance of payments and also with the view that money supply is a proxy for internal drain
of international reserves during the crisis period. Nonetheless, we are not sure to what extent the
internal drain interpretation is relevant for these economies. In any case, inclusion of M2 leads to
a large increase in the adjusted R-square coefficient.
The relevance of financial openness is confirmed by the significance of the Chinn-Ito
index reported in column (4).13 Its positive coefficient underlines the precautionary motive to
guard against adverse capital flows under an open capital account regime. This finding appears
reasonable because many developed economies, especially those in Europe, implemented capital
account liberalization policy in the late 1970s.
For the developing economies (Table 1-2), the propensity to import again enters
significantly with the expected sign. In addition, international reserve volatility, a proxy for
balance of payments uncertainty, has the expected positive sign – the higher the level of
international reserve variability, the stronger the motivation to hold precautionary international
reserves. The two variables explain 59% of the variability of international reserve holdings
among this group of economies.
Although we do not detect any significant effect of the 1982 crisis, the experience of a
currency crisis during the period is found to be associated with a fall in the holding of
international reserves.14
The ratio of net debt liabilities to GDP is the only significant financial variable for
13 A larger value of this measure means a higher level of capital account openness. The index is a reciprocal of regulatory restrictions on cross-border financial transactions and is based upon the IMF’s categorical enumeration reported in Annual Report on Exchange Arrangements and Exchange Restrictions (AREAER). See Chinn and Ito (2006) for a detailed discussion. The index is viewed as a de jure index on capital account openness. 14 The “Dummy for crisis during the period” assigns a value of unity to economies that experienced a crisis during the 1975-81 period and, therefore, is different from the 1982 crisis dummy variable.

10
developing economies in this period. Neither the growth rate of net debt liabilities nor the ratio
of short-term external debts to GDP is found to be significant. It appears that the level of external
debts, but not its growth rate or its maturity structure, matters. The negative coefficient on net
debt liabilities indicates that net borrowers tend to hold lower levels of international reserves.15
The evidence suggests that international reserves and external debts can be viewed as substitutes.
Another possible interpretation is that higher levels of external debts increase the default risk and
thus, lead to capital outflow and a drawdown of international reserves. Unfortunately, we are not
able to disentangle these two interpretations. We tentatively infer that, during this period,
developing economies are not likely to hold international reserves for precautionary reasons.16
Two institutional variables, the indexes for corruption and de facto financial openness,
are found to be significant. The effect of corruption on the holding of international reserves is
different from the one reported in Aizenman and Marion (2003, 2004).17 A higher value of our
corruption index means an environment less favorable to corruption. Our results indicate that a
less corrupt economy holds a lower level of international reserves. A likely interpretation is that
an economy with a good reputation of having less corruption would need fewer international
reserves to demonstrate its fundamental soundness.
The effect of the de facto financial openness index is quite comparable to the one
reported in Table 1-1. Even though the literature on effects of financial and institutional variables
on the hoarding of international reserves was limited during the 1970s, their effects are
well-evidenced in these regressions.
3.2.2 The 1983-1993 Period
For the developed economies in the 1983-1993 period (Table 1-1), the propensity to
import is the only significant macro variable. Its coefficient estimates are generally larger than
the ones in the previous sample period. Nevertheless, the variable explains a much smaller
proportion of international reserve variation than the two macro variables did in the previous
period. 15 Positive (Negative) net external financial liabilities correspond to net receivers (provider) of external finances. 16 The use of the ratio of external debts to GDP from the World Bank/BIS/OECD dataset on external debts gives qualitatively similar results. In the text, we report results pertaining to the Lane and Milesi-Ferretti (2006) dataset because it offers a better coverage than the World Bank/BIS/OECD dataset. 17 To be exact, Aizenman and Marion focused on political corruption, which may have a different implication for the holding of international reserves.

11
Interestingly, economies with crawling peg exchange rate regimes tend to hold more
international reserves. According to the “unstable middle” hypothesis, crawling peg regimes are
more prone to currency crises than flexible or fixed exchange rate regimes (Willett, 2003).
Therefore, this coefficient can be interpreted as capturing precautionary holdings.
As it did in the previous sample period, the 1982 crisis dummy variable has a
significantly negative estimate. Apparently, these economies tend to hold lower levels of
international reserves.
The M2 variable continues to be the only significant financial variable for the developed
economies while its coefficient estimates are slightly larger than those in the previous period.
More importantly, inclusion of this variable improves the goodness of fit much more
substantially in this period.
Although the capital openness variable is no longer significant, two institutional variables
on government characteristics enter significantly. Economies with plural electoral parliament
systems tend to hold more international reserves, probably because these economies are subject
to more stringent scrutiny on international reserve adequacy than those without. Also, developed
economies with leftist governments hold more international reserves. This finding is
contradictory to the common belief that a leftist government tends to spend more and incur
current account deficits, thereby leading to a lower level of international reserves (Roubini and
Sachs, 1989). Nonetheless, this argument may possibly be more relevant to developing
economies than developed ones since the former has limited access to international financing.
Again, developing economies are also found to be driven by a different set of
determinants in this period (Table 1-2). Both the propensity to import and international reserve
volatility enter significantly again and continue to account for a large portion (64%) of the
goodness of fit.
While there is no sign of a currency crisis effect, the estimates indicate that the
experience of a banking crisis in 1982 is associated with an increase in the hoarding of
international reserves. Even though there is evidence that a currency or banking crisis may affect
the hoarding of international reserves, we do not observe a definite pattern of crisis effects.
For this sample period, the data from developing economies allow us to discriminate the
behaviors between net creditors and net debtors.18 That is, net debtor economies may have an
18 In the 1975-1981 sample, there is no creditor developing economy.
12
incentive to hold more or fewer international reserves depending on whether they perceive
international reserves an insurance or a substitute to external finances. Net creditor developing
economies, on the other hand, would not have such incentives. To this end, we create a dummy
variable for net creditor economies (i.e., those with negative net debt liabilities) and interact it
with the net debt liabilities variable. The effects of these variables are reported in columns (7)
and (8).
The results suggest that, for the net debtor developing economies, the level of
international reserves is inversely related to the amount of net liabilities; international reserves
and external debts are substitutes. The coefficient estimate, however, is much smaller compared
to the one from the previous sample period. Net creditor economies, on the other hand, appear to
be unresponsive to net debt liabilities; the estimated coefficient on the interaction term is about
the same magnitude as that of the level term with an opposite sign, indicating an essentially zero
coefficient.
Besides their level, the growth of net debt liabilities is found to be a significant
determinant; the faster the net liabilities increase the more international reserves the developing
economy would build up.19 According to the coefficient estimates, the net debt liabilities effect
is much weaker than its growth effect. Thus, on the margin, a rise in net debt liabilities will lead
to an increase in the holding of international reserves, which can be served as implicit collaterals.
Among the institutional variables, only the de facto capital account openness remains to
be a significant determinant – however, its magnitude is now much smaller.
3.2.3 The 1999-2004 Period
Population and international reserve volatility are the two significant macro determinants
for the developed economies in the post-Asian financial crisis period (Table 1-1). It is worth
noting that the propensity to import no longer explains the developed economies’ behavior. As
was in the case of real GDP per capita, larger population captures the size effect, i.e., lower
transaction demand. Also, higher volatility in international reserves holding induces developed
economies to hold more international reserves.20 In passing we point out that, compared with the
macro variables in the two previous periods, these two macro variables have a fairly low
19 The variable for the growth of net debt liabilities was also interacted with the creditor dummy variable. However, the interaction term was found to be insignificant. 20 A dummy variable was constructed for Japan’s international reserve volatility, which is an extreme outlier.

13
explanatory power.
The crawling peg dummy variable is the only significant exchange rate regime dummy
variable. Among the financial variables, M2 (relative to GDP) is no longer significant in this
period. Instead, two other financial variables, the ratios of net debt liabilities and net portfolio
liabilities, are significant determinants. The coefficient estimates of the net debt liabilities
variable and its creditor interaction term suggest that, while net debtor economies view
international reserves as a substitute to external finances, net creditor economies do not respond
much to their net debt liabilities positions. Net receivers of portfolio financing also regard
international reserves as a substitute to external finances and, on the other hand, net providers of
portfolio financing reduce their holdings of international reserves. For these developed
economies, the two types of external financial factors bring down the average of their
international reserves because these economies have positive average values for both the net debt
and portfolio liabilities ratios. Interestingly, the inclusion of these financial variables boosts the
adjusted R-square estimate quite significantly – from 16% to 71%.
Despite the recent discussion of the effect of institutional development on capital flows,
no significant institutional variable is found in the international reserve regression for developed
economies. Thus, the specification (4) is omitted for this sample period.
For the developing economies (Table 1-2), the coefficient estimates of the propensity to
import continue to be significantly positive, but their magnitudes are considerably smaller than
those in the two previous periods. The opportunity cost of holding international reserves is now
significantly negative; a higher opportunity cost discourages the hoarding of international
reserves. The result is contrary to the perception that, in recent years, emerging market
economies accumulate international reserves despite the rising opportunity costs due to the
decline of U.S. interest rates. Interestingly, these two macroeconomic variables explain only 24%
of the variations in the holding of international reserves. Indeed, the explanatory power of this
specification is the lowest among the 12 cases presented in Table 1-2.
The economies that experienced a currency crisis during the Asian financial crisis and
those with crawling peg exchange rate systems tend to hold more international reserves while
Latin American economies tend to hold less. These results are broadly in line with those
presented earlier. Similar to the estimation results we have so far, the dummy variable capturing
the contagious effect of a crisis is found to be insignificant. That is, the economies in a

14
geographical region where there is a crisis, but are not directly inflicted by it, do not hold a
higher level of international reserves, ceteris paribus.
Among the financial variables, M2 and the ratio of net portfolio liabilities are
significant.21 It is the first time the regression for developing economies gives a significant M2
effect. The finding is in line with the recent interpretation that money stock can be a measure of
internal drain (de Beaufort Wijnholds and Kapteyn, 2001).
As was in the case of developed economies, the specification (4) is omitted for the
developing economies because there is no significant institutional variable in this sample period.
The result that is not supportive to the recent contention that legal and institutional factors are
important determinants of international reserve holding.
3.3 Discussions
The estimation results show that the determinants of international reserve holding are
different between developed and developing economies and vary across different periods. The
propensity to import is the only variable that is significant in almost all the specifications
considered in the three sample periods for both developed and developing economies – the only
exception is the case of developed economies in the last sample period. Even for this variable,
there is a discernable change in its coefficient estimates across different specifications and
sample periods.
The explanatory power of these factors is not stable over time either. Figure 2 presents
the marginal contributions of the four groups of explanatory variables to each model’s adjusted
R-square estimate. That is, the bars in the figure show the “incremental” change in the adjusted
R-square estimate when a group of explanatory variables is sequentially added to the estimation.
A few observations stand out.
First, in the 30-year span, the group of macro variables displays the most significant drop
in explanatory power. Its contributions to the adjusted R-square estimate fall from 44% in the
1975-1981 period to 10% in the 1999-2004 period for the developed economies and from 58% to
24% for the developing economies.
Second, for the developed economies, the incremental explanatory power of the financial
variables increases rapidly in the 1983-1993 period and reaches the maximum of 59% in the
21 The interaction with the dummy variable for creditor countries is found to be insignificant.

15
1999-2004 period. For the developing economies, after drifting at low levels in the first two
periods, the explanatory power of this group jumps up to 36% in the 1999-2004 period.
Apparently, for both groups of economies, the importance of financial variables is
growing at the expense of the group of macro variables. The result, nevertheless, may reflect the
increasing importance of capital and financial transactions amid the continuing financial
liberalization and globalization.
Third, the results do not give a clear trend for the role of the remaining two groups of
determinants. In the case of the developed economies, the institutional factors appear gaining
importance over the first two periods, whereas the opposite seems to hold for the developing
economies. Above all, for both groups, none of the institutional factors is playing a significant
role in the most recent sample period.
The role of financial and institutional factors deserves some comments. The literature has
not paid much attention to the implications of financial and institutional factors until recently.
Nevertheless, we have found the effects of these two types of factors in the 1970s and 1980s
samples. The absence of the institutional factor effect in the last sample period is quite
unexpected though. Also, the effects of these two types of determinants on international reserve
accumulation vary quite substantially over time. The M2 effect, for example, is a significant
determinant for the developed economies in the first two sample periods, but not in the third one.
For the developing economies, on the other hand, the M2 variable appears significantly only in
the most recent period.
The variability of model specifications and coefficient estimates across sample periods
and economy groups is quite transparent in Tables 1-1 and 1-2. To formally verify it, we examine
parameter stability using the Wald test. Specifically, we pool the data from two sample periods
and test whether the parameters are constant over the sample periods, i.e. (1975 – 1981 vs. 1983
– 1993), (1975 – 1981 vs. 1999 –2004), and (1983 – 1993 vs. 1999 – 2004). The procedure is
applied to both the developed and developing economies. Also, we test the stability for each of
the four groups of explanatory variables.
In general, the results of the Wald tests confirm that the estimates across any two sample
periods are significantly different from each other.22 The results from the developed economies
in the 1975 – 1981 and 1983 – 1993 periods give the least dissimilar estimates. Recall that there
22 For brevity, the Wald test results are not reported here, but are available from the authors.

16
are major crises separating the three sample periods considered in our exercise. In other words,
the evidence lends support to the view that economies alter their international reserve holding
behavior before and after major global financial disturbances.
One potential issue with our choice of the sample periods is that there is a five-year gap
between the 1983-1993 and 1999-2004 samples. With the current setting, it is not clear whether
it is the 1994 Tequila crisis or the 1997-98 Asian financial crisis that causes the change in the
international reserve hoarding behavior in the 1990s. To further investigate the underlying reason
of coefficient instability, we test parameter constancy over the two periods 1983-1993 and
1995-2004 that are separated by the 1994 Tequila crisis, as well as that over the 1983-1996 and
1999-2004 periods separated by the Asian financial crisis.
The Wald test results show that, for the developed economies, the coefficient estimates
are significantly different before and after both the Tequila and Asian financial crises.23 The
coefficient estimates for the developing economies, on the other hand, are significantly affected
by the East Asian financial crisis but not by the Tequila crisis.24 In general, these findings
corroborate our choice of the three sample periods.
4. Additional Analyses
4.1 Does it Matter if an Economy Is a Developed or Developing One?
What would happen if a developed economy accumulates international reserves as if it
were a developing economy, or vice versa? Let the estimated demand for international reserves
of developing economies be
,i dpr = cdp + , 'i dpW ˆdpα + ,i dpε ≡ ,i dpr + ,i dpε , (5)
and that of developed economies be
,i ddr = cdd + , 'i ddW ˆddα + ,i ddε ≡ ,i ddr + ,i ddε , (6)
where “^” indicates a parameter estimate; the subscripts “dp” and “dd” denote developing and
developed economies; ,i dpW contains the significant factors; ˆdpα is the vector containing the
23 Parameter instability is found in all groups of explanatory variables with the exceptions of the financial variable group in the case of the Tequila crisis, and the characteristics dummies and institutional variable group in the case of the Asian financial crisis. 24 For the 1983 – 1993 and 1995-2004 samples, no parameter instability is detected. For the 1983 – 1996 and 1999 – 2004 samples, parameter instability is detected for the macroeconomic variable group and for the entire set of explanatory variables.

17
corresponding estimates; and ,i dpr is the predicted level of international reserves. ,i ddW , ˆddα ,
and ,i ddr are similarly defined.
Suppose a developed economy behaves like a developing economy, what would be its
predicted level of international reserves? One way to address this question is to generate the
“predicted” level of international reserves for this economy by applying its data to equation (5),
which is estimated from the data of developing economies. We label this predicted value ,i ddr% .
By comparing ,i ddr with ,i ddr% , one can assess the value (or cost) of being labeled as a developed
economy. Similarly, we can generate ,i dpr% for a developing economy using equation (6) and data
from the developing economies. Again, we can infer from ,i dpr and ,i dpr% the implications of a
developing economy label.
First, we consider the case of a developing economy that behaves like a developed
economy and generate ,i dpr% and ,i dpr for all four regression specifications (1) to (4). For brevity,
the discussion in this and the following subsection are based on results pertaining to specification
(4), which includes all four types of explanatory variables. Subsample averages are used in place
of missing values.
Figure 3 presents three values of international reserves (as a ratio to GDP) for each
economy: actual levels of international reserves (ri,dp); predicted values from the fitted equation
for the developing economies sample ( ,i dpr ) – which we call the “simple” predictions for
simplicity; and predicted values from the fitted equation for the developed economies ( ,i dpr% ) –
which we call the “cross” predictions. In the figure, the economies are sorted in descending order
according to their real per capita GDP in U.S. dollars.
As expected, the simple predictions ( ,i dpr ) match the actual values of international
reserves (ri,dp) quite well. The distribution of the cross predictions ( ,i dpr% ), on the other hand,
depends on the sample period.
In the 1975 – 1981 sample (Panel A), the cross prediction values ( ,i dpr% ) appear
consistently above the simple prediction values ( ,i dpr ). Also, the gap between ,i dpr and ,i dpr%
diverges as the level of real per capita income declines. Based on the estimation results in Tables
1-1 and 1-2, we can conjecture that the observed divergence is driven by the negative real output

18
effect found for developed economies in this period. The negative income effect may reflect the
unfavorable conditions faced by low income economies in the international financial market in
the 1970s. Thus, if developing economies were viewed as developed economies in the late 1970s,
these economies, especially those with low per capita income, would have been required to hold
higher levels of international reserves.
For the 1983 – 1993 and 1999 – 2004 periods, the cross predictions ( ,i dpr% ) are quite often
lower than the corresponding simple predictions ( ,i dpr ). During these two sample periods, if
developing economies could behave as developed ones, they could afford to hold lower levels of
international reserves in these periods. That is, compared with developed economies with similar
economic and financial conditions, developing economies tend to hold more international
reserves. One possible explanation is that the developing economies have limited access to
international financial markets and are more vulnerable to crises.
Admittedly, it is quite difficult to decipher the numerical values of international reserves
from Figure 3. Table 2 reports the actual values and the two types of predicted values of
international reserves for some Asian economies, the ones that are often perceived to be
excessive holders of international reserves, as well as some selected subgroups. In Table 2,
positive values in column (3) mean that a developing economy has a level of international
reserves higher than the simple predicted value ( 0ˆ,, >− dpidpi rr ) whereas those in column (5)
mean that the economy has a level of international reserves higher than the one implied by cross
prediction ( 0~,, >− dpidpi rr ). Column (6) reports the differences between the two predicted values,
dpidpi rr ,,~ˆ − . In general, Table 2 confirms the observations we made with Figure 3.
It is worthwhile noting that the relative magnitudes of the differences in the two types of
predicted values of international reserves change across sample periods. For example, during the
1983 – 1993 period, the Latin America group gives the largest difference between the two
predicted values (column (6)) while the emerging Asian group yields the smallest. However,
during the 1999 – 2004 period, the opposite is true for the two groups.
Furthermore, the discrepancies between the two kinds of predictions substantially vary
across the economies. In the 1999 – 2004 sample, the actual levels of international reserves held
by Hong Kong, Malaysia, Singapore, and Thailand are much higher than the cross predictions.
Singapore is an extreme case – the economy’s actual level of international reserves is slightly

19
lower than the simple predicted value, but is higher than the cross prediction by 87.6%! Thus, if
the criteria of the developed economies are used to assess adequacy, these developing economies
would be deemed to have an excessive level of international reserves.
Another interesting case is China. During the 1999 – 2004 sample period, China’s
holding of international reserves is 15.4% lower than the simple predicted value. The degree of
deficiency increases to 30% when the cross prediction is used as a reference point. That is, both
specifications for developing or developed economies suggest that China’s holding of
international reserves should have been higher between 1999 and 2004.
Next, we repeat the exercise for the group of developed economies and present the results
in Figure 4 and Table 3. The panels in Figure 4 show that, generally, the simple prediction values
are lower than the cross prediction ones; if a developed economy were treated as a developing
economy, it would have to hold a higher level of international reserves – a result consistent with
the previous analysis. Comparing the graphs from the three sample periods, the discrepancy
between the two kinds of predicted values is the smallest during the second period.
Table 3 confirms that the group of developed economies holds a level of international
reserves much lower than what is predicted by the fitted model for developing economies. Again,
the degree of under-hoarding is the smallest in the 1983 – 1993 period. Interestingly, Japan, one
of the largest holders of international reserves, is deemed to have too few international reserves
during the 1999 – 2004 period; its average level of international reserves is 11.6% (of its GDP),
but the cross prediction indicates that the ratio should be 27.4%.
4.2 Over- or Under-Hoarding of International Reserves?
As we stated in the introduction, the recent phenomenal buildup of international reserves
by some developing economies has triggered a contentious debate about whether these
economies are holding an excessive amount of international reserves and, thus, posing a serious
threat to the stability of the world economy. One traditional rule of thumb indicator of excessive
international reserves holding is whether a country holds international reserves worth more than
three months of imports. As of the end of 2005, the amount of international reserves held by
China, Japan, Korea, Malaysia and Taiwan is worth 14.93, 19.33, 9.66, 7.36, and 16.65 months
of imports, respectively, which is well above the three-month benchmark.
Our analysis, however, has shown that imports are just one of the determinants of the

20
hoarding behavior. Furthermore, the importance of the propensity to import has been declining
over years. Hence, the assessment of the adequacy of international reserves should go beyond the
consideration of imports. There are additional complexities. For instance, our results in the
previous section suggest that the holding pattern of international reserves has evolved over time.
There is also evidence that, under similar conditions, developing economies tend to hold a level
of international reserves higher than developed economies.
To shed more light on the issue of excessive hoarding in recent years, we generate the
1999 – 2004 predictions from the empirical equations of international reserves obtained in
different sample periods. For example, the predicted values for developed economies are made
by applying the 1999 – 2004 data to the fitted equations of developed economies in each of the
three sample periods. The results are presented in Table 4. Columns (1) to (3) in the table are the
same as the corresponding entries in columns (1) to (3) of Panel 3 in Tables 2 and 3 – they are
included for comparison purposes. Columns (4) and (6) list the 1999-2004 predicted values
generated from fitted models of the 1983-93 and the 1975-81 periods, respectively. Columns (5)
and (7) are the prediction errors for columns (4) and (6), respectively.
When the 1999 – 2004 specifications are used, there is no substantial evidence of
over-hoarding of international reserves. Among the selected Asian economies shown in Table 4,
Malaysia has the highest level of over-hoarding – the excessive amount is about one half of its
predicted value. China, on the other hand, has the highest deficient rate of 15.4%. Compared
with developing economies, the developed economies display a lower degree of over-hoarding
variability.
The use of the 1975 – 1981 and 1983 – 1993 models presents a different picture. In
general, the actual holdings are lower than the values predicted by these two models. For
developed economies, Japan in the 1999 – 2004 period is the only case that gives a
over-hoarding result. Both the U.K. and Germany are deemed to hold too few international
reserves in the period. Indeed, Japan shows a relatively minor change in its estimated over- and
under-hoarding positions.
The results for developing economies are quite striking. The predicted values show a high
degree of variations. For instance, the 1983 – 1993 specification suggest Singapore holds the
most “excessive” amount of international reserves (38.4%) and China’s level of international
reserves is 90.9% lower than the model prediction. Under the 1975-1981 model, the Philippines

21
over-hoards by 4.5% while Hong Kong under-hoards by 310.2%.
According to the 1983 – 1993 specification, the group of developing economies on
average has a deficient amount of international reserves; the actual average holding is 20.4% less
than the predicted value. The group of oil exporting economies has the highest level of excessive
holding (17.6%) among the subgroups.
The 1975 – 1981 specification gives an even more severe under-hoarding scenario.
According to this vintage model, developing economies are under-hoarding on average by an
amount of 53.5%. All of the three geographical subgroups hold lower levels of international
reserves than the model predictions. For individual economies, China, Hong Kong, and
Singapore are the three economies that have the largest degrees of under-hoarding – for these
economies, the size of international reserves holding is expected to be bigger than their GDPs!
In sum, the evidence for excessive holdings of international reserves in the 2000s is quite
limited. Indeed, according to the models of the 1970s and 1980s, these selected economies tend
to hold a deficient, instead of an excessive, amount of international reserves. These findings
suggest that, in assessing the adequacy of international reserves, one has to take into account of
both the changing global environment and the evolving role of international reserves.
5. Concluding Remarks
Against the backdrop of the astonishing growth of global international reserves and the
recent advancements in modeling the demand for international reserves, we conduct an extensive
cross-country analysis to examine the empirical determinants of international reserve holding.
Four groups of determinants, namely, traditional macro variables, financial variables,
institutional variables, and dummy variables that control for individual economy characteristics
are considered. Also, accounting for the anecdotal evidence that major currency crises affect the
demand for international reserves, we examined three sample periods partitioned by three major
crisis episodes, the 1982 Mexican debt crisis, the 1994 Tequila crisis, and the 1997 Asian
financial crisis.
It is found that the empirical specifications of the demand for international reserves differ
between developed and developing economies and across the three sample periods. With the
exception of the propensity to import, all the potential determinants do not show up consistently
in the estimated equations. Formal Wald statistics confirm parameter non-constancy and

22
corroborate our choice of sample periods. All in all, the empirical results highlight the difficulty
of devising a single empirical model to describe the holding of international reserves. They also
represent some challenges for building a unified theory of demand for international reserves.
Besides the changing nature of the estimated relationship, we find the effects of financial
and institutional factors in the 1970s and 1980s even though only recently these factors are the
subjects of discussions. Our estimation results suggest that developing economies could hold
lower levels of international reserves if they were to be perceived as developed ones. One
interpretation is that, despite our relatively exhaustive list of explanatory variables, the fitted
models do not fully capture the differences between these two groups of economies. Some
possible omitted variables are market credibility and the level of sociopolitical governance.
Unfortunately we do not have data on these variables.
Furthermore, our results do not lend strong support to the assertion that economies
including China, Japan, and Korea are hoarding an excessive amount of international reserves in
the 2000s. Specifically, the predicted values generated from various estimated equations of
international reserves do not indicate a large over-hoarding phenomenon. Instead, the models of
the 1975 – 1981 and 1983 – 1993 vintages suggest that these economies should have higher
levels of international reserves than their actual holding levels in the 2000s. We do identify one
condition under which some developing economies display signs of excessive hoarding in the
2000s – the use of models fitted to developed economies to generate the predicted level of
international reserves.
The continuing process of globalization and the growing importance of capital account
transactions are likely to be the reasons for the changing relationship between international
reserves and their determinants. Understandably, the changing world economic environment
makes the optimal level of international reserves a moving target. A corollary is that the
assessment of the adequacy of international reserves is a non-trivial enterprise; especially in the
periods that experience significant events in the international arena. Given the occurrence of
dramatic events (both economic and geo-political ones) around the new millennium, it is
reasonable to expect that the demand for international reserves will not be the same as it was in
the past. Hence, the assertions of unusual or excessive hoarding of international reserves must be
made with caution and be evaluated with the flexibility of allowing possible behavioral changes.

23
Appendix 1. Data Appendix
Table A.1 presents the list of the variables considered in the exercise. In the text, only the
significant variables are reported in empirical specifications. The table also provides the definitions of
these variables and the sources of the primary data used to construct these variables. These are annual
data from 1975 to 2004. The sample of economies consists of 21 developed economies and 98
developing economies.
2. Period Averages of Some Selected Variables
The period averages of the variables are reported in Table A.2. There are some obvious
variations between developed and developing economies and across the three sample periods. While
the two groups of economies have comparable levels of international reserves in the first two sample
periods, there is a noticeable change in the 1999-2004 period. Since the Asian financial crisis,
developing economies have accumulated a substantial amount of international reserves, averaging
more than double that of developed economies.
A few other observations are in order. First, among the developed economies, macroeconomic
variables usually remain relatively stable across the three periods. The developing economies, on the
other hand, experience variations in some variables. For example, both volatilities of international
reserve holdings and export receipts decline over time, a sharp contrast with the developed
economies. The opportunity cost of holding international reserves peaks for the developing
economies in the 1983-1993 period – reflecting the debt crisis in the period – and reverts back to a
lower level in the last period, though still much higher compared to the developed economies.
Second, the financial variables exhibit some discernable differences between the two groups.
The developed economies have a higher monetarization ratio, which is consistent with the perception
that these economies have a higher degree of financial deepening and more advanced capital markets
than the developing ones. The table shows that the group of developing economies is net receivers of
external debt and FDI flows.25 Apparently, for developing economies, FDI flows are gaining
importance recently while external debts peak in the 1983-1993 period.
Third, by eyeballing institutional variables, we can confirm that developed economies have
already achieved high levels of institutional development and democracy in early years. Developing 25 Positive (Negative) net external financial liabilities correspond to net receivers (provider) of external finances.

24
economies are on the catch-up trend, but still lagging behind the developed economies. It is
worthwhile noting that the Chinn-Ito (2006) de jure index of financial openness suggests that
countries have taken different paths of financial liberalization; the developed economies have
constantly implemented financial liberalization since the 1970s while the developing economies
restricted cross-border capital flows during the 1980s, though they rapidly reopened capital accounts
after the mid-1990s (see Ito, 2006).

25
Table A.1: Definitions and Sources Variables Definitions Sources
1. Dependent variables R_GDP total international reserves (including gold)/current GDP WDI
2. Variables in “X” – “Macro variables” RYPC_US per capita GDP in constant US dollars WDI POP population WDI PIMP propensity to import IFS RES_VOL international reserve volatility IFS EXP_VOL volatility of export receipts IFS DIFINT opportunity cost of holding international reserves WDI, IFS
3. Variables in “Y” – “Financial variables” M2Y M2 to current GDP WDI, IFS NET_DEBT net debt liabilities / current GDP LM
NET_FDI net FDI liabilities / current GDP LM
NET_PORTFOLIO net portfolio equity liabilities / current GDP LM
D_DEBT_LIAB growth rate of net debt liabilities / current GDP LM
D_FDI_LIAB growth rate of net FDI liabilities / current GDP LM
D_PORTFOLIO_LIAB growth rate of net portfolio liabilities / current GDP LM
4. Variables in “Z” – “Institutional variables” KAOPEN capital account openness Chinn-Ito (2006)
DEFACTO_FININT de facto financial openness = (Total external assets + liabilities) / current GDP LM
TRADEOPEN de jure trade openness WDI CORRUPT corruption [0, 6] ICRG BQ bureaucratic quality [0, 6] ICRG LAO law and Order [0, 6] ICRG LEFT dummy variable for left-wing government DPI2004 PLURAL dummy variable for parliament with Plural electoral system DPI2004 GOVFRAC government fractionalization [0, 1] DPI2004 POLCONV political constraint (democracy) index Henisz (2000)
5. Dummies (“D”) ER_CRAWL dummy variable for the crawling peg exchange rate regime RR ER_FIX dummy variable for the fixed exchange rate regime RR CRISIS dummy variable for a currency crisis Authors’ calculations BANKCRISIS dummy variable for a banking crisis CK OIL dummy variable for oil exporting countries Authors’ calculations
NOTES: The source codes are: BDL: Beck, Demirgüc-Kunt, and Levine (2000, updated in later years); CI: Chinn and Ito (2006); CK: Caprio and Klingebiel (2003); DPI2004: Database of Political Institutions, Beck et al. (2001); Henisz: Henisz (2000); ICRG: International Country Risk Guide; IFS: IMF’s International Financial Statistics; IMF: Other IMF databases; LM: Lane and Milesi-Ferretti (2006); Polity IV: Polity IV project (2004); RR: Reinhart and Rogoff (2000); and WDI: World Development Indicators.

26
Table A.2: Summary Statistics 1975-1981 1983-93 1999-2004 Developed Developing Developed Developing Developed Developing
International reserves / GDP 0.10 0.11 0.10 0.12 0.07 0.18
X (macro) variables Population in millions 35.56 34.18 35.97 35.50 39.83 46.44 International reserve volatility1 0.10 0.11 0.05 0.05 0.09 0.01 Real per capita GDP (in log US$) 9.56 7.19 9.76 7.15 10.04 7.34 Propensity to Import 0.31 0.40 0.29 0.35 0.33 0.42 Volatility of Export receipts1 0.03 0.25 0.03 0.03 0.02 0.01 Opportunity cost 0.04 0.09 0.06 3.26 0.03 0.16
Y (financial) variables M2 / GDP 0.56 0.29 0.66 0.39 0.80 0.47 Net portfolio liabilities /GDP2 0.00 0.00 0.01 -0.02 0.10 -0.02 Net debt liabilities /GDP2 0.11 0.23 0.19 0.47 0.15 0.35 Net FDI liabilities /GDP2 0.01 0.12 0.02 0.13 -0.03 0.25
Z (institutional) variables Leftist government (0/1)3 0.38 0.23 0.33 0.25 0.48 0.23 Parliament/Plural elect. sys. (0/1)3 0.52 0.76 0.52 0.84 0.57 0.70 Corruption index [0, 6]4 5.29 2.75 5.35 3.03 4.48 2.40 Law and order [0, 6]4 5.41 2.59 5.48 2.81 5.50 3.46 Bureaucratic quality [0, 6]4 3.68 1.59 3.70 1.80 3.80 1.94 Democracy index [0, 1]5 0.74 0.15 0.77 0.26 0.76 0.45 Gov’t fractionalization [0, 1]6 0.23 0.11 0.27 0.17 0.28 0.25 De jure KA-openness (Chinn and Ito)7 0.36 -0.16 1.21 -0.41 2.48 0.33 De facto KA-openness (Lane and Milesi-Ferretti) 0.79 1.08 1.36 1.83 3.97 1.85
NOTES: 1 – International reserve volatility and export volatility are normalized by the period average of international
reserves and exports, respectively. 2 – “Net liabilities” = (liabilities minus assets) of an external financial asset per GDP. 3 – The variables for leftist government and parliament with plural electoral system are zero-one dummy
variables. 4 – For political/societal variables: anti-corruption, law and order, and bureaucratic quality, higher values indicate
better conditions. For example, a higher value of corruption index indicates an environment with stronger anti-corruption measures and enforcement.
5 – The democracy index is also known as the political constraint index – a higher value means a more democratic system.
6 – A higher value for government fractionalization means a more fractionalized government. 7 – The de jure KA openness variable ranges between -1.8 and +2.6 (Chinn and Ito, 2006). A higher value
indicates a more open capital account.

27
References Aizenman, J. and Lee, J. 2005. “International Reserves: Precautionary Versus Mercantilist Views,
Theory and Evidence,” NBER Working Paper 11366. Aizenman, J., Lee, Y., and Rhee, Y. 2004. International Reserves Management and Capital
Mobility in a Volatile World: Policy Considerations and a Case Study of Korea, UC Santa Cruz Economics Working Paper 569.
Aizenman, J. and Marion, N. 2001. “International Reserve Uncertainty and the Supply of International Credit,” Journal of Money, Credit and Banking 34, 631-649.
Aizenman, J., and Marion, N. 2003. “The High demand for International Reserves in the Far East: What’s Going On?” Journal of the Japanese and International Economies 17, 370-400.
Aizenman, J., and Marion, N. 2004. “International Reserve Holdings with Sovereign Risk and Costly Tax Collection,” The Economic Journal 114, 569–591.
Alfaro, L., Kalemli-Ozcan, S. , and Volosovych, V. 2003. “Why Doesn’t Capital Flow from Rich to Poor Countries? An Empirical Investigation,” manuscript,, University of Houston.
Bahmani-Oskooee, M. 1988. “Oil Price Shocks and Stability of the Demand For International Reserves,” Journal of Macroeconomics 10, 633-41.
Baumol, W.J. 1952. “The Transactions Demand for Cash: An Inventory Theoretic Approach,” Quarterly Journal of Economics 66, 545-56.
Bird, G., and Rajan, R. 2003. “Too Much of a Good Thing? The Adequacy of International Reserves in the Aftermath of Crises,” The World Economy 26, 873-891.
Caballero, R. J. and Panageas, S. 2004. Insurance and International Reserves Management in a Model of Sudden Stops, manuscript, MIT.
Caprio, G. and Klingebiel, D. 2003. “Episodes of Systematic and Borderline Financial Crises,” manuscript, The World Bank.
Chang, R. and Velasco, A. 1999. “Financial Fragility and the Exchange Rate Regime,” NBER Working Paper 7272.
Chinn, D. M. and Ito, H. 2006. “What Matters for Financial Development? Capital Controls, Institutions, and Interactions,” Journal of Development Economics 81, 163-192.
Corsetti, G., Pesenti, P. and Roubini, N. 1999. “Paper Tigers? A Model of the Asian Crisis” European Economic Review 43, 1211-1236.
Courchene, T.J. and Youssef, G.M.. 1967. The Demand for International Reserves, Journal of Political Economy 75, 404-413.
de Beaufort Wijnholds, J. O. and Kapteyn, A. 2001. “International Reserve Adequacy in Emerging Market Economies”, IMF Working Paper 01/43.
Dooley, M.P. 2000. "A Model of Crises in Emerging Markets,” The Economic Journal 110, 256-272.
Dooley, M., Folkerts-Landau, D., and Garber, P. 2005. International Financial Stability: Asia, Interest Rates, and the Dollar, Deutsche Bank Global Research.
Edison, H. 2003. “Are Foreign Exchange International Reserves in Asia Too High?” in Chapter II of World Economic Outlook September, 78-92.
Edwards, S. 2004. Thirty Years of Current Account Imbalances, Current Account Reversals and Sudden Stops, NBER Working Paper 10276.
Eichengreen, B., Rose, A. K., and Wyplosz, C. 1996. “Contagious Currency Crises,” NBER Working Paper 5681.
28
Feldstein, M. 1999. “A Self-Help Guide for Emerging Markets,” Foreign Affairs 78, 93 – 109. Flood, R. P. and Marion, N. 2002. “Holding International reserves in an Era of High Capital
Mobility,” IMF Working Paper 02/62. Frenkel, J. A. 1980. “International Reserves Under Pegged Exchange Rates and Managed Float:
Corrections and Extensions,” Journal of Monetary Economics 6, 295-302. Frenkel, J. A. 1974a. “The Demand for International Reserves by Developed and
Less-Developed Countries,” Economica 41, 14-24. Frenkel, J. A. 1974b. “Openness and the Demand for International Reserves,” 289–98 in Robert
Z. Albier (Ed.), National Monetary Policies and the International Financial System, University of Chicago Press, Chicago.
Frenkel, J. and Jovanovic, B. 1981. “Optimal International reserves: A Stochastic Framework,” Economic Journal 91, 507-14.
Glick, R. and Hutchison, M. 2001. “Banking and Currency Crises: How Common Are Twins?” 35-69, In R. Glick, R. Moreno, and M. Spiegel, eds. Financial Crises in Emerging Markets. Cambridge, UK: Cambridge University Press.
Greenspan, A. 1999. “Currency International Reserves and Debt,” remarks made before the World Bank Conference on Recent Trends in International reserves Management, Washington, D.C., April 29, 1999, http://www.federalinternational reserve.gov/BoardDocs/Speeches/ 1999/19990429.htm.
Heller, H.R. 1966. “Optimal International Reserves,” Economic Journal 76, 296-311. Heller, H.R. 1968. “The Transactions Demand for International Means of Payment,” Journal of
Political Economy 76, 141-145. Ito, H. 2006. “Financial Development in Asia: Thresholds, Institutions, and the Sequence of
Liberalization,” North American Journal of Economics and Finance 17, 303-327. Johnson, H. G. 1958. International Trade and Economic Growth: Studies in Pure Theory,
Harvard University Press: Cambridge. Kaminsky, G. and Reinhart, C. 1999. “The Twin Crises: The Causes of Banking and Currency
Balance-of-Payments Problems,” American Economic Review 89, 473-500.
Kelly, M. G. 1970. “The Demand for International reserves,” American Economic Review 59, 655-667.
Krugman, P. 1999. “Balance Sheets, the Transfer Problem, and Financial Crises,” 31-44, Peter Isard, Assaf Razin and Andrew K. Rose, eds, International Finance and International Crises, International Monetary Fund, Washington DC.
Lane, P. R. and Burke, D. 2001. “The Empirics of Foreign International Reserves,” Open Economies Review 12, 423-434.
Lane, P. R. and Milesi-Ferretti, G. M. 2006. “The External Wealth of Nations Mark II: Revised and Extended Estimates of Foreign Assets and Liabilities, 1970-2004,” IMF Working Paper 06/69.
Lee, J. 2004. Insurance Value of International reserves: An Option Pricing Approach, manuscript, Research Department, International Monetary Fund.
Lizondo, J. S. and Mathieson, D. J. 1987. “The Stability of the Demand for International Reserves,” Journal of International Money Finance 6, 251-282.
De Beaufort Wijnhold, J.O. and Kapteyn, A. 2001. “International Reserve Adequacy in Emerging Market Economies”, IMF Working Paper 01/43.
Reinhart, C. and Rogoff, K. 2002. “The Modern History of Exchange Rate Arrangements: A Reinterpretation,” NBER Working Paper 8963.
29
Roubini, N. and Sachs, J. D. 1989. “Government Spending and Budget Deficits in the Industrial Countries,” Economic Policy 8, 99-132.
Triffin, R. 1947. “National Central Banking and the International Economy,” The Review of Economic Studies, 14, 53-75
Willett, T. 2003. “Fear of Floating Need Not Imply Fixed Exchange Rates,” Open Economies Review 14, 77 – 91.
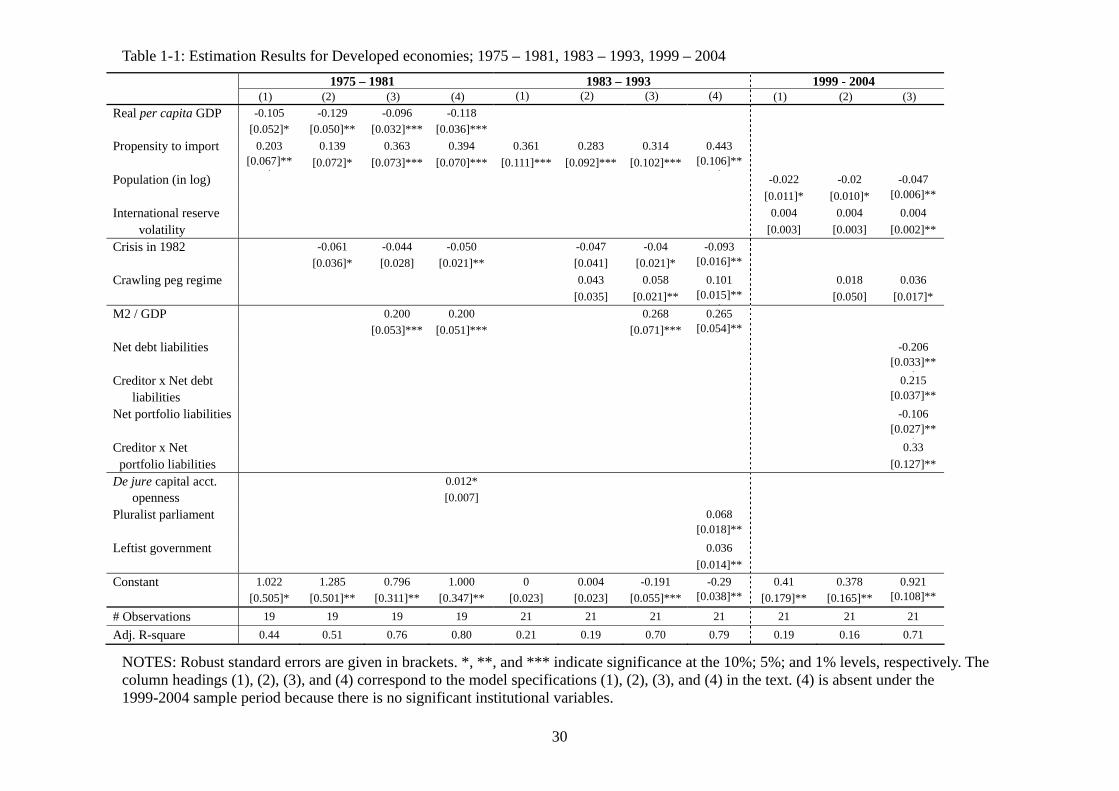
30
Table 1-1: Estimation Results for Developed economies; 1975 – 1981, 1983 – 1993, 1999 – 2004 1975 – 1981 1983 – 1993 1999 - 2004 (1) (2) (3) (4) (1) (2) (3) (4) (1) (2) (3) Real per capita GDP -0.105 -0.129 -0.096 -0.118 [0.052]* [0.050]** [0.032]*** [0.036]*** Propensity to import 0.203 0.139 0.363 0.394 0.361 0.283 0.314 0.443 [0.067]**
*[0.072]* [0.073]*** [0.070]*** [0.111]*** [0.092]*** [0.102]*** [0.106]**
*
Population (in log) -0.022 -0.02 -0.047 [0.011]* [0.010]* [0.006]**
*International reserve 0.004 0.004 0.004 volatility [0.003] [0.003] [0.002]** Crisis in 1982 -0.061 -0.044 -0.050 -0.047 -0.04 -0.093 [0.036]* [0.028] [0.021]** [0.041] [0.021]* [0.016]**
*
Crawling peg regime 0.043 0.058 0.101 0.018 0.036 [0.035] [0.021]** [0.015]**
* [0.050] [0.017]*
M2 / GDP 0.200 0.200 0.268 0.265 [0.053]*** [0.051]*** [0.071]*** [0.054]**
*
Net debt liabilities -0.206 [0.033]**
*Creditor x Net debt 0.215 liabilities [0.037]**
*Net portfolio liabilities -0.106 [0.027]**
*Creditor x Net 0.33 portfolio liabilities [0.127]**
De jure capital acct. 0.012* openness [0.007]
Pluralist parliament 0.068 [0.018]**
*
Leftist government 0.036 [0.014]** Constant 1.022 1.285 0.796 1.000 0 0.004 -0.191 -0.29 0.41 0.378 0.921 [0.505]* [0.501]** [0.311]** [0.347]** [0.023] [0.023] [0.055]*** [0.038]**
*[0.179]** [0.165]** [0.108]**
*# Observations 19 19 19 19 21 21 21 21 21 21 21 Adj. R-square 0.44 0.51 0.76 0.80 0.21 0.19 0.70 0.79 0.19 0.16 0.71
NOTES: Robust standard errors are given in brackets. *, **, and *** indicate significance at the 10%; 5%; and 1% levels, respectively. The column headings (1), (2), (3), and (4) correspond to the model specifications (1), (2), (3), and (4) in the text. (4) is absent under the 1999-2004 sample period because there is no significant institutional variables.

31
Table 1-2: Estimation Results for Developing economies, 1975 – 1981, 1983 – 1993, 1999 – 2004 1975 – 1981 1983 – 1993 1999 – 2004 (1) (2) (3) (4) (1) (2) (3) (4) (1) (2) (3) Propensity to import 0.327 0.345 0.348 0.136 0.322 0.326 0.34 0.325 0.266 0.24 0.085 [0.028]** [0.027]*** [0.020]*** [0.060]** [0.040]*** [0.037]*** [0.034]*** [0.036]*** [0.119]** [0.116]** [0.049]* International reserve 0.032 0.026 0.015 0.010 0.012 0.009 0.007 0.007 volatility [0.007]**
*[0.008]*** [0.008]* [0.005]* [0.003]*** [0.003]*** [0.002]*** [0.002]***
Opportunity cost -0.330 -0.307 -0.135 [0.118]*** [0.102]*** [0.066]**
Crisis during period -0.054 -0.046 -0.054 [0.017]*** [0.015]*** [0.014]*** Banking crisis in 1982 0.047 0.045 0.046 [0.018]*** [0.017]*** [0.017]*** Crisis in 1997-98 0.073 0.04 [0.041]* [0.023]* Latin America -0.06 -0.068 [0.036] [0.031]** Crawling peg regime 0.05 0.071 [0.041] [0.036]** M2 / GDP 0.179 [0.036]*** Net debt liabilities -0.163 -0.392 -0.064 -0.064 [0.057]*** [0.061]*** [0.021]*** [0.020]*** Creditor x Net debt 0.058 0.062
liabilities [0.027]** [0.027]** Growth in net 0.362 0.361
debt liabilities [0.187]* [0.188]* Net portfolio liabilities -0.672
[0.070]*** Anti-corruption -0.016 [0.005]*** De facto capital acct. 0.242 0.002
openness [0.058]*** [0.001]** Constant -0.035 -0.021 0.033 0.055 -0.025 -0.033 -0.006 -0.005 0.136 0.127 0.076 [0.012]** [0.014] [0.025] [0.017]*** [0.013]* [0.012]*** [0.014] [0.014] [0.066]** [0.075]* [0.035]** # Observations 53 53 53 53 78 78 78 78 74 74 74 Adj. R-square 0.59 0.63 0.70 0.86 0.64 0.66 0.72 0.72 0.24 0.25 0.61
NOTES: Robust standard errors are given in brackets. *, **, and *** indicate significance at the 10%; 5%; and 1% levels, respectively. The column headings (1), (2), (3), and (4) correspond to the model specifications (1), (2), (3), and (4) in the text. (4) is absent under the 1999-2004 sample period because there is no significant institutional variables.
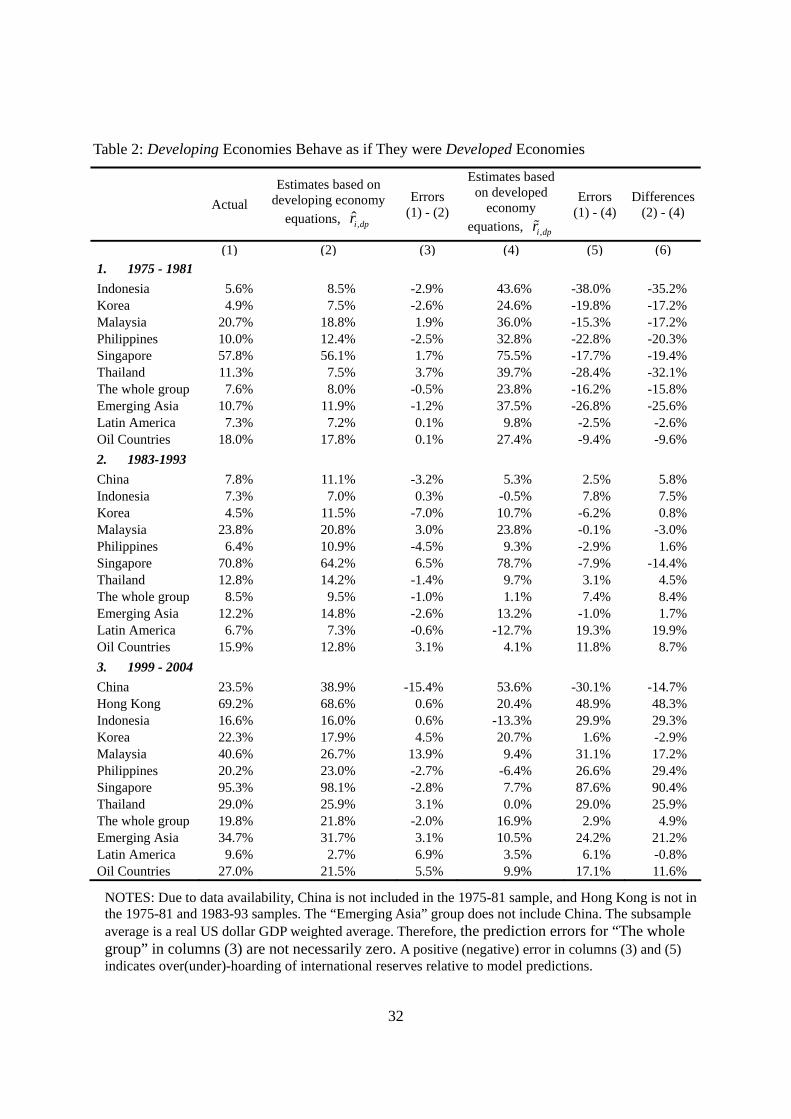
32
Table 2: Developing Economies Behave as if They were Developed Economies
Actual Estimates based on
developing economy equations, ,i dpr
Errors (1) - (2)
Estimates based on developed
economy equations, ,i dpr%
Errors (1) - (4)
Differences (2) - (4)
(1) (2) (3) (4) (5) (6) 1. 1975 - 1981 Indonesia 5.6% 8.5% -2.9% 43.6% -38.0% -35.2% Korea 4.9% 7.5% -2.6% 24.6% -19.8% -17.2% Malaysia 20.7% 18.8% 1.9% 36.0% -15.3% -17.2% Philippines 10.0% 12.4% -2.5% 32.8% -22.8% -20.3% Singapore 57.8% 56.1% 1.7% 75.5% -17.7% -19.4% Thailand 11.3% 7.5% 3.7% 39.7% -28.4% -32.1% The whole group 7.6% 8.0% -0.5% 23.8% -16.2% -15.8% Emerging Asia 10.7% 11.9% -1.2% 37.5% -26.8% -25.6% Latin America 7.3% 7.2% 0.1% 9.8% -2.5% -2.6% Oil Countries 18.0% 17.8% 0.1% 27.4% -9.4% -9.6%
2. 1983-1993 China 7.8% 11.1% -3.2% 5.3% 2.5% 5.8% Indonesia 7.3% 7.0% 0.3% -0.5% 7.8% 7.5% Korea 4.5% 11.5% -7.0% 10.7% -6.2% 0.8% Malaysia 23.8% 20.8% 3.0% 23.8% -0.1% -3.0% Philippines 6.4% 10.9% -4.5% 9.3% -2.9% 1.6% Singapore 70.8% 64.2% 6.5% 78.7% -7.9% -14.4% Thailand 12.8% 14.2% -1.4% 9.7% 3.1% 4.5% The whole group 8.5% 9.5% -1.0% 1.1% 7.4% 8.4% Emerging Asia 12.2% 14.8% -2.6% 13.2% -1.0% 1.7% Latin America 6.7% 7.3% -0.6% -12.7% 19.3% 19.9% Oil Countries 15.9% 12.8% 3.1% 4.1% 11.8% 8.7%
3. 1999 - 2004 China 23.5% 38.9% -15.4% 53.6% -30.1% -14.7% Hong Kong 69.2% 68.6% 0.6% 20.4% 48.9% 48.3% Indonesia 16.6% 16.0% 0.6% -13.3% 29.9% 29.3% Korea 22.3% 17.9% 4.5% 20.7% 1.6% -2.9% Malaysia 40.6% 26.7% 13.9% 9.4% 31.1% 17.2% Philippines 20.2% 23.0% -2.7% -6.4% 26.6% 29.4% Singapore 95.3% 98.1% -2.8% 7.7% 87.6% 90.4% Thailand 29.0% 25.9% 3.1% 0.0% 29.0% 25.9% The whole group 19.8% 21.8% -2.0% 16.9% 2.9% 4.9% Emerging Asia 34.7% 31.7% 3.1% 10.5% 24.2% 21.2% Latin America 9.6% 2.7% 6.9% 3.5% 6.1% -0.8% Oil Countries 27.0% 21.5% 5.5% 9.9% 17.1% 11.6%
NOTES: Due to data availability, China is not included in the 1975-81 sample, and Hong Kong is not in the 1975-81 and 1983-93 samples. The “Emerging Asia” group does not include China. The subsample average is a real US dollar GDP weighted average. Therefore, the prediction errors for “The whole group” in columns (3) are not necessarily zero. A positive (negative) error in columns (3) and (5) indicates over(under)-hoarding of international reserves relative to model predictions.

33
Table 3: Developed Economies Behave as if they were Developing Economies
Actual
Estimates based on developed
economy equations, ddir ,ˆ
Errors (1) - (2)
Estimates based on developing
economy equations, ddir ,
~
Errors (1) - (4)
Differences (2) - (4)
(1) (2) (3) (4) (5) (6)
1. 1975 - 1981
U.K. 5.4% 4.4% 1.0% 47.4% -42.0% -43.0%
Germany 10.3% 9.8% 0.5% 38.0% -27.7% -28.2%
Japan 3.4% 5.5% -2.1% 14.1% -10.7% -8.7% Average of developed economies 5.5% 5.0% 0.5% 35.1% -29.6% -30.1%
2. 1983 - 1993
U.K. 4.8% 7.2% -2.4% 18.4% -13.6% -11.2%
Germany 8.2% 5.2% 3.0% 20.1% -11.9% -14.9%
Japan 2.8% 9.2% -6.4% 22.2% -19.3% -12.9% Average of developed economies 5.3% 5.2% 0.1% 17.3% -12.0% -12.1%
3. 1999 – 2004
U.K. 2.8% 2.7% 0.1% 22.4% -19.7% -19.8%
Germany 4.2% 3.0% 1.2% 29.6% -25.4% -26.6%
Japan 11.6% 11.6% 0.0% 27.4% -15.8% -15.8% Average of developed economies 4.8% 5.6% -0.9% 23.1% -18.3% -17.5%
NOTES: The average is a real US dollar GDP weighted average. Therefore, the prediction errors for “Average of developed economies” in columns (3) are not necessarily zero. A positive (negative) error in columns (3) and (5) indicates over- (under-) hoarding of international reserves relative to model predictions.

34
Table 4: Predicted Values of the 1999 – 2004 International reserves from Different Model Vintages
Actual Estimates based on the 1999-04
Model
Errors (1) - (2)
Estimates based on the 1983-93
Model
Errors (1) - (4)
Estimates based on the 1975-81
Model
Errors (1)-(6)
(1) (2) (3) (4) (5) (6) (7) 1. Developed Economies U.K. 2.8% 2.7% 0.1% 24.3% -21.6% 17.4% -14.6% Germany 4.2% 3.0% 1.2% 15.1% -10.9% 11.7% -7.6% Japan 11.6% 11.6% 0.0% 16.5% -4.9% 8.1% 3.5% Average of developed economies 4.8% 5.6% -0.9% 9.5% -4.7% 5.9% -1.2% 2. Developing Economies China 23.5% 38.9% -15.4% 114.5% -90.9% 164.9% -141.4% Hong Kong 69.2% 68.6% 0.6% 55.8% 13.4% 379.5% -310.2% Indonesia 16.6% 16.0% 0.6% 6.3% 10.3% 7.0% 9.5% Korea 22.3% 17.9% 4.5% 41.9% -19.5% 54.7% -32.4% Malaysia 40.6% 26.7% 13.9% 40.9% -0.4% 59.5% -18.9% Philippines 20.2% 23.0% -2.7% 17.7% 2.5% 15.7% 4.5% Singapore 95.3% 98.1% -2.8% 56.9% 38.4% 269.3% -174.0% Thailand 29.0% 25.9% 3.1% 20.2% 8.8% 28.2% 0.8% Average of developing economies 19.8% 21.8% -2.0% 40.3% -20.4% 73.4% -53.5% Emerging Asia 34.7% 31.7% 3.1% 36.2% -1.4% 100.6% -65.9% Latin America 9.6% 2.7% 6.9% 13.2% -3.6% 27.7% -18.1% Oil Countries 27.0% 21.5% 5.5% 9.3% 17.6% 39.6% -12.6%
NOTES: The (subsample) averages real US dollar GDP weighted averages and thus are not necessarily zeros. A positive (negative) error in columns (3), (5), and (7) indicates over- (under-) hoarding of international reserves. The “Emerging Asia” group does not include China.

35
Figure 1: International Reserves – the World and Selected Economies
0
500
1000
1500
2000
2500
3000
3500
4000
1985 1990 1995 2000 2004
China Japan Japan+China+Korea+Malaysia+Taiwan WorldBillions dollars
Source: World Development Indicator and IFS
Figure 2: Incremental Explanatory Power of the Determinants
-0.10
0.00
0.10
0.20
0.30
0.40
0.50
0.60
0.70Macro Charac. Dummies Financial Institutional
Macro 0.44 0.21 0.19 0.59 0.64 0.24 Charac. Dummies 0.07 -0.02 -0.03 0.04 0.02 0.01 Financial 0.25 0.51 0.55 0.07 0.06 0.36 Institutional 0.04 0.09 0.00 0.16 0.00 0.00
1975-81 1983-93 1999-2004 1975-81 1983-93 1999-2004Developed Economies Developing Economies

36
Figure 3: Developing Economies Behave as if They were Developed Economies
A: 1975 - 1981
-0.1
0
0.1
0.2
0.3
0.4
0.5
0.6
0.7
0.8
ISR
ARG
TTO
URY
ZAF
KOR
JAM
CHL
TUR
GTM JO
RDOM
ECU
TUN
BOL
CIV
HND
EGY
THA
ZWE
SEN
NGA
TGO
KEN
GHA M
LI
B: 1983 – 1993
-0.2
0
0.2
0.4
0.6
0.8
1
1.2
ARE
SGP
CYP
KOR
MEX
HUN
BRA
LBN
MYS
BWA
DZA
SLV
GTM TH
ASW
ZPH
LCIV HT
IZW
ESE
NCHN
TGO
MDG LA
ONE
RUG
AET
H

37
C: 1999 - 2004
-0.2
0
0.2
0.4
0.6
0.8
1
HKG
ISR
KOR
ARG
MEX
CZE
HUN
POL
EST
PAN
SVK
MYS
LVA
BRA
ZAF
DOM
PER
RUS
JOR
BGR
EGY
ECU
ALB
BLR
BOL
CHN
IDN
AZE
GEO
CM
R
IND
KEN
ZM
B
MDA
TZA
MDG
TJK
Actual levels of international reserves Simple predicted values from the models of developing economies Cross predicted values from the models of developed economies
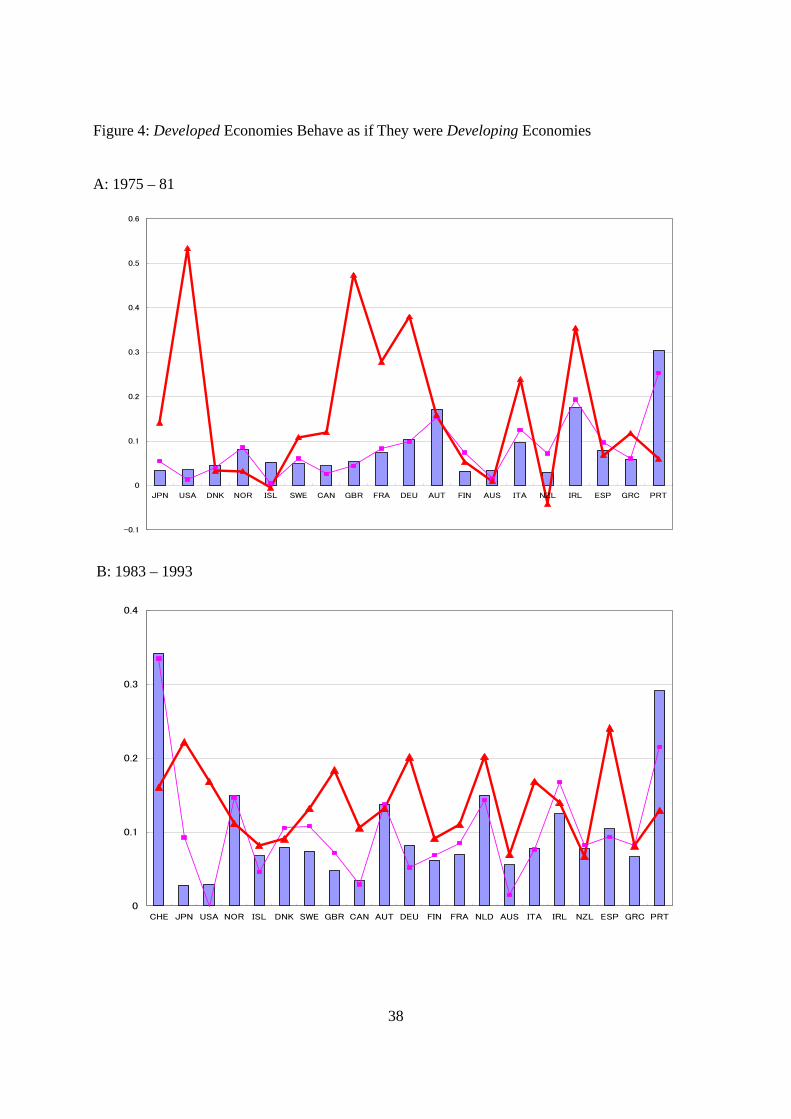
38
Figure 4: Developed Economies Behave as if They were Developing Economies A: 1975 – 81
-0.1
0
0.1
0.2
0.3
0.4
0.5
0.6
JPN USA DNK NOR ISL SWE CAN GBR FRA DEU AUT FIN AUS ITA NZL IRL ESP GRC PRT
B: 1983 – 1993
0
0.1
0.2
0.3
0.4
CHE JPN USA NOR ISL DNK SWE GBR CAN AUT DEU FIN FRA NLD AUS ITA IRL NZL ESP GRC PRT

39
C: 1999 - 2004
-0.6
-0.5
-0.4
-0.3
-0.2
-0.1
0
0.1
0.2
0.3
0.4
NOR JPN USA CHE ISL DNK SWE IRL GBR AUT FIN CAN NLD DEU FRA AUS ITA ESP NZL GRC PRT
Actual level of international reserves Simple predicted values from the models of developed economies Cross predicted values from the models of developing economies