a cross-country study on the relationship between ... full_paper_final.pdf · a cross-country study...
TRANSCRIPT

A cross-country study on the relationship
between financial development and earnings management
Masahiro Enomoto*
Kobe University, Kobe, Japan
Fumihiko Kimura†
Tohoku University, Sendai, Japan
Tomoyasu Yamaguchi‡
Tohoku Gakuin University, Sendai, Japan
February 2014
Acknowledgments
The authors gratefully acknowledge the financial support from The Japan Securities Scholarship
Foundation and Ishii Memorial Securities Research Foundation.
* Corresponding author
Research Institute for Economics & Business Administration, Kobe University, 2-1 Rokkodaicho, Nada-ku, Kobe
657-8501, JAPAN. E-mail: [email protected]. Tel: +81-78-803-7031; fax: +81-78-803-7031. † Graduate School of Economics and Management, Tohoku University, 2-2-1 Katahira, Aoba-ku, Sendai 980-8576,
JAPAN. E-mail: [email protected]. Tel: +81-22-217-6282; fax: +81-22-217-6282. ‡ Faculty of Business Administration, Tohoku Gakuin University, 1-3-1 Tsuchitoi, Aoba-ku, Sendai 980-8511,
JAPAN. E-mail: [email protected]. Tel: +81-22-721-3471; fax: +81-22-721-3471.

A cross-country study on the relationship
between financial development and earnings management
Abstract
This paper investigates whether the level of financial development influences earnings
management in an international setting. We deal with accrual-based and real earnings
management. While prior cross-country research on financial accounting treats legal traditions,
outside investor protection, and corporate governance as non-accounting institutions, we focus
on financial development. Financial development is defined as the factors, policies, and
institutions that lead to effective financial intermediation and markets, as well as deep and broad
access to capital and financial services (The World Economic Forum, 2012). Given financial
accounting’s key role of offering information to investors, under the accounting standards of
each country, we propose that there is a link between financial development and the resulting
outcomes from accounting institutions. We examine the relationship between financial
development and both types of earnings management using 54,178 observations in 37 countries
from 2009 to 2012. The results show that a manager is restrained in both types of earnings
management when under a higher level of financial development. We interpret the results as
showing (1) higher quality accounting information is needed in countries with more developed
financial systems, (2) there is a link between financial development and accounting institutions
in each country, and (3) financial development disciplines managers and mitigates their
incentives to manage earnings.
JEL Classification: M41
Key Words: Financial development, Accounting institutions, Earnings management
1
1. Introduction
The purpose of this paper is to investigate whether the level of financial development in a
country influences earnings management in that country. Financial development is closely
related to the spread of financial accounting. We focus on financial development as a crucial
factor of managerial discretion internationally. Our measure for financial development is based
on the World Economic Forum. The scores cover a wide range of institutional factors used in
prior research. The results of this paper provide some evidence that financial development
influences the reporting incentive of a country’s manager in an international setting. In other
words, we show a relationship between accounting institutions and non-accounting institutions.
Leuz and Wysocki (2009) and Wysocki (2011) emphasized new institutional accounting
research that focuses on relationships between accounting and institutional factors. They point
to two critical issues; that accounting institutions are key economic institutions, and that a
linkage between accounting institutions and non-accounting institutions exists. Accounting
institutions include accounting standards, disclosure systems, audits, and so forth.
Non-accounting institutions include legal systems, corporate governance mechanisms, the
existence and enforcement of laws governing investor protection, and disclosure standards
(Wysocki, 2011, 312). Both institutions vary from country to country.
A useful method in new institutional accounting research is cross-country analysis. For
example, Ball, Robin, and Wu (2003) investigate the properties of accounting income in four
countries (Hong Kong, Malaysia, Singapore, and Thailand) and show that “their financial
reporting quality is not higher than under code law, with quality operationalized as timely
recognition of economic income (particularly losses).” As for non-accounting institutions, Leuz,
Nanda, and Wysocki (2003) and Boonlert-U-Thai, Meek, and Nabar (2006) define investor
protection as the power to prevent managers from expropriating minority shareholders and
creditors within the constraints imposed by law. Leuz, Nanda, and Wysocki (2003) examine the
relationships between outside investor protection and earnings management in 31 countries,
from 1990 to 1999, and find that earnings management decreases in countries with stronger
2
investor protection. Boonlert-U-Thai, Meek, and Nabar (2006) also investigate earnings
management in 31 countries, from 1996 to 2002, and they suggest that earnings are smoothed in
countries where investor protection has progressed. Bushman and Piotroski (2006) examine
conservatism in earnings among the countries, and suggest that various institutions, such as
legal systems, ownership structures, and taxation, have an effect on the degree of conservatism.
While prior cross-country research on financial accounting treats legal traditions, outside
investor protection, and corporate governance as non-accounting institutions, we focus on
financial development. Financial development is defined as the factors, policies, and institutions
that lead to effective financial intermediation and markets, as well as deep and broad access to
capital and financial services (The World Economic Forum, 2012). Given financial accounting’s
key role of offering information to investors, under the accounting standards of each country, we
propose that there is a link between financial development and the resulting outcomes from
accounting institutions.
In this paper, we measure financial development based on The Financial Development
Report from the World Economic Forum.1 The report ranks 62 countries according to different
aspects of complex financial systems. These are based on research and data from organizations
such as the World Bank and the IMF including the institutional environment, the business
environment, financial stability, banks, capital markets, overall capital availability, and access.
They are used frequently in research on financial development, and reflect the various aspects of
non-accounting institutions. They are, therefore, suitable measures for our research. In addition,
the scores for rank are updated annually, and those that relate to institutional factors are usually,
in most previous cross-country research, fixed in the sample period. In fact, these scores should
vary with economic circumstances and revisions of laws and regulations. It is, therefore,
appropriate for this study to adopt the scores of the World Economic Forum, and it should be
noted that almost all scores are changing every year. For example, the score relating to the
1 The World Economic Forum is an independent international organization committed to improving the state of the
world by engaging business, political, academic and other leaders of society to shape global, regional and industry
agendas (http://www.weforum.org/).
3
institutional environment in the United Kingdom has risen from 5.54 in 2009 to 6.00 in 2012.
Looking at previous research, we focus on earnings management as an economic
consequence caused by accounting institutions. Earnings management is one of the subjects of
capital market-based accounting research and positive accounting theory, and is a crucial factor
affecting accounting quality (see Dechow, Ge, and Schrand, 2010). Because accounting
information is essential to the development of financial markets and transactions, financial
development brings about the expanded use of accounting information.
This could lead to two patterns in the relationship between earnings management and
financial development. One is that earnings management is more often implemented in
countries with higher financial development, because a growing use of accounting information
produces a greater benefit from earnings management. The other is that earnings management is
restricted in countries with higher financial development, because earnings management is
strictly monitored or more severely punished in some cases. Further, while extensive research
relating to earnings management has covered accrual-based earnings management (AEM), we
focus on real earnings management (REM) that affects a firm’s real activities.
This paper examines the relationship between AEM, REM, and financial development by
using 54,178 observations in 37 countries from 2009 to 2012. The results show that managers
are restrained from using both AEM and REM when under higher financial development. Our
evidence is robust, with the use of multiple financial development scores and the exclusion of
observations from U.S. and Japan and the elimination of firm-years in 2009.
The most important contributions of this paper are as follows. First, we expend on the
earnings management research by investigating the relationship between financial development
and earnings management. Our paper provides the evidence that financial development restrains
earnings management, both AEM and REM, by disciplining a manager’s behavior. The results
suggest that managers in countries with more developed financial systems are required to
provide a higher level of transparency with regard to their financial accounting information. In
other words, financial development leads to increased monitoring, scrutiny, and punishment
4
from outside of the firm and puts pressure on a manager’s ability to manipulate a firm’s real
activities as well as accruals. Although prior research has already shown negative relationships
between AEM and investor protection, there is scant evidence of an association between
earnings management and financial development. We added the REM measures of
Roychowdhury (2006) as a proxy to capture managers’ discretionary behavior at the
international level while Leuz, Nanda, and Wysocki (2003) and Haw, Hu, Hwang, and Wu
(2004) use AEM mainly as a proxy for earnings management. Our results are also in conflict
with Francis, Hasan, and Li (2011) who show that the substitution of REM for AEM in
countries with stronger investor protection is prevalent. This substitution is frequently observed
in prior research that uses data from a single country setting, but it is not found at the
international level in our study.
Second, we refine the global impact of financial development on accounting at a firm level
employing the comprehensive measure of financial development. Further, our score includes
many institutional factors which prior research frequently employ as a critical determinant of
earnings management at the international level. Therefore, this paper contributes to a growing
literature evaluating the factors of international differences in the quality of accounting
information.
The remainder of the paper is organized as follows. Section 2 considers the relationship
between earnings management and financial development. Section 3 delineates the research
design of the study. Section 4 contains the results of the econometric analysis. Section 5
concludes the paper with an extensive discussion of suggestions for future research.
2. Hypothesis development
2.1. Financial development and earnings management
The circumstances surrounding a firm’s financing activities differ from one country to another.
A great deal of cross-country research into financial theory suggests that financial development
is related to economic growth. For example, Beck and Levine (2004) use a dataset of 40

5
countries, from 1976 to 1998, and conclude that fully functional financial systems ease
information and transaction costs and thereby enhance resource allocation and economic growth.
The World Economic Forum (2012, xiii) defines financial development as the factors, policies,
and institutions that lead to effective financial intermediation and markets, as well as deep and
broad access to capital and financial services. It also points out that financial development is
dictated by seven pillars, specifically (1) Institutional environment, (2) Business environment,
(3) Financial stability, (4) Banking financial services, (5) Non-banking financial services, (6)
Financial markets, and (7) Financial access. Each pillar aggregates 12 to 26 indices.2
All pillars have a relationship with financial accounting to a greater or lesser extent. This
paper aims to examine the effect of financial development on financial accounting. However,
three pillars, (2) Business environment, (3) Financial stability, and (7) Financial access,
associate only weakly with financial accounting. Therefore, we have deleted these three pillars
and selected the remaining four from the perspective of the importance of financial accounting.
The definition of the seven pillars and the reason for eliminating the three is described in
Section 3.2.
Next, we discuss the relationship between financial accounting and financial development.
Financial accounting is expected to play an important role in the financial systems of each
country and in the global financial system. The FASB Statement of Financial Accounting
Concepts No. 1 states that financial reporting should provide information that is useful to
present and potential investors in making rational investment decisions (par. 34), and provide
information to help present and potential investors in assessing the amounts, timing, and
uncertainty of prospective cash receipts (par. 37). In addition, the conceptual framework of
International Financial Reporting Standards (IFRS) states that the objective of general purpose
financial reporting is to provide financial information about the reporting entity that is useful to
present and potential equity investors, lenders, and other creditors in making decisions in their
capacity as capital providers. Information that is decision useful to capital providers may also be
2 See The World Economic Forum (2012, 313-383) for details of the indices.
6
useful to other users of financial accounting information who are not capital providers (IASB,
2008, OB2).3
Wysocki (2011, 311) points out that accounting is one institutional mechanism that can help
lower transaction costs, reduce information costs and information asymmetry, lower
coordination costs and improve enforcement of property rights, and that accounting is the
growing body of evidence about which institutions are the primary mechanisms for financial
market development. This suggests that the goal of offering accounting information is to
develop and maintain the financial system in a country. However, in order to achieve this goal,
the accounting information presented by managers is subject to monitoring and scrutiny by
auditors and stakeholders. Managers prepare financial statements under pressure. We, therefore,
argue that higher quality accounting information is required in countries with more developed
financial systems.
The quality of accounting information is affected by earnings management. Earnings
management is defined as the choice by a manager of accounting policies, or real actions that
affect earnings so as to achieve a specific reported earnings objective (Scott, 2011, 423). Some
previous research suggests that the motivation of earnings management is related, to an
appreciable degree, to financing activities and related legal issues. Examples discussed are
raising stock prices in an initial public offering (Teoh, Welch, and Wong, 1998a), secondary
equity offering (Teoh, Welch, and Wong, 1998b), avoiding debt covenant violation (Bikky and
Picheng, 2002), meeting or beating analyst expectations (Bartov, Givoly, and Hayn, 2002), and
the Sarbanes-Oxley Act of 2002 (Cohen, Dey, and Lys, 2008).
Based on the above discussions, there are two scenarios in the relationship between earnings
management and the financial development of each country. One is that higher financial
development is likely to encourage earnings management because managers acquire the benefits
of spreading the use of accounting information about stakeholders. Another is that higher
financial development is likely to constrain earnings management. The reason is that, with
3 Examples of other users of financial accounting information that are not capital providers are regulators, securities
exchanges, analysts, auditors, and so forth.
7
financial development, managers fear monitoring, scrutiny, and punishment from outside of the
firm, and new accounting standards, that narrow their discretion to achieve target income, might
be adopted.4
2.2. The choice between AEM and REM
In this subsection, we explain the two types of earnings management, provide an overview of
previous research into earnings management in an international setting, and develop our
hypotheses. As mentioned in section 1, earnings management is divided into AEM and REM.
AEM alters the accrual process to manage earnings. AEM leads to the reversal of accruals in
subsequent periods, but does not have a direct effect on cash flow.5 Unlike REM, managers are
allowed to implement AEM after the period-end. REM reflects a firm’s real activities and
manages earnings through changing the timing or structure of an operating, investment, or
financial decision. REM may reduce future cash flow due to non-optimal decisions, such as
opportunistically reducing R&D and advertising costs, increasing price discounts, and
overproducing to decrease unit costs.
Prior research shows that there is the relationship between earnings management and
institutional factors in international settings, employing mainly accrual-based measures as a
proxy for earnings management. Leuz, Nanda, and Wysocki (2003) look at 31 countries, from
1990 to 1999, and show that AEM decreases in countries with stronger investor protection.6
Similar findings are also shown in Haw, Hu, Hwang, and Wu (2004) using 31 countries, from
1996 to 1999. Boonlert-U-Thai (2006) investigates the relationship between investor protection
4 The former is that financial development (i.e. non-accounting institution) directly influences the manager’s
incentives to manage earnings. For example, the extent of anti-director rights and/or legal enforcement (Leuz, Nanda,
and Wysocki, 2003; Francis, Hasan, and Li, 2011) and the number of analyst followings in countries with high
financial development (Degeorge, Ding, Jeanjean, and Stolowy, 2013) have been tested. Investor protection by law
and financial intermediation are incorporated into our financial development score (see details in section 3.2.). The
latter is the indirect effect of financial development on earnings management via the changes in accounting
institutions. Barth, Landsman, and Lang (2008) and Ipino and Parbonetti (2011) examine the impact of the adoption
of IFRS on accounting quality. In other words, there are two possible channels where financial development might
impact earnings management. We do not distinguish between the direct and indirect effect, but financial development
probably influences all the examples above. 5 The reversal of accruals is detailed in Dechow, Hutton, Kim, and Sloan (2012). 6 Three of the four measures of earnings management in Leuz, Nanda, and Wysocki (2003) are based on accruals and
can, therefore, be regarded as AEM. Another is loss avoidance.
8
and AEM in 31 countries, from 1996 to 2002, and suggests that earnings are smoothed by
accruals in countries where investor protection has progressed. Francis and Wang (2008) use 49
countries, from 1995 to 2004, and provide evidence that earnings quality improves at firms
audited by brand name auditors in countries with stronger investor protection.7 Generally,
financial development requires stricter investor protection. From the above discussion, we
predict that AEM is decreases with financial development.
Degeorge, Ding, Jeanjean, and Stolowy (2013) use 21 countries, from 1993 to 2002 and find
that analyst following negatively affects AEM in countries with high levels of financial
development. However, it is not clear if financial development has a direct effect on AEM.
Next, we should review the relationship between AEM and REM in an international setting,
but little research has been done on this. Francis, Hasan, and Li (2011) show that REM is
encouraged and AEM is discouraged in countries with stronger legal environments, but they do
not include critical variables relating to financial development8 Enomoto, Kimura, and
Yamaguchi (2013) also investigate the relationship between AEM, REM, and investor
protection. Although they use analyst following as a proxy for financial intermediaries, their
discussion and analysis are based on country data rather than firm-year data.
A manager may choose AEM and/or REM to manage earnings under the prevailing economic
conditions. Many studies have pointed out that managers tend to employ REM rather than AEM
to achieve target income since AEM is more likely to incur the scrutiny of auditors, regulators
and others (Graham, Harvey, and Rajgopal, 2005; Roychowdhury, 2006; Cohen and Zarowin,
2010; Gunny, 2010). Kim, Lei, and Pevzner (2010) also argue that AEM may lead to litigation,
SEC investigation, and criminal liability for managers as well as the scrutiny of auditors. Their
research suggests that AEM may be costly when it is revealed.
Meanwhile, Kothari, Mizik, and Roychowdhury (2012) state that REM is easier to
camouflage as normal activities than AEM. Further, they argue that discretion, relating to
7 We can interpret their finding in relation to AEM, because their evidence is based on abnormal accruals. 8 Ipino and Parbonetti (2011) also show that a substitution between AEM and REM is detected when IFRS becomes
mandatory.
9
operating and investment activities, is inherently given to managers by shareholders. From
surveys and interviews with executives, Graham, Harvey, and Rajgopal (2005) present evidence
suggesting that managers prefer REM because they fear overzealous regulators. Prior research
has argued that managers may prefer REM to avoid the scrutiny and oversight of stakeholders,
in spite of the higher cost to the firm in the future. Graham, Harvey, and Rajgopal (2005) and
Cohen and Zarowin (2010) state that REM that reduces maintenance, advertising costs, and
positive NPV investments may be more costly to firms than AEM as this behavior may not
maximize the future value of the firm. Badertscher (2011) finds that managers compare the
future cost of AEM and REM, and employ REM before AEM.
One purpose of this paper is to clarify whether REM would be employed more in countries
with higher financial development. If financial development heightens the monitoring and
scrutiny of accounting figures, then AEM is less prevalent under high financial development,
and more prevalent under low financial development. Does the manager, then, substitute AEM
with REM, or avoid both AEM and REM in an environment of high financial development? As
mentioned in the previous subsection, accounting information under higher financial
development plays an important role in a range of decision making in financial markets and
firms, as well as in the enforcement of many kinds of laws, regulations, and contracts. Relevant
and reliable accounting information is typically required for investors to take risks and make
decisions.
Accounting standards can, therefore, be regarded as regulations for firms and their revision
can result in managers engaging in discretionary behaviors. Ewert and Wagenhofer (2005)
analytically show that tight accounting standards restrict managers’ discretion to manipulate
accruals, leading them to prefer REM. In addition, Cohen, Dey, and Lys (2008) provide
evidence that managers have shifted away from AEM to REM in the post Sarbanes–Oxley Act
(SOX) period. The passage of SOX can be seen as strengthening regulations, thus increasing the
restraint on employing AEM and leading to an inducement to employ REM. Chi, Lisic, and
Pevzner (2011) provide evidence that managers tend to avoid AEM under higher quality audit
10
conditions, which in turn leads to the employment of REM.
The scrutiny of auditors, therefore, reduces AEM, but increases REM. The research provides
evidence of a substitution between AEM and REM as AEM becomes increasingly constrained.
In fact, Francis, Hasan, and Li (2011) conclude that managers in countries with stronger legal
environment face a higher risk of litigation due to AEM and, therefore, resort to focusing on real
activities. If we assume that financial development can be regarded as a type of institutional
factor, analogous to investor protection, then it may lead managers to reduce AEM and shift to
REM instead.
However, Leuz, Nanda, and Wysocki (2003, 506) mention that “strong and well enforced
outsider rights limit insiders’ acquisition of private control benefits and, consequently, mitigate
insiders’ incentives to manage accounting earnings because they have little to conceal from
outsiders.” The mitigation of managers’ incentives may reduce overall managerial discretionary
behaviors, both AEM and REM. We can infer that as managers are disciplined by strengthening
regulation and investor protections other than the legal system, they will avoid AEM and REM
in the development of financial systems.
Monitoring and scrutiny by stakeholders also discipline managers’ behavior. Wongsunwai
(2013) shows that firms backed by higher quality venture capital do not appear to engage in
both REM and AEM. This means that high quality venture capitalists monitor their portfolio
companies closely and effectively and then behave rationally leading to a constraint of REM. In
other words, sophisticated investors understand the future implications of REM and take into
consideration in decision-making. Kim and Sohn (2013) find that cost of capital positively
relates to REM, when compared with AEM. Based on this evidence, it appears that rational
investors see through the adverse effects on future cash flow of REM. These studies also
suggest that sophisticated market participants monitor managers’ value-destroying behavior and
effectively restrain managers from earnings management by compelling them to keep
stakeholders’ reactions in mind.
What is the effect of financial development on AEM and REM? With higher financial
11
development, more accounting information is required. Financially sophisticated stakeholders
pay close attention to the accounting numbers. Therefore, we hypothesize that managers tend to
avoid AEM where there is higher financial development. For REM, our hypotheses are twofold.
First, if the substitution effect between the two types of earnings management occurs, REM is
restrained in countries with high financial development since AEM becomes more costly.
Second, earnings management, both AEM and REM, reduces with high financial development,
because managers are disciplined by higher financial development. In the next section, we
provide the research design to test the hypotheses.
3. Research Design
3.1. Earnings management measures
3.1.1. Accrual-based earnings management measure
Following previous research (e.g., Warfield, Wild, and Wild, 1995; Becker, DeFond,
Jiambalvo, and Subramanyam, 1998; Cohen, Dey, and Lys, 2008), we use the absolute value of
abnormal accruals as an AEM measure in order to capture both the effects of income-increasing
and income-decreasing AEM. To measure abnormal accruals, we use the cross-sectional
modified Jones (1991) model (see DeFond and Jiambalvo, 1994; Dechow, Sloan, and Sweeney,
1995; Becker, DeFond, Jiambalvo, and Subramanyam, 1998). Specifically, we estimate the
following regression model for each industry-year combination in each country, where industry
is identified by a two-digit SIC code.
ACCijt / Aijt-1 = β0 + β1 (1 / Aijt-1) + β1 ((ΔSijt - ΔARijt) / Aijt -1) + β3 (PPEijt / Aijt -1) + εijt (1)
ACC is accruals that is calculated by net income minus operating cash flow reported in the
statement of cash flow; A is the total assets; ΔS is the change in net sales; ΔAR is the change in
accounts receivable; PPE is the net property, plant, and equipment; the subscripts refer to firm i,
country j, and time t. Abnormal accruals are calculated as the estimated residuals from equation
12
(1), and its absolute value is our proxy for AEM (|A_ACC|).
3.1.2. Real earnings management measures
Following Roychowdhury (2006), Cohen, Dey, and Lys (2008), and Cohen and Zarowin
(2010), we developed the proxy for three methods of REM: (1) sales manipulation, (2) reduction
of discretionary expenses, and (3) overproduction. Sales manipulation is managers' behavior
that tries to increase sales through price discounts or more lenient credit terms. As long as the
margins are positive, the additional sales will increase earnings in the current period. However,
both price discounts and more lenient credit terms lead to lower margins, resulting in lower cash
flow from operations (CFO) and higher production costs compared with the sales.
Reduction of discretionary expenses can also be an earnings management method. Managers
can increase earnings by the reduction of discretionary expenses such as R&D and advertising
costs. Reducing such expenses should lead to low discretionary expenses.
Overproduction is the production of greater than expected demand in order to increase
earnings. If managers engage in overproduction, fixed overhead costs are allocated to a larger
number of units, thereby lowering fixed costs per unit. As long as the decrease in fixed costs per
unit is not offset by any increase in marginal cost per unit, the total cost per unit decreases. As a
result, this decreases the cost of goods sold and increases earnings. However, overproduction
leads to higher production costs and lower CFO than normal production level given the sales,
because of additional production and holding costs.
In summary, sales manipulation and overproduction lead to abnormally high production costs
relative to sales, and abnormally low cash flow from operating activities relative to sales, while
the reduction of discretionary expenditures leads to abnormally low discretionary expenses
(Roychowdhury 2006, 340-341).9
To measure the abnormal level of CFO (A_CFO), discretionary expenses (A_DE), and
production costs (A_PD), we estimate the following regression models. Similar to equation (1),
9 If the firm paid for discretionary expenses in cash, reduction of discretionary expenses could also lead to
abnormally high cash flow (Roychowdhury 2006; Cohen and Zarowin 2008).
13
the regression models are estimated for each industry-year combination in each country, where
industry is identified by a two-digit SIC code.
CFOijt / Aijt-1 = β0 + β1 (1 / Aijt-1) + β2 (Sijt / Aijt-1) + β3 (ΔSijt / Aijt-1) + εijt (2)
DEijt / Aijt-1 = β0 + β1 (1 / Aijt-1) + β2 (Sijt-1 / Aijt-1) + εijt (3)
PDijt / Aijt-1 = β0 + β1 (1 / Aijt-1) + β2 (Sijt / Aijt-1) + β3 (ΔSijt / Aijt-1) + β4 (ΔSijt-1 / Aijt-1) + εijt (4)
CFO represents the operating cash flows reported in the statement of cash flows; DE represents
the selling, general, and administrative expenses; PD represents production costs and is
calculated as the cost of goods sold plus the change in inventory; and S represents the net
sales.10
A_CFO, A_DE, and A_PD are calculated as the estimated residuals from equations (2),
(3), and (4), respectively.
Since the three types of REM described above might be implemented to decrease earnings,
consistent with Francis, Hasan, and Li (2011) and Kim and Sohn (2013), we convert A_CFO,
A_DE, and A_PD to the absolute values and use them as our REM proxies (|A_CFO|, |A_DE|,
and |A_PD|, respectively).11
In addition, we combine these three measures to capture the total
effects of REM. Consistent with Cohen and Zarowin (2010), we multiply A_CFO and A_DE by
negative one, and add them to A_PD in order that higher values indicate greater
income-increasing earnings management. Again, considering the possibility of
income-decreasing REM, we convert the aggregated REM measure to the absolute values and
use it as our fourth REM proxy (|REM|).
10 Following Bartov and Cohen (2009) and Gunny (2010), we use selling, general, and administrative expenses as
discretionary expenses because they frequently include discretionary expenses such as R&D and advertising costs. 11 For example, Francis, Hasan, and Li (2011) point out the possibility of income-decreasing real earnings
management from an income-smoothing perspective. When a firm’s performance is good in the current period,
managers may choose to spend more on R&D, advertising, employee training, etc. These activities have an
income-decreasing effect for the current year but an income-increasing effect for future periods (Francis, Hasan, and
Li, 2011, 9).

14
3.2. Financial development measures
We adopted the financial development score used by the World Economic Forum. The reason
for this is that it takes a comprehensive view when assessing the factors that contribute to the
long-term development of financial systems (The World Economic Forum, 2012, xiii). It also
includes various factors that are used in prior cross-country research on financial accounting,
such as corporate governance, legal and regulatory issues, and contract enforcement. The World
Economic Forum has provided a score and rank for the breadth, depth, and efficiency of 62 of
the world’s leading financial systems and capital markets since 2008. The index analyzes drivers
of financial system development that support economic growth, and thus compares the overall
competitiveness of financial systems (The World Economic Forum, 2012, xiii).
The World Economic Forum (2012, xiii) defines seven pillars as follows. (1) Institutional
environment encompasses financial sector liberalization, corporate governance, legal and
regulatory issues, and contract enforcement. (2) Business environment considers human capital,
taxes, infrastructure, and costs of doing business. (3) Financial stability captures the risk of
currency crises, systemic banking crises, and sovereign debt crises. (4) Banking financial
services measure size, efficiency, and financial information disclosure. (5) Non-banking
financial services include IPO and M&A activity, insurance, and securitization. (6) Financial
markets encompass foreign exchange and derivatives markets and equity and bond market
development. (7) Financial access evaluates commercial and retail access.
A pillar is scaled from one to seven. The financial development score is the average of the
scores relating to the seven pillars. Since all of the pillars cannot be associated with financial
accounting (and resulting earnings management), we extracted the scores from four pillars out
of the seven (Institutional environment, Banking financial services, Non-banking financial
services, and Financial markets) as the factors most closely related to financial accounting.
First, as is demonstrated above the definition of (1) Institutional environment defines overall
financial development as a fundamental structure. This pillar includes the overall laws,
regulations, and supervision of the financial sector, as well as the quality of contract
15
enforcement and corporate governance (The World Economic Forum 2012, 5). Financial
accounting is essential for all of these to work efficiently. Leuz, Nanda, and Wysocki (2003)
claim that strong investor rights and strong legal enforcement discipline managers, making
earnings management appear to be lower.
Next, (4) Banking financial services, (5) Non-banking financial services, and (6) Financial
markets are chosen. It is self-evident that accounting information smooth transactions among
firms and stakeholders within the framework of the pillars. A large number of studies have
looked at earnings management in these areas. We, therefore, focus on the above four pillars in
the main analysis that follows and our financial development score (FD) is the average score of
these.12
Unlike the four pillars, (2) Business environment, (3) Financial stability, and (7) Financial
access can be considered to have an indirect linkage to financial accounting. (3) Financial
stability is excluded because this pillar focuses on the financial crises that affect economic
growth. In a similar vein, (7) Financial access is dropped because it is assumed that greater
access to financial services is associated with the usual proxies for financial development and
resulting economic growth. At first glance (2) Business environment, including taxation policy
and the costs of doing business, seems to relate to financial accounting. However, judging from
the definition of the indices that constitute the pillar, major parts of the index are remotely
related to the necessity for financial accounting. It is, therefore, eliminated from our financial
development score.
The World Economic Forum (2012, 5) divides the seven pillars into three categories:
Financial intermediation; Financial access; and Factors, policies, and institutions. Financial
intermediation includes (4) Banking financial services, (5) Non-banking financial services, and
(6) Financial markets.13
Financial intermediation is defined as the variety, size, depth, and
efficiency of the financial intermediaries and markets that provide financial services. Our
12 In the robustness checks in section 4.3, we test using the original financial development score. 13 Factors, policies, and institutions comprise the Institutional environment, Business environment, and Financial
stability. It is defined as the foundational characteristics that allow the development of financial intermediaries,
markets, instruments, and services.
16
financial development score can, therefore, be interpreted as the financial intermediaries and the
institutional environment supporting them.
3.3. The models to test the hypotheses
To examine the relationship between financial development and earnings management, we
estimate the following regression model.
EMijt = β0 + β1 FDjt + β2 Leverageijt-1 + β3 Sizeijt-1 + β4 MTBijt-1 + β5 ROAijt + β6 NOAijt-1
+ Σ β Year_Fixed_Effect + Σ β Firm_Fixed_Effect + εijt (5)
EM represents the earnings management proxies, that is, either |A_ACC|, |A_CFO|, |A_DE|,
|A_PD| or |REM|; FD is the mean value of four pillars (Institutional environment, Banking
financial Services, Non-banking financial services, and Financial markets) in the financial
development report of the World Economic Forum; Leverage is total debt divided by total
assets; Size is the natural logarithm of the market value of equity; MTB is the market to book
ratio; ROA is the net income divided by lagged total assets; NOA is the net operating assets
divided by sales.14
When the dependent variable is the proxy for AEM (that is |A_ACC|), we predict that the
coefficient of FD has a negative sign. On the other hand, when the dependent variable is the
proxy for REM (that is |A_CFO|, |A_DE|, |A_PD|, or |REM|) the sign of the coefficient of FD
should be negative (positive) if REM is more restrained (engaged) in countries with higher
levels of financial development. In addition to FD, some variables are included to control other
factors likely to affect the earnings management proxies. Leverage is included because previous
research finds that it is related to earnings management measures (e.g., DeFond and Jiambalvo,
1994; Becker, DeFond, Jiambalvo, and Subramanyam, 1998; Roychowdhury, 2006). Following
Gunny (2010), we include SIZE and MTB to control size effects and growth opportunity
14 Following Roychowdhury (2006), we use the values at the beginning of the year for Size and MTB, and use the
values at the end of the year for ROA.
17
respectively. Depending on previous research, showing that earnings management measures are
correlated with firm performance (e.g., Kothari, Leone, and Wasley, 2005; Cohen, Pandit,
Wasley, and Zach, 2011), ROA is included as a control for firm performance. Following Barton
and Simko (2002) and Zang (2012), we include NOA as a proxy for the extent of AEM in
previous periods. Due to the limited flexibility within GAAP and the reversal of accruals, AEM
in previous periods affects managers’ ability to manipulate accruals, with a consequent impact
on REM (Zang, 2012). Finally, according to Degeorge, Ding, Jeanjean, and Stolowy (2013),
Year_Fixed_Effect and Firm_Fixed_Effect are also included in our regression to control industry
effects and year effects.
3.4. Sample Selection
Financial development and relevant data, from 2009 to 2012, are obtained from Global
Note.15
The sample period is chosen because the Financial Development Score (FD), by the
World Economic Forum, is available in Global Note from 2009. The countries in this paper are
based on the 49 in La Porta, Lopez-de-Silanes, Shleifer, and Vishny (1998). Ecuador, New
Zealand, Taiwan, Uruguay, Sri Lanka, and Zimbabwe are dropped, as their FD scores are not
included in the report of the World Economic Forum. Zimbabwe is also eliminated due to its
experience of hyperinflation in the sample period.16
The sample comprises data from Capital IQ, from which we obtained 81,317 pieces of
firm-years data, covering sales and total assets of over 1 million dollars. Next, the data for
financial services firms (2,108 firm-years) are eliminated. To calculate earnings management
measures, we require at least six firm-year observations for each industry-year combination in
each country (13,825 firm-years are excluded). To provide the condition and availability of the
relevant measures that we need, Austria, Colombia, Egypt, Kenya, Portugal, and Venezuela
(8,326 firm-years) are not included in our sample. Using this sample selection process, we
15 Global Note is the website that collects and provides various kinds of international statistics such as Gross
Domestic Product. URL: http://www.globalnote.jp/ (in Japanese). 16 We define hyperinflation as over 100% per year.
18
obtained 54,178 observations from 37 countries.
4. Empirical results
4.1. Descriptive statistics
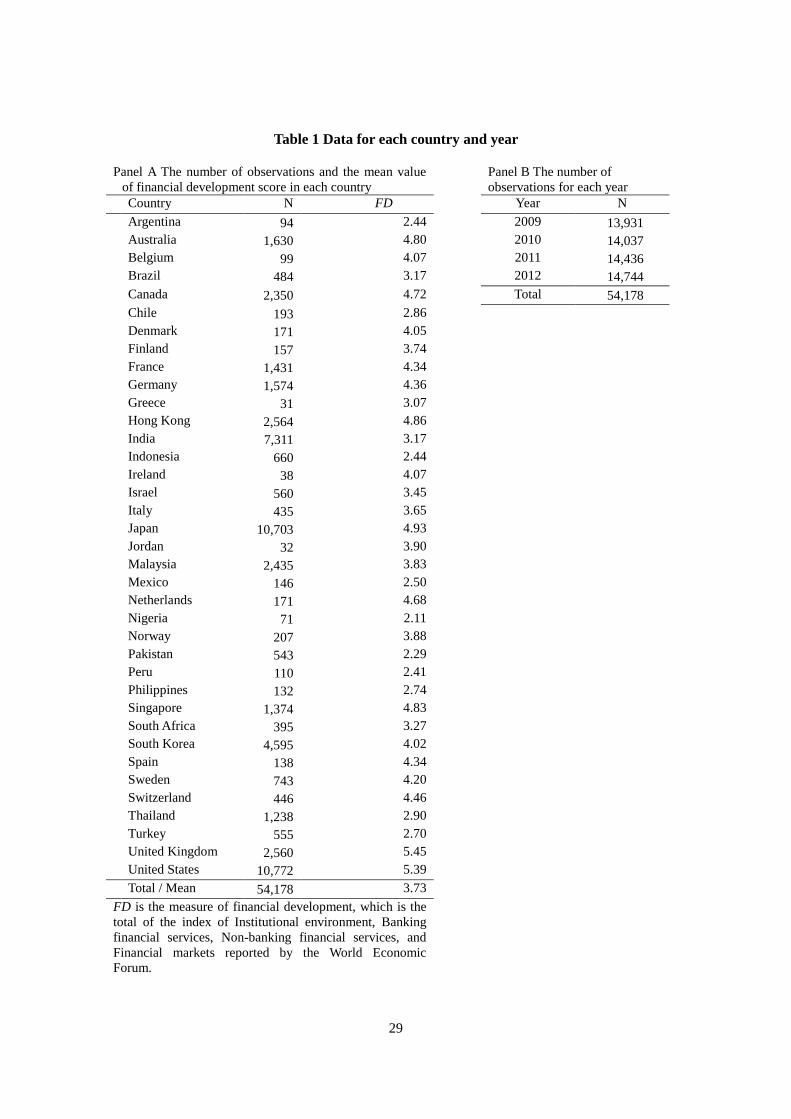
Panel A of Table 1 shows the number of firm-years in 37 countries, and the mean value of FD.
The highest number of firm-years is for the United States. (10,772 observations, 19.8%) and
Japan has a similar number. Observations for the United States and Japan occupy approximately
40% of the total. The lowest number of firm-years is Greece (31 observations).17
The third
column of Panel A reports the mean values of the financial development score (FD). FD is the
mean value of the four pillars i.e., Institutional environment, Banking financial services,
Non-banking financial services, and Financial markets. The United Kingdom has the highest
value, 5.45, in the 37 countries, and the United States is second highest. The lowest score is 2.11
for Nigeria. Only the United Kingdom and the United States have scores exceeding five.18
The
ranking is similar to Beck and Levin (2002) and Degeorge, Ding, Jeanjean, and Stolowy
(2013).19
Panel B is the number of firm-years in the sample period.
[Insert Table 1 here]
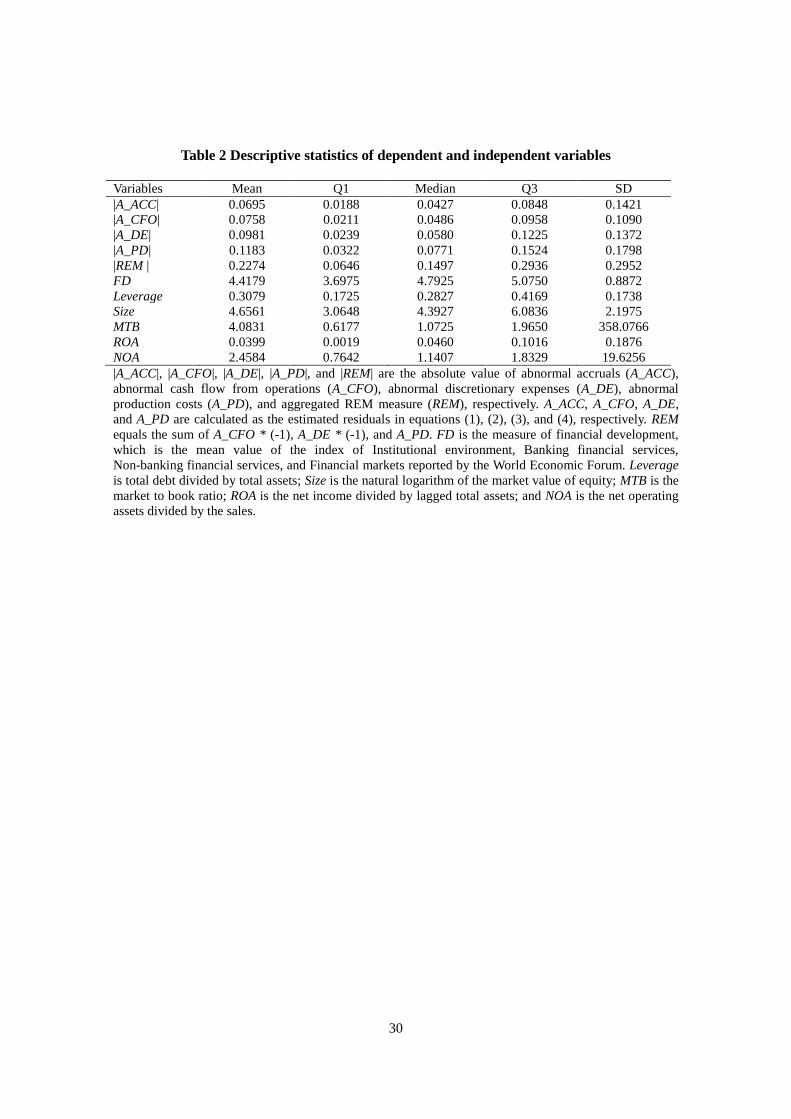
Table 2 shows the descriptive statistics for the dependent and independent variables in
equation (5). The mean values of |A_ACC|, |A_CFO|, |A_DE|, |A_PD|, and |REM| are 6.95%,
7.58%, 9.81%, 11.83%, and 22.74%, respectively. These values are slightly larger than Francis,
Hassan, and Li (2011) and smaller than Kim and Sohn (2013).20
17 The number of firm-years depends on not only the number of listed firms in each country but also the coverage by
Capital IQ. For example, India has more listed firms than Japan. 18 Original financial development scores range from the lowest value of 2.51 for Nigeria to the highest value of 5.17
for the United States, and show the same trends as our financial development score (FD). 19 Beck and Levin (2002) and Degeorge, Ding, Jeanjean, and Stolowy (2013) do not include the United Kingdom in
their sample. 20 These studies used the absolute value of abnormal accrual and three REM measures. The former uses international
data and the latter uses United States data.
19
[Insert Table 2 here]
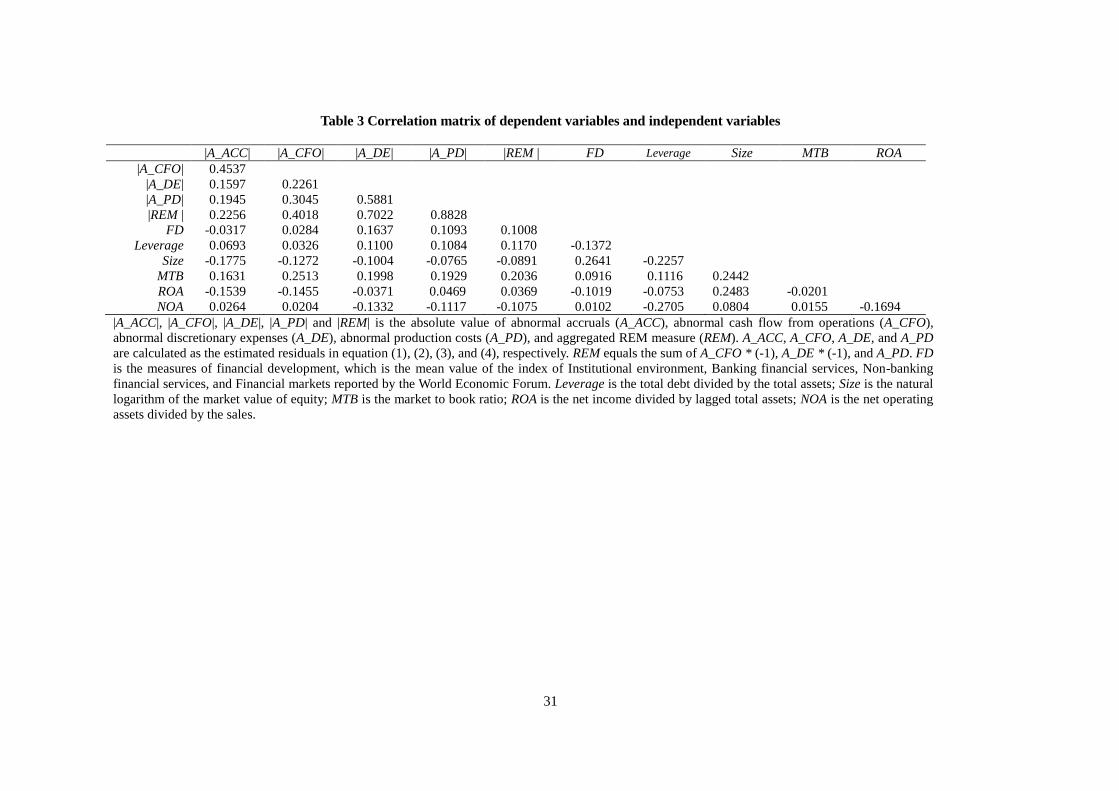
Table 3 is the correlation matrix. Since a high correlation coefficient is not observed, the
results in the regressions from this section will not be influenced by multicollinearity. FD
negatively associates with |A_ACC|, but positively correlates with |A_CFO|, |A_DE|, |A_PD|,
and |REM|.
[Insert Table 3 here]
4.2. Regression Results
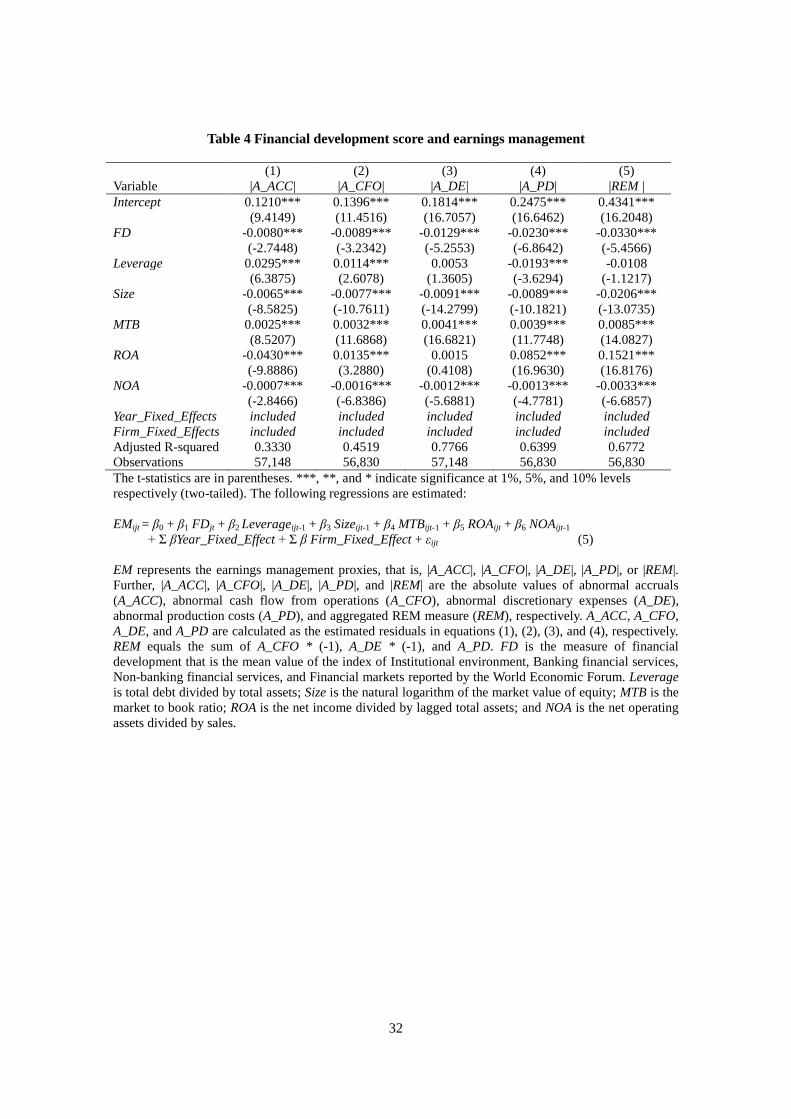
Table 4 reveals evidence of the influences of financial development on managerial behavior.21
Five types of dependent variables in the analyses are provided. Column (1) in Table 4 displays
the regression results of |A_ACC|. The coefficient of FD is significantly negative. This supports
our prediction that AEM is restrained in countries with high financial development. When
regarding financial development as an institutional factor, this result is consistent with Leuz,
Nanda, and Wysocki (2003) and Boonlert-U-Thai, Meek, and Nabar (2006). Financial
development serves as an institutional factor that inclines managers to avoid accrual-based
discretionary behaviors to manage earnings.22
[Insert Table 4 here]
In the regression, where the dependent variable is |A_CFO| (column (2) of Table 4), FD also
has a significant negative coefficient. Where the dependent variables are |A_DE|, |A_PD|, and
|REM| (column (3), (4) and (5) respectively), the coefficients of FD are also significantly
negative. From these results, it follows that financial development leads to REM reducing to
21 We winsorize all dependent and independent variable at the 1 percent and 99 percent levels. 22
Another reason for the small |abACC| of financially developed countries is that it is possible financial
development affects accounting institutions. For example, stakeholders pursuing high accounting quality require
tighter accounting standards in those countries.
20
similar levels as AEM. In economies that are relatively more financially developed, managers
would reduce noise in earnings and avoid the decrease in future revenue caused by earnings
management, fearing that stakeholders would detect these.
Taken together, the results suggest that, as financial development leads stakeholders to focus
on accounting numbers, managers may tend to avoid the costs incurred by earnings management.
These include the scrutiny of auditors and regulators, litigation, a decline in future sales, and
increasing cost of capital. The evidence supports our prediction that both types of earnings
management are restrained (e.g., Wongsunwai, 2013). This is not consistent with prior research
that shows substitution between AEM and REM (e.g. Francis, Hasan, and Li, 2011). Financial
development will discipline managers and mitigate their incentives to engage in earnings
management.
4.3. Additional tests
FD is designed to capture financial development that affects accounting information.
Therefore, FD is composed of the Institutional environment, Banking financial Services,
Non-banking financial services, and Financial markets that are extracted as the factors closely
relating to earnings quality in the original financial development score. However, the original
financial development score has a further three components, in addition to the four mentioned
above. These are Business environment, Financial stability, and Financial access. Hence, we
provide two additional tests.
One is the replacement of FD and another is the decomposition of it. First, FD is extended to
include the three components. We replace FD with the original financial development score,
Original_FD, and re-estimate equation (5). The coefficient of Original_FD in all regressions is
significantly negative (not tabulated) and supports the results of Table 4.
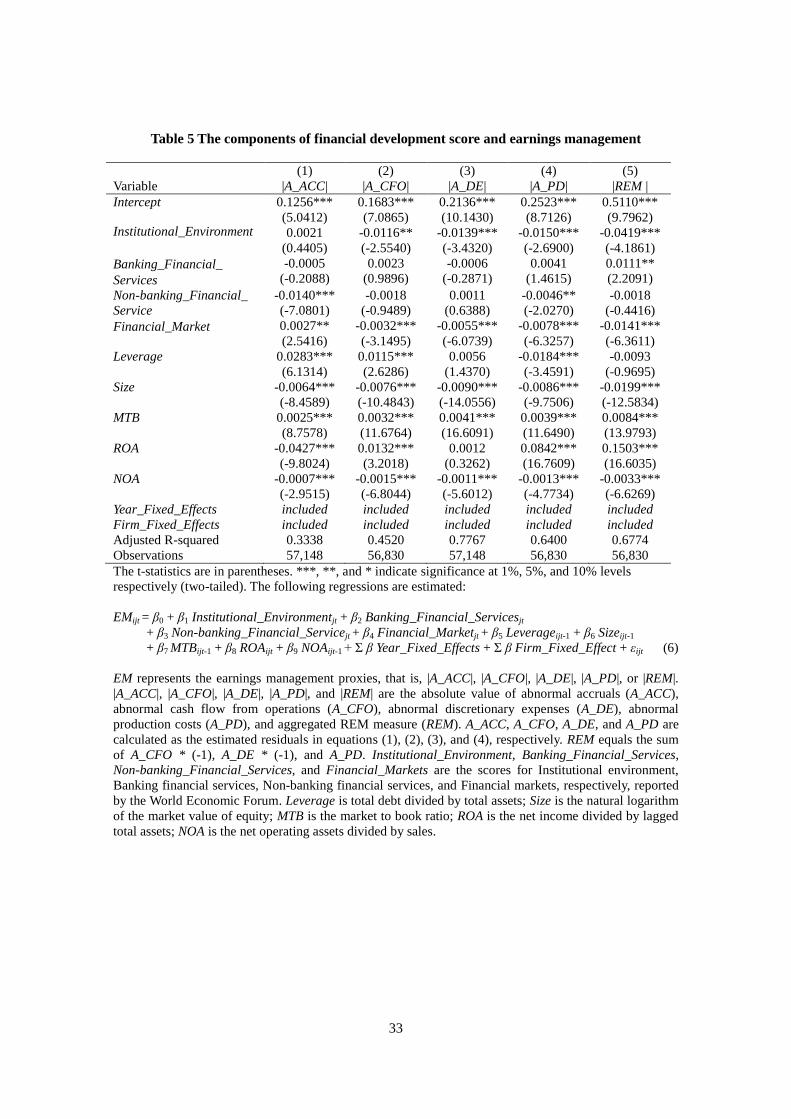
Next, FD is made the simple mean value of four components selected from the seven
indicators of the financial development score. We are concerned with whether FD faithfully
21
represents a true financial development by adding the four components equally.23
Hence, FD is
divided into four components, namely, Institutional_Environment, Banking_Financial_Services,
Non-banking_ Financial_Services, and Financial_Markets. The decomposition of FD makes it
possible to evaluate the effect of each component on earnings management. Equation (6)
includes each component of FD in the place of FD in equation (5).
EMijt = β0 + β1 Institutional_Environmentjt + β2 Banking_Financial_Servicesjt
+ β3 Non-banking_Financial_Servicesjt + β4 Financial_Marketsjt + β5 Leverageijt-1
+ β6 Sizeijt-1 + β7 MTBijt-1 + β8 ROAijt + β9 NOAijt-1 + Σ β Year_Fixed_Effect
+ Σ β Firm_Fixed_Effect + εijt (6)
In column (1) of Table 5, we provide evidence of the effect of each financial development
component. Among them, Non-banking_Financial_Services is negatively associated with the
level of |A_ACC| and the absolute value of the coefficient is the largest. By comparison,
Financial_ Markets has a significant positive value, but does not have a large effect on |A_ACC|.
For the dependent variables of REM, we find that Institutional_Environment and
Financial_Markets negatively affect the REM variable.24
In particular, the significant negative
value of the coefficients of Institutional Environment is not consistent with Francis, Hasan, and
Li (2011).25
23 Original financial development score by the World Economic Forum is also the simple mean value of seven
components. 24 As is well known, the development of a component works for the improvement of other components and entire
financial development. Thus, as there is the issue of interdependency, the findings of Table 5 should be carefully
interpreted. To mitigate any concern, we replace each component with FD. That is, the following regression is
estimated.
EMijt = β0 + β1 Component of FDjt + β2 Leverageijt-1 + β3 Sizeijt-1 + β4 MTBijt-1 + β5 ROAijt + β6 NOAijt-1
+Σ βFirm_Fixed_Effect + εijt-1,
Component of FD = Institutional_Environment, Banking_Financial_Services, Non-banking_Financial_Services, or
Financial_Markets.
Only the estimated coefficients of Non-banking_Financial_Services are similar to Table 5. None of the coefficients
of Institutional_Environment are significant. The coefficients of Banking_Financial_Services are significantly
positive only when the dependent variable is |REM|. In addition, the coefficients of Financial_Markets are consistent
with Table 5 in the regression of |abACC|, |abPD|, and |REM|. 25 As described before, Institutional_Environment includes legal enforcement.
22
[Insert Table 5 here]
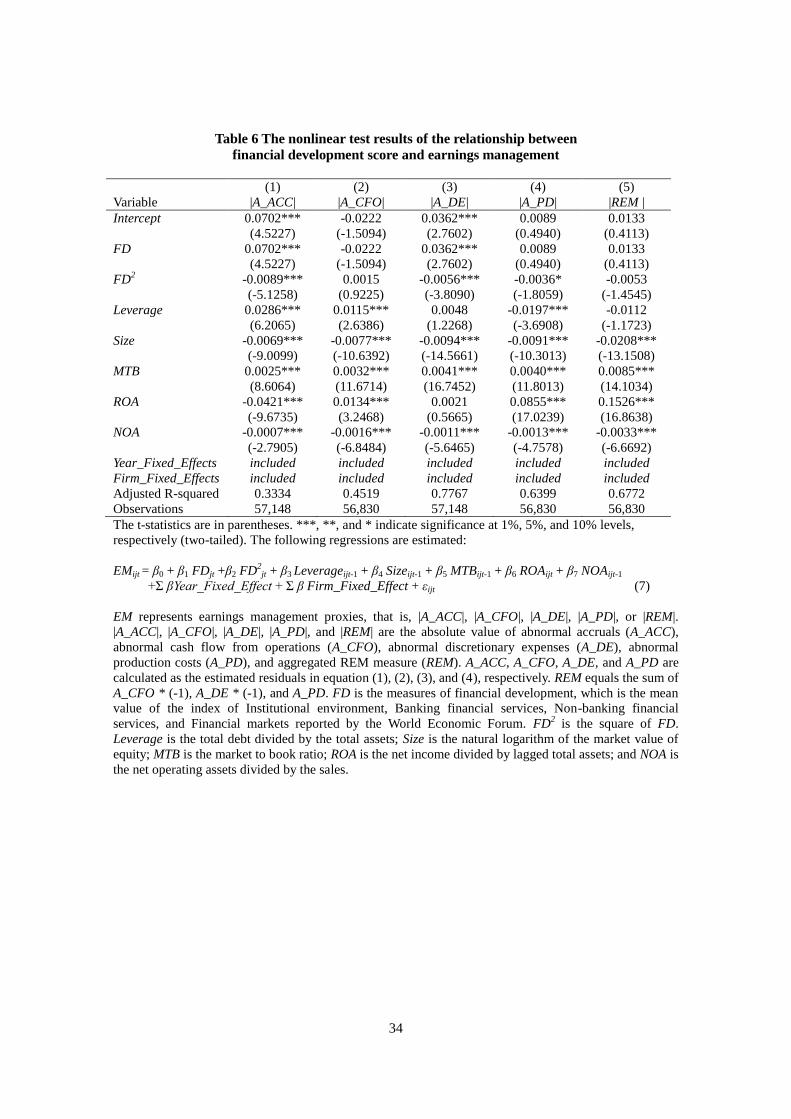
Next, we consider the nonlinear relationship between financial development and earnings
management. The growing use of accounting information in the developing stages of financial
development may precede the preparation of relevant regulations. In this case, the ability to
monitor and scrutinize by a stakeholder is relatively immature. In this case, the incentives from
earnings management dominate the constraint. This constraint will dominate incentives in the
developed stage of financial development. To test this relationship, equation (7) adds FD2 in
equation (5). FD2 is the square of FD.
EMijt = β0 + β1 FDjt + β2 FD2jt
+ β3 Leverageijt-1 + β4 Sizeijt-1 + β5 MTBijt-1 + β6 ROAijt + β9 NOAijt-1
+ Σ β Year_Fixed_Effect + Σ β Firm_Fixed_Effect + εijt (7)
In table 6, all coefficients of FD are positive, and those of FD2 are negative. However, for
only |A_ACC| and |A_DE|, coefficients of FD and FD2 are significant with the inflection points
3.94 and 3.23, respectively. These results show that AEM is more prevalent until the FD score
reaches the average point of our sample (see table 1) and become less prevalent after that.
Results from REM tests are less conclusive.
[Insert Table 6 here]
4.4. Robustness checks
For the first robustness test, we re-computed abnormal accruals using the cross-sectional
Jones (1991) model instead. The coefficient of FD in the regression of |A_ACC| is similar to that
observed before (not tabulated).
Next, we employ country-, industry-, and year-fixed effects in place of firm-fixed effects in
23
equation (5).
EMijt = β0 + β1 FDjt + β2 Leverageijt-1 + β3 Sizeijt-1 + β4 MTBijt-1 + β5 ROAijt + β6 NOAijt-1
+ Σ β Year_Fixed_Effect + Σ β Country_Fixed_Effect + Σ β Industry_Fixed_Effect + εijt (8)
While it is suitable that the firm-fixed effects' terms are used to control time invariant factors,
some research includes country-, industry- and year-fixed effects. As shown in Table 7, the
coefficients of FD in all regressions remain significantly negative, which is consistent with
those of Table 4.
[Insert Table 7 here]
In addition, to test the robustness of our findings, we repeat the regressions in the samples,
excluding particular country and year. First, we delete all of the firm-years for the United States
and Japan and re-estimate the models in Table 3. The total observations for the United States
and Japan number 21,475 or 39.6 percent of our sample (see Table 1). It is, therefore, of concern
that the evidence in Table 3 is driven mainly by the data for these two countries. Table 8
displays the estimated coefficients from the sample, excluding the observations for the United
States and Japan. All of the coefficients of FD are negative and significant, and consistent with
those of Table 3. In addition, the results are robust even when we eliminate the observations for
either of these countries.
[Insert Table 8 here]
Second, we deleted all 2009 data in the sample and re-estimated equation (5). This is because
our sample periods include data from periods of financial crisis around the world. The results
are shown in Table 7. The coefficient of FD for |A_ACC| remains significantly negative. For
REM, the coefficients of two of the three dependent variables, |A_DE| and |A_PD|, are similar to
24
Table 3. Thus, our findings are not heavily influenced by financial crises.
[Insert Table 9 here]
5. Conclusion
This paper investigates whether the level of financial development in each country affects
managers’ earnings management by using 54,178 observations from 37 countries in the period
of 2009 to 2012. For earnings management methods, we focus on both AEM and REM. We find
that a negative relationship exists between the levels of financial development in each country
and both types of earnings management. Our results indicate that both AEM and REM are
constrained in countries with high financial development. We interpret this data as showing (1)
higher quality accounting information is needed in countries with more developed financial
systems, (2) there is a link between financial development and accounting institutions in each
country, and (3) financial development disciplines managers and mitigates their incentives to
engage in earnings management.
Previous papers using an international setting show that AEM is restrained in countries with a
high level of investor protection (Leuz, Nanda, and Wysocki 2003). They also show that AEM
and REM are used as substitutes each other, according to the level of the legal system (Francis,
Hasan, and Li, 2011) and the level of outside investor rights (Enomoto, Kimura, and Yamaguchi,
2013). This paper contributes to the earnings management literature by showing that both AEM
and REM are restrained by high levels of financial development in an international setting.
We feel that future study is needed in the following area. First, due to data availability, our
sample period is only 4 years, from 2009 to 2012. To secure more reliable evidence, a test with a
longer sample period is required in the future. Second, we estimated the test models of AEM
and REM separately, even though previous research shows a substitution of AEM and REM. We
recognize the desirability of a simultaneous equations system for the two types of earnings
management, and this remains for future research.
25
Third, we did not clarify the process of linkage between financial development and
accounting institutions. Wysocki (2011, 312) notes the ‘chicken and the egg’ problem of
endogeneity and complementarity between accounting and other institutions, and this problem
would apply to the relationship between financial development and accounting institutions. It is
difficult to determine which comes first, but it is interesting to research this issue.
References
Badertscher, B. A. 2011. Overvaluation and the choice of alternative earnings management
mechanisms. The Accounting Review 86 (5): 1491-1518.
Ball, R., Robin, A., and J. Wu. 2003. Incentives versus standards: properties of accounting
income in four East Asian countries. Journal of Accounting and Economics 36 (1-3):
235-270.
Barth, M.E., W. R. Landsman, and M. H. Lang. 2008. International accounting standards and
accounting quality. Journal of Accounting Research 46 (3):467-498.
Barton, J. and P. J. Simko. 2002. The balance sheet as an earnings management constraint. The
Accounting Review 77 (Supplement): 1-27.
Bartov, E. and D. A. Cohen. 2009. The “numbers game” in the pre-and post-Sarbanes-Oxley
eras. Journal of Accounting, Auditing and Finance 24 (4): 505-534.
Bartov, E., D. Givoly, and C. Hayn. 2002. The rewards to meeting or beating earnings
expectations. Journal of Accounting and Economics 33 (2): 173-204.
Beck, T. and R. Levine. 2002. Industry growth and capital allocation: Does having a market- or
bank-based system matter. Journal of Financial Economics 64 (2): 147-180.
Beck, T. and R. Levine. 2004. Stock markets, banks and growth: Panel evidence. Journal of
Banking and Finance 28 (3): 423-442.
Becker, C. L., M. L. DeFond., J. Jiambalvo, and K. R. Subramanyam. 1998. The effect of audit
quality on earnings management. Contemporary Accounting Research 15 (1): 1-24.
Bikky, J. and L. Picheng. 2002. Earnings management in response to debt covenant violations
26
and debt restructuring. Journal of Accounting, Auditing and Finance 17 (4): 295-324.
Boonlert-U-Thai, K., G. K. Meek, and S. Nabar. 2006. Earnings attributes and
investor-protection: International evidence. The International Journal of Accounting 41 (4):
327-357.
Bushman, R. and J. Piotroski. 2006. Financial reporting incentives for conservative accounting:
The influence of legal and political institutions. Journal of Accounting and Economics 42
(1-2): 107-148.
Chi, W., L. L. Lisic, and M. Pevzner. 2011. Is enhanced audit quality associated with greater
real earnings management? Accounting Horizons 25 (2): 315-335.
Cohen, D. A., A. Dey, and T. Z. Lys. 2008. Real and accrual-based earnings management in the
pre-and post-Sarbanes-Oxley periods. The Accounting Review 83 (3): 757-787.
Cohen, D. A. and P. Zarowin. 2010. Accrual-based and real earnings management activities
around seasoned equity offerings. Journal of Accounting and Economics 50 (1): 2-19.
Dechow, P. M., W. Ge, and C. Schrand. 2010. Understanding earnings quality: A review of the
proxies, their determinants and their consequences. Journal of Accounting and Economics 50
(2-3): 344-401.
Dechow, P. M., A. P. Hutton, J. H. Kim, and R. G. Sloan. 2012. Detecting earnings
management: A new approach. Journal of Accounting Research 50 (2): 275-334.
Dechow, P. M., R. G. Sloan, and A. P. Sweeney. 1995. Detecting earnings management. The
Accounting Review 70 (2): 193-225.
DeFond, M. L. and J. Jiambalvo. 1994. Debt covenant violation and manipulation of accruals.
Journal of Accounting and Economics 17 (1-2): 145-176.
Degeorge F., Y. Ding, T. Jeanjean, and H. Stolowy. 2013. Analyst coverage, earnings
management and financial development: An international study. Journal of Accounting and
Public Policy 32 (1): 1-25.
Enomoto, M., F. Kimura, and T. Yamaguchi. 2013. Accrual based and real earnings
management: An international comparison for investor protection. Discussion Paper Series
27
No. DP 2012–13, RIEB Kobe University; Available at SSRN: http://ssrn.com/abstract=
2066797.
Ewert, R. and A. Wagenhofer. 2005. Economic effects of tightening accounting standards to
restrict earnings management. The Accounting Review 80 (4): 1101-1124.
Francis, B., I. Hasan, and L. Li. 2011. A cross-country study of legal environment and real
earnings management. Working paper. Available at SSRN: http://ssrn.com/abstract=
1740036.
Francis, J. R. and D. Wang. 2008. The joint effect of investor protection and Big-4 audits on
earnings quality around the world. Contemporary Accounting Research 25 (1): 157-191.
Gunny, K. 2010. The relation between earnings management using real activities manipulation
and future performance: Evidence from meeting earnings benchmarks. Contemporary
Accounting Research 27 (3): 855-888.
Graham, J. R., C. R. Harvey, and S. Rajgopal. 2005. The economic implications of corporate
financial reporting. Journal of Accounting and Economics 40 (1-3): 3-73.
Haw, I., B. Hu, L. Hwang, and W. Wu. 2004. Ultimate ownership, income management, and
legal and extra-legal institutions. Journal of Accounting Research 42 (2): 423-462.
Ipino., E. and A. Parbonetti. 2011. Mandatory IFRS adoption: the trade-off between accrual and
real-based earnings management. Working Paper. Available at SSRN: http://ssrn.com/
abstract=2039711.
Jones, J. 1991. Earnings management during import relief investigations. Journal of Accounting
Research 29 (2): 193-228.
Kim, B. H., L. Lei, and M. Pevzner. 2011. Debt covenant slack and real earnings management.
Working paper.
Kim, J. B. and B. C. Sohn. 2013. Real earnings management and cost of capital. Journal of
Accounting and Public Policy (forthcoming).
Kothari, S.P., N. Mizik, and S. Roychowdhury. 2012. Managing for the moment: The role of
real activity versus accruals earnings management in SEO valuation. Working paper.
28
Available at SSRN: http://ssrn.com/abstract=1982826.
Leuz, C., D. Nanda, and P. Wysocki. 2003. Earnings management and investor protection: an
international comparison. Journal of Financial Economics 69 (3): 505-527.
Leuz, C. and P. Wysocki. 2009. Economic consequences of financial reporting and disclosure
regulation: a review and suggestions for future research. Working Paper, University of
Chicago and MIT Sloan School of Management. Available at SSRN: http://www.ssrn.com/
abstract=105398.
Scott, W. R. 2011. Financial Accounting Theory 6th edition. Prentice Hall.
Roychowdhury, S. 2006. Earnings management through real activities manipulation. Journal of
Accounting and Economics 42 (3): 335-370.
Teoh, S. H., I. Welch, and T. J. Wong. 1998a. Earnings management and the long-run market
performance of initial public offerings. Journal of Finance 53 (1): 1935-1974.
Teoh, S. H., I. Welch, and T. J. Wong. 1998b. Earnings management and the underperformance
of seasoned equity offerings. Journal of Financial Economics 50 (6): 63-99.
Warfield, T. D., J. J. Wild, and K. L. Wild. 1995. Managerial ownership, accounting choices,
and informativeness of earnings. Journal of Accounting and Economics 20 (1): 61-91.
Wongsunwai, W. 2013. The effect of external monitoring on accrual-based and real earnings
management: evidence from venture-backed initial public offerings. Contemporary
Accounting Research 30 (1): 242-268.
World Economic Forum. 2012. The Financial Development Report 2012. Available at the World
Economic Forum Website: http://www.weforum.org/reports/financial-development-report-
2012.
Wysocki, P. 2011. New institutional accounting and IFRS. Accounting and Business Research
41 (3): 309-328.
Zang, A. 2012. Evidence on the trade-off between real activities manipulation and accrual-based
earnings management. The Accounting Review 87 (2): 675-703.
29
Table 1 Data for each country and year
Panel A The number of observations and the mean value
of financial development score in each country
Panel B The number of
observations for each year
Country N FD Year N
Argentina 94 2.44 2009 13,931
Australia 1,630 4.80 2010 14,037
Belgium 99 4.07 2011 14,436
Brazil 484 3.17 2012 14,744
Canada 2,350 4.72 Total 54,178
Chile 193 2.86
Denmark 171 4.05
Finland 157 3.74
France 1,431 4.34
Germany 1,574 4.36
Greece 31 3.07
Hong Kong 2,564 4.86
India 7,311 3.17
Indonesia 660 2.44
Ireland 38 4.07
Israel 560 3.45
Italy 435 3.65
Japan 10,703 4.93
Jordan 32 3.90
Malaysia 2,435 3.83
Mexico 146 2.50
Netherlands 171 4.68
Nigeria 71 2.11
Norway 207 3.88
Pakistan 543 2.29
Peru 110 2.41
Philippines 132 2.74
Singapore 1,374 4.83
South Africa 395 3.27
South Korea 4,595 4.02
Spain 138 4.34
Sweden 743 4.20
Switzerland 446 4.46
Thailand 1,238 2.90
Turkey 555 2.70
United Kingdom 2,560 5.45
United States 10,772 5.39
Total / Mean 54,178 3.73
FD is the measure of financial development, which is the
total of the index of Institutional environment, Banking
financial services, Non-banking financial services, and
Financial markets reported by the World Economic
Forum.
30
Table 2 Descriptive statistics of dependent and independent variables
Variables Mean Q1 Median Q3 SD
|A_ACC| 0.0695 0.0188 0.0427 0.0848 0.1421
|A_CFO| 0.0758 0.0211 0.0486 0.0958 0.1090
|A_DE| 0.0981 0.0239 0.0580 0.1225 0.1372
|A_PD| 0.1183 0.0322 0.0771 0.1524 0.1798
|REM | 0.2274 0.0646 0.1497 0.2936 0.2952
FD 4.4179 3.6975 4.7925 5.0750 0.8872
Leverage 0.3079 0.1725 0.2827 0.4169 0.1738
Size 4.6561 3.0648 4.3927 6.0836 2.1975
MTB 4.0831 0.6177 1.0725 1.9650 358.0766
ROA 0.0399 0.0019 0.0460 0.1016 0.1876
NOA 2.4584 0.7642 1.1407 1.8329 19.6256
|A_ACC|, |A_CFO|, |A_DE|, |A_PD|, and |REM| are the absolute value of abnormal accruals (A_ACC),
abnormal cash flow from operations (A_CFO), abnormal discretionary expenses (A_DE), abnormal
production costs (A_PD), and aggregated REM measure (REM), respectively. A_ACC, A_CFO, A_DE,
and A_PD are calculated as the estimated residuals in equations (1), (2), (3), and (4), respectively. REM
equals the sum of A_CFO * (-1), A_DE * (-1), and A_PD. FD is the measure of financial development,
which is the mean value of the index of Institutional environment, Banking financial services,
Non-banking financial services, and Financial markets reported by the World Economic Forum. Leverage
is total debt divided by total assets; Size is the natural logarithm of the market value of equity; MTB is the
market to book ratio; ROA is the net income divided by lagged total assets; and NOA is the net operating
assets divided by the sales.
31
Table 3 Correlation matrix of dependent variables and independent variables
|A_ACC| |A_CFO| |A_DE| |A_PD| |REM | FD Leverage Size MTB ROA
|A_CFO| 0.4537
|A_DE| 0.1597 0.2261
|A_PD| 0.1945 0.3045 0.5881
|REM | 0.2256 0.4018 0.7022 0.8828
FD -0.0317 0.0284 0.1637 0.1093 0.1008
Leverage 0.0693 0.0326 0.1100 0.1084 0.1170 -0.1372
Size -0.1775 -0.1272 -0.1004 -0.0765 -0.0891 0.2641 -0.2257
MTB 0.1631 0.2513 0.1998 0.1929 0.2036 0.0916 0.1116 0.2442
ROA -0.1539 -0.1455 -0.0371 0.0469 0.0369 -0.1019 -0.0753 0.2483 -0.0201
NOA 0.0264 0.0204 -0.1332 -0.1117 -0.1075 0.0102 -0.2705 0.0804 0.0155 -0.1694
|A_ACC|, |A_CFO|, |A_DE|, |A_PD| and |REM| is the absolute value of abnormal accruals (A_ACC), abnormal cash flow from operations (A_CFO),
abnormal discretionary expenses (A_DE), abnormal production costs (A_PD), and aggregated REM measure (REM). A_ACC, A_CFO, A_DE, and A_PD
are calculated as the estimated residuals in equation (1), (2), (3), and (4), respectively. REM equals the sum of A_CFO * (-1), A_DE * (-1), and A_PD. FD
is the measures of financial development, which is the mean value of the index of Institutional environment, Banking financial services, Non-banking
financial services, and Financial markets reported by the World Economic Forum. Leverage is the total debt divided by the total assets; Size is the natural
logarithm of the market value of equity; MTB is the market to book ratio; ROA is the net income divided by lagged total assets; NOA is the net operating
assets divided by the sales.
32
Table 4 Financial development score and earnings management
(1) (2) (3) (4) (5)
Variable |A_ACC| |A_CFO| |A_DE| |A_PD| |REM |
Intercept 0.1210*** 0.1396*** 0.1814*** 0.2475*** 0.4341***
(9.4149) (11.4516) (16.7057) (16.6462) (16.2048)
FD -0.0080*** -0.0089*** -0.0129*** -0.0230*** -0.0330***
(-2.7448) (-3.2342) (-5.2553) (-6.8642) (-5.4566)
Leverage 0.0295*** 0.0114*** 0.0053 -0.0193*** -0.0108
(6.3875) (2.6078) (1.3605) (-3.6294) (-1.1217)
Size -0.0065*** -0.0077*** -0.0091*** -0.0089*** -0.0206***
(-8.5825) (-10.7611) (-14.2799) (-10.1821) (-13.0735)
MTB 0.0025*** 0.0032*** 0.0041*** 0.0039*** 0.0085***
(8.5207) (11.6868) (16.6821) (11.7748) (14.0827)
ROA -0.0430*** 0.0135*** 0.0015 0.0852*** 0.1521***
(-9.8886) (3.2880) (0.4108) (16.9630) (16.8176)
NOA -0.0007*** -0.0016*** -0.0012*** -0.0013*** -0.0033***
(-2.8466) (-6.8386) (-5.6881) (-4.7781) (-6.6857)
Year_Fixed_Effects included included included included included
Firm_Fixed_Effects included included included included included
Adjusted R-squared 0.3330 0.4519 0.7766 0.6399 0.6772
Observations 57,148 56,830 57,148 56,830 56,830
The t-statistics are in parentheses. ***, **, and * indicate significance at 1%, 5%, and 10% levels
respectively (two-tailed). The following regressions are estimated:
EMijt = β0 + β1 FDjt + β2 Leverageijt-1 + β3 Sizeijt-1 + β4 MTBijt-1 + β5 ROAijt + β6 NOAijt-1
+ Σ βYear_Fixed_Effect + Σ β Firm_Fixed_Effect + εijt (5)
EM represents the earnings management proxies, that is, |A_ACC|, |A_CFO|, |A_DE|, |A_PD|, or |REM|.
Further, |A_ACC|, |A_CFO|, |A_DE|, |A_PD|, and |REM| are the absolute values of abnormal accruals
(A_ACC), abnormal cash flow from operations (A_CFO), abnormal discretionary expenses (A_DE),
abnormal production costs (A_PD), and aggregated REM measure (REM), respectively. A_ACC, A_CFO,
A_DE, and A_PD are calculated as the estimated residuals in equations (1), (2), (3), and (4), respectively.
REM equals the sum of A_CFO * (-1), A_DE * (-1), and A_PD. FD is the measure of financial
development that is the mean value of the index of Institutional environment, Banking financial services,
Non-banking financial services, and Financial markets reported by the World Economic Forum. Leverage
is total debt divided by total assets; Size is the natural logarithm of the market value of equity; MTB is the
market to book ratio; ROA is the net income divided by lagged total assets; and NOA is the net operating
assets divided by sales.
33
Table 5 The components of financial development score and earnings management
(1) (2) (3) (4) (5)
Variable |A_ACC| |A_CFO| |A_DE| |A_PD| |REM |
Intercept 0.1256*** 0.1683*** 0.2136*** 0.2523*** 0.5110***
(5.0412) (7.0865) (10.1430) (8.7126) (9.7962) Institutional_Environment 0.0021 -0.0116** -0.0139*** -0.0150*** -0.0419***
(0.4405) (-2.5540) (-3.4320) (-2.6900) (-4.1861)
Banking_Financial_
Services
-0.0005 0.0023 -0.0006 0.0041 0.0111**
(-0.2088) (0.9896) (-0.2871) (1.4615) (2.2091)
Non-banking_Financial_
Service
-0.0140*** -0.0018 0.0011 -0.0046** -0.0018
(-7.0801) (-0.9489) (0.6388) (-2.0270) (-0.4416)
Financial_Market 0.0027** -0.0032*** -0.0055*** -0.0078*** -0.0141***
(2.5416) (-3.1495) (-6.0739) (-6.3257) (-6.3611)
Leverage 0.0283*** 0.0115*** 0.0056 -0.0184*** -0.0093
(6.1314) (2.6286) (1.4370) (-3.4591) (-0.9695)
Size -0.0064*** -0.0076*** -0.0090*** -0.0086*** -0.0199***
(-8.4589) (-10.4843) (-14.0556) (-9.7506) (-12.5834)
MTB 0.0025*** 0.0032*** 0.0041*** 0.0039*** 0.0084***
(8.7578) (11.6764) (16.6091) (11.6490) (13.9793)
ROA -0.0427*** 0.0132*** 0.0012 0.0842*** 0.1503***
(-9.8024) (3.2018) (0.3262) (16.7609) (16.6035)
NOA -0.0007*** -0.0015*** -0.0011*** -0.0013*** -0.0033***
(-2.9515) (-6.8044) (-5.6012) (-4.7734) (-6.6269)
Year_Fixed_Effects included included included included included
Firm_Fixed_Effects included included included included included
Adjusted R-squared 0.3338 0.4520 0.7767 0.6400 0.6774
Observations 57,148 56,830 57,148 56,830 56,830
The t-statistics are in parentheses. ***, **, and * indicate significance at 1%, 5%, and 10% levels
respectively (two-tailed). The following regressions are estimated:
EMijt = β0 + β1 Institutional_Environmentjt + β2 Banking_Financial_Servicesjt
+ β3 Non-banking_Financial_Servicejt + β4 Financial_Marketjt + β5 Leverageijt-1 + β6 Sizeijt-1
+ β7 MTBijt-1 + β8 ROAijt + β9 NOAijt-1 + Σ β Year_Fixed_Effects + Σ β Firm_Fixed_Effect + εijt (6)
EM represents the earnings management proxies, that is, |A_ACC|, |A_CFO|, |A_DE|, |A_PD|, or |REM|.
|A_ACC|, |A_CFO|, |A_DE|, |A_PD|, and |REM| are the absolute value of abnormal accruals (A_ACC),
abnormal cash flow from operations (A_CFO), abnormal discretionary expenses (A_DE), abnormal
production costs (A_PD), and aggregated REM measure (REM). A_ACC, A_CFO, A_DE, and A_PD are
calculated as the estimated residuals in equations (1), (2), (3), and (4), respectively. REM equals the sum
of A_CFO * (-1), A_DE * (-1), and A_PD. Institutional_Environment, Banking_Financial_Services,
Non-banking_Financial_Services, and Financial_Markets are the scores for Institutional environment,
Banking financial services, Non-banking financial services, and Financial markets, respectively, reported
by the World Economic Forum. Leverage is total debt divided by total assets; Size is the natural logarithm
of the market value of equity; MTB is the market to book ratio; ROA is the net income divided by lagged
total assets; NOA is the net operating assets divided by sales.
34
Table 6 The nonlinear test results of the relationship between
financial development score and earnings management
(1) (2) (3) (4) (5)
Variable |A_ACC| |A_CFO| |A_DE| |A_PD| |REM |
Intercept 0.0702*** -0.0222 0.0362*** 0.0089 0.0133
(4.5227) (-1.5094) (2.7602) (0.4940) (0.4113)
FD 0.0702*** -0.0222 0.0362*** 0.0089 0.0133
(4.5227) (-1.5094) (2.7602) (0.4940) (0.4113)
FD2 -0.0089*** 0.0015 -0.0056*** -0.0036* -0.0053
(-5.1258) (0.9225) (-3.8090) (-1.8059) (-1.4545)
Leverage 0.0286*** 0.0115*** 0.0048 -0.0197*** -0.0112
(6.2065) (2.6386) (1.2268) (-3.6908) (-1.1723)
Size -0.0069*** -0.0077*** -0.0094*** -0.0091*** -0.0208***
(-9.0099) (-10.6392) (-14.5661) (-10.3013) (-13.1508)
MTB 0.0025*** 0.0032*** 0.0041*** 0.0040*** 0.0085***
(8.6064) (11.6714) (16.7452) (11.8013) (14.1034)
ROA -0.0421*** 0.0134*** 0.0021 0.0855*** 0.1526***
(-9.6735) (3.2468) (0.5665) (17.0239) (16.8638)
NOA -0.0007*** -0.0016*** -0.0011*** -0.0013*** -0.0033***
(-2.7905) (-6.8484) (-5.6465) (-4.7578) (-6.6692)
Year_Fixed_Effects included included included included included
Firm_Fixed_Effects included included included included included
Adjusted R-squared 0.3334 0.4519 0.7767 0.6399 0.6772
Observations 57,148 56,830 57,148 56,830 56,830
The t-statistics are in parentheses. ***, **, and * indicate significance at 1%, 5%, and 10% levels,
respectively (two-tailed). The following regressions are estimated:
EMijt = β0 + β1 FDjt +β2 FD2
jt + β3 Leverageijt-1 + β4 Sizeijt-1 + β5 MTBijt-1 + β6 ROAijt + β7 NOAijt-1
+Σ βYear_Fixed_Effect + Σ β Firm_Fixed_Effect + εijt (7)
EM represents earnings management proxies, that is, |A_ACC|, |A_CFO|, |A_DE|, |A_PD|, or |REM|.
|A_ACC|, |A_CFO|, |A_DE|, |A_PD|, and |REM| are the absolute value of abnormal accruals (A_ACC),
abnormal cash flow from operations (A_CFO), abnormal discretionary expenses (A_DE), abnormal
production costs (A_PD), and aggregated REM measure (REM). A_ACC, A_CFO, A_DE, and A_PD are
calculated as the estimated residuals in equation (1), (2), (3), and (4), respectively. REM equals the sum of
A_CFO * (-1), A_DE * (-1), and A_PD. FD is the measures of financial development, which is the mean
value of the index of Institutional environment, Banking financial services, Non-banking financial
services, and Financial markets reported by the World Economic Forum. FD2 is the square of FD.
Leverage is the total debt divided by the total assets; Size is the natural logarithm of the market value of
equity; MTB is the market to book ratio; ROA is the net income divided by lagged total assets; and NOA is
the net operating assets divided by the sales.
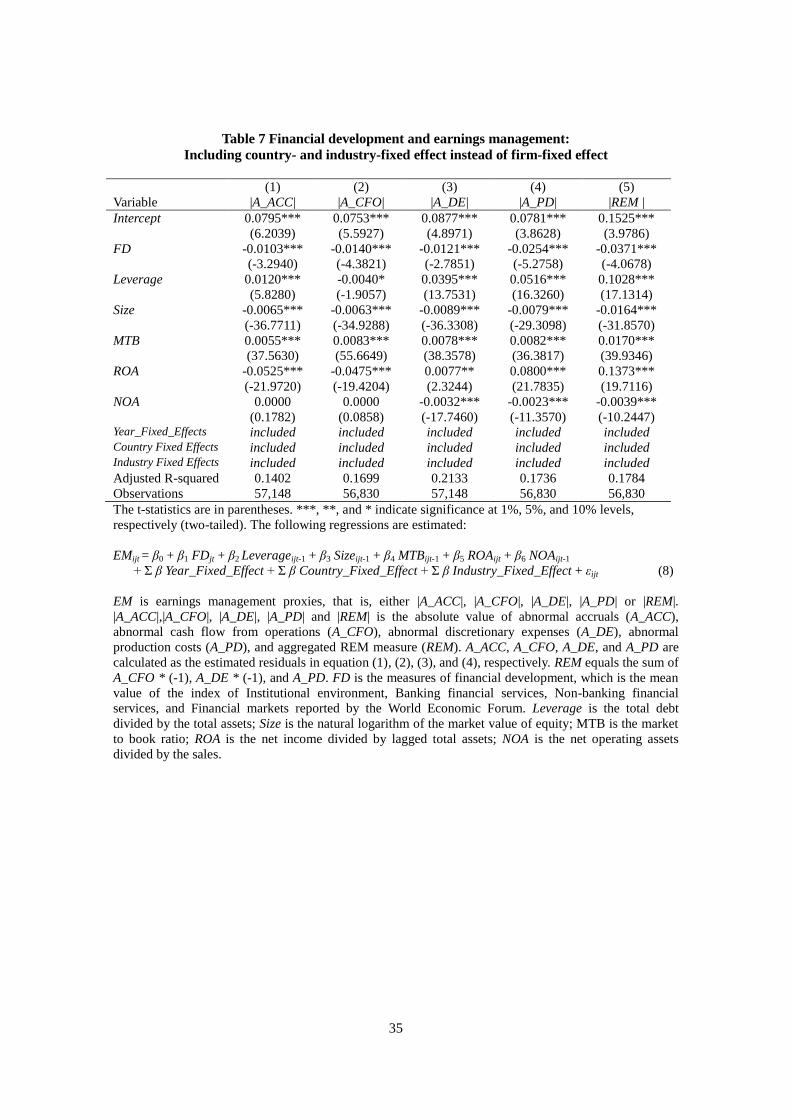
35
Table 7 Financial development and earnings management:
Including country- and industry-fixed effect instead of firm-fixed effect
(1) (2) (3) (4) (5)
Variable |A_ACC| |A_CFO| |A_DE| |A_PD| |REM |
Intercept 0.0795*** 0.0753*** 0.0877*** 0.0781*** 0.1525***
(6.2039) (5.5927) (4.8971) (3.8628) (3.9786)
FD -0.0103*** -0.0140*** -0.0121*** -0.0254*** -0.0371***
(-3.2940) (-4.3821) (-2.7851) (-5.2758) (-4.0678)
Leverage 0.0120*** -0.0040* 0.0395*** 0.0516*** 0.1028***
(5.8280) (-1.9057) (13.7531) (16.3260) (17.1314)
Size -0.0065*** -0.0063*** -0.0089*** -0.0079*** -0.0164***
(-36.7711) (-34.9288) (-36.3308) (-29.3098) (-31.8570)
MTB 0.0055*** 0.0083*** 0.0078*** 0.0082*** 0.0170***
(37.5630) (55.6649) (38.3578) (36.3817) (39.9346)
ROA -0.0525*** -0.0475*** 0.0077** 0.0800*** 0.1373***
(-21.9720) (-19.4204) (2.3244) (21.7835) (19.7116)
NOA 0.0000 0.0000 -0.0032*** -0.0023*** -0.0039***
(0.1782) (0.0858) (-17.7460) (-11.3570) (-10.2447) Year_Fixed_Effects included included included included included Country Fixed Effects included included included included included Industry Fixed Effects included included included included included
Adjusted R-squared 0.1402 0.1699 0.2133 0.1736 0.1784
Observations 57,148 56,830 57,148 56,830 56,830
The t-statistics are in parentheses. ***, **, and * indicate significance at 1%, 5%, and 10% levels,
respectively (two-tailed). The following regressions are estimated:
EMijt = β0 + β1 FDjt + β2 Leverageijt-1 + β3 Sizeijt-1 + β4 MTBijt-1 + β5 ROAijt + β6 NOAijt-1
+ Σ β Year_Fixed_Effect + Σ β Country_Fixed_Effect + Σ β Industry_Fixed_Effect + εijt (8)
EM is earnings management proxies, that is, either |A_ACC|, |A_CFO|, |A_DE|, |A_PD| or |REM|.
|A_ACC|,|A_CFO|, |A_DE|, |A_PD| and |REM| is the absolute value of abnormal accruals (A_ACC),
abnormal cash flow from operations (A_CFO), abnormal discretionary expenses (A_DE), abnormal
production costs (A_PD), and aggregated REM measure (REM). A_ACC, A_CFO, A_DE, and A_PD are
calculated as the estimated residuals in equation (1), (2), (3), and (4), respectively. REM equals the sum of
A_CFO * (-1), A_DE * (-1), and A_PD. FD is the measures of financial development, which is the mean
value of the index of Institutional environment, Banking financial services, Non-banking financial
services, and Financial markets reported by the World Economic Forum. Leverage is the total debt
divided by the total assets; Size is the natural logarithm of the market value of equity; MTB is the market
to book ratio; ROA is the net income divided by lagged total assets; NOA is the net operating assets
divided by the sales.
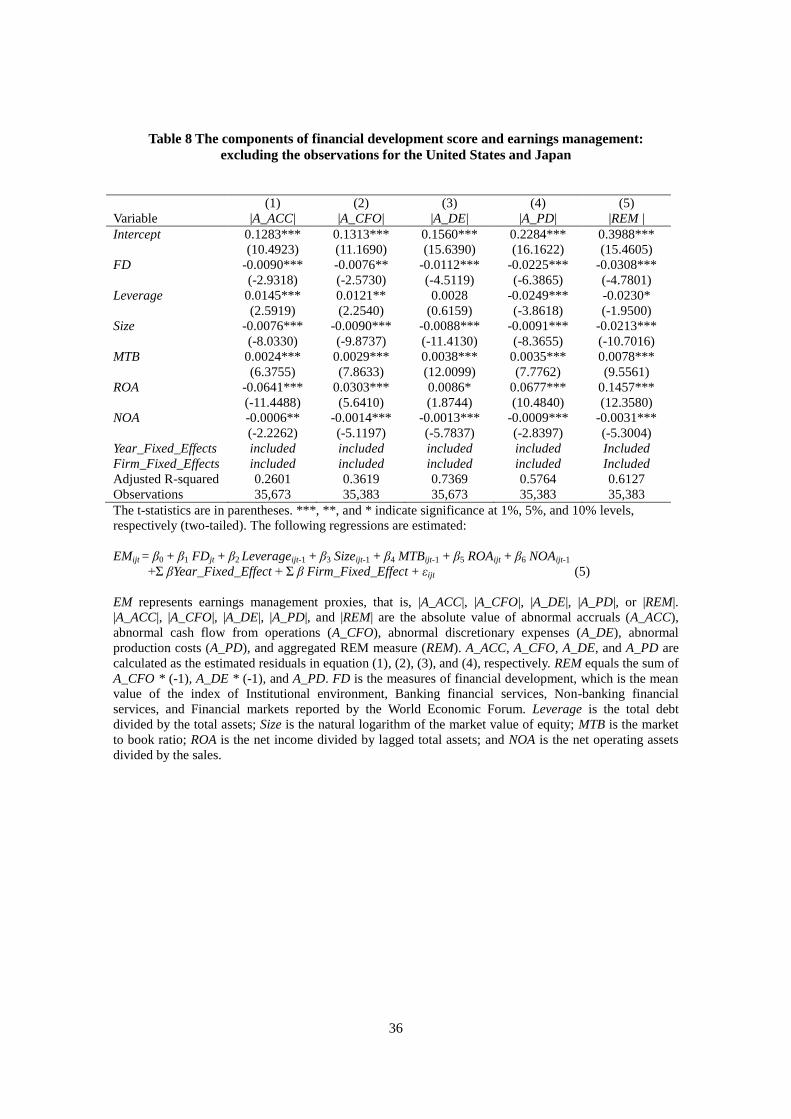
36
Table 8 The components of financial development score and earnings management:
excluding the observations for the United States and Japan
(1) (2) (3) (4) (5)
Variable |A_ACC| |A_CFO| |A_DE| |A_PD| |REM |
Intercept 0.1283*** 0.1313*** 0.1560*** 0.2284*** 0.3988***
(10.4923) (11.1690) (15.6390) (16.1622) (15.4605)
FD -0.0090*** -0.0076** -0.0112*** -0.0225*** -0.0308***
(-2.9318) (-2.5730) (-4.5119) (-6.3865) (-4.7801)
Leverage 0.0145*** 0.0121** 0.0028 -0.0249*** -0.0230*
(2.5919) (2.2540) (0.6159) (-3.8618) (-1.9500)
Size -0.0076*** -0.0090*** -0.0088*** -0.0091*** -0.0213***
(-8.0330) (-9.8737) (-11.4130) (-8.3655) (-10.7016)
MTB 0.0024*** 0.0029*** 0.0038*** 0.0035*** 0.0078***
(6.3755) (7.8633) (12.0099) (7.7762) (9.5561)
ROA -0.0641*** 0.0303*** 0.0086* 0.0677*** 0.1457***
(-11.4488) (5.6410) (1.8744) (10.4840) (12.3580)
NOA -0.0006** -0.0014*** -0.0013*** -0.0009*** -0.0031***
(-2.2262) (-5.1197) (-5.7837) (-2.8397) (-5.3004)
Year_Fixed_Effects included included included included Included
Firm_Fixed_Effects included included included included Included
Adjusted R-squared 0.2601 0.3619 0.7369 0.5764 0.6127
Observations 35,673 35,383 35,673 35,383 35,383
The t-statistics are in parentheses. ***, **, and * indicate significance at 1%, 5%, and 10% levels,
respectively (two-tailed). The following regressions are estimated:
EMijt = β0 + β1 FDjt + β2 Leverageijt-1 + β3 Sizeijt-1 + β4 MTBijt-1 + β5 ROAijt + β6 NOAijt-1
+Σ βYear_Fixed_Effect + Σ β Firm_Fixed_Effect + εijt (5)
EM represents earnings management proxies, that is, |A_ACC|, |A_CFO|, |A_DE|, |A_PD|, or |REM|.
|A_ACC|, |A_CFO|, |A_DE|, |A_PD|, and |REM| are the absolute value of abnormal accruals (A_ACC),
abnormal cash flow from operations (A_CFO), abnormal discretionary expenses (A_DE), abnormal
production costs (A_PD), and aggregated REM measure (REM). A_ACC, A_CFO, A_DE, and A_PD are
calculated as the estimated residuals in equation (1), (2), (3), and (4), respectively. REM equals the sum of
A_CFO * (-1), A_DE * (-1), and A_PD. FD is the measures of financial development, which is the mean
value of the index of Institutional environment, Banking financial services, Non-banking financial
services, and Financial markets reported by the World Economic Forum. Leverage is the total debt
divided by the total assets; Size is the natural logarithm of the market value of equity; MTB is the market
to book ratio; ROA is the net income divided by lagged total assets; and NOA is the net operating assets
divided by the sales.
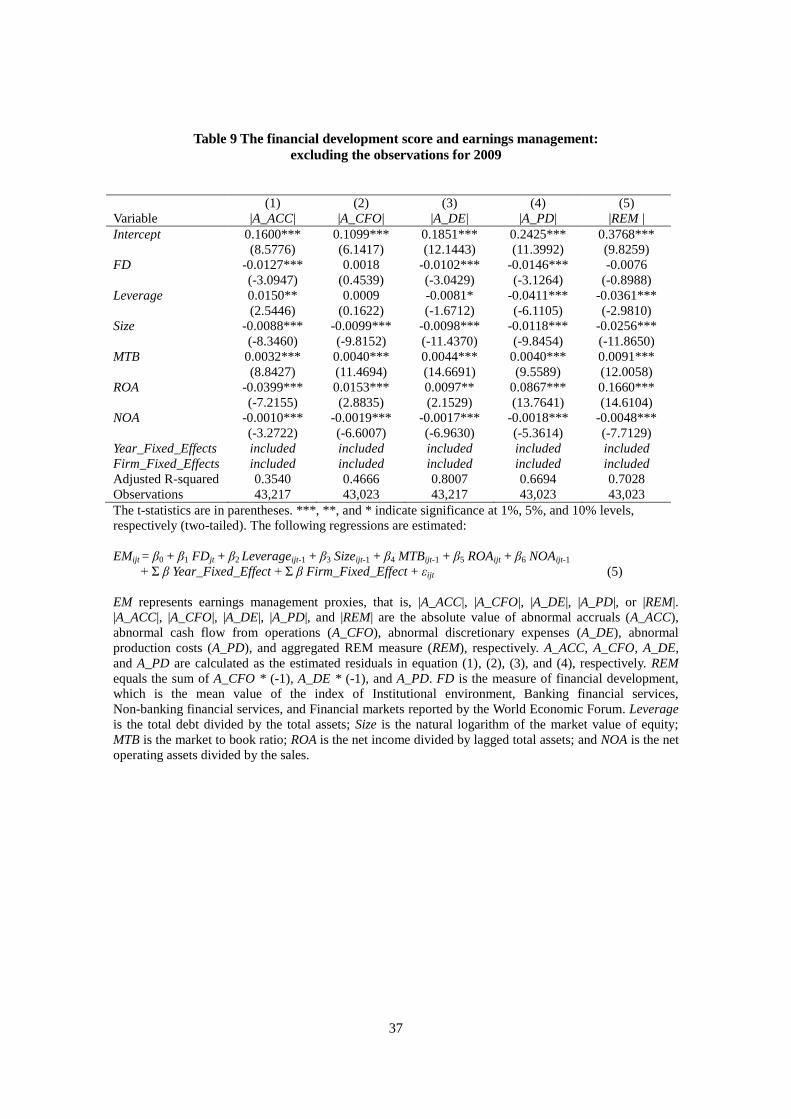
37
Table 9 The financial development score and earnings management:
excluding the observations for 2009
(1) (2) (3) (4) (5)
Variable |A_ACC| |A_CFO| |A_DE| |A_PD| |REM |
Intercept 0.1600*** 0.1099*** 0.1851*** 0.2425*** 0.3768***
(8.5776) (6.1417) (12.1443) (11.3992) (9.8259)
FD -0.0127*** 0.0018 -0.0102*** -0.0146*** -0.0076
(-3.0947) (0.4539) (-3.0429) (-3.1264) (-0.8988)
Leverage 0.0150** 0.0009 -0.0081* -0.0411*** -0.0361***
(2.5446) (0.1622) (-1.6712) (-6.1105) (-2.9810)
Size -0.0088*** -0.0099*** -0.0098*** -0.0118*** -0.0256***
(-8.3460) (-9.8152) (-11.4370) (-9.8454) (-11.8650)
MTB 0.0032*** 0.0040*** 0.0044*** 0.0040*** 0.0091***
(8.8427) (11.4694) (14.6691) (9.5589) (12.0058)
ROA -0.0399*** 0.0153*** 0.0097** 0.0867*** 0.1660***
(-7.2155) (2.8835) (2.1529) (13.7641) (14.6104)
NOA -0.0010*** -0.0019*** -0.0017*** -0.0018*** -0.0048***
(-3.2722) (-6.6007) (-6.9630) (-5.3614) (-7.7129)
Year_Fixed_Effects included included included included included
Firm_Fixed_Effects included included included included included
Adjusted R-squared 0.3540 0.4666 0.8007 0.6694 0.7028
Observations 43,217 43,023 43,217 43,023 43,023
The t-statistics are in parentheses. ***, **, and * indicate significance at 1%, 5%, and 10% levels,
respectively (two-tailed). The following regressions are estimated:
EMijt = β0 + β1 FDjt + β2 Leverageijt-1 + β3 Sizeijt-1 + β4 MTBijt-1 + β5 ROAijt + β6 NOAijt-1
+ Σ β Year_Fixed_Effect + Σ β Firm_Fixed_Effect + εijt (5)
EM represents earnings management proxies, that is, |A_ACC|, |A_CFO|, |A_DE|, |A_PD|, or |REM|.
|A_ACC|, |A_CFO|, |A_DE|, |A_PD|, and |REM| are the absolute value of abnormal accruals (A_ACC),
abnormal cash flow from operations (A_CFO), abnormal discretionary expenses (A_DE), abnormal
production costs (A_PD), and aggregated REM measure (REM), respectively. A_ACC, A_CFO, A_DE,
and A_PD are calculated as the estimated residuals in equation (1), (2), (3), and (4), respectively. REM
equals the sum of A_CFO * (-1), A_DE * (-1), and A_PD. FD is the measure of financial development,
which is the mean value of the index of Institutional environment, Banking financial services,
Non-banking financial services, and Financial markets reported by the World Economic Forum. Leverage
is the total debt divided by the total assets; Size is the natural logarithm of the market value of equity;
MTB is the market to book ratio; ROA is the net income divided by lagged total assets; and NOA is the net
operating assets divided by the sales.