a dissertation presented to the department ofeducational
TRANSCRIPT

THE EFFICACY OF MIDDLE SCHOOL INDICATORS TO PREDICT THE
ACADEMIC AND BEHAVIORAL PERFORMANCE OF AT-RISK NINTH
GRADERS
by
MICHAEL TODD MCKEE
A DISSERTATION
Presented to the Department of Educational Leadershipand the Graduate School of the University of Oregon
in partial fulfillment of the requirementsfor the degree of
Doctor of Education
June 2009

11
University of Oregon Graduate School
Confirmation of Approval and Acceptance of Dissertation prepared by:
Michael McKee
Title:
"The Efficacy of Middle School Indicators to Predict the Academic and Behavioral Performanceof At-Risk Ninth Graders"
This dissertation has been accepted and approved in partial fulfillment of the requirements forthe Doctor of Education degree in the Department of Educational Leadership by:
Gerald Tindal, Chairperson, Educational LeadershipEdward Kameenui, Member, Special Education and Clinical SciencesPaul Yovanoff, Member, Educational LeadershipRobert 0 Brien, Outside Member, Sociology
and Richard Linton, Vice President for Research and Graduate Studies/Dean of the GraduateSchool for the University of Oregon.
June 13, 2009
Original approval signatures are on file with the Graduate School and the University of OregonLibraries.

An Abstract of the Dissertation of
Michael Todd McKee for the degree of
in the Department of Educational Leadership to be taken
111
Doctor of Education
June 2009
Title: THE EFFICACY OF MIDDLE SCHOOL INDICATORS TO PREDICT THE
ACADEMIC AND BEHAVIORAL PERFORMANCE OF AT-RISK NINTH
GRADERS
Approved:Dr. Gerald Tindal
Dropping out of high school may have individual as well as social implications.
The process of dropping out is attributed to social and academic risk factors. Attendance,
course completion and grade-point-average have been identified as key indicators of
students off-track for graduation. This study utilized a single exploratory case design with
embedded quantitative statistical analysis to understand the characteristics of 416
students transitioning from three middle schools to a large, suburban high school.
Correlation and regression analyses were used to examine the relationship between 12
middle school indicators and ninth grade attendance, course completion, and grade-point
average. Findings suggested that middle school grade-point-average, course grade D,
attendance, and ACT math scores were strong predictors of ninth grade performance. The
major implications have highlighted key middle school risk indicators for identifying and
providing intervention to transitioning students at risk of school failure.

CURRICULUM VITAE
NAME OF AUTHOR: Michael Todd McKee
PLACE OF BIRTH: San Bernardino, California
GRADUATE AND UNDERGRADUATE SCHOOLS ATTENDED:
University of Oregon, Eugene, OregonPortland State University, Portland, OregonWeber State University, Ogden, UtahUniversity of Utah, Salt Lake City, Utah
DEGREES AWARDED:
Doctor of Education, Educational Leadership, 2009, University of OregonMaster of Science, Education, 2002, Portland State UniversityBachelor of Arts, History, 1995, University of Utah
AREAS OF SPECIAL INTEREST:
Secondary School ReformAssessment SystemsStudent Achievement and Equity
PROFESSIONAL EXPERIENCE:
Principal, Sunset High School, Beaverton School District, Oregon,2006 - 2009
Assistant Principal, Hillsboro High School, Hillsboro School District, Oregon,2004 - 2006
Teacher, Hillsboro High School, Hillsboro School District, Oregon,1998 - 2004
Teacher, Farmington Bay Youth Center, Davis School District, Utah,1997-1998
IV

v
ACKNOWLEDGMENTS
Foremost, I would like to express my sincere gratitude to Dr. Gerald Tindal for
his guidance and support over the past four years. It was his belief in the Metro program
that provided me the opportunity to grow personally and professionally. Jhave always
appreciated your sense of humor and gentle guidance. In addition, I am deeply indebted
to Dr. Edward Kame' enui for his generosity and kindness. It was his encouragement and
interest in my work that allowed me to persist through to the end. I am also grateful to Dr.
Paul Yovanoff and Dr. Robert 0 'Brien for their willingness to support me through this
process. Finally, I am appreciative of Dr. Yonghan Park for his technical expertise and
patience with me. He was very generous with his time, and it was his guidance that
allowed this work to take form.
I also want to acknowledge the Beaverton and Hillsboro School Districts that
have afforded me many opportunities and experiences. I am particularly grateful to the
students and staff at Sunset and Hi]]sboro High Schools, who have been a tremendous
support. I have always felt very fortunate to work along side so many passionate and
talented indi viduals.
Finally, but more importantly, I am grateful to my wife, Emalie. While I do not
always show it the way I should, I truly appreciate her love and support. She offered me
encouragement to see this through to the end when I needed it the most. We have enjoyed
the rollercoaster ride together, and she shares equally in my success.

To Kobe, Kortnie and Logan.
vi

Vll
TABLE OF CONTENTS
~~~ P~
I. INTRODUCTION .
II. BACKGROUND RESEARCH........................................................................... 6
A Focus on the Ninth Grade............................................................................... 7
A Problen1-Solving Approach............................................................................ 10
Assessment of Classroom Perfonnance...... 10
Collaborative Decision-Making 11
Solutions Based........................................................................................... 12
Frequent Progress Monitoring 13
Multi-Tiered Intervention 14
Systelnic Interventions................................................................................. 14
Strategic Interventions 17
Intensive Interventions 19
School Failure 20
Social Risk................................................................................................... 20
Academic Risk............................................................................................. 23
Identifying At-Risk Students.............................................................................. 24
Prevalent Indicators of At-Risk Students 27
V111
III. WIETHODOLOGY 31
Research Design... 31
Setting 33
Participants........................................................................................................ 37
Measures 39
Independent Variables.................................................................................. 39
Dependent Variables.................................................................................... 44
Procedures......................................................................................................... 46
IV. RESlTLTS 47
How Many Students Are Considered At-Risk? 49
What Are the Characteristics of At-Risk and Non-Risk Students? 51
How Do At-Risk Ninth Graders Perform on Each Middle School Indicator?...... 54
How Does Each Eighth Grade Indicator COlTelate to Nine GradePerforJllance?.................................................................................................... 59
What Are the Significant Predictors of Ninth Grade Attendance?...................... 61
What Are the Significant Predictors of Ninth Grade Course Failure? 65
What Are the Significant Predictors of Ninth Grade GPA? 67
V. DISCUSSION. 70
Key Findings 71
Characteristics of At-Risk Students.............................................................. 72
Predictors of Ninth Grade Performance........................................................ 74
Attendance 75
IX
Chapter Page
Course Failure......................... 77
Grade-Paint-Average 79
Implications.... 80
A Model for Identifying At-Risk Ninth Grade Students 81
Middle School Attendance...................... 81
Middle School Grade D.......................................................................... 82
Study Lin1itations 83
Internal Validity........................................................................................... 83
Selection 83
Regression 84
Maturation............................................................................................. 84
External Validity... 84
Interaction of Setting and Treatment....................................................... 85
Interaction of Treatment Variations............ 85
Further Research................................................................................................ 86
REFERENCES........................................................................................................ 88
x
LIST OF FIGURES
Figure Page
1. FAT Decision-Making Protocol......................................................................... 12
2. Intervention Pyramid 19
3. Middle School Indicators by Category............................................................... 32
4. Significant Middle School Indicators of Ninth Grade Performance 71
Xl
LIST OF TABLES
Table Page
1. Freshmen Failure Rate. 34
2. Four-Year & One-Year Dropout Rates............................................................... 35
3. Demographic Information for Middle School A, B, and C 37
4. Academic Data for Middle School A, B, and C.................................................. 38
5. Demographic Information of Ninth Grade Participants During the 2008-2009School year....................................................................................................... 48
6. Students by Number of Middle School Risk Indicators 50
7. Demographic Information by Middle School Risk Status 51
8. Summary of Middle School Risk Indicators by Risk Status Using Raw Scores.. 52
9. Ninth Grade Measures by Risk Status by Middle School Risk Indicators- Classroon1 Perfon11ance................................................................................... 55
10. Ninth Grade Measures by Risk Status by Middle School Risk Indicators- School Behavior 57
11. Ninth Grade Measures by Risk Status by Middle School Risk Indicators- State Assessment 58
12. Ninth Grade Measures by Risk Status by Middle School Risk Indicators- National Assessl11ent 60
13. Correlation Between Middle School Risk Indicators and Ninth GradePerformance....................................... 62
14. Multiple Regression Analysis Summary for Middle School Risk IndicatorsPredicting Ninth Grade Attendance (Initial Model)............................................ 63
Xll
Table Page
15. Multiple Regression Analysis Summary for Middle School Risk IndicatorsPredicting Ninth Grade Attendance (Revised Model)......................................... 65
16. Multiple Regression Analysis Summary for Middle School Risk IndicatorsPredicting Ninth Grade Course Failure (Initial Model)....................................... 66
17. Multiple Regression Analysis Summary for Middle School Risk IndicatorsPredicting Ninth Grade Course Failure (Revised Model) 67
18. Multiple Regression Analysis Summary for Middle School Risk IndicatorsPredicting Ninth Grade GPA (Initial Model)...................................................... 68
19. Multiple Regression Analysis Summary for Middle School Risk IndicatorsPredicting Ninth Grade GPA (Revised Model)......... 69
1
CHAPTER I
INTRODUCTION
The United States has a dropout crisis (ChristIe, Jolivette, & Nelson, 2007; Neild,
Stoner-Eby, & Furstenberg, 2008). Recent data suggest that approximately 10 percent of
students entering high school eventually leave school before graduation without a
diploma or equivalency (U.S. Department ofEducation, 2007). Students who dropout of
school are four times more likely to be unemployed, and earn one-third less income than
high school graduates (Patterson, 2004; U.S. Census Bureau, 2006). They have fewer
employment options, and if employed, usually end up in low-skilled, low-paying
positions with few opportunities for advancement. In addition, students who dropout
report having more health problems, and on average, die at an earlier age than students
who graduate (U.S. Department of Education, 2007). They often lack the resources and
quality health care needed for productive lives. Finally, high school dropouts make up a
higher percentage of the nation's prison inmates (U.S. Department of Justice, 2002), and
they are more dependent on welfare and other government programs (ChristIe, Jolivette,
& Nelson, 2007). Consequently, dropping out of school may be viewed as a social, as
well as personal crisis.

2
Research suggests that the transition from middle school to high school is a
critical point on the path to high school graduation (ChristIe, Jolivette, & Nelson, 2007;
Neild, Stoner-Eby, & Furstenberg, 2008; and Patterson, Beltyukova, Berman & Francis,
2007). Students making this transition may experience social as well as academic
challenges that result in negative consequences, including academic loss and drop out.
Nationally, one-third of the students who drop out of high school make this decision
between the ninth and tenth grade year (Patterson, Beltyukova, Berman & Francis, 2007).
Allensworth and Easton (2005) suggest that freshmen-year academic performance is
strongly linked to high school graduation. Specifically, they report that freshmen students
who fail a core academic course in language arts, math, science or social studies are three
and halftimes more likely to not graduate from high school. Therefore, graduation rates
are not likely to improve until schools improve students' academic performance in the
freshmen year.
While student consequences are high for dropping out of school, federal and state
accountability systems have raised the stakes for schools whose students fail. No Child
Left Behind (2001) requires each state to set targets for graduation rates that
progressively increase, resulting in all schools reaching a 100 percent graduation rate by
2014. Failure to meet the federal benchmarks may result in a variety of consequences for
schools, including the loss of federal title funding. Many states have changed their
graduation requirements, including setting perfonnance standards on statewide
assessments. In addition, schools have implemented a variety of reform efforts focused
on increasing freshmen success through structural changes, such as block scheduling and
3
teacher teams. Schools have also increased the rigor of their curriculum, provided
tutoring, and developed more holistic assessments of student learning with mixed results.
A school reform that may address the needs of freshmen, leading to greater
student success, is Freshmen Achievement Team (FAT). FAT provides struggling
freshmen students in core academic areas with tiered interventions and monitors students'
academic progress. Teachers are teamed, particularly in social studies and language arts,
and assigned a cohort ofapproximately 75 freshmen students. Teachers are provided a
common plan time to develop common assessments and develop interdisciplinary
instruction. In addition, each team is provided time twice each month to meet with a
counselor, an administrator, an intervention specialist, a Special Education teacher, and a
school psychologist, to monitor student progress and develop classroom and school-wide
interventions for students who struggle. It is believed that teacher teaming creates a
smaller learning environment that is adapted to provide individual intervention for
struggling students prior to academic failure. Early identification of at-risk students is
critical to providing effective intervention.
The FAT process, however, is based on accurately identifying students who are
likely to (at risk of) drop out. At-risk students are pre-identified for intervention by
exhibiting risk indicators in middle school. A List ofIncoming Transition Students At
Risk (LITSAR) identifies the most at-risk students that are transitioning to the high school
based on 12 indicators, including a student's grade-point-average, number ofD and F
grades, number of suspensions and expulsions, attendance rate, scores on the four ACT
Explore exams, and scores on the reading and math state assessments. Students who are

4
identified as at risk on six or more of the 12 indicators are considered to be possibly at
risk for school failure. These students are monitored by FAT and provided early
interventions. While the LITSAR relies on a number of indicators, an efficient typology of
at-risk indicators may improve the efficacy of interventions.
The development of at-risk indicators would be helpful in the development of
differentiated interventions for struggling students. Early identification of struggling
students may lead to timely and effective intervention that improves student performance,
leading to high school completion. For example, a number of studies have suggested that
previous academic failure (Finn & Rock, 1997), problem behavior (Tobin & Sugai,
1999), and attendance rates (McIntosh, Flannery, Sugai, Braun, & Cochrane, 2008), are
strong predictors of student dropout. Unfortunately, academic failure and problem
behavior rarely exist in isolation. McIntosh, Flannery, Sugai, Braun, and Cochrane (2008)
suggest that multiple factors combine to put students in more dramatic risk of failure in
high school. Consequently, early identification of at-risk factors is important to
mitigating the cumulative effect of school failure.
The purpose of this study was to examine the efficacy of 12 middle school
academic risk indicators to identify struggling students entering the ninth grade. I
examined existing data from a large, suburban high school to analyze the nature of the
indicators and their relationship to ninth grade performance. Initially, I examined
descriptive data of academic performance, problem behavior, and attendance of ninth
grade students. Subsequently, I used statistical analysis to answer the following research
questions: First, how many students are considered at-risk? Second, how do at-risk ninth

graders perform on each middle school indicator? Third, what are the characteristics of
at-risk and non-risk students? Fourth, how does each eighth grade indicator correlate to
ninth grade performance? Finally, what are the significant predictors of ninth grade
performance?
5
6
CHAPTER II
BACKGROUND RESEARCH
Recent research into high school completion has identified dropping out of school
as a personal and social crisis (ChristIe, Jolivette, & Nelson, 2007; Neild, Stoner-Eby, &
Furstenberg, 2008). High school dropouts have limited life experiences and, as a group,
become a drain on social services. Schools have developed a wide range of interventions
to keep students on track for graduation. Effective school interventions have typically
been based on evidence from student data.
Unfortunately, the complexity of social and academic risk factors may mitigate
the impact of intervention. Risk factors are cumulative in nature, and may be identified as
early as the sixth grade. The transition of students from middle school to high school may
be a tipping point for students in process of dropping out. Current research has suggested
that strong predictors may occur during the ninth grade, including attendance, course
completion, and grade-point-average (Allensworth & Easton, 2005; Allensworth &
Easton, 2007~ ChristIe, Jolivette, & Nelson, 2007~ Neild, Stoner-Eby, & Furstenberg,
2008; and Patterson, Beltyukova, Bennan & Francis, 2007). Early identification of
students that struggle academically is an important first step to providing targeted
interventions.
7
A Focus on the Ninth Grade
Students experience many changes in the transition from middle to high school.
High schools, particularly in an urban or suburban setting, are large institutions that
students may find to be cold and impersonal places compared to their middle school
experience (Mizelle, 2005). In addition to their physical size, high schools are remarkably
different from the middle school. Students find a greater emphasis placed in high school
on course grades and higher expectations are placed on completing homework (Letrello
& Miles, 2003). Students often feel overwhelmed and under prepared for these new
academic demands. Students who fail often find themselves retaking courses or face the
possibility of not graduating on time.
High schools, also, increasingly require students to make more choices about their
curriculum and extracurricular activities that have greater ramifications on their future.
Decisions about course selection, such as college-prep or honor courses, may increase the
pressure that students feel to succeed far beyond what has previously been experienced.
Participation in extracurricular activities may conflict with the time necessary for
students to complete the new homework demands. Consequently, students entering high
school are faced with increased expectations and time conflicts that may lead them to
struggle in school (Patterson, Beltyukova, Berman & Francis, 2007).
Students' experiences in transitioning to high school are not necessarily unique
and may be anticipated. Roderick (1993) suggested that a high school's physical size
might negatively impact student performance. In a study of students beginning in the
seventh grade, she found that the academic performance and attendance of students that

8
eventually dropped out decreased substantially after each transition, from elementary to
middle school and from middle to high school. She suggested that transitioning from
school to school negatively impacted student performance. She further concluded that
dropping out is based on something within the environment that causes student to
disengage from school, such as the physical size of the school.
In addition, a change in the teacher-student relationship may negatively impact
student performance. In a study of transitions ofpoor, urban students, Seidman, Aber,
Allen, and French (1996) found that there was a decline in grade-point-averages during
the first year of high school. Further analysis suggested that students felt a significant loss
of support from school staff while experiencing significant increases in negative
transactions with teachers and other adults regarding the students' academic progress
throughout the transition year. Seidman and associates (1996) conclude that these
changes in student perceptions are rooted in existing organizational arrangements within
the school and not from changes within the students themselves. In addition, Neild,
Stoner-Eby, and Furstenberg (2008) suggest that there is a mismatch between students'
academic and social skills and high school's organization, practices and demands. They
note that the majority of ninth graders enter with academic skills several years below
grade level, and teachers are ill-prepared to teach students in need of basic literacy and
numeracy skills.
Student achievement in middle school also may have contributed to a difficult
transition to high school. Allensworth and Easton (2005) suggested that there is a strong
relationship between middle school performance and ninth grade course completion. In

9
their study of Chicago Public Schools, only 40 percent of students entering high school
with relatively weak test scores were on-track for graduation at the end of 9th grade, and
only 68 percent of these students actually graduated four years later. In comparison, over
75 percent of the students with relatively strong test scores were on-track at the end of
ninth grade. They concluded that middle school achievement levels influence a student's
successful transition to high school.
Research has found that the transition to ninth grade is crucial for dropout
prevention (Kennelly & Monrad, 2007). The ninth grade year is often identified as the
year when students are likely to get off-track for high school success. More students fail
ninth grade than any other high school grade, and a disproportionate number of students
were held back during this time (Herlihy, 2007). According to Neild and Balfanz (2006),
about two-thirds of the dropouts in Philadelphia schools were in grade 10 or below.
As Neild, Stoner-Eby, and Furstenberg (2008) have concluded, turning around
ninth grade student outcomes is an enormous task that will not be achieved through
piecemeal solutions. Individual interventions or policies have not appreciably impacted
educational outcomes for students who are vulnerable for academic failure. Christie,
Jolivette, and Nelson (2007) have suggested that there is a wide variety of personal and
school factors that contribute to school failure and dropout, and Suh and Sub (2007) also
suggested that the combination oftwo or more risk factors may dramatically increase the
likelihood of dropping out. Suh and Sub further concluded that students who dropped out
of school were not all alike but rather they differed according to personal and social
characteristics. Understanding that contributing factors to school failure are
10
multivariable, the identification of a single precursor is problematic. A current approach
to addressing the needs of struggling students has focused on problem solving.
A Problem-Solving Approach
A problem-solving approach is a systemic process that includes the assessment of
a student's needs, development and implementation of supports to meet those needs, and
the monitoring and evaluation of student outcomes (Nunn & McMahan, 2001). Used as
an alternative method of identifying students in need of special education services, it
attempts to overcome the "wait to fail" phenomenon in which students have to fall far
enough behind others students before meeting special education's discrepancy criterion.
By the time these students qualify for special education, they have already experienced
years of academic failure (Lau, et aI., 2006). Introducing interventions prior to a student
actually failing may improve student performance and mitigate a student's decision to
drop out. Nunn and McMahan (2001) have identified four key principles of a problem
solving approach that include: (1) assessment of classroom performance, (2)
collaborative decision-making, (3) solutions based, and (4) frequent progress monitoring.
Assessment ofClassroom Performance
The problem solving approach views student concerns in the context of
performance relative to expectations of the general education classroom. Students are
evaluated within the day-to-day context of classroom demands. As students work toward
defined learning targets, their performance is assessed and monitored. Assessment within
the classroom is functional and dynamic, assisting in the identification of problem
behavior, development of interventions, and evaluation of intervention outcomes.
11
Assessment is an on-going process used to increase confidence in decisions made at
every level of involvement with the child. Assessment is a practical tool to guide
intervention. The function triad of assessment-intervention-outcomes allows collaborative
data based decisions to increase the effectiveness of each intervention.
Collaborative Decision-Making
The problem solving approach enhances individual skills of team members
through collaborative planning, decision-making, and support. FeIner, et al. (2007), in
their work with smaller learning communities, suggest that empowering teacher teams to
make decisions on student outcomes leads to more effective teaching and higher
expectations for student progress. Staff empowerment to make decisions concerning a
student's educational experience is critical to effective problem solving. With access to
student data, teams evaluate a student's performance and develop an intervention plan for
student improvement through a decision- making protocol. The protocol is a multi-step
process that gathers input from all stakeholders, including teachers, counselors, parents
and students. This process relies on the use of evidence-based strategies and student data
to develop student interventions that are effective in addressing the student's needs.
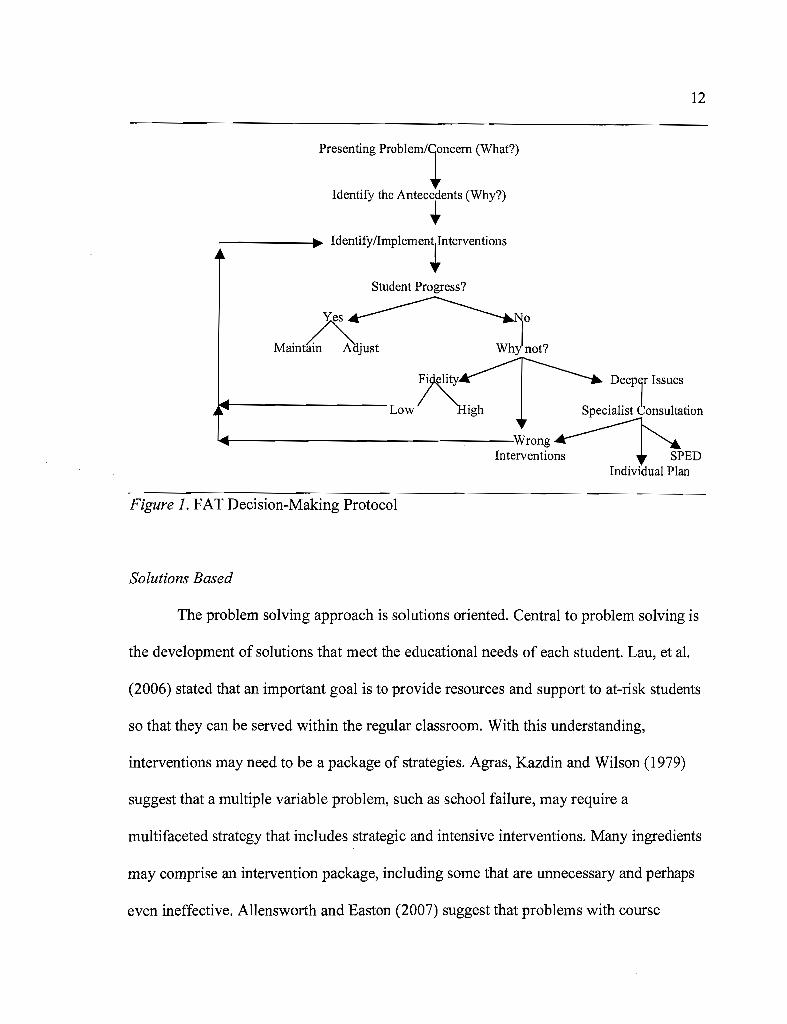
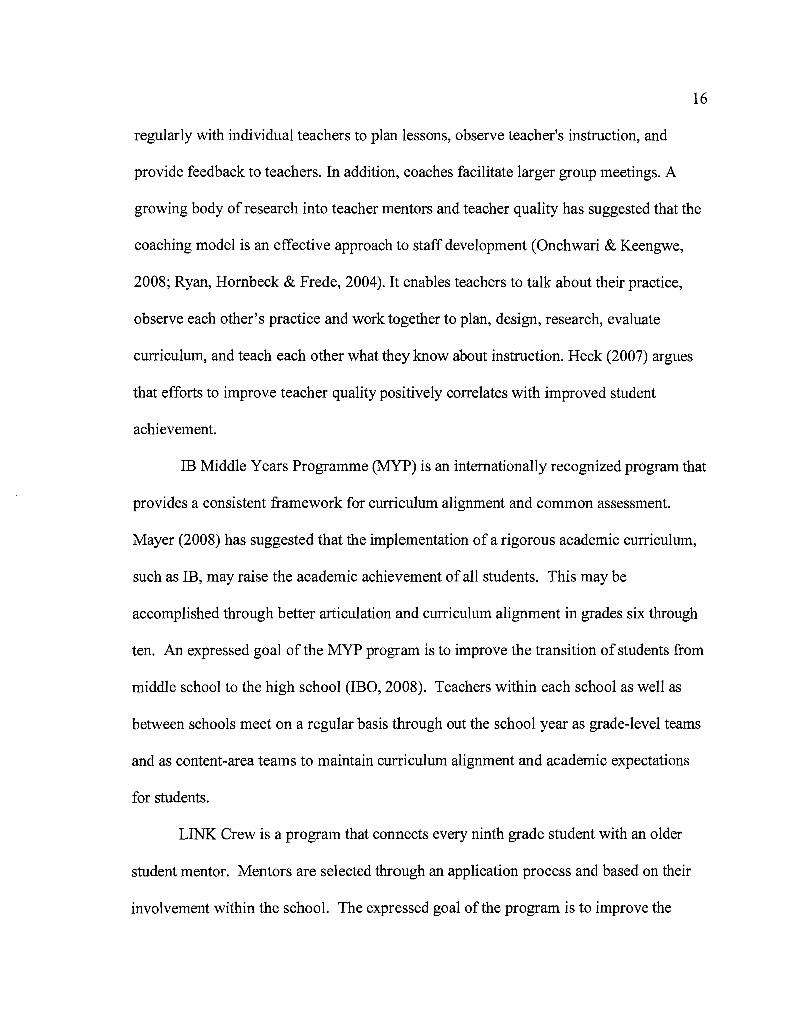
Student data are continually monitored and interventions are adjusted accordingly. Figure
1 outlines the decision-making protocol, beginning with the student's problem or concern.
At each step in the protocol, staff members are focused on solutions that improve student
outcomes.
12
Pmeoting pmblem/!n""" (What?)
Identify the Antecedents (Why?)
•~ IdentifYfImPlementnterventions
Student Progress?
o
Deepir Issues
Specialist tonsultation
,...----------------In-t'~:rO~EDIndividual Plan
Figure 1. FAT Decision-Making Protocol
Solutions Based
The problem solving approach is solutions oriented. Central to problem solving is
the development of solutions that meet the educational needs of each student. Lau, et aI.
(2006) stated that an important goal is to provide resources and support to at-risk students
so that they can be served within the regular classroom. With this understanding,
interventions may need to be a package of strategies. Agras, Kazdin and Wilson (1979)
suggest that a multiple variable problem, such as school failure, may require a
multifaceted strategy that includes strategic and intensive interventions. Many ingredients
may comprise an intervention package, including some that are unnecessary and perhaps
even ineffective. Allensworth and Easton (2007) suggest that problems with course

13
failure in 9th grade indicate broader problems of academic performance. They report that
failure in even one semester course is generally a sign of trouble in other courses. This
suggests that singular interventions that address a particular course might be limited in
their ability to affect broader outcomes, compared to more comprehensive coordination
of an intervention package across classes. If the entire intervention package with all its
distinguishable components changes behavior, then the problem solving team can
reinforce effective interventions and begin to scrutinize particular components that may
not work. School failure requires a comprehensive approach to intervention.
Although interventions need to be flexible to address the individual needs of
struggling students, the success of a particular intervention package is reliant upon valid
judgments made by teachers. The American Educational Research Association (1999)
and the U.S. Department ofEducation (2003) have stressed the importance of validity
information that supports the use of evidence-based interventions. Interventions are most
effective when there is a strong relationship between assessment results, prescribed
interventions, and desired outcomes. Gleason and Dynarski (2002) suggest that dropout
prevention programs are effective when evidence-based interventions are focused on
individual student outcomes with frequent progress monitoring.
Frequent Progress Monitoring
Problem solving uses simple, frequent and ongoing indicators of progress to
monitor the impact of interventions upon student outcomes. Sugai and Homer (2002)
suggest that student data may be used throughout the problem solving process to: (a)
define and prioritize areas of continuing concern, (b) select and adjust practices to

14
address these areas of concern, (c) continually evaluate the impact of these practices in
achieving desired outcomes, and (d) guide long-term action planning and sustainability
goals. The empowerment of teachers to monitor student progress and adjust interventions
based on student data should lead to improved student performance. As students struggle,
data may inform decisions about increasing the level of intervention from strategic to
intensive.
Multi-Tiered Intervention
A growing body of research has examined the utilization of multi-tiered
intervention systems in schools (Kamps & Greenwood, 2005; Sugai, 2003; Vaughn, et
al., 2008). Borrowed from the mental health field (Sailor, Stowe, Turnbull &
Kleinhammer-Tramill, 2007), multi-tiered interventions include systemic, strategic and
intensive interventions. Each level is characterized by specific strategies that increase in
intensity as students are in need of further intervention. Systemic interventions are
strategies that involve the entire school community. Strategic interventions are focused
on small groups of students that need targeted strategies that are beyond systemic efforts.
Intensive interventions target individual students with specific needs that require
individual strategies.
Systemic Interventions
Systemic interventions include school-wide reforms that impact every student.
These interventions focus primarily on structural reforms intended to personalize
students' experience and improve instruction. While identified as interventions, these
structures are intended to be more proactive in the prevention of failure as opposed to

15
reacting to a student that has already failed. Systemic interventions include a number of
components, each of which is described below.
Block scheduling offers every student the opportunity to take eight classes that are
divided equally over two days; the first four classes meet on the first day and second four
classes meet on the following. This alternating day schedule allows each class to meet for
approximately 90 minutes each session. This extended class time is intended to provide
students with more in-depth instruction, increased student learning and an improved
school climate. In a meta-analysis of 58 studies on blocking scheduling, Zepeda and
Mayers (2006) have suggested that research supports two generalizations: (a) students
and teachers have reported increased positive interactions, and (b) student grades and
grade-point-averages have increased.
Interdisciplinary teaming occurs in all ninth grade language arts and social studies
courses, where teachers share a common cohort of students. Teachers share a common
planning time to develop an interdisciplinary curriculum and common assessments. In
addition, interdisciplinary teams provide a context for a smaller learning environment.
While research on the impact of interdisciplinary teaming on student achievement is
mixed, FeIner, et al. (2007) have suggested that teaming may create positive school
attitudes and improve student attendance. Students have a greater sense of belonging and
engagement. This is accomplished through the creation of small, personalized learning
communities that rely on the teaming concept.
Instructional coaches are provided to work with staff in further developing their
instructional practice, particularly in the areas of literacy and math. Coaches meet
16
regularly with individual teachers to plan lessons, observe teacher's instruction, and
provide feedback to teachers. In addition, coaches facilitate larger group meetings. A
growing body of research into teacher mentors and teacher quality has suggested that the
coaching model is an effective approach to staff development (Onchwari & Keengwe,
2008; Ryan, Hornbeck & Frede, 2004). It enables teachers to talk about their practice,
observe each other's practice and work together to plan, design, research, evaluate
curriculum, and teach each other what they know about instruction. Heck (2007) argues
that efforts to improve teacher quality positively correlates with improved student
achievement.
IB Middle Years Programme (MYP) is an internationally recognized program that
provides a consistent framework for curriculum alignment and common assessment.
Mayer (2008) has suggested that the implementation of a rigorous academic curriculum,
such as lB, may raise the academic achievement ofall students. This may be
accomplished through better articulation and curriculum alignment in grades six through
ten. An expressed goal of the MYP program is to improve the transition ofstudents from
middle school to the high school (lBO, 2008). Teachers within each school as well as
between schools meet on a regular basis through out the school year as grade-level teams
and as content-area teams to maintain curriculum alignment and academic expectations
for students.
LINK Crew is a program that connects every ninth grade student with an older
student mentor. Mentors are selected through an application process and based on their
involvement within the school. The expressed goal of the program is to improve the
17
transition of ninth graders to high school through the development of a relationship with
other students (Karcher, 2005). Mentors develop and facilitate transition activities that
extend throughout the school year. Mentor programs, such as Link Crew, have been
linked to positive changes in students' self-esteem, social skills and school behavior
(Karcher, 2005).
Advisory is a program that connects a small group of students with a school staff
member, who mentors the students through out the four years of high school. Galassi,
Gulledge, and Cox, (1997) have suggested that advisory programs are a type of primary
prevention effort with improvements in a student's self-concept and connection with
school. Advisory groups meet for 90 minutes every other week. The staff member
facilitates activities connected to college and career planning, as well as course
forecasting. Each advisory is arranged by alpha grouping, according to the student's last
name. School counselors are assigned to each advisory and work with students within the
group setting, as well as individually.
Strategic Interventions
Strategic interventions address the academic and behavioral needs of students
who need more than systemic interventions to be successful at school. These students
may struggle due to specific skill deficiencies and disengagement from the school
environment. Strategic interventions provide targeted instruction and support to address
these needs. Strategic interventions include:
Freshmen Seminar is an 18-week course that provides targeted literacy instruction
to students with in the context of the four core content areas ofEnglish literature, social
18
studies, mathematics and science. Instructors work closely with the content-area teachers
to align the instruction of reading strategies with the content curriculum. As students
move through middle school to high school, reading demands increase with the need to
understand more complex concepts and vocabulary. Many struggling students, however,
do not show mastery in basic reading skills. Research suggests that students need explicit
instruction in vocabulary and the application of comprehension strategies (Vaughn, et aI.,
2008). Freshmen Seminar is a strategic intervention for students that struggle with
reading in the content areas.
Algebra Block is an extended math course for students with deficient Algebra
skills. While a typical math course will meet every other day in 90-minute blocks, the
Algebra Block meets everyday for 90 minutes. Current research has suggested that
interventions designed to provide extended time may improve student academic
performance (Ketterlin-Geller, Chard, & Fien, 2008). Extending instructional time allows
struggling students greater exposure to mathematical concepts and greater access to
teachers. In addition, the inclusion of a special education teacher with a math teacher may
reduce the ratio of students to teachers and provide greater support for struggling
students.
Peer tutoring is provided for struggling students in all content areas. Students are
identified through the FAT process and paired with a peer tutor. Peer tutors are selected
through an application process that focuses on a potential tutor's academic achievement
and willingness to work with out students. Peer tutoring occurs three times each week
after regular school hours through out the school year. Stenhoff and Lignugaris-Kraft
19
(2007) suggest that peer tutoring may have a positive impact on academic performance,
and Somers and Piliawsky (2004) suggest that peer tutoring helps retain at-risk students
in school. A review of current research identifies peer tutoring as an evidence-based
strategy that may benefit both the tutor and tutee.
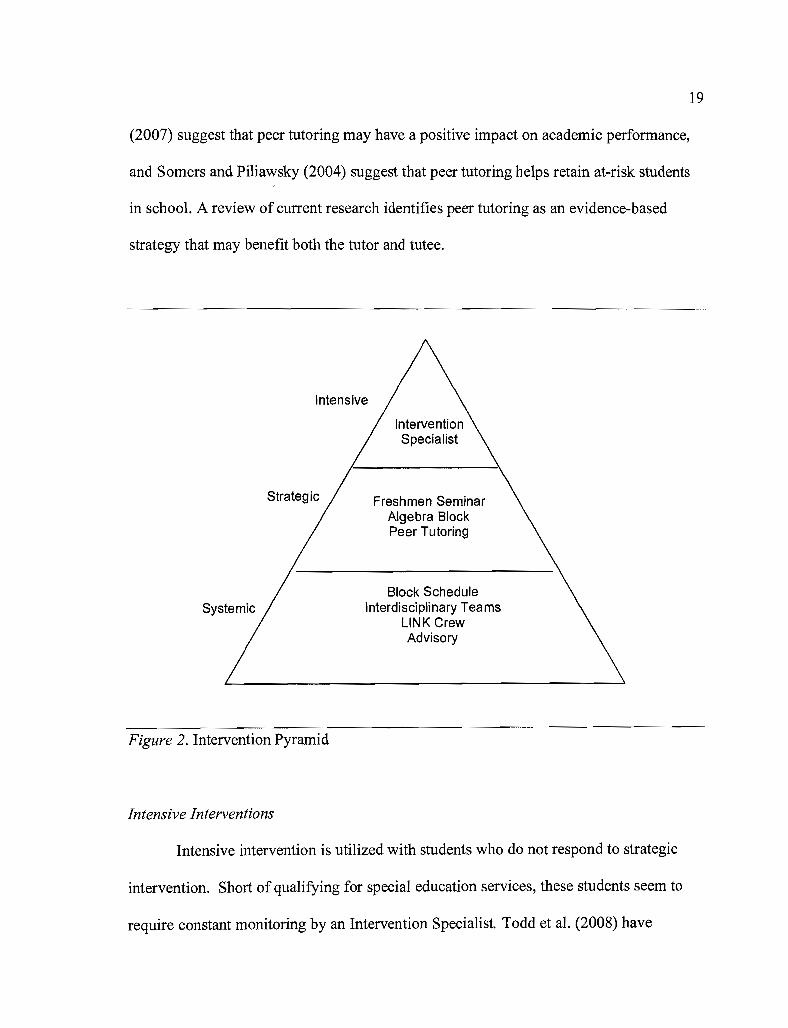
Intensive
Systemic
Strategic Freshmen SeminarAlgebra BlockPeer Tutoring
Block ScheduleInterdisciplinary Teams
LINK CrewAdvisory
Figure 2. Intervention Pyramid
Intensive Interventions
Intensive intervention is utilized with students who do not respond to strategic
intervention. Short of qualifying for special education services, these students seem to
require constant monitoring by an Intervention Specialist. Todd et al. (2008) have
20
suggested that a monitoring system, such as check-in/check-out may be highly effective
with at-risk students. With this in mind, each Intervention Specialist is assigned
approximately 75 at-risk students, who are identified by cumulative grade-point-average,
office discipline referrals, and attendance. These students meet daily with the specialists
to monitor the student's academic progress and provide mentoring. In addition, the
specialist facilitates access to other district, school or community resources as needed by
the student or the student's family.
School Failure
Extensive research in the area of school failure focuses on a key construct ofrisk,
which is understood to be an unwelcome or negative educational outcome. Risk is often
divided into two categories: social risk and academic risk (Lee, 2003). Social risk refers
to demographic factors associated with a higher likelihood of school failure. Ethnicity,
age, minority-language status, gender, family income, parents' education, and family
structure are often associated with dropping out. Academic risk refers to students' school
behaviors and performance, which often reflect the actual manifestation of school-related
problems. Poor grades and test performance may be indicators of academic risk. Risk
factors are cumulative in nature, suggesting that a student with more than one risk factor
is statistically more likely to drop out.
Social Risk
Social risk factors have been shown to negatively impact a student's academic
performance, and are linked to high school drop out. Race, ethnicity, gender and
socioeconomic status are highly correlated with the likelihood of struggling in school

21
(Croninger & Lee, 2001). Studies have shown that a disproportionate number of minority
students leave high school before graduating. Neild and Balfanz (2006) found that only
one-half of African American males finished school with their peer group in four years
and only 46 percent of Latino males graduated with a diploma within six years. In
addition, studies have indicated that schools with high percentages of low-income or
minority students tend to have poor academic performance and high dropout rates, and
schools with the most low-income students are often concentrated in urban communities
(Finn, 2006).
Students who attend more than one high school are less likely to complete school.
Rumberger (2002) has suggests that student mobility during high school, as well as
during earlier grades, poses risks to graduating. A variety of factors may influence
students to transfer to another school. A family's inability to secure stable housing and
employment are often cited as factors in student mobility. Mobility, however, is a factor
separate from other social risk factors. Kennelly and Monrad (2007) believe that student
mobility reduced the chances of graduation even after controlling for a variety of family
background variables. Finally, the timing of a student's move is important. Swanson and
Scheider (1999) notes that changing schools, particularly between grades eight and 10
significantly increases the likelihood of students dropping out compared to non-mobile
students.
Student problem behavior is also cited in research as a social risk factor in school
dropout. Problem behavior includes student behaviors such as non-attendance, drug use,
violence, and defiance. These behaviors often lead to school avoidance or school
22
discipline, depriving students of classroom instruction. Of these factors, Gleason and
Dynarski (2002) suggest that high absenteeism is strongly associated with school
dropout. Students who are frequently absent from school are less likely to earn class
credits essential for graduation. Absenteeism deprives students of academic knowledge
and skills necessary for academic success. As students fall behind academically, they
may experience further withdrawal from school.
In addition, student violence may be associated with school drop out. Tobin and
Sugai (1999) draw a connection between referrals for violence involving fighting in grade
six to similar referrals in grade eight. They state that a high frequency of discipline
referrals in grade six translates strongly to chronic discipline problems in later middle
school, and eventually predict frequent suspensions in grade nine. Three or more
suspensions in ninth grade may lead to school failure. While suspending students who are
dangerous or disruptive is necessary to keep schools safe and orderly, suspensions cause
an interruption to a student's education, and repeated suspensions may lead to alienation
and dropout.
It is important to note that social risk factors do not cause students to drop out of
school. Rather these factors may be indicators of students who are disengaging from the
school climate and eventually withdrawing from school. As risk factors accumulate,
students may experience greater difficulty staying on track for graduation. This process
of dropping out may begin as early as elementary school.
23
Academic Risk
In addition to social risk factors, students may experience academic risk factors.
Croninger and Lee (2001) suggest that academic risk refers to a student's previous school
performance at a specific point in time. Previous academic performance, such as course
grades and test performance, is a strong indicator of high school completion. Allensworth
and Easton (2005) suggest that students who fail core subjects, such as English,
mathematics, science or social studies, are less likely to complete high school. They
suggest that students who enter high school with strong achievement test scores are more
likely to be on-track for graduation than lower-scoring students. Students with lower
achievement scores struggle to keep up with their peers and eventually find that they are
falling behind. Researchers suggest that the strength of poor academic achievement
mediated the effects of all other independent factors. Consequently, dropout prevention
efforts should focus directly on improving academic achievement.
Academic risk factors also have typically included school characteristics. A
growing body ofresearch has indicated that school-level factors may contribute a
significant role in determining whether or not a student completes high school.
Allensworth and Easton (2005) found that dropout rates varied widely across Chicago
high schools, even after controlling for individual risk factors, including race, gender,
prior academic achievement, family socioeconomic status and student retention in
previous grades. They suggested that school's organization, structures, and curriculum
may playa role in the process of students dropping out.

24
Research also indicates that high schools exhibit lower dropout rates, particularly
among low-achieving, low-income students when they have smaller enrollments, better
interpersonal relationships among students and adults, teachers who are supportive of
students, and a curriculum that is both focused and more rigorous (Consigner & Lee,
2001). These authors report that high schools with highly supportive teachers cut the
probability of dropping out in half. Recognizing the influence of these school-level
factors can lead schools to improve school climate, academic rigor, as well as develop
smaller learning communities that personalize the educational experience for students
(Kennelly & Monrad, 2007).
McIntosh, Flannery, Sugai, Braun, and Cochrane (2008) suggest that social risk
and academic risk factors do not necessarily operate in isolation. They argue that the two
are interrelated. Students with early difficulties in academics are at greater risk of
developing behavior problems. Likewise, students with early difficulties in behavior are
at greater risk of suffering academically. This interaction may reach a critical mass in
high school where students suffering from both are at greater risk of dropping out than
students with problems in only one area. Consequently, a systemic early identification
system of students at-risk of dropping out is required to address the complexity of
students' needs.
Identifying At-Risk Students
Early identification of at-risk students may provide an opportunity to intervene in
the process of dropping out. Recent research has suggested that most dropouts may be
identified as early as the sixth grade. Balfanz and Herzog (2005) found that more than
25
half of Philadelphia sixth graders, who exhibited poor attendance, received a poor final
behavior grade, or failed either math or English, eventually dropped out of school. They
report that between 1,000 and 2,000 sixth graders had these risk factors in a given year.
As students transition into middle school, these indicators may become more prevalent.
While many dropouts exhibit either academic performance problems or disengagement in
middle school, students rarely show both at the same time. Kennelly and Monrad (2007)
suggests that this outcome indicates a convergence of academic and social risk factors as
students move closer to high school. Identifying struggling students and intervening prior
to this convergence may improve the odds that student will remain in school to
graduation.
A closer examination of middle school indicators suggests that two eighth grade
factors were strong indicators of dropout. Poor attendance, defined as missing at least
five weeks of school, and failure in either math or English had a strong correlation with
dropping out. Neild and Balfanz (2006) found that eighth graders who attended less than
80 percent of the time were 78 percent more likely to drop out, and eighth graders who
failed math or English were 77 percent more likely to become dropouts. In this study,
gender, race, age and test scores were not strong predictors of attendance and course
failure. While eighth grade indicators may provide strong predictors of dropping out,
nearly one~third of Philadelphia dropouts did not exhibit any warning signs in eighth
grade, but had problems in ninth grade. This suggested the need to continue monitoring
at-risk students during ninth grade.
26
In studying ninth graders in Philadelphia, Nield and Balfanz (2005) found three
indicators that may predict future dropout. These indicators include poor attendance, poor
academic performance, and failure to be promoted to 10th grade on time. Students who
attended less than 70 percent of the time or failed to earn two or more credits were found
to be less likely to finish high school. In addition, the failure to earn a sufficient number
of credits resulted in students being retained in the ninth grade. Student retention was
identified as an at-risk indicator. According to this study, a ninth grader with just one of
the characteristics was 75 percent more likely to dropout. About one-half of the dropouts
were identified before entering high school, and 80 percent who dropped out were either
at-risk in eighth or ninth grade. Failure to earn sufficient credits to move from ninth to
tenth grade was considered the biggest risk factor for dropping out.
In similar studies in Chicago Public Schools, Allensworth and Easton (2007)
found that more than one-half of dropouts could be identified by the end of the first
semester by using either course failure rates or student absences from school. They
determined that course grades and failure rates are slightly better predictors of graduation
than attendance, because they directly impacted whether or not students are making
progress in their courses. With course grades and failure rates, schools were provided
with specific information to target programs and interventions for struggling students.
Allensworth and Easton also found that cumulative grade-point-average provides
important information about who is likely to struggle, and they suggested that it might be
the best predictor of dropping out. Cumulative grade-point-average was a broad indicator
of a student's academic performance and it may have indicated whether a student was

27
sufficiently making progress in acquiring the necessary credits for graduation. While
potential dropouts was identified as early as elementary school, struggling students
experienced decreasing attendance and grades during the transitions between middle
school and high school, and therefore, suggested that ninth grade was a tipping point year
in the process of dropping out.
Prevalent Indicators ofAt-Risk Students
Current research has consistently identified four key high school indicators that
are indicative of who is most likely to drop out. Research has suggested that developing
identification systems around these indicators may better identify at-risk students and
focus resources for dropout prevention (Allensworth & Easton, 2007; Jerald, 2006;
Kennelly & Monrad, 2007). The four indicators include failure in core subjects, low
attendance, failure to be promoted to the next grade, and disengagement in the classroom,
including problem behavior.
An effective approach of identifying at-risk students would utilize these indicators
in conjunction with one another as opposed to in isolation as a single indicator. An over
simplified system may misjudge the complexity of risk factors. Accurate identification is
critical. Even the highest quality dropout prevention programs will have little effect if
risk factors identify the wrong students (Gleason, 2002).
Failure in core academic courses is a strong indicator of at-risk students.
Numerous studies have included failure in core academic courses as a predicator
(Allensworth & Easton, 2005; Balfanz, Herzog & MacIver, 2007; Neild & Balfanz,
2006). Graduation is the result of students accumulating sufficient course credits.

28
Allensworth and Easton (2005) conclude that receiving more than one F in a core
academic course together with failing to be promoted to the tenth grade to be a key
indicator. As struggling students a fail course, they fall farther behind and may not be
able to make up the sufficient amount of credit. In both Chicago and Philadelphia, grades
tended to be better indicators of dropout than test scores. More than any other indicator,
credit accumulation may be the most accurate measure of student progress towards
graduation.
Excessive absenteeism is considered one the strongest predictors of course failure,
and consequently, a predictor of high school dropout. As suggested by Neild and Balfanz
(2006), 78 percent of eighth grade students with attendance rates below 80 percent
eventually dropped out of school. Students with moderate levels of absenteeism from one
to two weeks per semester are substantially at risk of not graduating. Allensworth and
Easton (2007) linked even moderately poor attendance in ninth grade with eventual
dropout. In their study, only 63 percent of the students who missed about one week
eventually graduate within four years, compared to 87 percent of those who missed less
than one week. As an indicator, absenteeism may be considered a strong predictor of
course failure and eventual drop out.
Failure to be promoted to the next grade is also a key indicator of dropping out.
Alexander, et al. (1997) studied high school drop out and they concluded that 64 percent
of the students that repeated a grade in elementary school and 63 percent of the students
held back in middle school failed to earn a diploma. Once students enter high school,
failure to be promoted was directly connected to course failure. While high school

29
students may group in grade levels by age, students were promoted by the accumulation
of course credit. Failure to accumulate sufficient credit may have created a situation
where a student is identified by age as a tenth grader with ninth grade standing. Neild and
Balfanz (2006) determined that more than half of the dropouts are not promoted past the
ninth or tenth grade, but are 17 years old and older when they drop out. Consequently,
there was a strong connection between course failure and failure to promote students to
the next grade level that ultimately impacts a student's progress to graduation.
Disengagement from school is also considered a precursor to dropping out.
Students most often report school-related reasons for why they dropped out (Kennelly &
Monrad, 2007), including a lack of motivation, boredom, and unchallenging atmosphere,
and an overall lack of engagement in school. Research has indicated that the development
of smaller, personalized learning environments may lead to stronger student relationships
and students feeling a sense of relevance in their education (FeIner, et at., 2007). Students
who lack a personal connection with school begin to disengage from the educational
experience, and often experience academic failure (Finn, 1993). While disengagement
from school is a strong indicator of dropping out, it is not necessarily easy to measure.
Student attendance and discipline records as well as participation in co-curricular and
extra-curricular activities may provide some indication of a student's level of
engagement.
This review of literature on at-risk students identified the social and academic
factors that contribute to students dropping out school. Dropping out is a process that
may be influenced by the accumulation of risk factors. At-risk students may be identified

30
as early as the sixth grade. The strongest predictors, however, appear to be ninth grade
indicators. The development of an efficient identification system may facilitate the
implementation of effective interventions for drop out prevention. A current model used
to identify at-risk students transitioning from middle school to high school utilizes 12
independent indicators. The purpose of this study is to determine the efficacy of these 12
middle school academic risk indicators as predictors of ninth grade academic and
behavioral performance in a large, comprehensive high school.
31
CHAPTER III
METHODOLOGY
This study utilized a single case study design (Yin, 2003) with embedded
quantitative statistical analysis to understand the characteristics of transitioning students
who may have been at risk of school failure and the relationship between 12 middle
school indicators and three ninth grade performance measures. The case in this study
included 416 ninth grade students that matriculated from three middle schools to a large,
suburban high school. The high school collected middle school indicators to guide
development of interventions for struggling students using Freshmen Achievement
Teams to deliver a number of diverse program components. The analysis included
descriptive, correlation and multiple Ordinary Least Square (OLS) and logistic
regression.
Research Design
The initial analysis in this case study was to identify the characteristics of students
transitioning from middle school to high school based on 12 middle school performance
variables. Descriptive statistical analysis identified the number of students considered at
risk of school failure; how students performed on each indicator; and the characteristics
of at-risk and non-risk students. In addition, the middle school variables were organized
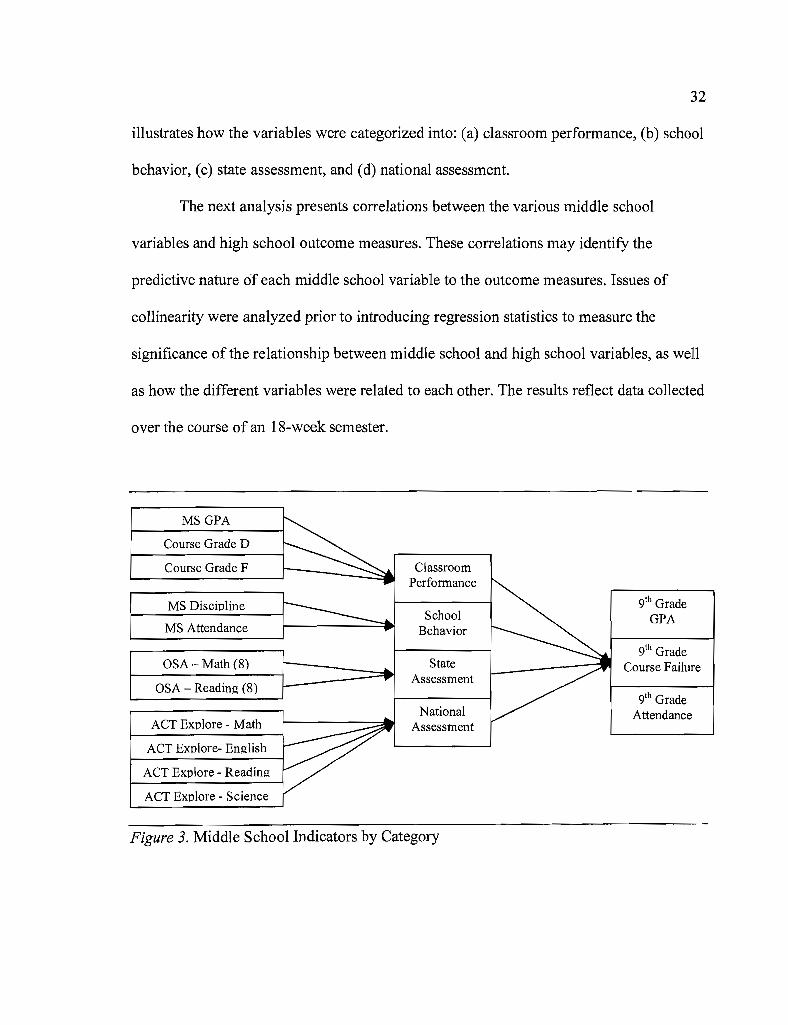
into categories and each category was evaluated by the outcome measures. Figure 3
32
illustrates how the variables were categorized into: (a) classroom performance, (b) school
behavior, (c) state assessment, and (d) national assessment.
The next analysis presents correlations between the various middle school
variables and high school outcome measures. These correlations may identify the
predictive nature of each middle school variable to the outcome measures. Issues of
collinearity were analyzed prior to introducing regression statistics to measure the
significance of the relationship between middle school and high school variables, as well
as how the different variables were related to each other. The results reflect data collected
over the course of an l8-week semester.
MSGPA
Course Grade D
Course Grade F
MS Discipline
MS Attendance
OSA - Math (8)
OSA - Reading (8)
ACT Explore - Math
ACT Explore- English
ACT Explore - Reading
ACT Explore - Science
ClassroomPerformance
SchoolBehavior
StateAssessment
NationalAssessment
9th GradeGPA
9th GradeCourse Failure
9th GradeAttendance
Figure 3. Middle School Indicators by Category
33
Setting
In this case study, I analyzed data collected from a large, suburban high school
located in the Pacific Northwest. The school was one of five high schools in a district that
serves an estimated 37,958 students, during the 2008-2009 school year. Of these students,
40 percent were considered to be an ethnic minority, speaking 90 different primary
languages. In addition, the rate of students receiving free or reduced lunch was 30.9
percent, and approximately 11.5 percent of the students qualified for special education
servIces.
The district had a strong record of academic excellence and innovation.
Approximately 57 percent of high school students completed the Scholastic Aptitude Test
for college admission with an average score of 1087, which was 39 points higher than the
state average and 70 points higher than the national average. The district's drop out rate
was relatively low at 3.6 percent. The district was recognized for its innovations, having
been selected to participate in the Harvard Executive School Leadership Program and
awarded grants from the US Department of Education for the creation of smaller learning
communities. In addition, Nike, Inc. awarded grants for the development of innovative
school leadership.
The high school in this study enrolled approximately 1875 students. The
demographics of the school identified 35 percent of the students as ethnic minority,
including 16 percent Asian-American, 16 percent Hispanic, and three percent African
American. Approximately 25 percent of the students received free or reduced lunch, and
15 percent qualified for special education services. In addition, 21 percent of the students

34
were designated as talented-and-gifted. For the past seven years, the school offered the
International Baccalaureate Diploma Program for college bound students. This program
was designed primarily for eleventh and twelfth grade students preparing for university.
Approximately 55 percent of the junior and senior classes participated in this program.
The most recent state report card rated this school strong overall.
The school benefited from the district's innovations; receiving approximately $1.4
million over five years in federal grant money to develop smaller learning communities
in the ninth and tenth grades. These funds were being used to develop structures, such as
teacher teams and academies, to personalize the learning experience for all students. Over
the past three years, the high school focused its school improvement goals on decreasing
the number of classes that ninth grade students fail each year. The freshmen failure rate
for the past four years averaged 31.5 percent. This reflects the percentage of students that
failed at least one semester course during the freshmen year. The 2006-2007 school year
was the highest rate for freshmen failure at 43 percent. Table 1 provides the percentage of
students that failed at least one semester course during the school year.
Table 1.
Freshmen Failure Rate - percentage ofstudents who failed at least one course during theninth grade year.
2004-05 2005-06 2006-07 2007-08
25 29 43 29
35
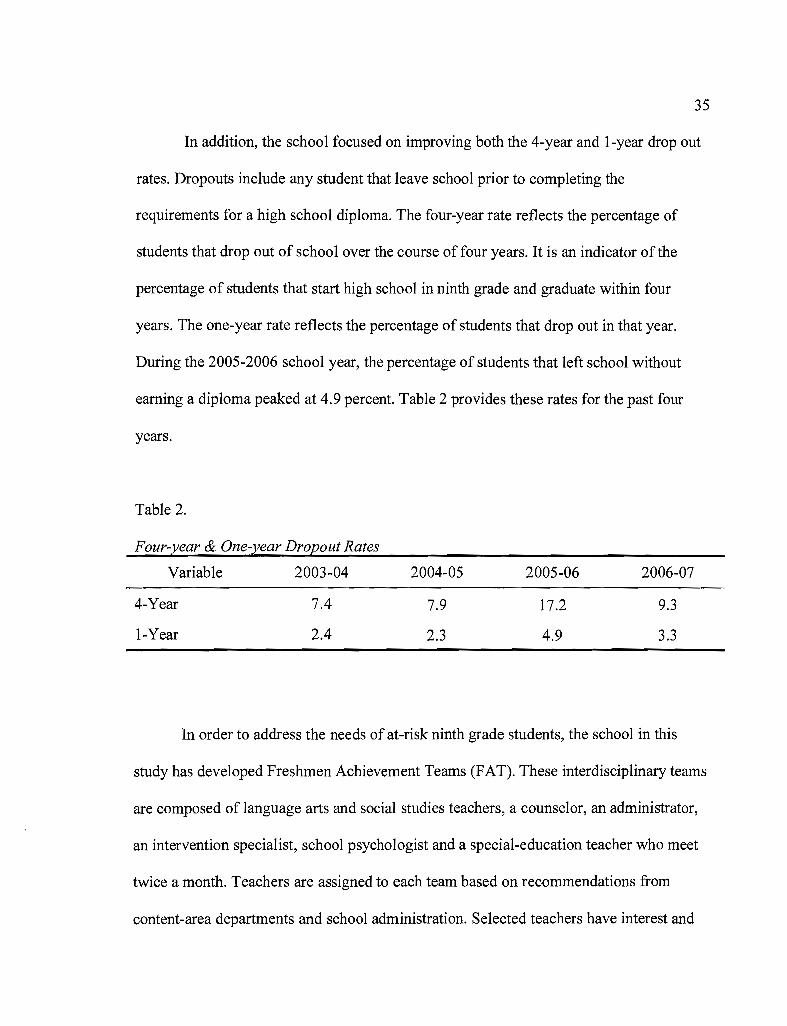
In addition, the school focused on improving both the 4-year and I-year drop out
rates. Dropouts include any student that leave school prior to completing the
requirements for a high school diploma. The four-year rate reflects the percentage of
students that drop out of school over the course of four years. It is an indicator of the
percentage of students that start high school in ninth grade and graduate within four
years. The one-year rate reflects the percentage of students that drop out in that year.
During the 2005-2006 school year, the percentage of students that left school without
earning a diploma peaked at 4.9 percent. Table 2 provides these rates for the past four
years.
Table 2.
Four-year & One-year Dropout Rates
Variable 2003-04 2004-05 2005-06 2006-07
4-Year
I-Year
7.4
2.4
7.9
2.3
17.2
4.9
9.3
3.3
In order to address the needs of at-risk ninth grade students, the school in this
study has developed Freshmen Achievement Teams (FAT). These interdisciplinary teams
are composed of language arts and social studies teachers, a counselor, an administrator,
an intervention specialist, school psychologist and a special-education teacher who meet
twice a month. Teachers are assigned to each team based on recommendations from
content-area departments and school administration. Selected teachers have interest and
36
experience in teaching ninth grade students. Teachers are provided with a shared
planning time during the school day and additional collaboration time during the summer
to plan and develop classroom-based interventions and instruction that support the FAT
model. Each team monitors the academic and social performance of approximately 75
ninth-grade students randomly assigned to the team for intervention.
FAT relies on 12 independent indicators of middle school performance to identify
at-risk students transitioning from middle school to high school. These 12 indicators are
categorized into four areas: classroom performance, school behavior, state assessments
and national assessments. Students are assessed on each indicator as either at-risk or
non-risk. Cut scores for each indicator are set by the school district. Students that are
considered at-risk or deficient on six or more of the indicators are considered to have an
overall risk status and may receive intervention to improve their academic and behavioral
performance. This model attempts to capture the complexity of risk factors in a flexible
and efficient system of identification.
Each team develops intervention plans for struggling students. These plans often
include a wide variety of interventions, ranging from classroom-based accommodations,
such as extended time on assignments or new seating in the classroom, to more targeted,
school-wide interventions, such as group counseling and specific literacy instruction.
Teams adjust the level of intervention along this continuum based on the student's level
of responsiveness. These interventions are organized into three tiers based on student
need and intensity of intervention.
37
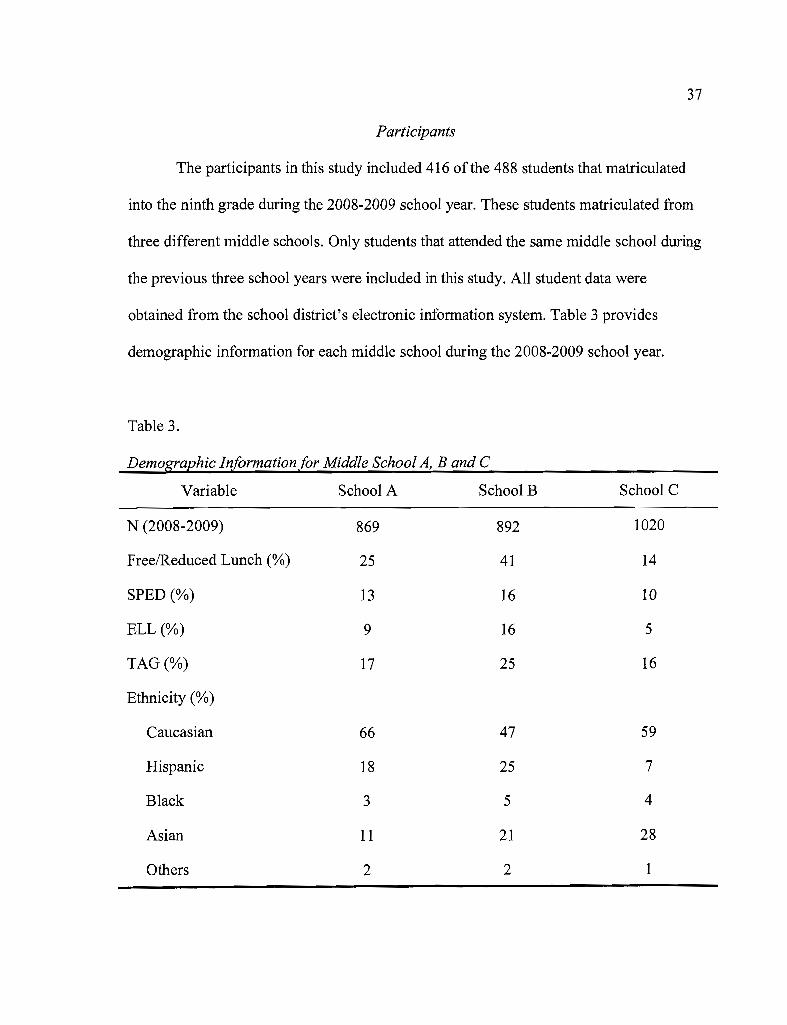
Participants
The participants in this study included 416 of the 488 students that matriculated
into the ninth grade during the 2008-2009 school year. These students matriculated from
three different middle schools. Only students that attended the same middle school during
the previous three school years were included in this study. All student data were
obtained from the school district's electronic information system. Table 3 provides
demographic information for each middle school during the 2008-2009 school year.
Table 3.
Demographic lnformationfor Middle School A, Band C
Variable School A School B School C
N (2008-2009) 869 892 1020
FreelReduced Lunch (%) 25 41 14
SPED (%) 13 16 10
ELL(%) 9 16 5
TAG (%) 17 25 16
Ethnicity (%)
Caucasian 66 47 59
Hispanic 18 25 7
Black 3 5 4
Asian 11 21 28
Others 2 2 1
38
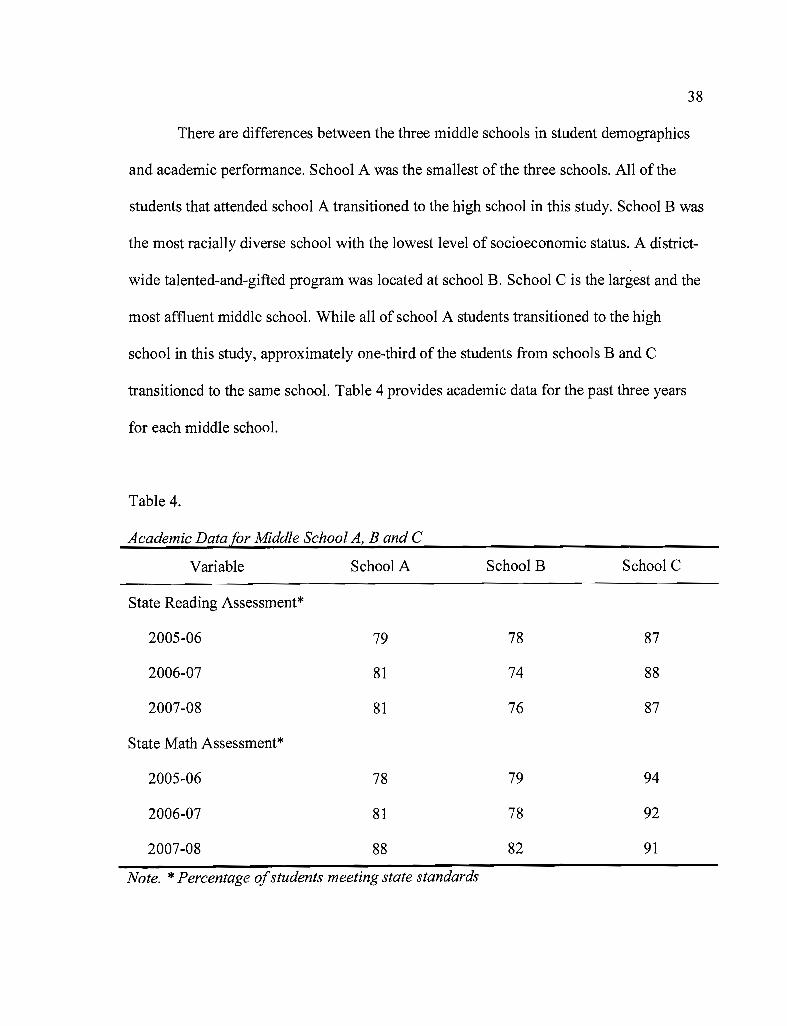
There are differences between the three middle schools in student demographics
and academic performance. School A was the smallest of the three schools. All of the
students that attended school A transitioned to the high school in this study. School B was
the most racially diverse school with the lowest level of socioeconomic status. A district-
wide talented-and-gifted program was located at school B. School C is the largest and the
most affluent middle school. While all of school A students transitioned to the high
school in this study, approximately one-third of the students from schools Band C
transitioned to the same school. Table 4 provides academic data for the past three years
for each middle school.
Table 4.
Academic Datafor Middle School A, Band C
Variable School A SchoolB School C
State Reading Assessment*
2005-06 79 78 87
2006-07 81 74 88
2007-08 81 76 87
State Math Assessment*
2005-06 78 79 94
2006-07 81 78 92
2007-08 88 82 91
Note. * Percentage ofstudents meeting state standards

39
Measures
The high school in this case study utilized 12 indicators of middle school
performance to identify students that struggled in the ninth grade and are at risk of school
drop out. Developed by the school district, this List ofIncoming Transition Students At
Risk (LITSAR) identified the most at-risk students based on: the student's grade-point
average, the number of D and F grades, the number of suspensions and expulsions,
attendance rate, scores on the four ACT Explore exams, and scores on state assessments
in reading and math. A cut score was set for each middle school indicator, and a student
received a point on an at-risk index for each indicator that was deficient. Students who
performed below expectation on six or more of the 12 indicators were considered to be
possibly at-risk for school failure. These students were monitored by the school and
received academic and behavior intervention to improve performance. The relationship
between these 12 indicators to ninth grade attendance rate, grade-point-average, and
course completion was examined.
Independent Variables
The independent variables in this study included the 12 middle school indicators
used to identify students entering high school who may be at risk of school failure. The
middle school indicators were grade-point-average, grade F, grade D, suspension,
expulsion, attendance, Oregon's Assessments of Knowledge and Skills math, Oregon's
Assessments of Knowledge and Skills reading, ACT Explore math, ACT Explore
English, ACT Explore reading, and ACT Explore science.
40
Middle school grade-paint-average was used as an indicator of students'
classroom performance. GPA was unweighted and based on a 4-point scale with A's
assigned 4 points, B's assigned 3 points, C's assigned 2 points, D's assigned 1 point, and
F's assigned 0 points. Any other course grade was not included. Such grade indices may
include pass, no pass, satisfactory, unsatisfactory, and incomplete, etc. The range of
student GPA was from 0.00 to 4.00. According to the school's at-risk index, a cumulative
GPA below 2.20 was considered at-risk. Grade-point-average was a continuous variable,
and its distribution in this study was negatively skewed. Student grade-point-average was
obtained from the school district's Electronic Student Information System.
Middle school grade F was an indicator of students' classroom performance. It
reflected the number of courses during a grading period that a student failed to make
adequate academic progress. This was a count variable. For each course that was failed, a
student was given a point. According to the school's at-risk index, one grade F in any
course during the three years of middle school was considered at-risk. Grade F was a
continuous count variable. It had a zero-inflated flat distribution, and it was limited by
few valid cases. Students' grade F was obtained from the school district's Electronic
Student Information System.
Middle school grade D was an indicator of students' classroom performance. It
reflected the number of courses during a grading period that a student made low progress
and was in danger of failing. This was a count variable. A student received one point for
each course with a grade D. One grade D in any course during middle school was
considered at-risk on the district's index. Grade D was a continuous count variable. It
41
also had a zero-inflated flat distribution with few valid cases. Student grade D was
obtained from the school district's Electronic Student Information System.
Suspension was an indicator of a student's behavior. It was the number of
occurrences that a student was removed from school as a disciplinary action. Students
were suspended from school for a wide variety of disciplinary issues, including but not
limited to poor attendance, defiance of authority, fighting, possession of illegal drugs or
alcohol, and cheating. The length of a suspension ranged from one to ten days.
Regardless of length, each occurrence was counted as one in this study. One occurrence
of suspension was counted as at-risk on the school's index. Suspension was a continuous
count variable and its distribution was binary. Student suspension was obtained from the
school district's Electronic Student Information System.
Expulsion was the number of occurrences that a student was removed from school
for longer than ten days for a disciplinary reason. Expulsion was a more severe
disciplinary action than a suspension, ranging in length from 11 days to a full calendar
year. Issues that lead to an expulsion included: fighting, possession of drugs or alcohol,
or possession of a weapon. Each occurrence ofexpulsion was counted as one. One
occurrence of expulsion was counted as at-risk on the school's index. Expulsion was a
continuous count variable, and its distribution was limited by too few cases. Student
expulsion was obtained from the school district's Electronic Student Information System.
Middle school attendance rate was an indicator of student behavior. It was
measured as either present, absent excused, or absent non-excused. Student absences
were considered excused in the event of illness or family emergency. Absence due to any
42
other reason was considered non-excused. An attendance rate below 90 percent was
considered at-risk on the school's index. This equated to 18 or more missed days from
school. Attendance rate was a continuous ratio variable and its distribution was
negatively skewed. Student attendance rates were obtained from the school district's
Electronic Student Information System.
Oregon's Assessments of Knowledge and Skills (OAKS) was part of the state's
school accountability program. It assessed students in grades three through eight and
grade ten in reading, writing, mathematics, and science. Student scores on the
assessments were deemed as either does not meet, meet or exceed based on cut scores set
for each grade level. Student scores were a component of the states rating of each school
and were used to fulfill the accountability requirements of the federal No Child Left
Behind legislation. Student scores on the eighth grade math and reading assessments
were independent measures in this study.
OAKS - Math was an indicator of a student's academic achievement. The cut
score for meeting the state standard was 230. A student score below this level was
considered at-risk on the school's index. OAKS Math was a continuous interval variable
with a normal distribution. Student assessment results were obtained from the school
district's Electronic Student Information System.
OAKS - Reading was an indicator ofa student's academic achievement. The cut
score for meeting the state standard was 231. A student score below this level was
considered at-risk on the school's index. OAKS_Reading was a continuous interval
43
variable with a normal distribution. Student assessment results were obtained from the
school district's Electronic Student Information System.
ACT Explore was a national assessment program that assesses eighth and ninth
grade students in English, mathematics, reading and science. These assessments provided
information about how well a student performed compared to other students. Explore was
part oflarger assessment program that included ACT Plan for tenth graders and the ACT
for eleventh graders. Many universities accept the ACT as a college admissions criterion.
Explore, Plan and ACT were scored along a common scale extending from one to 36.
The maximum score on the Explore was 25 (ACT, 2007). The school district used the full
ACT assessment program to assess all students in grade eight through eleven. ACT
Explore assessments in math, English, reading and science were independent measures in
this study.
ACT Explore - Math was an indicator of a student's academic achievement. The
cut score for meeting the "college ready" level was 17. A student score below this level
was considered at-risk on the school's index. ACT Math was a continuous interval
variable with a normal distribution. Student assessment results were obtained from the
school district's Electronic Student Information System.
ACT Explore - English was an indicator of a student's academic achievement.
The cut score for meeting the "college ready" level was 13. A student score below this
level was considered at-risk on the school's index. ACT_English was a continuous
interval variable with a normal distribution. Student assessment results were obtained
from the school district's Electronic Student Information System.
44
ACT Explore - Reading was an indicator of a student's academic achievement.
The cut score for meeting the "college ready" level was 15. A student score below this
level was considered at-risk on the school's index. ACT_Reading was a continuous
interval variable with a normal distribution. Student assessment results were obtained
from the school district's Electronic Student Information System.
ACT Explore - Science was an indicator of a student's academic achievement.
The cut score for meeting the "college ready" level was 20. A student score below this
level was considered at-risk on the school's index. ACT Science was a continuous
interval variable with a normal distribution. Student assessment results were obtained
from the school district's Electronic Student Information System.
Dependent Variables
The dependent measures in this study were ninth grade attendance rates, grade
point-averages, and course completion. These three measures have been identified as
strong predictors of dropping out of school (Allensworth & Easton, 2007; Neild &
Balfanz, 2006; Kennelly & Monrad, 2007).
Ninth grade attendance rates were used as a measure of a student's school
behavior and engagement. Student attendance rates were measured as either present,
absent excused, or absent non-excused. Student absences are considered excused in the
event of illness or family emergency. Absence due to any other reason is considered non
excused. Attendance rates were continuous ratio variable with a negatively skewed
distribution. Student attendance rates were obtained from the school district's Electronic
Student Information System.
45
Ninth grade grade-point-average was used as a measure of students' academic
performance. GPA was un-weighted and based on a 4-point scale with A's assigned 4
points, B's assigned 3 points, C's assigned 2 points, D's assigned 1 point, and F's assigned
opoints. Any other course grade was not included. Such grade indices may have included
pass, no pass, satisfactory, unsatisfactory, and incomplete, etc. The range of student GPA
was from 0.00 to 4.00. The GPA inchided all course work completed through the first
semester of a student's ninth grade year. GPA was a continuous variable with a negatively
skewed distribution. Students'GPA's were provide by the school district's Electronic
Student Information System.
. Ninth grade course completion was used as a measure of students' academic
performance and students' progress towards graduation. Students enrolled in seven
courses each semester; 14 courses over the academic year. Each semester course was
worth 0.5 credit. Students could earn a total of seven credits in an academic year.
Students were required to earn 24 credits to receive a high school diploma. A student
must earn three credits, or pass six out of seven courses, after the first semester of 9th
grade to be considered on-track for graduation. Each failed semester course was given a
value of 1, and each course that received a passing grade was given a value of O. Grade F
was a continuous count variable. Its distribution was limited by too few cases. Students'
course credits were obtained from the school district's Electronic Student Information
System.
46
Procedures
With the assistance of the school district, I collected extant data accessed through
archival databases maintained by the school district. These data included individual
student grade-point-average, course completion, and attendance records from the
district's Electronic Student Information System. In addition, data on the 12 indicators of
middle school performance were collected and analyzed. Only students with data from all
12 indicators and all three of the outcome measures were included in this study. These
data sets were merged through the use of Microsoft Access and Excel and later analyzed
with SPSS 17.0. To maintain confidentiality, any identifying student information was
removed prior to researcher access. A form of passive consent was used to gain student
participation. Parents were informed by mail and had the option to exclude their student
from the study.
In the first analysis, descriptive statistics were used to analyze each middle school
indicator and the characteristics of at-risk and non-risk students. The second analysis
involved correlation statistics to evaluate the correlations between each middle school
indicator and each ninth grade performance measure. In addition, issues of collinearity
were examined. Finally, multiple Ordinary Least Square (OLS) and logistic regression
analysis were applied to the middle school risk indicators and the ninth grade outcome
measures to identify the strongest predictors of ninth grade performance.

47
CHAPTER IV
RESULTS
The results of this study reveal that few students entered the ninth grade with risk
indicators. Over half of the students transitioned to ninth grade with two or fewer risk
indicators. A sizeable number of students, however, were at risk, and these students were
disproportionately minority, English-Language-Leaner, or Special Education students.
There were significant differences between students identified as at-risk with six or more
indicators and non-risk students who had five or fewer indicators. The most significant
differences were in classroom performance. Classroom performance indicators,
specifically grade D, identified dramatic differences in course failure and ninth grade
grade-point-average. Although classroom performance indicators were key predictors,
students struggled more on national assessments than on any other indicator. Finally, the
results of this study suggest that four middle school indicators were strong predictors of
ninth grade performance. These indicators included grade-point-average, grade D,
attendance, and ACT math.
Results are presented in two parts. First, analyses are provided on the
characteristics of middle school risk indicators. Descriptive statistical analyses were
applied to the raw data for all variables. Second, analyses exploring the relationship
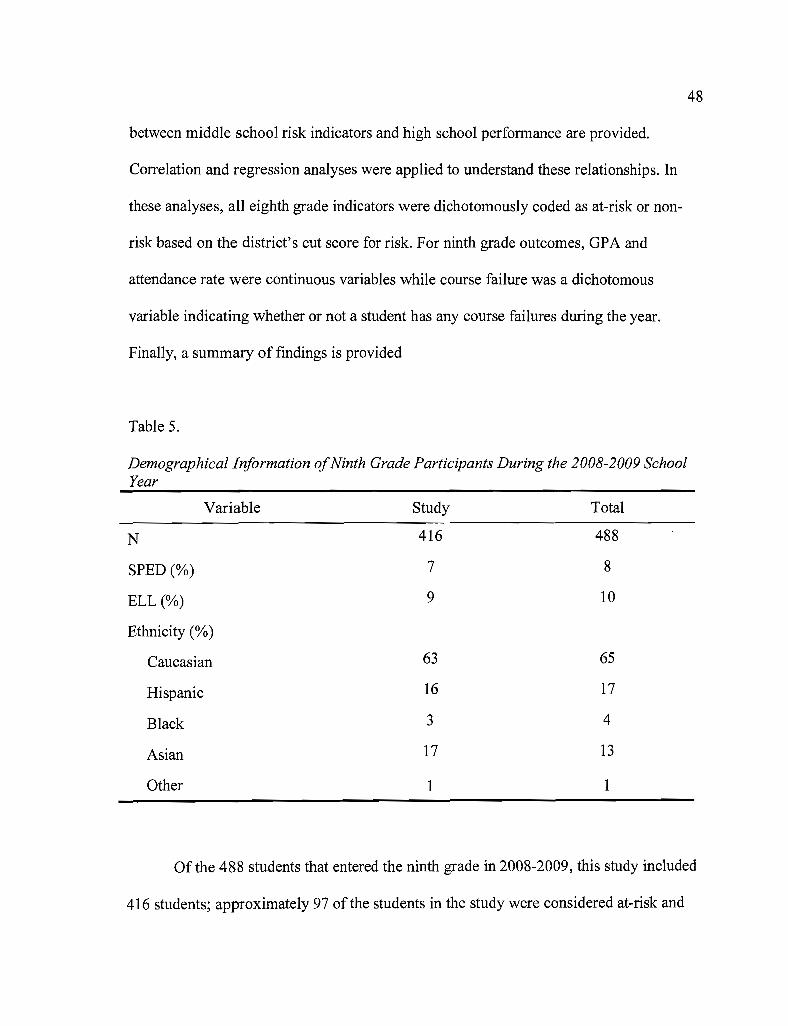
48
between middle school risk indicators and high school performance are provided.
Correlation and regression analyses were applied to understand these relationships. In
these analyses, all eighth grade indicators were dichotomously coded as at-risk or non-
risk based on the district's cut score for risk. For ninth grade outcomes, GPA and
attendance rate were continuous variables while course failure was a dichotomous
variable indicating whether or not a student has any course failures during the year.
Finally, a summary of findings is provided
Table 5.
Demographicallnjormation ojNinth Grade Participants During the 2008-2009 SchoolYear
Variable
N
SPED (%)
ELL(%)
Ethnicity (%)
Caucasian
Hispanic
Black
Asian
Other
Study
416
7
9
63
16
3
17
1
Total
488
8
10
65
17
4
13
1
Of the 488 students that entered the ninth grade in 2008-2009, this study included
416 students; approximately 97 of the students in the study were considered at-risk and

49
supported through the school's intervention program. These students attended the same
three middle schools for the previous three years, and they completed all academic
assessments that were included in this study. The demographic composition of this study
closely reflects the demographics of all students in the ninth grade. Table 5 provides
demographical information of the participants.
How Many Students Are Considered At-Risk?
The first consideration is the overall risk status of students in the study.
Descriptive analysis of middle school risk indicators reveals that 18.8 percent of the
students entered high school with zero risk indicators and 0.2 percent of the students
possessed all 12 risk indicators. These suggest that 78 students in this study exceeded the
performance expectations on all 12 indicators and were not at risk of school failure. On
the other hand, only one student in this sample did not meet the cut score on any of the 12
indicators and may be deemed highly at risk. Table 6 presents the number students by the
number of indicators on the at-risk index. The table indicates 319 students, or 81.3
percent, have scores below six and are not considered at risk The remaining 97 students,
or 25.3 percent, have six or more indicators on the index and are deemed as at-risk of
dropping out. The majority of students, 51.7 percent, have two or fewer risk indicators.
The average number of risks on 12 indicators for all students is 3.35.

50
Table 6.
Students by Number ofMiddle School Risk Indicators
# of Indicators # of Students Percentage Cumulative %
o1
2
3
4
5
6
7
8
9
10
11
12
78
74
63
44
31
29
19
19
14
22
16
6
1
18.8
17.8
15.1
10.6
7.5
7.0
4.6
4.6
3.4
5.3
3.8
1.4
0.2
18.8
36.5
51.7
62.3
69.7
76.7
81.3
85.8
89.2
94.5
98.3
99.8
100
Demographical information provided in Table 7 reveals that the at-risk group, or
students with six or more indicators, was predominately male (60.82%) and composed of
a higher percentage of Special Education (19.59%) and English Language Learner
(35.05%) students than the non-risk group. The at-risk group was predominately Hispanic
(46.39%) and African-American (9.28%). These averages, with the exception of male,
were more than three times higher than the total group average for these sub-groups. This
suggested that male and ethnic minority students are more likely to be at risk for school
failure when entering high school than other students. In addition, Special Education
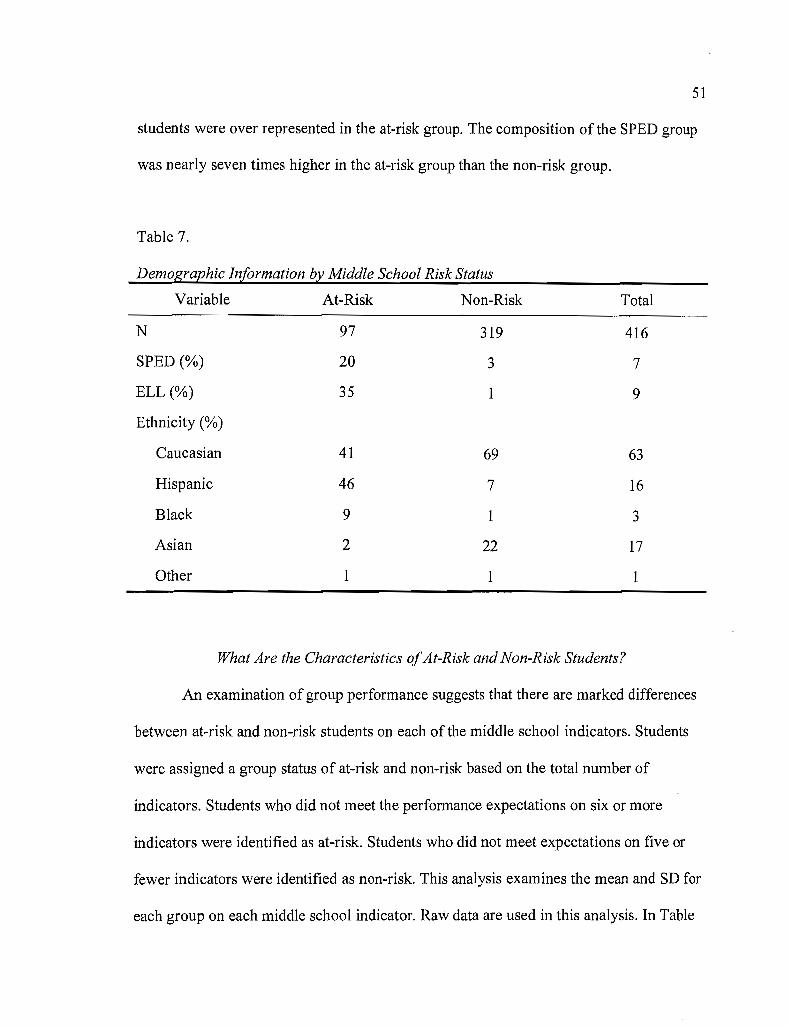
51
students were over represented in the at-risk group. The composition of the SPED group
was nearly seven times higher in the at-risk group than the non-risk group.
Table 7.
Demographic Information by Middle School Risk Status
Variable At-Risk Non-Risk Total
N 97 319 416
SPED (%) 20 3 7
ELL(%) 35 9
Ethnicity (%)
Caucasian 41 69 63
Hispanic 46 7 16
Black 9 1 3
Asian 2 22 17
Other 1 1
What Are the Characteristics ofAt-Risk and Non-Risk Students?
An examination of group performance suggests that there are marked differences
between at-risk and non-risk students on each of the middle school indicators. Students
were assigned a group status of at-risk and non-risk based on the total number of
indicators. Students who did not meet the performance expectations on six or more
indicators were identified as at-risk. Students who did not meet expectations on five or
fewer indicators were identified as non-risk. This analysis examines the mean and SD for
each group on each middle school indicator. Raw data are used in this analysis. In Table
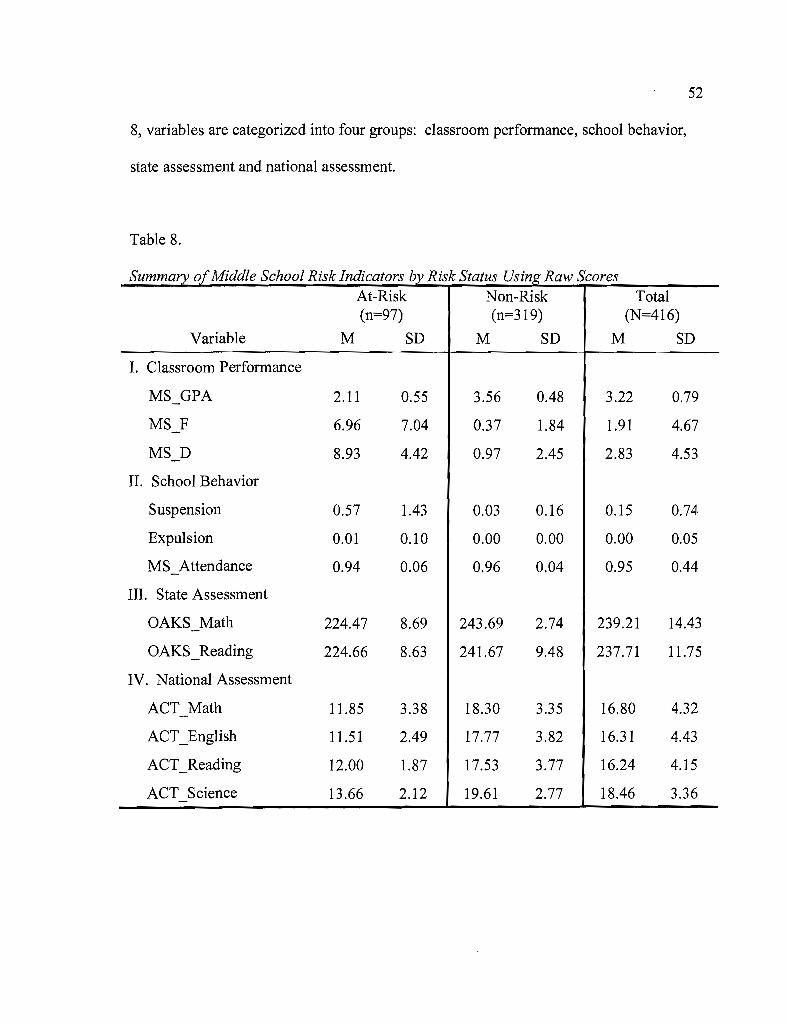
8, variables are categorized into four groups: classroom perfonnance, school behavior,
state assessment and national assessment.
52
Table 8.
Summary ofMiddle School Risk Indicators by Risk Status Using Raw ScoresAt-Risk Non-Risk Total(n=97) (n=319) (N=416)
Variable M SD M SD M SD
1. Classroom Perfonnance
MS GPA 2.11 0.55 3.56 0.48 3.22 0.79
MS F 6.96 7.04 0.37 1.84 1.91 4.67
MS D 8.93 4.42 0.97 2.45 2.83 4.53
II. School Behavior
Suspension 0.57 1.43 0.03 0.16 0.15 0.74
Expulsion 0.01 0.10 0.00 0.00 0.00 0.05
MS Attendance 0.94 0.06 0.96 0.04 0.95 0.44
III. State Assessment
OAKS Math 224.47 8.69 243.69 2.74 239.21 14.43
OAKS Reading 224.66 8.63 241.67 9.48 237.71 11.75
IV. National Assessment
ACT Math 11.85 3.38 18.30 3.35 16.80 4.32
ACT_English 11.51 2.49 17.77 3.82 16.31 4.43
ACT_Reading 12.00 1.87 17.53 3.77 16.24 4.15
ACT Science 13.66 2.12 19.61 2.77 18.46 3.36
53
Classroom performance indicators were direct measures of student performance
on classroom assessments. These indicators included grade-point-average, grade D, and
grade F. There were large discrepancies between at-risk and non-risk students on all three
indicators. Non-risk students had an average of 3.56 on MS_GPA and at-risk students
had an average of 2.11. In practical terms, this difference of 1.45 points between the two
groups represented a full grade and a half difference in performance. In addition, at-risk
students averaged 18 times more F grades, 6.96 to 0.37, and nearly nine times more D
grades, 8.93 to 2.45, in middle school than non-risk students. Over the course of three
years in middle school, the average at-risk student failed 2.33 trimester courses and
received three grades ofD each year.
Similar differences between the two groups appeared in school behavior,
particularly in school discipline. At-risk students were 19 times more likely to have been
suspended or expelled from school for a disciplinary issue than non-risk students. Each
suspension and expulsion represents misbehavior that interferes with the learning
environment. Suspended and expelled students lost instructional time from school and
contributed to a student's absenteeism. While at-risk students received 19 times more
suspensions from school than non-risk students, attendance rates were rather similar
between the two groups. At-risk students attended school 94 percent of the time, and non
risk students attended 96 percent of the time. The difference is within a standard
deviation and equates essentially to less than four days over the course of the school year.
On state and national assessments, there was consistently a large discrepancy
between the two groups, greater than one standard deviation. At-risk students averaged

54
224.47 on state math assessments (OAKS_Math) and 224.66 on state reading
assessments (OAKS_Reading). In comparison, non-risk students averaged 243.69 on
math and 241.67 on reading. The ACT Explore Assessment indicated similar differences
with the largest occurring on the math assessment (ACT_Math) at 6.45 points. This was a
difference ofnearly 1.5 SD. The narrowest margin of difference was 5.53 points on the
reading assessment, a full standard deviation difference. Such differences between the
two groups suggest the need to analyze ninth grade performance.
How Do At-Risk Ninth Graders Perform on Each Middle School Indicator?
An analysis of ninth grade performance by each middle school indicator suggests
that group differences persist into the ninth grade. While previous analyses examined
overall risk status, this analysis will examine students at risk on each middle school
indicator. Students were identified based on performance expectations as at-risk or non
risk on each middle school indicator. The 12 risk indicators were grouped into four
general categories, including (a) classroom performance, (b) school behavior, (c) state
assessment, and (d) national assessment.
The first category includes measures of academic performance in the classroom,
such as grade-paint-average, grades ofF, and grades ofD. Table 9 suggests that there is a
marked difference between at-risk and non-risk ninth graders. Of the 416 students in this
study, 59 entered high school with a middle school grade-point-average below a 2.20.
These students faired poorly on all three ninth grade measures compared to other
students. Students with low grade-point-averages attended school less often, failed nine
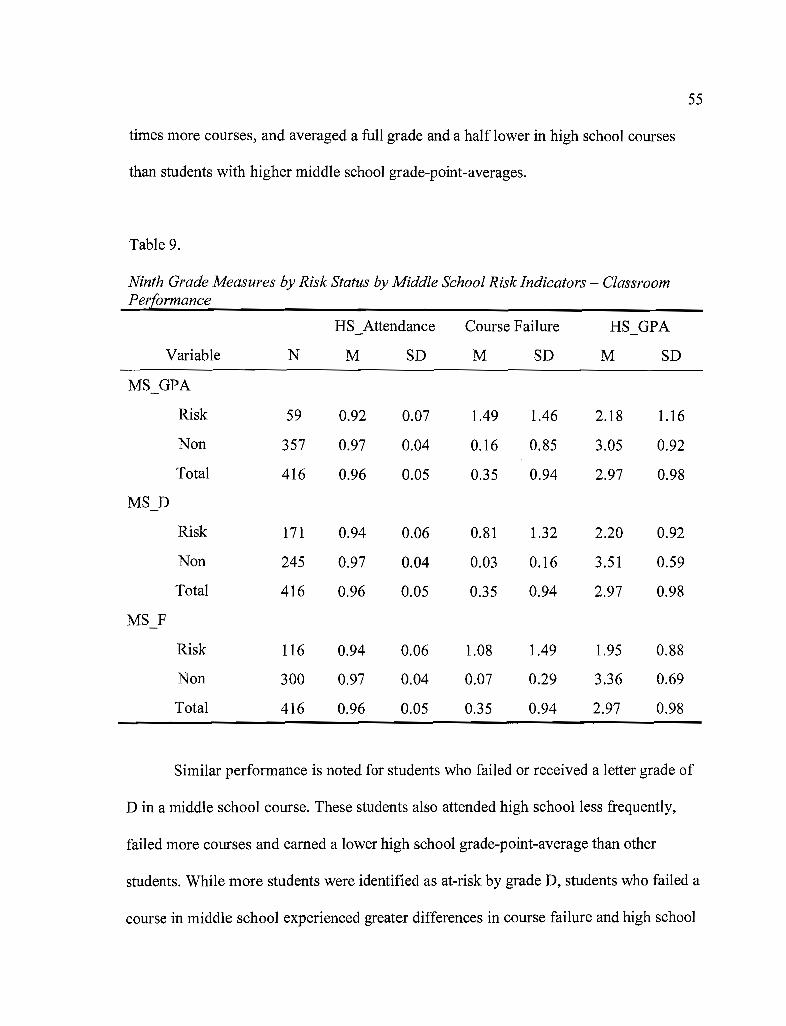
55
times more courses, and averaged a full grade and a half lower in high school courses
than students with higher middle school grade-paint-averages.
Table 9.
Ninth Grade Measures by Risk Status by Middle School Risk Indicators - ClassroomPerfOrmance
HS Attendance Course Failure HS GPA
Variable N M SD M SD M SD
MS GPA
Risk 59 0.92 0.07 1,49 1.46 2.18 1.16
Non 357 0.97 0.04 0.16 0.85 3.05 0.92
Total 416 0.96 0.05 0.35 0.94 2.97 0.98
MS D
Risk 171 0.94 0.06 0.81 1.32 2.20 0.92
Non 245 0.97 0.04 0.03 0.16 3.51 0.59
Total 416 0.96 0.05 0.35 0.94 2.97 0.98
MS F
Risk 116 0.94 0.06 1.08 1.49 1.95 0.88
Non 300 0.97 0.04 0.07 0.29 3.36 0.69
Total 416 0.96 0.05 0.35 0.94 2.97 0.98
Similar performance is noted for students who failed or received a letter grade of
D in a middle school course. These students also attended high school less frequently,
failed more courses and earned a lower high school grade-paint-average than other
students. While more students were identified as at-risk by grade D, students who failed a
course in middle school experienced greater differences in course failure and high school
56
grade-paint-average. They were 15 times more likely to fail during the first semester of
high school, and they earned nearly a full grade and a half lower overall. In addition,
students who failed a course performed equally as well as students with a letter grade of
D on high school attendance. The suggestion is that marginally performing middle school
students struggle nearly as much as students who failed on all three high school measures
compared to other students.
The second category includes measures of school behavior, such as attendance
rates, suspension, and expulsion. Using Table 10, it is not surprising that students with
poor middle school attendance also have poor high school attendance rates. Of the 40
students that had middle school attendance rates below 90 percent, their high school
attendance rate was 87.5 percent; a full ten percentage points lower than the average of
other students. In addition, non-attendance may have impacted course completion rates
and high school grade-paint-averages as non-attending students failed over twice as many
courses and earned a full grade below other students.
There are differences between student who received suspension or expulsions and
students who did not. Eight percent of the students in this study were suspended from
school at least once from middle school for disciplinary reasons. These students missed
between one and ten days of class instruction. In addition, one student was expelled from
school for more than ten days. Suspended and expelled students failed over five times
more classes and earned a full grade lower, on average, than other students. Suspended
students failed 1.3 courses during middle school while non-suspended students failed a
mere 0.26 courses. In addition, suspended students earned a 1.814 grade-paint-average,

57
which is considerably lower than non-suspended students who earned a 3.084 average.
There was also a marginal difference in attendance rates of a mere three percentage
points between the two groups. Suspended students attended nearly 94 percent of the time
while non-suspended students attended nearly 97 percent.
Table 10.
Ninth Grade Measures by Risk Status by Middle School Risk Indicators -School Behavior
HS Attendance Course Failure HS GPA
Variable N M SD M SD M SD
MS Attendance
Risk 40 .875 .103 .83 1.466 2.189 1.168
Non 376 .974 .038 .30 .856 3.058 .928
Total 416 .964 .056 .35 .943 2.974 .986
Suspension
Risk 36 .937 .078 1.31 1.527 1.814 .942
Non 380 .966 .053 .26 .814 3.084 .918
Total 416 .964 .056 .35 .943 2.974 .986
Expulsion
Risk 1 .849 .00 2.000
Non 415 .964 .055 .35 .944 2.976 .986
Total 416 .964 .056 .35 .943 2.974 .986
The third category of variables includes measures from OAKS in eighth grade
math and reading. As indicated on Table 11, there are marginal differences between at-
risk and non-risk students in high school attendance based on either indicator. Both
indicators, however, suggest marked differences between at-risk and non-risk on course

58
failure and high school grade-paint-average. Using either math or reading as a risk
indicator, at-risk students failed, on average, seven times more courses than other
students, and earned a full grade lower on average. Unlike the school behavior indicators,
which identified very few students as at risk, approximately one in four students had
either math or reading as a risk indicator. Slightly more students, 26 percent as opposed
to 24 percent, struggled with reading than math.
Table 11.
Ninth Grade Measures by Risk Status by Middle School Risk Indicators - StateAssessment
HS Attendance Course Failure HS GPA
Variable N M SD M SD M SD
OAKS Math
Risk 101 .947 .073 1.00 1.549 2.028 .967
Non 315 .969 .048 .14 .481 3.277 .779
Total 416 .964 .056 .35 .943 2.974 .986
OAKS_Reading
Risk 109 .951 .067 .96 1.509 2.119 1.030
Non 307 .969 .050 .13 .470 3.277 .769
Total 416 .964 .056 .35 .943 2.974 .986
The final category includes the sub-tests of the ACT Explore assessment for
eighth grade students. This nationally nann-referenced assessment includes four sub-
tests: math, English, reading and science. As with the state assessments, there was a
marginal difference across all four assessments between risk and non-risk students in

59
high school attendance. There was a fairly consistent pattern in course failure and high
school average. Specifically, at-risk students failed far more courses and earned much
lower grade-point-average than non-risk students. In addition, it is important to note the
number of students identified as at-risk by each assessments. Using Table 12, more
students were identified as at-risk by these indicators than by any other. Approximately
39 percent of all students were identified by the ACT math assessment, and the ACT
reading assessment identified another 45 percent as at risk for school failure. An
astonishing 67 percent of all students were identified by the ACT science assessment as
at-risk.
How Does Each Eighth Grade Indicator Correlate to Ninth Grade Performance?
A high linear correlation between the 12 middle school risk indicators and the
three high school measures may provide greater understanding to the predictive value of
each indicator. Using Table 13, which provides correlation results for this study, a high
correlations exists between MS_F and MS_D (r=.723, p<.OOl) and MS_F and MS_GPA
(r=.654, p<.OOl). This suggests that a collinearity issue exist between MS_F and the two
variables. An analysis of collinearity statistics for these indicator variables was
conducted, and it confirmed that MS_F had a multi-collinearity problem
(Tolerance=.339). Sager and Brown (1994) have suggested that two variables with a high
correlation value may be too closely related to provide useful information, and one of the
variables should be dropped from the analysis. Given the high correlation between MS_F
and other variables, MS_F was dropped from further analyses.
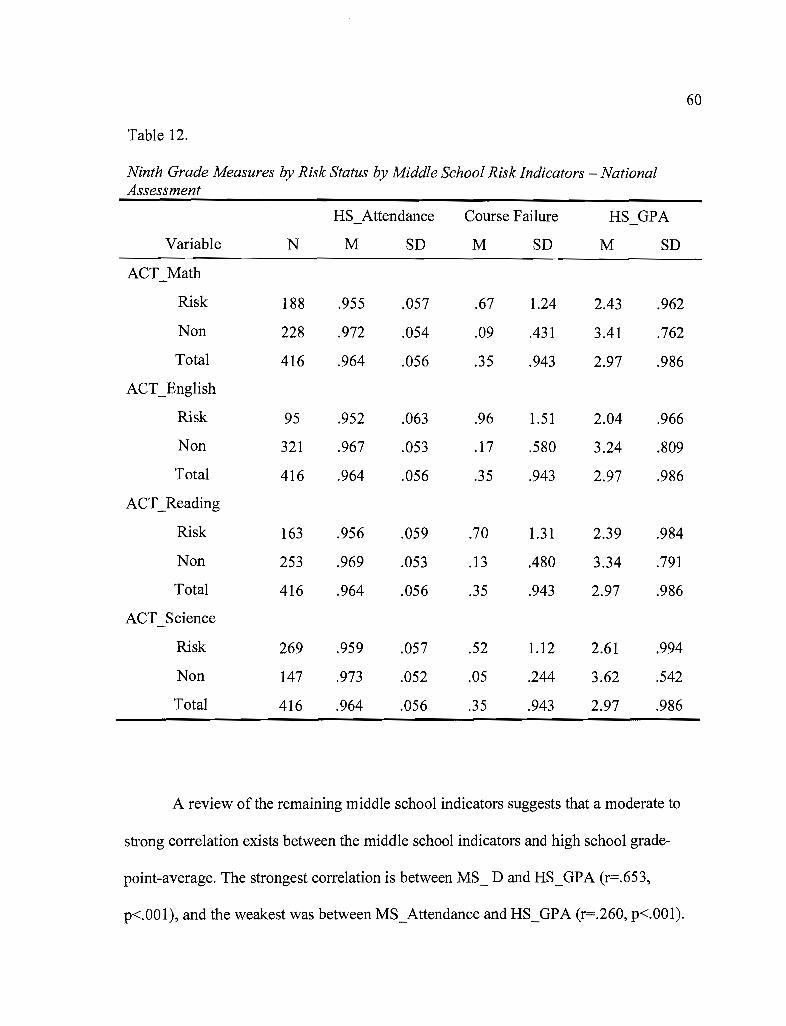
60
Table 12.
Ninth Grade Measures by Risk Status by Middle School Risk Indicators - NationalAssessment
HS Attendance Course Failure HS GPA
Variable N M SD M SD M SD
ACT Math
Risk 188 .955 .057 .67 1.24 2.43 .962
Non 228 .972 .054 .09 .431 3.41 .762
Total 416 .964 .056 .35 .943 2.97 .986
ACT_English
Risk 95 .952 .063 .96 1.51 2.04 .966
Non 321 .967 .053 .17 .580 3.24 .809
Total 416 .964 .056 .35 .943 2.97 .986
ACT_Reading
Risk 163 .956 .059 .70 1.31 2.39 .984
Non 253 .969 .053 .13 .480 3.34 .791
Total 416 .964 .056 .35 .943 2.97 .986
ACT Science
Risk 269 .959 .057 .52 1.12 2.61 .994
Non 147 .973 .052 .05 .244 3.62 .542
Total 416 .964 .056 .35 .943 2.97 .986
A review of the remaining middle school indicators suggests that a moderate to
strong correlation exists between the middle school indicators and high school grade-
point-average. The strongest correlation is between MS_ D and HS_GPA (r=.653,
p<.OOl), and the weakest was between MS_Attendance and HS_GPA (r=.260, p<.OOl).
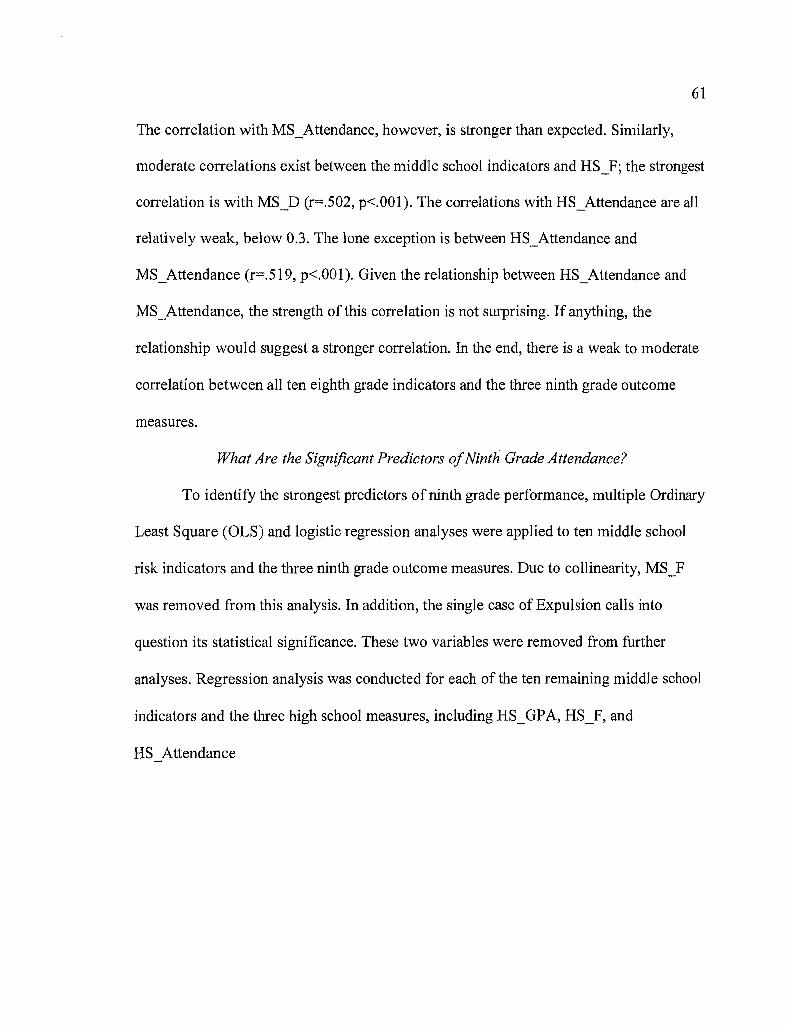
61
The correlation with MS_Attendance, however, is stronger than expected. Similarly,
moderate correlations exist between the middle school indicators and HS_F; the strongest
correlation is with MS_D (r:o:.502, p<.OOl). The correlations with HS_Attendance are all
relatively weak, below 0.3. The lone exception is between HS_Attendance and
MS_Attendance (r=.519, p<.OO 1). Given the relationship between HS_Attendance and
MS_Attendance, the strength of this correlation is not surprising. If anything, the
relationship would suggest a stronger correlation. In the end, there is a weak to moderate
correlation between all ten eighth grade indicators and the three ninth grade outcome
measures.
What Are the Significant Predictors a/Ninth Grade Attendance?
To identify the strongest predictors of ninth grade performance, multiple Ordinary
Least Square (OLS) and logistic regression analyses were applied to ten middle school
risk indicators and the three ninth grade outcome measures. Due to collinearity, MS_F
was removed from this analysis. In addition, the single case of Expulsion calls into
question its statistical significance. These two variables were removed from further
analyses. Regression analysis was conducted for each of the ten remaining middle school
indicators and the three high school measures, including HS_GPA, HS_F, and
HS Attendance
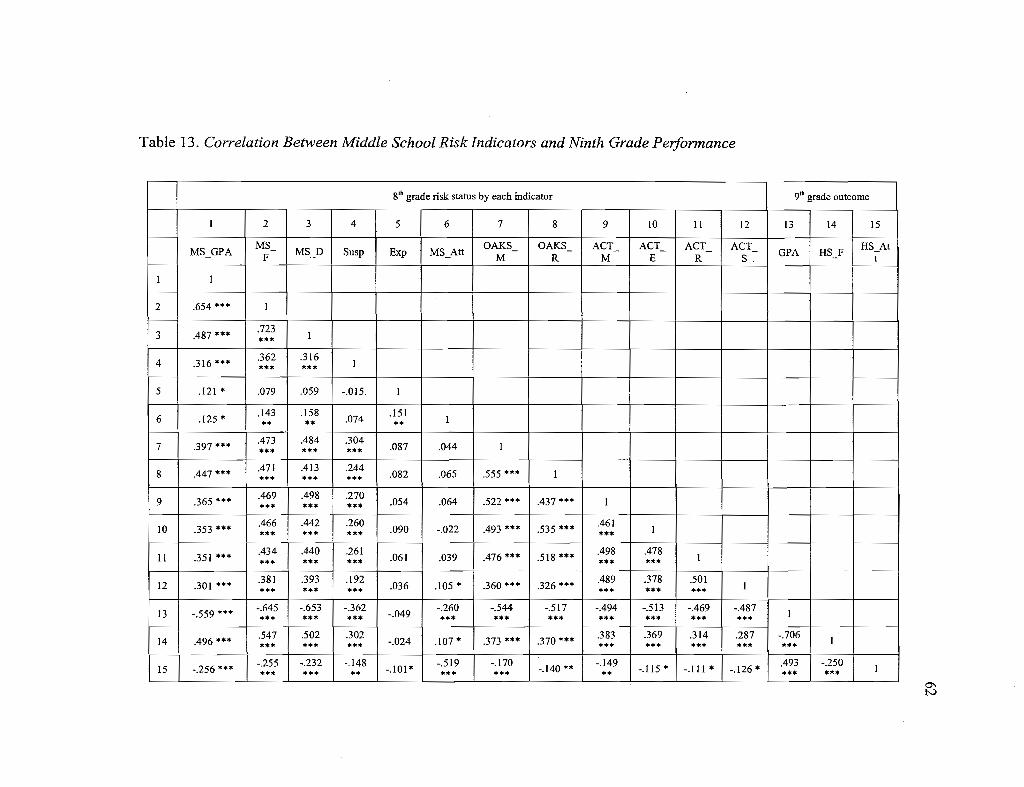
Table 13. Correlation Between Middle School Risk Indicators and Ninth Grade Performance
8th grade risk status by each indicator 9th grade outcome
I 2 3 4 5 6 7 8 9 10 II 12 13 14 15
MS GPAMS- MS D Susp Exp MS_Att
OAKS- OAKS- ACT_ ACT_ ACT_ ACT_GPA HSy
HS_At- F - M R M E R S t
I I
2 .654 *** I
3 0487 ***.723
I***
4 .316***.362 .316
I*** ***
5 .121 * .079 .059 -.015. I
6 .125 *.143 .158
.074.151
I** ** **
7 .397 ***0473 .484 .304
.087 .044 I*** *** ***
8 .447 ***.471 0413 .244
.082 .065 .555 *** I*** *** ***
9 .365 ***.469 .498 .270
.054 .064 .522 *** 0437 *** I*** *** ***
10 .353 ***.466 0442 .260
.090 -.022 0493 *** .535 ***.461
I*** *** *** ***
II .351 ***.434 .440 .261
.061 .039 0476 *** .518 *** 0498 0478I*** *** *** *** ***
12 .301 ***.381 .393 .192
.036 .105* .360 *** .326 ***0489 .378 .501
I*** *** *** *** *** ***
13 -.559 ***-.645 -.653 -.362
-.049-.260 -.544 -.517 -0494 -.513 -.469 -0487
I*** *** *** *** *** *** *** *** *** ***
14 .496 ***.547 .502 .302
-.024 .107 * .373 *** .370 *** .383 .369 .314 .287 -.706I*** *** *** *** **"* *** *** *"'*
15 -.256 ***-.255 -.232 -.148
-.101 *-.519 -.170
-.140 ** -.149-.115 * -.111 * -.126 *
0493 -.250I
*** *** ** *** *** ** *** ***0'1tv
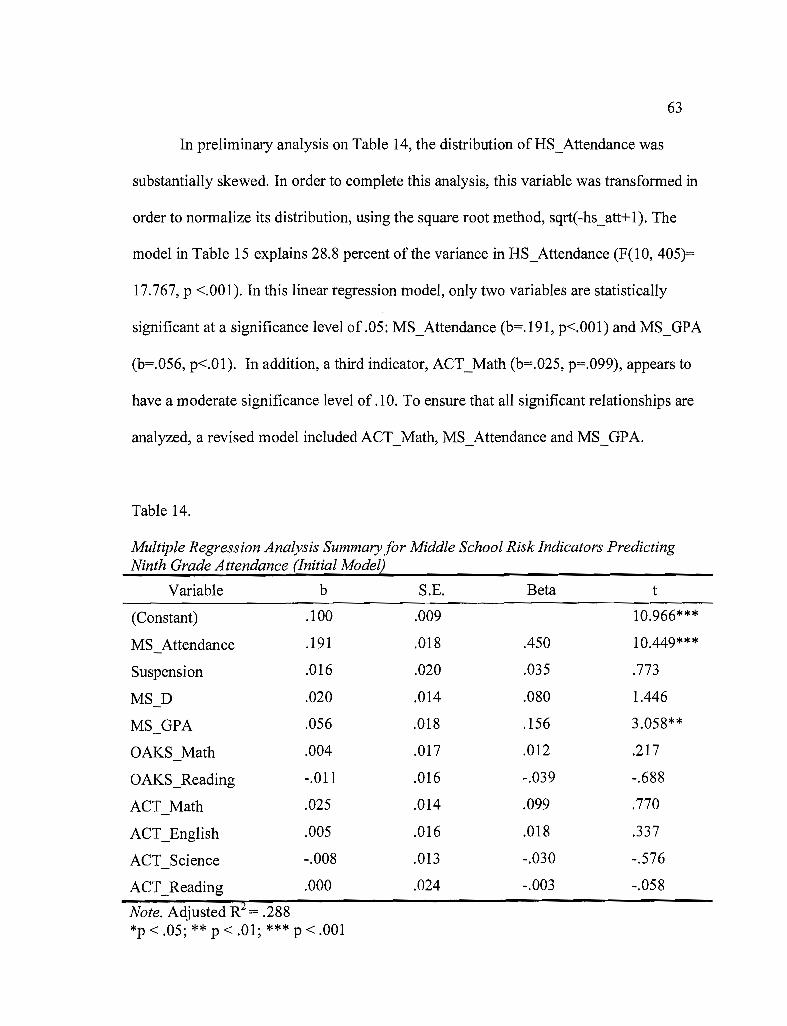
63
In preliminary analysis on Table 14, the distribution of RS_Attendance was
substantially skewed. In order to complete this analysis, this variable was transformed in
order to normalize its distribution, using the square root method, sqrt(-hs_att+1). The
model in Table 15 explains 28.8 percent of the variance in RS_Attendance (F(10, 405)=
17.767, P <.001). In this linear regression model, only two variables are statistically
significant at a significance level of .05: MS_Attendance (b=.191, p<.OOl) and MS_GPA
(b=.056, p<.Ol). In addition, a third indicator, ACT_Math (b=.025, p=.099), appears to
have a moderate significance level of .10. To ensure that all significant relationships are
analyzed, a revised model included ACT_Math, MS_Attendance and MS_GPA.
Table 14.
Multiple Regression Analysis Summary for Middle School Risk Indicators PredictingNinth Grade Attendance (Initial Model)
Variable b S.E. Beta t
(Constant) .100
MS Attendance .191
Suspension
MS D
MS GPA
OAKS Math
OAKS_Reading
ACT Math
ACT_English
ACT Science
.016
.020
.056
.004
-.011
.025
.005
-.008
.000
.009
.018
.020
.014
.018
.017
.016
.014
.016
.013
.024
.450
.035
.080
.156
.012
-.039
.099
.018
-.030
-.003
10.966***
10.449***
.773
1.446
3.058**
.217
-.688
.770
.337
-.576
-.058
Note. Adjusted R2= .288*p < .05; ** P < .01; *** P < .001
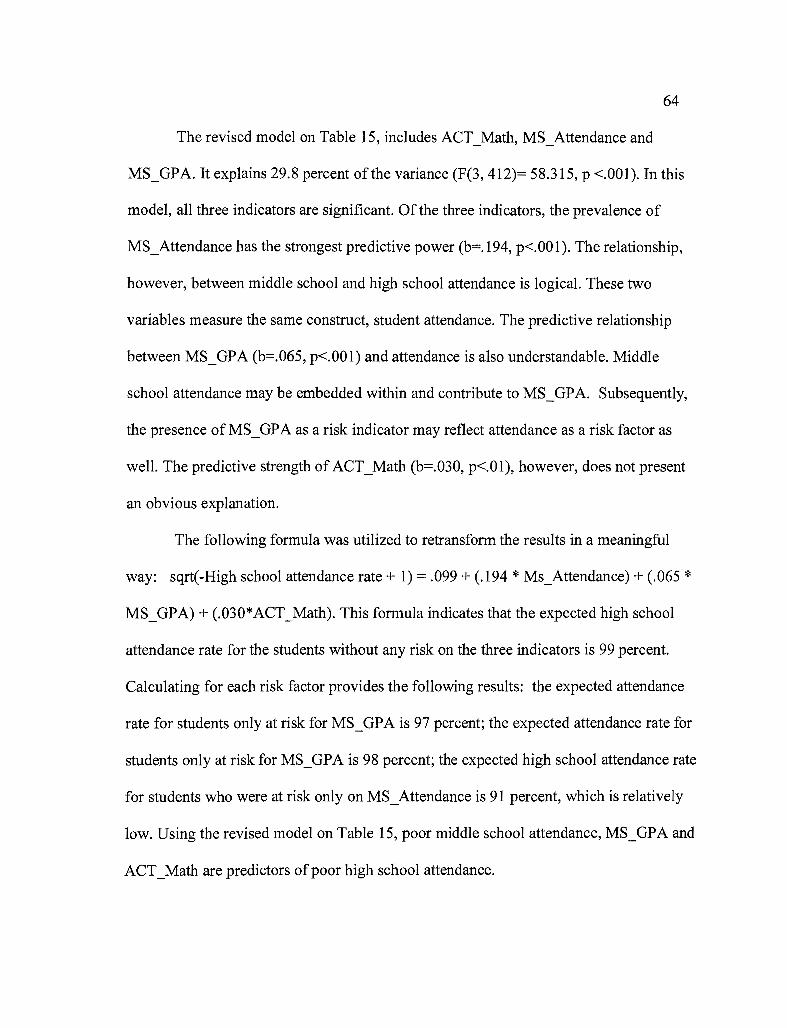
64
The revised model on Table 15, includes ACT_Math, MS_Attendance and
MS_GPA. It explains 29.8 percent of the variance (F(3, 412)= 58.315, p <.001). In this
model, all three indicators are significant. Of the three indicators, the prevalence of
MS_Attendance has the strongest predictive power (b=.194, p<.OOl). The relationship,
however, between middle school and high school attendance is logical. These two
variables measure the same construct, student attendance. The predictive relationship
between MS_GPA (b=.065, p<.OOl) and attendance is also understandable. Middle
school attendance may be embedded within and contribute to MS_GPA. Subsequently,
the presence ofMS_GPA as a risk indicator may reflect attendance as a risk factor as
well. The predictive strength of ACT_Math (b=.030, p<.Ol), however, does not present
an obvious explanation.
The following formula was utilized to retransform the results in a meaningful
way: sqrt(-High school attendance rate + 1) = .099 + (.194 * Ms_Attendance) + (.065 *
MS_GPA) + (.030*ACT_Math). This formula indicates that the expected high school
attendance rate for the students without any risk on the three indicators is 99 percent.
Calculating for each risk factor provides the following results: the expected attendance
rate for students only at risk for MS_GPA is 97 percent; the expected attendance rate for
students only at risk for MS_GPA is 98 percent; the expected high school attendance rate
for students who were at risk only on MS_Attendance is 91 percent, which is relatively
low. Using the revised model on Table 15, poor middle school attendance, MS_GPA and
ACT_Math are predictors ofpoor high school attendance.

65
Table 15.
Multiple Regression Analysis Summary for Middle School Risk Indicators PredictingNinth Grade Attendance (Revised Model)
Variable b
(Constant) .099
MS Attendance .194
MS GPA .065
ACT Math .030
Note. Adjusted R2 = .298P < .05; ** P < .01; *** p < .001
S.B.
.007
.018
.016
.011
Beta
.455
.182
.120
t
13.920***
10.936***
4.079***
2.705**
What Are the Significant Predictors ofNinth Grade Course Failure?
In the initial regression model for course failure on Table 16, the outcome
measure is treated as dichotomous; coded 1 if a student failed at least one course and
coded 0 if a student did not have any course failure. Logistic regression is applied. In this
initial model, about 30 percent of the variance is explained according to Cox & Snell R
square, and two indicators, MS_D (b=2.125, p<.OOl) and MS_GPA (b=1.182, p<.Ol), are
significant (x2 (10)=147.873, p<.OOl). The relationship between MS_D and course failure
appears to be the strongest. A third indicator, ACT_Math (b=.675, p=.125), appears to be
significant. While indicators from classroom performance and assessment may be related
to course failure, none of the school behavior indicators are related to course failure. A
revised model will include MS_D, MS_GPA, and ACT_Math.

66
Table 16.
Multiple Regression Analysis Summary for Middle School Risk Indicators PredictingNinth Grade Course Failure (Initial Model)
Variable b S.B.
(Constant) -4.066 .513
MS Attendance .281 .467
Suspension .553 .432
MS D 2.125 .475
MS GPA 1.182 .378
OAKS Math -.016 .407
OAKS_Reading .326 .429
ACT Math .675 .429
ACT_English .418 .400
ACT_Reading -.278 .422
ACT Science .457 .553
Note. Cox & Snell R2= .299, Nagelkerke R2 = .477P < .05; ** P < .01; *** P < .001
Wald
62.852
.363
1.634
19.972
9.792
.002
.577
2.367
1.091
.434
.682
Odds Ratio
.017***
1.325
1.738
8.371 ***
3.262**
.984
1.386
1.964
1.518
.757
1.579
In the revised model on Table 17, all three indicators are significant (x2
(3)=142.487, P<.OOl). In this model, the prevalence of grade D in middle school is highly
predictive of course failure during the first semester of high school (Odds Ratio= 10.182,
p<.OOl). This indicates that those at-risk students in terms of MS_D have about ten times
larger odds of having course failure in the first year of high school than those non-risk
students. In addition, the prevalence of MS_GPA as a risk indicator may be moderately
predictive of course failure (Odds Ration=4.067, p<.OOl). That is, those at-risk students
in terms of middle school grade-point-average will have about four times higher odds of
having high school course failure than non-risk students. The strength ofthese two
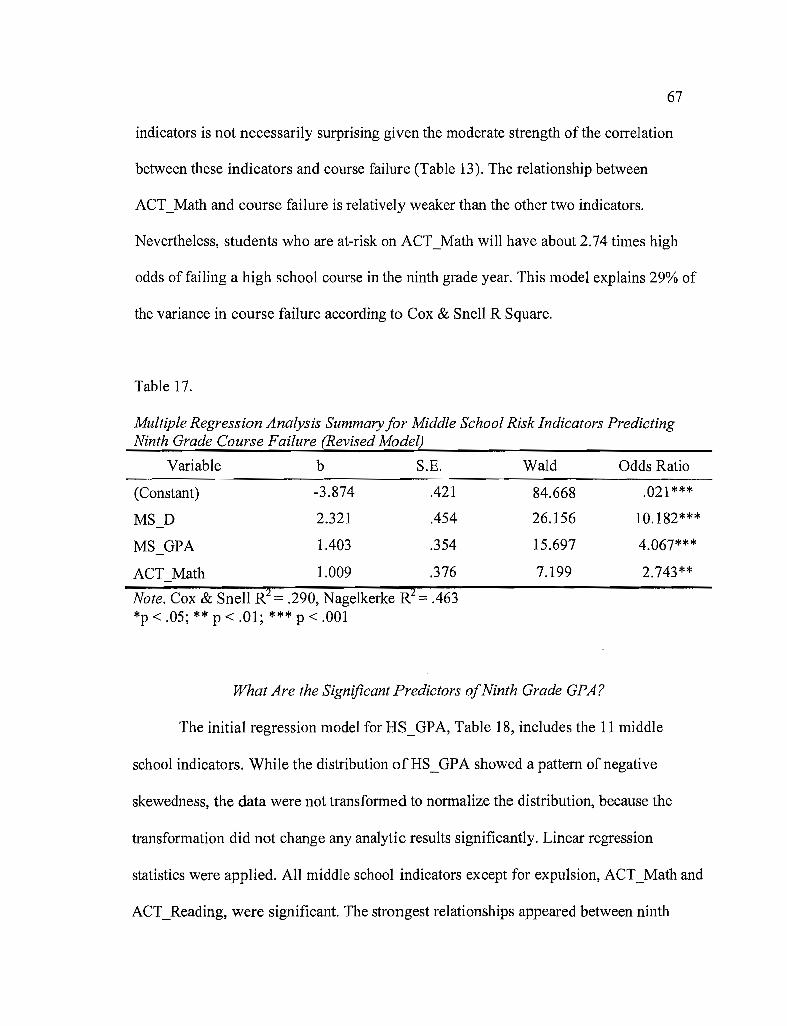
67
indicators is not necessarily surprising given the moderate strength of the correlation
between these indicators and course failure (Table 13). The relationship between
ACT_Math and course failure is relatively weaker than the other two indicators.
Nevertheless, students who are at-risk on ACT_Math will have about 2.74 times high
odds of failing a high school course in the ninth grade year. This model explains 29% of
the variance in course failure according to Cox & Snell R Square.
Table 17.
Multiple Regression Analysis Summary for Middle School Risk Indicators PredictingNinth Grade Course Failure (Revised Model)
Variable b S.B. Wald Odds Ratio
(Constant) -3.874 .421
MS D 2.321 .454
MS GPA 1.403 .354
ACT Math 1.009 .376
84.668 .021***
26.156 10.182***
15.697 4.067***
7.199 2.743**
Note. Cox & Snell R2= .290, Nagelkerke R2
= .463*p < .05; ** P < .01; *** P < .001
What Are the Significant Predictors ofNinth Grade GPA?
The initial regression model for HS_GPA, Table 18, includes the 11 middle
school indicators. While the distribution of HS_GPA showed a pattern of negative
skewedness, the data were not transformed to normalize the distribution, because the
transformation did not change any analytic results significantly. Linear regression
statistics were applied. All middle school indicators except for expulsion, ACT_Math and
ACT_Reading, were significant. The strongest relationships appeared between ninth

68
grade grade-point-average and MS_Attendance (b=-.555, p<.OOl), MS_D (b=-.582,
p<.OOl), and MS_GPA (b=-.547, p<.OOl). The weakest relationships in this model
existed between ninth grade grade-point-average and state assessments, math (b=-.288,
p<.Ol) and reading (b=-.207, p<.Ol). This initial model explained 61.8 percent of
variance in HS_GPA (F(11, 404)=62.023, P <.001). A revised model excluded expulsion,
Table 18.
Multiple Regression Analysis Summary for Middle School Risk Indicators PredictingNinth Grade GPA (Initial Model)
Variable b
(Constant) 3.775
MS Attendance -.558
Suspension -.241
MS D -.582
MS GPA -.547
OAKS Math -.288
OAKS_Reading -.207
ACT Math -.019
ACT English -.313
ACT Science -.325
ACT_Reading .006
Note. Adjusted R2= .618*p < .05; ** P < .01; *** P < .001
S.E.
.052
.105
.116
.081
.106
.095
.093
.081
.093
.077
.083
Beta
-.167
-.069
-.291
-.194
-.125
-.092
-.009
-.133
-.157
.003
t
72.248***
-5.304***
-2.070*
-7.229***
-5.175***
-3.033**
-2.213**
-.232
-3.347**
-4.192***
.069
With three variables removed, the revised model on Table 19 continues to explain
61.8 percent of the variance (F(8, 407)=84.932, P <.001). Classroom performance
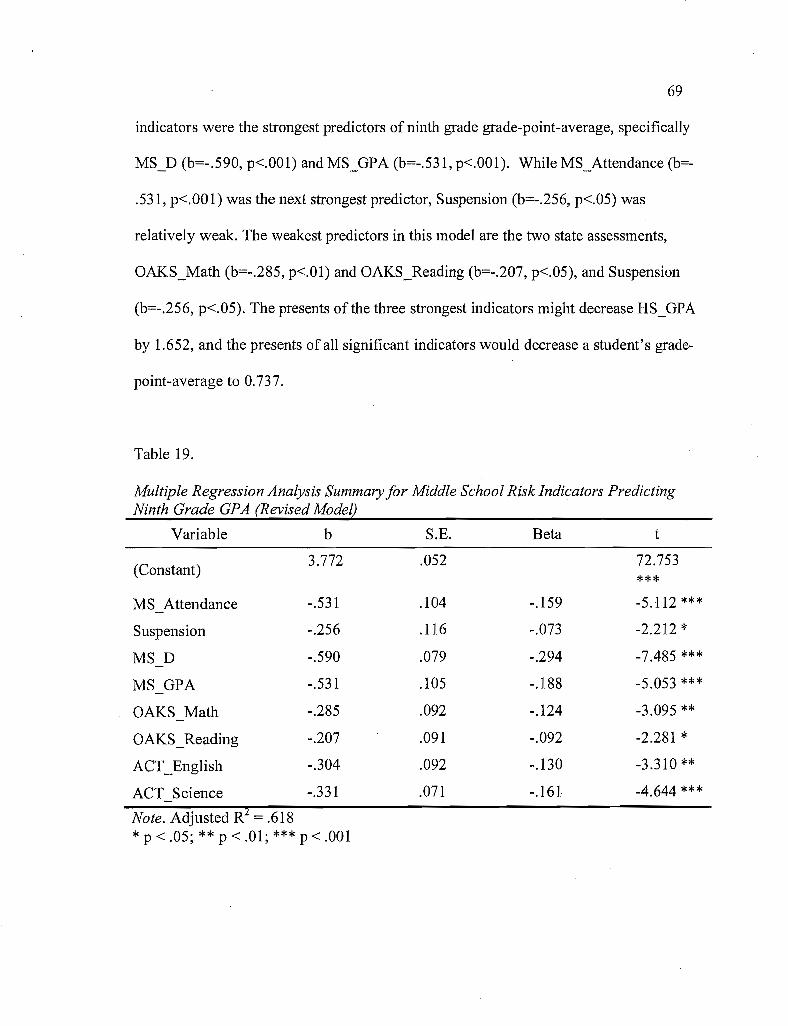
69
indicators were the strongest predictors of ninth grade grade-point-average, specifically
MS_D (b=-.590, p<.OOI) and MS_GPA (b=-.531, p<.OOI). While MS_Attendance (b=-
.531, p<.OO 1) was the next strongest predictor, Suspension (b=-.256, p<.05) was
relatively weak. The weakest predictors in this model are the two state assessments,
OAKS_Math (b=-.285, p<.OI) and OAKS_Reading (b=-.207, p<.05), and Suspension
(b=-.256, p<.05). The presents of the three strongest indicators might decrease HS_GPA
by 1.652, and the presents of all significant indicators would decrease a student's grade-
point-average to 0.737.
Table 19.
Multiple Regression Analysis Summary for Middle School Risk Indicators PredictingNinth Grade GPA (Revised ModeQ
Variable b S.E. Beta t
***
.104 -.159 -5.112 ***
.116 -.073 -2.212 *
.079 -.294 -7.485***
.105 -.188 -5.053 ***
.092 -.124 -3.095 **
.091 -.092 -2.281 *
.092 -.130 -3.310 **
.071 -.161 -4.644 ***
(Constant)
MS Attendance
Suspension
MS D
MS GPA
OAKS Math
OAKS_Reading
ACT_English
ACT Science
3.772
-.531
-.256
-.590
-.531
-.285
-.207
-.304
-.331
.052 72.753
Note. Adjusted R2 = .618* p < .05; ** P < .01; *** P < .001

70
CHAPTER V
DISCUSSION
The purpose of this study was to examine the efficacy of 12 middle school
academic risk indicators to identify struggling students entering the ninth grade. In this
study, I examined the empirical relationships between these indicators and three ninth
grade measures that have shown to be strong predictors of students academically at risk
of dropping out of high school (Allensworth & Easton, 2007; Kennelly & Monrad, 2007;
Neild & Balfanz, 2006). While this study focuses on middle school indicators, the design
of this study does not allow for an analysis of the efficacy of individual interventions,
such as Freshmen Achievement Teams.
As struggling students are identified in the ninth grade through the FAT process, a
variety of interventions of varying intensities are applied to improve student performance.
In this study, at-risk students may have received modest accommodations in each course,
such as shortened assignments, preferential seating, or extended time for completing
assignments. In addition, some students may have received more intensive interventions,
such as direct literacy instruction or daily progress monitoring by an Intervention
Specialists. Controlling for the impact of each accommodation or intervention on the
outcome measures is problematic. Consequently, the accommodations and interventions
71
may confound the outcome measures of this study. Any threats to validity that these
treatment variations may cause are dealt with in the study limitations section. My
findings, as presented in Figure 4, suggest that four middle school indicators may be
strong predictors of ninth grade performance.
School Behavior
MS Attendance
-.537
Classroom Performance
~-.590 10.18
State/National Assessment
ACT ExploreMath
HSGPA
R'= .618
HSAttendance
R'= .298
CourseFailure
Nagelkerke R' = .463
Figure 4. Significant Middle School Indicators ofNinth Grade Performance
Key Findings
Research has examined the link between dropping out of high school and
academic risk factors (Lee, 2007). Pervious classroom performance, school behavior and
assessment performance have identified students at risk of dropping out of school as early
as the sixth grade (Balfanz, Herzog & MacIver, 2007). Early identification of these
students allows schools to implement interventions that may improve student
performance and keep students on track towards graduation. Allensworth and Easton

72
(2007) have identified three ninth grade indicators of students that are not on track for
graduation. These off-track indicators include student attendance, course failure and
cumulative grade-point-average.
The purpose of this study was to identify middle school performance indicators
that correlate and may predict students' high school performance on these off-track
indicators. The implications of these middle school indicators would be the identification
of at-risk students before they enter high school. The findings for this study will be
presented in two parts: (a) characteristics of at-risk students, and (b) predictors of ninth
grade performance.
Characteristics ofAt-Risk Students
This study examined the academic performance of 416 freshmen students
matriculating from three middle schools to a large suburban high school. Students were
assessed as at-risk or non-risk on 12 middle school academic indicators. Students with six
or more at-risk indicators were identified overall as at-risk for school failure and received
intervention at the beginning of the school year. The at-risk students in this study, on
average, struggled on nine of the 12 indicators. Over three-fourths of the students in this
study had five or fewer risk indicators and did not receive any intervention. In fact, the
maj ority of the students, 51.7 percent, had two or less risk indicators overall. While it
may be said that the majority of students were performing very well, the students that
struggled are highly at risk for school failure.
Lee (2007) identified social risk factors that are associated with school failure,
including gender, ethnicity, poverty and immigration status. An analysis of the

73
composition of highly at-risk students in this study indicates that the majority of these
students are male, 61 percent, receiving services in Special Education, 19.5 percent, and
English Language Development, 35 percent. These students are predominately
Hispanic/Latino, 46 percent. In comparison to the total population in the sample, these
percentages are significant in telling the story of who is more likely to be at risk for
dropping out (see Table 7). Hispanics, males, and English-Language-Learners students
were more likely to be identified as at-risk than any other student in this study.
Allensworth and Easton (2007) suggest a strong relationship exists between
student attendance and course failure. An analysis, however, of ninth grade measures by
risk status (Table 10) suggests that attendance may have less of an impact on student
performance. In this study, students who were identified as at-risk by middle school
grade-point-average were absent nine more days over the course of a school year than
non-risk students. Nevertheless, at-risk students failed nine times more courses and
earned 0.87 grade-point-average lower than non-risk students in high school. In addition,
students who were identified as at-risk by middle school grade F attended only six fewer
days a year than non-risk students. Yet, at-risk students failed 15 times more courses and
earned a grade-point-average 1.41 lower in high school than non-risk students. While
difference in attendance rates between at-risk and non-risk students may be marginal, the
difference in academic performance is dramatic.
Further analysis of indicators revealed that students struggled more often on ACT
assessments than on any other indicator. Nearly two-thirds, 64.7 percent, of the students
struggled on the ACT science assessment; over 45 percent struggled on the ACT math

74
assessment; and 39 percent of the students struggled with ACT reading. Designed as part
of a larger curriculum assessment program, the ACT Explore scores may predict student
success in college-level courses. Students were identified on these standardized
assessments as at-risk based on ACT's "college ready" index (ACT, 2007). The college
ready index benchmarks the ACT Explore for eighth and ninth grade students with the
ACT Plan for tenth graders and the ACT for eleventh graders. Student performance was
much better on the English and reading assessments than on math and science.
While more students struggled on the ACT assessment, students that were
identified as at-risk by classroom performance and middle school attendance struggled
more profoundly than other students. Students with lower grade-point-averages earn a
full grade and a half lower in high school courses than students with higher middle school
grade-point-averages. While less than 10 percent of the students were at-risk due to
attendance, at-risks students attended high school 87.5 percent of the time; this is a full
ten percentage point lower than other students. This may suggest that while standardized
assessments are prominent indicators, classroom performance and school behavior are
stronger predictors of at-risk students.
Predictors ofNinth Grade Performance
While previous academic performance and incidents of problem behavior are
strong predictors ofhigh school dropout, Allensworth and Easton (2007) suggested three
ninth grade markers of students at-risk that may be more timely and responsive to
intervention. These markers included absenteeism, grade-point-average, and course
completion. Their study found that only 63 percent of the students missing more than five

75
days of class per semester graduated within four years. Comparatively, 87 percent of the
students missing less than five days graduated within the same time frame. Balfanz,
Herzog and MacIver (2007) also suggested that student non-attendance rates in middle
school were an effective indicator of high school dropouts. Given that course attendance
was the most essential requirement to avoiding course failure, absenteeism may have
been the most readily identifiable indicator and the most responsive to intervention.
Course grades and failure rates were slightly better predictors of students'
academic performance than attendance; they directly demonstrate whether or not a
student is making progress in their courses. Students that earn a 2.5 grade point average
on a 4.0 scale at the end of their freshmen year are more likely to graduate within four
years than students with an average below a 2.0 (Allensworth and Easton, 2007). In
addition, failing a single core course may dramatically reduce the likelihood of
graduation. Core courses include English, social studies, mathematics and science.
Research suggests that failure of one core course may reduce the likelihood of graduation
by 28 percent. Failure oftwo courses may reduce the chances of graduation by 49 percent
(Allensworth & Easton, 2005). Nevertheless, few students experience academic problems
in only a single course. Failure in even one semester course is generally a sign of trouble
in other courses as well.
Attendance. Allensworth and Easton (2007) suggest that ninth grade course
attendance is highly predictive of student failure. They found that course attendance was
eight times more predictive of course failure, and they also found that freshmen absences
could be used to predict 63 percent of the variation in course failures. Furthermore,

76
course attendance was a stronger predictor than standardized test scores. In their study,
students who entered high school with very low eighth grade test scores who missed less
than one week of classes per semester had fewer failures, on average, than students
entering with very high test scores who missed one additional week of classes. In
addition, Neild and Balfanz (2006) found that of the eighth grade students who attended
school less than 80 percent of the time 78 percent of them eventually dropped out of
school.
This study found three predictors ofninth grade attendance; middle school
attendance, middle school grade-point-average, and ACT math. Of these indicators, only
middle school attendance appears to be a strong predictor (b=.194, p<.OOl). Students who
attended middle school less than 90 percent of the time were also found to have difficulty
with high school attendance. The presences of middle school attendance as a risk factor
reduced high school attendance by eight percentage points to 91 percent attendance. At
this level, students would miss approximately eight days of instruction during an 18-week
semester and may be at risk of course failure.
The predictive power of middle school grade-point-average is relatively weaker
than middle school attendance (b=.065, p<.OOI). Given the practical relationship between
GPA and attendance, it is somewhat surprising that a stronger statistical relationship does
not exist. Students with poor middle school grade-point-average were found to have a
small drop in high school attendance. It stands to reason that students who are performing
poorly may avoid attending class for fear of further failure and embarrassment. In fact,
research has documented the process of gradual disengagement from school as student
77
who misses class perfonns poorly, and poor performance leads to student avoidance of
class (Allensworth & Easton, 2007).
The weakest predictor of high school attendance is ACT math (b=.030, p<.OOl).
ACT math is a national assessment of math achievement for eighth graders. The
assessment provides infonnation of student progress towards college readiness. While
relatively weak, the mere presence of this indicator as a predictor supports the growing
body of research on the importance of math as a predictor of student academic
performance. Early math achievement has been shown to have strong predictive power
for later achievement, and high school math achievement has been linked to college
completion (Duncan, et aI., 2007; Lee, et aI., 2008). The findings in this study suggest
that there is a relationship between student attendance and academic performance.
Course Failure. Student course failure is often a sign of trouble. Research has
shown that less than half of the students who failed three or more courses during the
freshmen year graduated on time (Allensworth & Easton, 2007). Failure in even one
semester course may be an indication of concern. Students who failed a single course in
ninth grade had graduation rate 20-percentage points lower than students who passed all
of their classes (Allensworth & Easton, 2005). A student that is struggling in one course
is more likely to struggle in all courses, and students who fail to earn sufficient credit to
be promoted to the next grade level are far more likely to drop out of school. Neild &
Balfanz (2006) found that more than half of dropouts were not promoted past the ninth or
tenth grade. The three predictors in this study of ninth grade course failure are middle
school grade D, middle school grade-point-average, and ACT math.
78
The strongest predictor of ninth grade failure is middle school grade D (b=2.32 I ,
p<.OO I), with an odds ratio of 10.182. This is significant given that 41 percent of the
students overall were at-risk on this indicator. While a course grade of D is considered a
passing grade sufficient for course credit, it is an indicator of a student struggling to
master course material and concepts. In addition, the variance in teachers' grading
practices to include attendance, homework, and extra credit suggest that students may
earn passing grades without any true achievement (Randall & Engelhard, 2009). When
combined with course failures, the number of students earning course grades of D may
provide a true picture of students at risk of academic failure.
As an overall indicator of students' performance, grade-point-average is a strong
predictor of student achievement (b=1.403, p<.00 I). As students accumulate course
grades, overall trends in student achievement are apparent. If students struggle, earning
low marks or even failing courses, student grade-point-averages drop precipitously. Low
grade-point-average is a manifestation of weak academic skills that result in course
failure. Conversely, high grade-point-average is an indication of strong academic skills.
Randall and Engelhard (2009) have suggested, however, that some teacher practices, such
as including attendance, extra credit and home work, may confound the grades and
diminish their value as a true indicator of student achievement. Nevertheless, the findings
of this study suggest that there is a strong relationship between middle school grade
point-average and high school performance.
As mentioned previously, a growing number of studies have found math to be a
significant predictor of future academic outcomes (Duncan et aI., 2007; Lee et aI., 2008).
79
Similarly, the findings of this study suggest that ACT math (b=l.009, p<.OI) is a
powerful predictor of course failure. Students that are at-risk on this indicator are 2.5
times more likely to be at risk for course failure. This would suggest that math
achievement is an important indicator of overall academic achievement.
Grade-Paint-Average. Allensworth and Easton (2007) have found that grade
point-average is the most accurate for identifying students that drop out of school. In
their study, 86 percent of the students with a 2.5 grade-point-average in their ninth grade
year graduated within fours of entering high school. As grade-point-average declines,
graduation rates also decline. Less than three-quarters of the students with a grade-point
average below a 2.0 graduated on time, and roughly one-quarter of the students with a
grade-point-average below a 1.0 graduated. When combined with course failure, grade
point-average correctly identified non-graduates 80 percent of the time. Unfortunately,
grade-point-average is a troubling predictor; it identifies struggling students only after
they have actually failed. Strong predictors ofhigh school grade-point-average, however,
would enable schools to identify potential dropouts and implement interventions prior to
actual failure. In this study, several indicators were predictors of ninth grade grade-point
average. The three strongest include middle school grade D, middle school grade-point
average, and middle school attendance.
The strongest predictor for high school grade-point-average is middle school
grade D (h=-.590, p<.OOl). This is followed closely by middle school grade-point
average (b=-.531, p<.OOl) and middle school attendance (b=-.531, p<.OOI). The
presences of these three indicators would decrease a student's high school grade-point-

80
average by 1.652. This is the difference between an average student at 3.0 and an at-risk
student at 1.348.
Implications
Research has suggested that early identification of at-risk students is critical
during the first semester of ninth grade year (Allensworth & Easton, 2007; Kennelly &
Monrad, 2007; Neild & Balfanz, 2006). Early identification through key indicators will
allow educators to provide targeted interventions to specific grade levels of at-risk
students. While there is an extensive list of drop out prevention approaches, few are
proven to be effective (Kennelly & Monrad, 2007). Interventions that are oriented around
academic needs of individual students hold the most promise of combating high school
dropout.
Allensworth and Easton (2005) have identified the transition from middle school
to high school is a critical junction for students at risk of school failure. The findings of
this study suggest that there are four middle school indicators that predict student
performance in the ninth grade. These indicators include a student's grade-point-average,
attendance, grade D, and ACT math scores. While background factors such as gender,
ethnicity, and socio-economic status are still associated with school failure, school level
indicators may be better predictors of dropout (Kennelly & Monrad, 2007). The
development of an early identification system that incorporates grade-point-average,
attendance, grade D and ACT math may be more effective at providing targeted
interventions. Of these indicators, middle school attendance and course grade D may be
more significant than previously considered.
81
A Model for Identifying At-Risk Ninth Grade Students
Early identification of at-risk students transitioning from middle school to high
school may provide educators the opportunity to intervene prior to students failing in the
ninth grade. There appears to be a window of opportunity in reaching struggling students
during this transition. Kennelly and Monrad (2007) suggest that developing key
indicators may assist educators in targeting resources to dropout prevention. The
findings of this study suggest that two key middle school indicators that might be
included in an early identification system are middle school attendance and grade D.
Middle School Attendance. Student disengagement from school has long been
considered a key precursor to dropping out of school (Kennelly & Monrad, 2007).
Students that have dropped out of school have often cited a lack of motivation, boredom,
an unchallenging atmosphere, and an overall lack of engagement in school as key reasons
for dropping out (Bridgeland, Dululio, & Morison, 2006). Balfanz, Herzog and MacIver
(2007) suggest that attendance is an important indicator of school disengagement. My
findings suggest that middle school attendance is a strong predictor of high school
attendance and grade-point-average. Students with poor middle school attendance
increase their odds ofpoorly attending high school by a factor often (Odds ratio=1O.93,
p<.OOl), and poor middle school may be associated with a decrease in grade-point
average by over a half grade (b=-.531, p<.OOl).
Given that several different factors may influence school attendance, my findings
support school reforms that identify, monitor and provide specific interventions prior to
student failure. While the research is sparse on high school strategies to improve

82
attendance, there is growing evidence to suggest that an effective strategy would include:
(a) constantly recognizing and reinforcing good attendance, (b) a consistent response to
the first absence, (c) the collection and analysis of student by teachers and administrators
to identify struggling students, and (d) teachers, counselors and administrators meeting
frequently to analyze data and develop targeted interventions (Balfanz, Herzog, &
MacIver, 2007). A growing body ofresearch suggests that interventions should include a
three-tiered model that involves school-wide reforms, individually targeted interventions,
and intensive interventions by specialists to address problem behaviors (Sugai & Homer,
2002).
Middle School Grade D. While the research on course failure as an indicator for
dropping out is growing (Allensworth & Easton, 2007; Balfanz & Herzog, 2005), it
appears that there is limited work on marginal course performance, such as grade D, as a
predictor. Randall and Engelhard (2009) have noted that a simple letter grade may imply
a level of precision in evaluation that is unrealistic. While grades are easily understood,
student knowledge course content cannot be summed up so easily. My findings, however,
indicate that a middle school grade ofD may have predictive power for future course
failure and high school grade-point-average. Students with a letter grade ofD in middle
school increase the probability of failing a course in ninth grade by 10.18 to one (p<.001),
and a letter grade ofD may be associated with a .590 decline in ninth grade grade-point
average (p<.OOl). This suggests that marginal middle school grades may be a strong
predictor of ninth grade academic performance.

83
Study Limitations
This study utilizes a single-case exploratory case study design (Yin, 2003) with
embedded quantitative statistical analysis to understand the characteristics of
transitioning students who may be at risk of school failure and the relationship between
middle school indicators and 9th grade performance measures. The use of case study
methodology produced specific threats to the validity of the results. A discussion of the
limitations to this study will include: (a) threats to internal validity, and (b) threats to
external validity. While this study presents some limitations, its design lends itself to
further replication research focused on these potential threats.
Internal Validity
Shadish, Cook, and Campbell (2002) emphasize that internal validity is about
"causal inferences" and the extent that "causal conclusions are limited to the context of
the particular treatments, outcomes, times, settings, and persons studied" (p. 54). Due to
the inability to control for all extraneous variables, case study design is limited. The use
of statistical analysis techniques increased the internal validity of the study. Nevertheless,
the major threats to internal validity that should be considered in interrupting the results
of this study are selection, regression, and maturation.
Selection. The methods section identified that the participants in this study
matriculated from three different middle schools. While these schools are members ofthe
same school district with the same expectations for implementing policy, discipline and
adopted curriculum, differences between the schools persist in demographics and student
performance. The inclusion in this study of all students transitioning from these middle

84
schools to the high school was intended to limit this threat. Nevertheless, without random
assignment alternative hypotheses may be developed.
Regression. The methods section identified that six of the 12 middle school
indicators are state and national assessments. These assessments, particularly in the case
of math and reading, measure the same constructs. Given that there is not a perfect
correlation between state and national assessments, it is possible that students may have
been identified as at-risk on the state assessment and non-risk on the national assessment,
or alternatively, non-risk on the state assessment and at-risk on the national assessment.
The inclusion of multiple indicators was intended to limit this threat.
Maturation. The middle school measures utilized in this study, particularly in the
area of classroom performance and school behavior, reflect student performance over
three years of middle school. In addition, outcomes are measured at the mid-point of a
student's ninth grade year. Natural growth and maturation over the course of this time
may pose a threat. To limit this threat, only students of the same age and previous middle
school experience were included in this study. Nevertheless, this threat may lead to
alternative hypotheses.
External Validity
Shadish, Cook and Campbell (2002) defined external validity as "the extent to
which a causal relationship holds over variations in persons, settings, treatments, and
outcomes" (p.83). Yin (2003) suggested that generalizing results within case studies
relied upon analytical generalizations of a set of results to a broader theory. This study
relied on the recent work of Allensworth and Easton (2007) and Kennelly and Monrad

85
(2007) who developed on-track indicators to identify students at risk of not graduating
from high school. Their work focused on course grades, failures and attendance in the
freshmen year. The design of this case study included replication logic to test the premise
of three on-track indicators and identify middle school precursors to these three
indicators. While replication logic limits the threats to external validity and increases the
ability to generalize the results, it is important to consider (a) the interaction of setting
and treatment, and (b) the interaction of treatment variations.
Interaction ofSetting and Treatment. This threat to external validity is similar to
the interaction with selection threat previously discussed in the internal validity section.
While trying to discern the indicators of at-risk students, student performance and
experience at each middle school may be uniquely different. As with the interaction with
selection, the inclusion of all students was intended to limit this particular threat. As
mentioned previously, without random assignment alternative hypotheses may exist.
Interaction ofTreatment Variations. Students transitioning to the high school are
confronted with a new environment for learning. Each student responds to this
environment differently. Subsequently, students who struggled in middle school may
flourish in ninth grade, and middle school students who flourished may struggle in high
school. Struggling ninth grade students receive a variety of academic and behavioral
interventions to improve their performance. These interventions may range in type and
intensity. The high school system may be slow to identify struggling students, and the
interventions that struggling students receive may be sporadic and uneven. In addition,
highly at-risk students may receive multiple interventions. These variations in treatment

86
for struggling students may pose a threat to external validity. As with the interaction with
setting, without random assignment rival hypotheses may be developed.
Further Research
This study examined the empirical relationship between 12 middle school
indicators of students' academic and behavior performance and three ninth grade
measures. Given that this study focused on a single case, further study is needed on the
relationship between these indicators and ninth grade performance. Particular attention
should be given to the power of marginal grades in middle school to predict future high
school achievement. While the variance in classroom grading practices is well
documented (Randall & Engelhard, 2009), the results of this study suggest that letter
grades ofD in middle school may be important predictors of high school achievement.
Further study is also needed to explore the relationship between middle school
indicators and high school completion. This study relied on previous research that
identified ninth grade attendance, course completion and grade-point-average as
indicators of high school graduation (Allensworth & Easton, 2007; Kennelly & Monrad,
2007; Neild & Balfanz, 2006). These ninth grade indicators have strong predictive power
of graduation, and they have been utilized to identify students for drop out prevention.
The purpose this study was to identify middle school indicators that may identify at-risk
students prior to ninth grade and provide early intervention. Further research into the
relationship between middle school and graduation may further strengthen the use of
middle school indicators for intervention.

87
Finally, extensive research in school failure has identified social and academic
risk factors that may contribute to dropping out of school (Croninger & Lee, 2001).
Social risk was defined as the demographic factors that contribute to school failure,
including gender, ethnicity, socioeconomic status, and immigration status. While this
study focused on academic risk factors, the results suggest a confounding of social and
academic risk factors. Of the 97 students with an overall at-risk status in this study, a
large majority of them were male (60 percent), Hispanic (46 percent), and English
Language Learners (35 percent). These proportions are much larger than the general
population in study, suggesting the presences of social risk factors. Further research on
the connection between social risk factors and the middle school indicators will
strengthen our understanding of the relationship between middle school and ninth grade
performance.
88
REFERENCES
ACT. (2007). ACT explore technical manual. Iowa City, IA: ACT.
Allensworth, E. M., & Easton, 1. Q. (2005). The on-track indicator as a predictor of highschool graduation. Chicago, II: Consortium on Chicago School Research at theUniversity of Chicago.
Allensworth, E. M., & Easton, J. Q. (2007). What matters for staying on-track andgraduating in Chicago Public Schools: A closer look at course grades, failures,and attendance. Chicago, II: Consortium on Chicago School Research at theUniversity of Chicago.
Alspaugh, 1. W. (1998). Achievement loss associated with the transition to middle schooland high school. The Journal ofEducational Research, 92 (1), 20-25.
American Educational Research Association. (1999). Standards for educational andpsychological testing. Washington DC: AERA.
Agras, W. S., Kazdin, A. E., & Wilson, G. T. (1979). Behavior Therapy: Toward anapplied clinical science. San Francisco: W.H. Freeman & Co.
Balfanz, R, Herzog, L., & MacIver, D. 1., (2007). Preventing student disengagementand keeping students on the graduation path in urban middle-grades schools:Early identification and effective interventions. Educational Psychologist, 42 (4),223-235.
Battin-Pearson, S., Newcomb, M. D., Abbott, R D., Hill, K G., Catalano, R F., &Hawkins, 1. D. (2000). Predictors of early high school dropout: A test of fivetheories. Journal ofEducational Psychology, 92 (3), 568-582.
Bridgeland, J., Dululio, 1. J., & Morison, K B. (2006). The silent epidemic: Perspectivesofhigh school dropouts. Washington, DC: Civic Enterprises.
Christle, C. A., Jolivette, K, & Nelson, C. M. (2007). School characteristics related tohigh school dropout rates. Remedial and Special Education, 28 (6),325-339.
Croninger, R G., & Lee, V. E. (2001). Social capital and dropping out of high school:Benefits to at-risk students of teachers' support and guidance. Teachers CollegeRecord, 103,548-581.

89
Duncan, G. 1., Dowsett, C. J., Claessens, A., Magnuson, K., Huston, A. c., Klebanov, P.,Pagani, L. S., Feinstein, L., Engel, M., Brooks-Gunn, 1., Sexton, H., Duckworth,K., & Japel, C. (2007). School readiness and later achievement. DevelopmentalPsychology, 43 (6), 1428-1446.
FeIner, R. D., Seitsinger, A. M., Brand, S., & Burns, A. (2007). Creating small learningcommunities: Lessons from the project on high-performing learning communitiesabout "what works" in creating productive, developmentally enhancing, learningcontexts. Educational Psychologist, 42 (4),209-221.
Finn, 1. D. (2006). The adult lives ofat-risk students: The roles 0/attainment andengagement in high school. Statistical analysis report. U.S. Department ofEducation, National Center for Education Statistics. Washington, DC: U.S.Government Printing Office.
Finn, 1. D., & Rock, D. A. (1997). Academic success among students at risk for schoolfailure. Journal 0/AppliedPsychology, 82,221-234.
Galassi, 1. P., Gulledge, S. A., & Cox, N. D. (1997). Middle school advisories: Retrospectand prospect. Review o/Educational Research, 67 (3),301-338.
Gleason, P., & Dynarski, M. (2002). Do we know whom to serve? Issues in using riskfactors to identify dropouts. Journal 0/Education/or Students Placed at Risk, 7(1),25-41.
Heck, R. H. (2007). Examining the relationship between teacher quality as anorganizational property of schools and students' achievement and growth rates.Educational Administration Quarterly, 43 (4),399-432.
Herlihy, C. (2007). State and district-level supports for successful transition into highschool. Washington, DC: National High School Center.
lBO. (2008). Towards a continuum o/international education. Cardiff, Wales: IBO
Janosz, M., Le Blanc, M., Boulerice, B., & Tremblay, R. E. (2000). Predicting differenttypes of school dropouts: A typological approach with two longitudinal samples.Journal o/Educational Psychology, 92 (1),171-190.
Jerald, C. (2006). Identifying potential dropouts: Key lessons for building an earlywarning data system. Washington, DC: Achieve, Inc.
Kamps, D. M., & Greenwood, C. R. (2005). Formulating secondary-level readinginterventions. Journal o/Learning Disabilities, 36 (6), 500-509.

90
Karcher, M. J. (2005). The effects of developmental mentoring and high school mentors'attendance on their younger mentees' self-esteem, social skills, andconnectedness. Psychology in the Schools, 42 (1),65-77.
Kennelly, L., & Monrad, M. (2007). Approaches to dropout prevention: Heeding earlywarning signs with appropriate interventions. Washington, DC: National HighSchool Center.
Ketterlin-Geller, L. R., Chard, D. J., & Fien, H. (2008). Making connections inmathematics: Conceptual mathematics intervention for low-performing students.Remedial and Special Education, 29 (1), 33-45.
Lau, M. Y., Sieler, J. D., Muyskens, P., Canter, A., Vankeuren, B., & Marston, D.(2006). Perspectives on the use of the problem-solving model from the viewpointof a school psychologist, administrator, and teacher from a large Midwest urbanschool district. Psychology in the Schools, 43 (1), 117-127.
Lee, S. M., Daniels, M. H., Puig, A., Newgent, R. A., & Nam, S. K. (2008). A data-basedmodel to predict postsecondary educational attainment of low-socioeconomicstatus students. Professional School Counseling, 11 (5),306-316.
Lee, V. E., & Burkam, D. T. (2003). Dropping out of high school: The role of schoolorganization and structure. American Educational Research Journal, 40 (20),353-393.
Mayer, A. P. (2008). Expanding opportunities for high academic achievement: Aninternational baccalaureate diploma program in an urban high school. Journal ofAdvanced Academics, 19 (2), 202-235.
McIntosh, K., Flannery, K. B., Sugai, G., Braun, D. H., & Cochrane, K. L. (2008).Relationships between academics and problem behavior in the transition frommiddle school to high school. Journal ofPositive Behavior Interventions, 10 (4),243-255.
Miles, J., & Shevlin, M. (2007). Applying regression and correlation: A guide forstudents and researchers. Thousand Oaks: Sage Publications.
Mizelle, N. B., & Irvin, J. L. (2000). Transition from middle school into high school.Middle School Journal, 31 (5),57-61.
Neild, R. C., & Balfanz, R. (2006). Unfilled promise: The dimensions andcharacteristics ofPhiladelphia's dropout crisis, 2000-2005. Baltimore: Center forSocial Organization of Schools, John Hopkins University.
91
Neild, R. C., Stoner-Eby, S., & Furstenberg, F. (2008). Connecting entrance anddeparture: The transition to ninth grade and high school dropout. Education andUrban Society, 40 (5), 543-569.
No Child Left Behind Act of 2001, 20 U.S .C. 16301 et seq.
Nunn, G. D., & McMahan, K. R. (2001). "Ideal" problem solving using a collaborativeeffort for special needs and at-risk students. Education, 121 (2), 305-312.
Onchwari, G., & Keengwe, J. (2008). The impact of a mentor-coaching model onteacher professional development. Early Childhood Education Journal, 36, 19-24.
Patterson, N. C., Beltyukova, S. A., Berman, K., & Francis, A. (2007). The making ofsophomores: Students, parent, and teacher reactions in the context of systemicurban high school reform. Urban Education, 42 (2), 124-144.
Quint, J. c., Miller, c., Pastor, J. J., & Cytron, R. E. (1999). Project transition: Testingan intervention to help high school freshmen succeed. New York, NY: ManpowerDemonstration Research Corporation.
Randall, J., & Engelhard, Jr., G. (2009). Examining teacher grades using raschmeasurement theory. Journal 0/Educational Measurement, 46 (1),1-18.
Roderick, M., & Camburn, E. (1999). Risk and recovery from course failure in the earlyyears of high school. American Educational Research Journal, 36 (2), 303-343.
Rumberger, R. (2002). Student mobility and academic achievement. ERIC Digest [EDOPS-02-1]. Champaign, IL: Clearinghouse on Elementary and Early ChildhoodEducation.
Ryan, S., Hornbeck, A., & Frede, E. (2004). Mentoring for quality improvement: Acase study of a mentor teacher in the reform process. Early Childhood Research& Practice, 6 (1). Retrieved April 11,2009, fromhttp://www .ecrp.uiuc.edu/v6nllryan.html.
Sailor, W., Stowe, M. J., Turnbull, H. R., & Kleinhammer-Tramill, P. J. (2007). A casefor adding a social-behavioral standard to standards-based education with schoolwide positive behavior supports as its basis. Remedial and Special Education, 28(6),366-376.
Seidman, E., Aber, J. L., Allen, L., & French, S. E. (1996). The impact of the transition tohigh school on the self-system and perceived social context of poor urban youth.American Journal o/Community Psychology, 24 (4), 489-515.
92
Shadish, W. R., Cook, T. D., & Campbell, D. T. (2002). Experimental and quasiexperimental designs for generalized causal inference. New York: HoughtonMifflin.
Solberg, V. S., Carlstrom, A. H., Howard, K. A. S., & Jones, J. E. (2007). Classifying atrisk high school youth: The influence of exposure to community violence andprotective factors on academic and health outcomes. The Career DevelopmentQuarterly, 55 (June), 313-327.
Somers, C. L., & Piliawsky, M. (2004). Drop-out prevention among urban, africanamerican adolescents: Program evaluation and practical implications. PreventingSchool Failure, 48 (3), 17-22.
Stenhoff, D. M., & Lingugaris-Kraft, B. (2007). A review of the effects of peer tutoringon students with mild disabilities in secondary settings. Exceptional Children, 74(1),8-30.
Sugai, G. (2003). Commentary: establishing efficient and durable systems of schoolbased support. School Psychology Review, 32 (4),530-535.
Sugai, G., & Horner, R. (2002). Introduction to the special series on positive behaviorsupport in schools. Journal ofEmotional & Behavioral Disorders, 10 (3), 130135.
Sugai, G., Sprague, J. R., Horner, R. H., & Walker, H. M. (2000). Preventing schoolviolence: The use of office discipline referrals to assess and monitor school-widediscipline interventions. Journal ofEmotional and Behavioral Disorders, 8, 94101.
Suh, S., & Suh, J. (2007). Risk factors and levels of risk for high school dropouts.Professional School Counseling, 10 (3).
Suh, S., Suh, J., & Houston, E. (2007). Predictors of categorical at-risk high schooldropouts. Journal of Counseling and Development, 85 (Spring), 196-203.
Swanson, C. B., & Schneider, B. (1999). Students on the move: Residential andeducational mobility in America's schools. Sociology ofEducation, 72,54-67.
Tobin, T. J., & Sugai, G. M. (1999). Using sixth-grade school records to predict schoolviolence, chronic discipline problems, and high school outcomes. Journal ofEmotional and Behavioral Disorders, 7,40-53.
93
Todd, A. W., Campbell, A L., Meyer, G. G., & Homer, R. H. (2008). The effects of atargeted intervention to reduce problem behaviors: Elementary schoolimplementation of check in-check out. Journal ofPositive Behavior Intervention,10 (1), 46-55.
U.S. Census Bureau. (2006). School enrollment-social and economic characteristics ofstudents: October 2005. Detailed Tables. Table 1. Washington, DC: Author.Retrieved September 20, 2008, fromhttp://www.census.gov/population/www/socdemo/school/cps2005.htm!.
U.S. Department of Education. National Center for Education Statistics. (2007). Dropoutrates in the United States: 2005. Washington D.C.
U.S. Department of Justice. (2002). Correctional populations in the United States, 1998(NCJ-192929). Washington, DC: Government Printing Office.
Vaughn, S., Fletcher, J. M., Francis, D. J., Denton, C. A, Wanzek, J., Wexler, J., Cirino,P. T., Barth, A. E., & Romain, M. A. (2008). Response to intervention with olderstudents with reading difficulties. Learning and Individual Differences, 18,338345.
Yin, R. K. (2003). Case study research: Design and methods. (3rd ed.). Thousand Oaks,CA: Sage Publications.
Zepeda, S. J., & Mayers, R. S. (2006). An analysis of research on block scheduling.Reveiew of Educational Research, 76 (1),137-170.