a dynamic data driven wildland fire model
TRANSCRIPT

A Dynamic Data Driven Wildland Fire Model
The DDDAS Wildfire Team
Presented by Jonathan D. BeezleyUniversity of Colorado andNational Center of Atmospheric Research
ICCS’07May 2007
Supported by NSF under grants ACI-0325314, ACI-0324989, ACI 0324988, ACI-0324876, and ACI-0324910

The Wildfire DDDAS TeamUniversity of Colorado at Denver and Health Science CenterDepartment of Mathematical Sci.Jan Mandel (PI, Lead PI)Lynn Bennethum
(Co-PI)Leo Franca (Co-PI)Craig Johns (prior Co-PI)Tolya
Puhalskii
(prior Co-PI)Mingeong
Kim (graduate student)Vaibhav
Kulkarni
(graduate student)Jonathan Beezley
(graduate student)
National Center for Atmospheric ResearchJanice Coen (PI)
Texas A&M UniversityDept. of Computer ScienceGuan Qin
(PI)Wei
Zhao (prior PI)Jianjia
Wu (graduate student)
Rochester Institute of TechnologyCenter for Imaging ScienceAnthony Vodacek
(PI)Robert Kremens
(Co-PI)Ambrose Onoye
(postdoc)Ying Li (graduate student)Zhen Wang (graduate student)Matthew Weinstock
(undergrad. student)
University of KentuckyDept. of Computer ScienceCraig Douglas (PI)Deng Li (visiting scientist)Wei
Li (graduate student)Adam Zornes
(graduate student)Soham
Chakraborty
(graduate student)Jay Hatcher (graduate student)

The ObjectiveA Dynamic Data Driven Application System
(DDDAS) for
short-range forecasts of wildfire behavior with models steered by real-time weather data, fire-
mapping images, and sensor streams.

Goals
The modelfaster than real timecalibrated from measurements
Data assimilation: incorporate real data while the model is running
sparse data (weather stations)large image datasets (aerial photographs)data acquisition steeringdata arriving delayed and out of ordercapable of adjusting a highly nonlinear model
Real-time visualization over the internet in the field

Wildfire DDDAS Structure
Synthetic data
Map sources (GIS)
Fuel DataSensors, telemetry
Forecast
Weather
Fire
Model Observation function
Aerial imaging
Adjust Compare
Data Assimilation
Initial conditions
Weather data
Data Acquisition
Real data pool
Real time data
Interpret

Modular Software Structure: Major components are interchangeableModel1.
NCAR coupled weather-fire model2.
Standalone PDE fire model (new), coefficients calibrated from measurements3.
Fire model coupled with WRF atmospheric model (future)
Data Acquisition1.
Simulated data2.
Weather data3.
Autonomous Environmental Sensors4.
Aerial images preprocessed for fire location
Data Assimilation1.
Ensemble Kalman
Filter, improved efficiency2.
Improved morphing nonlinear filter (in progress)
Visualization1.
Matlab2.
Google Earth

The NCAR coupled weather-fire model

FIRE
Atmospheric Dynamics
ATMOSPHEREHeat, water vapor, smoke
Fire Propagation
NCAR’s Coupled Atmosphere –
Wildland Fire – Environment model (CAWFE)
FIRE ENVIRONMENT
Fuel moisture

The standalone PDE based wildfire model

Reduced chemical kineticsBalance of heatBalance of fuel supplyProduces a correct traveling combustion wave
The standalone PDE based wildfire model

Simple Standalone PDE Fire Model
1 2 3( ) ( ) (heat balance)
( ) (fuel balance)
aT Sk T c T c T T ct tS Sf Tt
∂ ∂= ∇ ∇ − ⋅∇ − − +
∂ ∂∂
= −∂
is the temperature is the fuel supply is the reaction rate function is the ambient temperature is white noise
i
a
TSfTσ
A simple model that however exhibits the correct qualitative behavior. Not captured yet: evaporation, multiple kinds of fuel and fire, interaction with atmosphere.

Numerical Method
Upwinded finite differencesTrapezoidal method in timeNewton-Krylov (GMRES) in each time stepPreconditioning by elimination of fuel variables eliminated at every node then FFTMesh size 2m, time step 1s

Time-Temperature Profiles
The profile is used to calibrate coefficients in the model.
1.125 1.175 1.225 1.275 1.325
x 104
0
200
400
600
800
1000
time(seconds)
Tem
pera
ture
(C)
•Solid line: computed
•Dashed line: measured by a sensor passed over by a wildfire (Kremens
et al,
2003)

Further development of the PDE Fire Model
Refine the modelconservation of heat in different kinds of fire (grass, brush, crown,…)conservation of mass in different kinds of fuel (grass,
sticks, logs…) conservation of water contents in the fuels (evaporation)Heat fluxes (convection, radiation) between the species. Non-local radiation transfer is expensive (integral operators).
Contemporary numerical methodsStabilized FEM, streamline diffusion, Discrete Galerkin..
Coupling with an atmospheric modelInput wind, output heat and vapor fluxes

Data Acquisition

Primarily for local weather…
but some burnovers
0
100
200
300
400
500
600
700
800
11250 11750 12250 12750 13250
seconds after ignition
tem
pera
ture
, C
Kremens, et al. 2003. Int. J. Wildland Fire
Data logger and thermocouples
Time (sec. after ignition)
T (oC)
Reconfigure to rapidly deployGPS - Position AwareVersatile Data InputsVoice or Data Radio telemetryInexpensive
Autonomous Environmental Detectors

Autonomous Environmental Sensors
positioned so as to provide weather conditions near a fire, aremounted at various heights above the ground on a pole with a ground spikewill survive burnovers by low intensity firesthe temperature and radiation measurements provide a direct indication of the firefront passage and the radiation measurement can also be used to determine the intensity of the firethe sensors transmit data and can be reprogrammed by radio

Wildfire Airborne Sensor Program (WASP)
High Performance Position Measurement SystemColor or Color Infrared
Camera• 4k x 4k pixel format• 12 bit quantization• High quality Kodak CCD
Fire Detection Cameras• 640 x 512 pixel format• 14 bit quantization• < 0.05K NEDT
•Position 5 m•Roll/Pitch 0.03 deg•Heading 0.10 deg
D. McKeownB. KremensM. Richardson
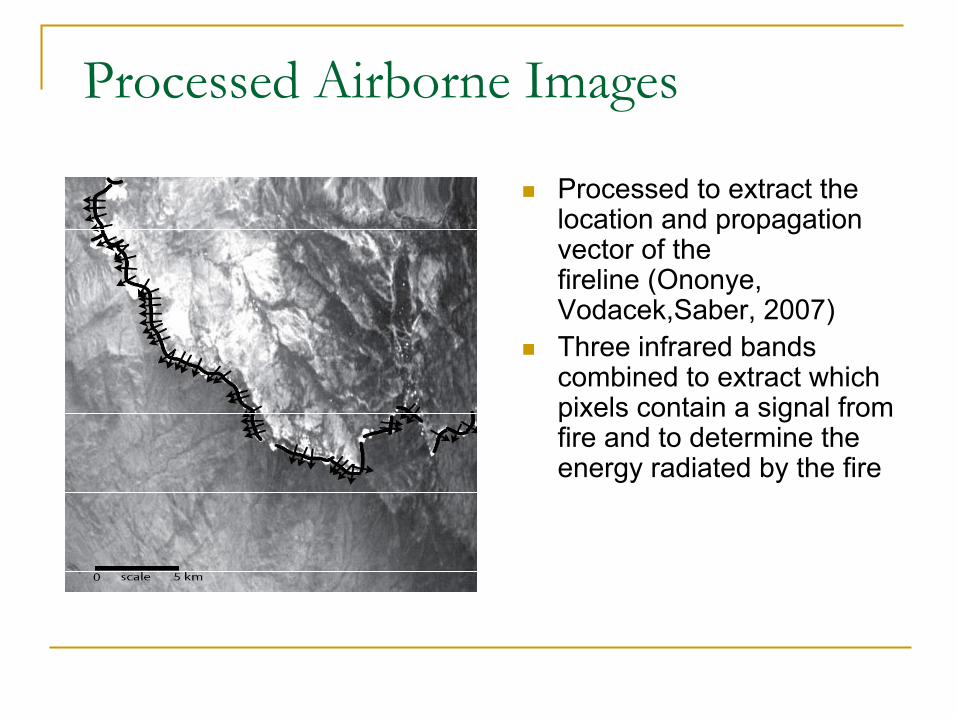
Processed Airborne Images
Processed to extract the location and propagation vector of thefireline (Ononye, Vodacek,Saber, 2007)Three infrared bands combined to extract which pixels contain a signal from fire and to determine the energy radiated by the fire

Data Assimilation

Ensemble Kalman
Filter (EnKF)Change the simulation state to balance two competing objectives:
The state should not change from the output of the model The state should match the data
The more uncertainty (bigger covariance) one of the conditions has, the more it can be violated (i.e., not be taken seriously) →Least squares
Equivalent to: minimize in the span of the ensemble the sum ofDifference from forecast meanDifference of the output of the observation function from the dataWeighted by the inverse of the covariance matrices
There are other variants. But: in all variants, the analysis ensemble is always a linear combination of the members of the forecast ensemble.
Dominant operations: advance ensemble members in time, embarrassingly paralleldense linear algebra (parallel, e.g., Scalapack)

But Ensemble Kalman
Filter fails for the wildfire problem
The analysis (=output) ensemble from EnKF is made only out of linear combinations of the forecast (=input) ensemble so if the forecast ensemble is not rich enough, the linear combination cannot approximate the analysis state well →nonphysical states
Probability distributions are strongly non-gaussian (burning/not burning)
Discrepancies are in the fireline position as well as in the intensity

What are we doing about it: New developments in EnKF
Prevent nonphysical states: Penalization, regularized EnKF
Nongaussian distribution: Predictor-corrector filters
Position errors: Morphing filters

2D Fire Data Assimilation with regularization The Reference solution
represents the truth. Data assimilation by a standard ENKF algorithm results in an unstable solution because of the nonlinear behavior of wildfire. Stabilization gives the regularized solution ENKF+reg. Without data assimilation, the solution would develop as in the Comparison; the data assimilation shifts the model towards the truth. The model state is a probability distribution, visualized in the two ENKF figures as the superposition of transparent temperature profiles of ensemble members.

Dealing with position errors: Morphing Ensemble Filters

Image registration and morphing
(Picture Gao and Sederberg, 1998)
0 1
interpolate between two maps: ( ) ( )given and , how to find ?solve minimization problem for registration distance
( , ) min ( )
can be done by multilevel optimization, reaT
f x f x Txf f g f T
d f g f I T g T T
λ λ= += =
= + − + +
sonably fast
The transformation is found automatically without any human input.

Automatic Morphing of Fire Positions

Morphing Ensemble Filter
Represent the ensemble members as morphs of one fixed state plus a residual:
run the EnKF on the morph mappings Tiand the residuals ri instead of the states uiAfter the members are advanced in time, use the previous morph mappings as a good initial guess.Now the EnKF can move the firelineeasily!
( ) ( )i i iu u r I T= + +

Data Assimilation by Morphing EnKF
X (m)
Y (
m)
0 100 200 300 400 5000
100
200
300
400
500
X (m)
Y (
m)
0 100 200 300 400 5000
100
200
300
400
500
X (m)
Y (
m)
0 100 200 300 400 5000
100
200
300
400
500
Forecast fire position (model output)
Data Analysis fire position (data accounted for, continue running the model)Instead of having linear combinations of the
states create a number of smaller fires, linear combinations of the transformed states move a single fire around.

Google Earth Visualization

To Do: Put it All Together and Test on a Real Fire
The morphing EnKF method works reliably now –integrate it into our production quality data assimilation frameworkIntegrate the data assimilation code with the real wildfire-atmosphere codeConnect the input with real-time data acquisition, under development separatelyIntegrate the output with Google Earth visualization Test on reanalysis of the Esperanza 2006 fire

Esperanza Fire, Riverside County, CA October 26, 2006
Satellite data Landsat image, false color obtained ~11:00 am, about 10 hours after the fire started
Aerial dataFireMapper images on Oct. 26, two on Oct 27, and one on Oct 28.Collaborator: Phil Rigganhttp://www.fireimaging.com
Weather:3 RAWS weather stations within the overall modeling domain, 10 RAWS stations in Riverside County http://raws.wrh.noaa.gov/roman/Archived global weather data
Other:Fuel maps, incident reports, daily fire perimeter maps, etc. (State of California, USDA Forest Service, etc.)
Landsat, ~11:00 am
FireMapper,11:17 am

Conclusion
Dynamic Data Driven Application System for wildfire modeling and prediction in progressHighly nonlinear system poses unique challenges in data assimilation and motivates new developments in data assimilation methodologyPractical needs drive new mathematical methodsCollaborative software developmentEmphasis on software validation and reliabilityCoupled atmosphere-fire model handles realistic firesMany components done, still need to put them togetherData assimilation works well on model fire problems