a field-to-desktop toolchain for x-ray ct densitometry ... mil et al 2016 - a... · mcculloh, 2014)...
TRANSCRIPT

A field-to-desktop toolchain for X-ray CT densitometry enables tree ring
analysis
Tom De Mil1,2,*, Astrid Vannoppen3, Hans Beeckman2, Joris Van Acker1 and Jan Van den Bulcke1
1UGCT-Woodlab-UGent, Ghent University, Laboratory of Wood Technology, Department of Forest and Water Management,Coupure Links 653, B- 9000 Gent, Belgium, 2Royal Museum for Central Africa, Wood Biology Service, Leuvensesteenweg 13,
B-3080 Tervuren, Belgium and 3University of Leuven, Division Forest, Nature and Landscape, Department of Earth andEnvironmental Sciences, Celestijnenlaan 200E, Box 2411, B-3001 Leuven, Belgium
*For correspondence. E-mail [email protected]
Received: 18 December 2015 Returned for revision: 16 February 2016 Accepted: 22 February 2016
� Background and Aims Disentangling tree growth requires more than ring width data only. Densitometry is con-sidered a valuable proxy, yet laborious wood sample preparation and lack of dedicated software limit the wide-spread use of density profiling for tree ring analysis. An X-ray computed tomography-based toolchain of tree incre-ment cores is presented, which results in profile data sets suitable for visual exploration as well as density-basedpattern matching.�Methods Two temperate (Quercus petraea, Fagus sylvatica) and one tropical species (Terminalia superba) wereused for density profiling using an X-ray computed tomography facility with custom-made sample holders and dedi-cated processing software.� Key Results Density-based pattern matching is developed and able to detect anomalies in ring series that can becorrected via interactive software.� Conclusions A digital workflow allows generation of structure-corrected profiles of large sets of cores in a shorttime span that provide sufficient intra-annual density information for tree ring analysis. Furthermore, visual explor-ation of such data sets is of high value. The dated profiles can be used for high-resolution chronologies and alsooffer opportunities for fast screening of lesser studied tropical tree species.
Key words: Cross-dating, high-resolution chronologies, densitometry, pattern matching, tree ring analysis, woodanatomy, wood density, X-ray CT, Quercus petraea, Fagus sylvatica, Terminalia superba.
INTRODUCTION
Quantifying the response of terrestrial vegetation to a globallychanging environment is essential to predict future forest distri-bution and diversity as well as to assess their role in the carbonbalance (Lewis et al., 2009; Martin and Thomas 2011). Thecombined action of intrinsic and environmental factors is re-sponsible for the unique structure of wood, which makes treerings important natural archives (Vaganov et al., 2006). Thereis an urgent need for more knowledge to increase our under-standing of wood formation under changing environments(Worbes, 2002; De Micco et al., 2012) which requires meth-odological improvements (Fonti et al., 2010). In addition toring width, wood density is a promising indicator. It is deter-mined by anatomical and chemical traits (Lachenbruch andMcCulloh, 2014) and is a key descriptor of wood (Chave et al.,2009). Wood density is defined as its mass divided by itsvolume, and can be seen as a proxy for carbon allocation perunit of volume (Muller-Landau, 2004; Plourde et al., 2015), asit reflects past climate conditions (Hughes, 2002; Buntgenet al., 2010) and is an important property for life history strat-egies (Preston et al., 2006; Swenson and Enquist, 2007; Poorteret al., 2010; Zanne et al., 2010).
Densitometry is used to quantify density variations that reachthe intra-ring level (Fritts, 1976). X-ray densitometry by means
of radiographies was developed by Polge (1966) and is, to-gether with other systems such as SilviScan (Evans, 1994),widely used as a basic technique for density profiling of tree in-crement cores. Derived parameters such as maximum latewooddensity (MXD) have proven to be more sensitive to climatethan tree ring width in high northern latitudes (Briffa et al.,1998). Features such as intra-annual density fluctuations can bedetected with densitometry (Gonzalez-Benecke et al., 2015)and are vital for monitoring response to short-term climaticchanges (Pilcher et al., 1990; Wimmer, 2002; Battipaglia et al.,2014), yet can be masked by averaging over the entire tree ringwidth (Rossi and Deslauriers, 2007). Such density profiles canbe used to match within and between individuals, similar tomatching ring width series, i.e. cross-dating. Density mighteven be more important than ring width itself in the matchingprocess (Polge, 1966, 1970; Allen et al., 2012; Drew et al.,2013). Traditionally, cross-dating is a fundamental principle ofdendrochronology where ring width series are matched andanomalies are detected in order to assign every ring to an exactcalendar year (Fritts, 1976). Next to several existing softwarepackages such as COFECHA (Holmes, 1983; Grissino-Mayer,2001), the eventual cross-dating is often dependent on personaljudgement (Pilcher et al., 1990) and is non-trivial in many re-gions (e.g. tropical and sub-tropical latitudes) and often difficultto reproduce (Wils et al., 2009) and to formalize. Density
VC The Author 2016. Published by Oxford University Press on behalf of the Annals of Botany Company.All rights reserved. For Permissions, please email: [email protected]
Annals of Botany Page 1 of 10
doi:10.1093/aob/mcw063, available online at www.aob.oxfordjournals.org
by guest on April 25, 2016
http://aob.oxfordjournals.org/D
ownloaded from

profiles thus offer a clear opportunity for improvement in thisrespect.
Throughout the years, the original idea postulated by Polge(1966), i.e. cross-dating using original density profiles, was onlypossible on a visual basis and on a limited number of samples.Furthermore, despite the potential high resolution, the classictechnique is costly, time-consuming and still labour-intensive,hampering fast data acquisition and thus the possibility for high-throughput automated tree ring analysis, although semi-auto-mated density-based delineations of ring width (Mothe et al.,1998) and density parameters (Koubaa et al., 2002) exist.Furthermore, due to increasing demand for incorporating othersources of information to disentangle tree growth, often involv-ing destructive analyses such as isotope measurements(Schollaen et al., 2014) or elemental analysis (Hietz et al.,2015), there is a need for digitally archiving structural data be-fore further analysis. There is an ongoing interest in developingnew methods for determining wood density in a more detailedand less time-consuming way (Mannes et al., 2007) and less de-pendent on physical manipulations. Recent techniques specific-ally reducing labour and time costs are high-frequencydensitometry (Schinker et al., 2003; Wassenberg et al., 2014)and medical X-ray computed tomography (X-ray CT)(Steffenrem et al., 2014). Blue intensity measurements based onoptical images are also being developed as a more cost-effectivemethod for MXD in conifers (Rydval et al., 2014). However, anintegrative approach of high-throughput density profiling com-bined with the application of software to apply full densitometryinformation for objective cross-dating is still lacking. In thisstudy, the Nanowood X-ray CT scanner developed at UGCT(Dierick et al., 2014) is used for high-throughput 3-D scanningof increment cores to obtain density profiles from pith to bark.De Ridder et al. (2011) and Van den Bulcke et al. (2014) elabo-rated on this technique for temperate and tropical species todemonstrate the possibility for tree ring analysis, taking into ac-count ring and grain directions to obtain structure-correcteddensity profiles.
The aim of this study was to establish an X-ray CT-basedfield-to-desktop toolchain for large sets of increment cores,with accompanying software routines that allow: (1) screeningand archiving of 3-D digital wood samples before any furtherphysical treatment, followed by batch processing of calibratedre-interpolated density profiles with minimum labour-input;and (2) automating the process of tree ring registration and for-malizing cross-dating through density-based pattern matchingof the profiles archived in (1), in order to detect anomalies andexplore data sets via built-in graph functions.
We demonstrate the approach by explaining the toolchain fortwo long-lived deciduous temperate species: sessile oak(Quercus petraea) and common beech (Fagus sylvatica), aswell as a tropical brevi-deciduous tree species limba(Terminalia superba).
MATERIALS AND METHODS
Quercus petraea, Fagus sylvatica and Terminalia superba in-crement cores (5 mm), drilled at breast height, were used fordensity profiling and tree ring analysis. A total of 46 cores fromQ. petraea and 46 cores from F. sylvatica were sampled (twocores per tree) in the winter of 2014 at different locations in the
South of Belgium. Forty-six T. superba cores (on average threecores per tree) were sampled at the end of the growing seasonin 2014 in the Luki Reserve, located in a semi-deciduous forestthat is part of the southernmost edge of the Mayombe forest(Democratic Republic of the Congo). All increment cores wereput in paper straws after sampling for ease of storage and label-ling, and remained unwrapped throughout the entire X-ray CTtoolchain. The samples were dried for 24 h at 103 6 1 �C andmounted in custom-made cardboard holders for scanning. Thecurrent set-up allows storage of up to 33 intact cores of variablelength (up to 50 cm) in one holder. A data sheet that links thesample label with position in the holder allows for batch extrac-tion, and metadata (site, co-ordinates, etc.) are included forarchiving. The sample holders with cores were scanned at aresolution of 110 lm using the NanoWood CT facility (Diericket al., 2014), developed in collaboration with XRE(www.XRE.be). A sample holder does not fully fit in the fieldof view and therefore the top and bottom part were scannedseparately, reconstructed (GPU GeForce GPX 770 4 GB) withthe Octopus reconstruction software package (Dierick et al.,2004; Vlassenbroeck et al., 2007; licensed by InsideMatters:www.insidematters.eu) and digitally stitched, resulting in a sin-gle greyscale volume of the entire sample holder. All routinesto process the greyscale volume, as elaborated in the Results,were written in MATLAB
VR
R2015a and are available as astand-alone package with a graphical user interface (GUI) andassociated graphs.
RESULTS
A flow-chart of the toolchain is given in Supplementary DataFig. S1. Several steps are executed as batch processes, as suchminimizing labour cost and increasing speed of analysis.
Screening and archiving
A total of 50 min scanning and 30 min reconstruction timeper cylinder are required. The reconstructed greyscale volumeof the entire sample holder is loaded in the toolbox; all coresare indicated on a cross-section and labelled automaticallybased on the data sheet (Fig. 1A). Each labelled core is then ex-tracted from the total greyscale volume and converted to wooddensity estimates by rescaling using a reference material withknown density (1400 kg m–3) and similar elemental compos-ition to wood (De Ridder et al., 2011), and air (1�2 kg m–3)(Fig. 1B). Wood density is thus defined as oven dry weight div-ided by oven dry volume. Each core density volume then needsto be oriented perpendicularly to the grain, which is essentialfor proper structure direction correction later on. This orienta-tion is automated as a two-step process including tilt and tan-gential alignment (Fig. 1C), avoiding tedious manual rotationof the object in three dimensions. The former aligns the coreaxis parallel to the x-axis of the global co-ordinate system. Thelatter rotates the core in the tangential plane according to theuser-indicated grain angle based on display previews throughthe core. Each core density volume is then stored as a single16-bit multipage TIFF file. These digital cores can thenbe loaded in the GUI, an extended version of the structurecorrection module described in Van den Bulcke et al. (2014),
Page 2 of 10 De Mil et al. — Densitometry toolchain for tree ring analysis
by guest on April 25, 2016
http://aob.oxfordjournals.org/D
ownloaded from
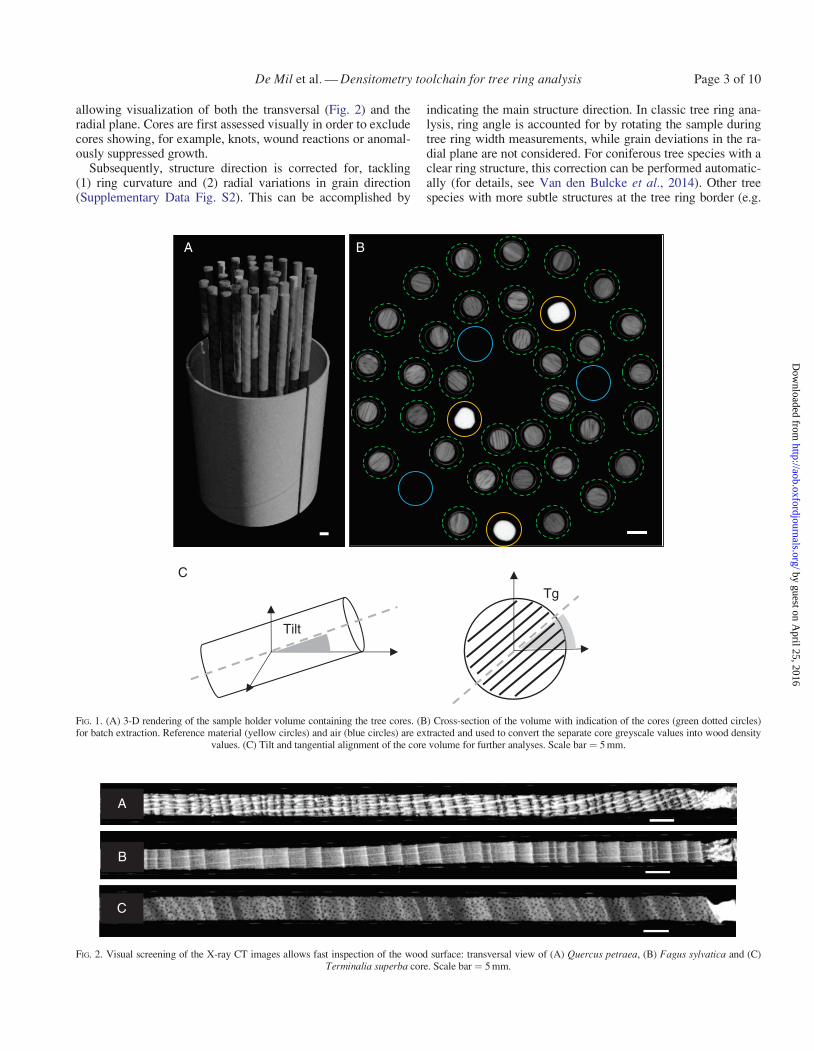
allowing visualization of both the transversal (Fig. 2) and theradial plane. Cores are first assessed visually in order to excludecores showing, for example, knots, wound reactions or anomal-ously suppressed growth.
Subsequently, structure direction is corrected for, tackling(1) ring curvature and (2) radial variations in grain direction(Supplementary Data Fig. S2). This can be accomplished by
indicating the main structure direction. In classic tree ring ana-lysis, ring angle is accounted for by rotating the sample duringtree ring width measurements, while grain deviations in the ra-dial plane are not considered. For coniferous tree species with aclear ring structure, this correction can be performed automatic-ally (for details, see Van den Bulcke et al., 2014). Other treespecies with more subtle structures at the tree ring border (e.g.
Tilt
A B
C
Tg
FIG. 1. (A) 3-D rendering of the sample holder volume containing the tree cores. (B) Cross-section of the volume with indication of the cores (green dotted circles)for batch extraction. Reference material (yellow circles) and air (blue circles) are extracted and used to convert the separate core greyscale values into wood density
values. (C) Tilt and tangential alignment of the core volume for further analyses. Scale bar¼ 5 mm.
A
B
C
FIG. 2. Visual screening of the X-ray CT images allows fast inspection of the wood surface: transversal view of (A) Quercus petraea, (B) Fagus sylvatica and (C)Terminalia superba core. Scale bar ¼ 5 mm.
De Mil et al. — Densitometry toolchain for tree ring analysis Page 3 of 10
by guest on April 25, 2016
http://aob.oxfordjournals.org/D
ownloaded from

tropical tree species) require manual indications. Once thestructure direction is indicated, a re-interpolated density profileis calculated excluding the paper straw and surrounding airusing a morphological operator (Supplementary Data Fig. S3).This approach will segment the wood volume from the back-ground, such that no manual cropping of the volume is neces-sary and all the density profiles are automatically extracted.Re-interpolated density profiles from pith to bark and the aver-age density trend are presented in Fig. 3 for the three wood spe-cies studied. For Q. petraea and F. sylvatica, a rather constantdensity from pith to bark is observed, while for T. superba anincreasing density occurs. These profiles can then be used toindicate tree rings automatically or to fine-tune manual indica-tions made in the GUI. This detection is based on a user-specified threshold for minima, maxima or inflection points inthe density profile, a decision which should be based on thetree ring boundary type (Worbes 1989): Q. petraea is a ring-porous species with tree ring boundaries defined by minimaldensity (early-onset wood vessels), while F. sylvatica andT. superba are diffuse-porous characterized by a clear densitypeak at the ring boundary. The maximum density is caused by adecrease in number of vessels for F. sylvatica, and smallerthick-walled fibres for T. superba. Errors can easily be removedinteractively and, if manual indications of the tree-ring bounda-ries already existed, a fine-tune function can be used to shift theindications to the extrema or inflections of the density profile.
A smoothing filter can be applied to each density profile inorder to reduce high frequency details originating from woodanatomical features such as, for example, abrupt changes be-tween vessels/parenchyma and fibres and crystals. Flatbedimages serve as a complementary archive and can easily becoupled to the X-ray images (Supplementary Data Fig. S4).
Tree ring analysis
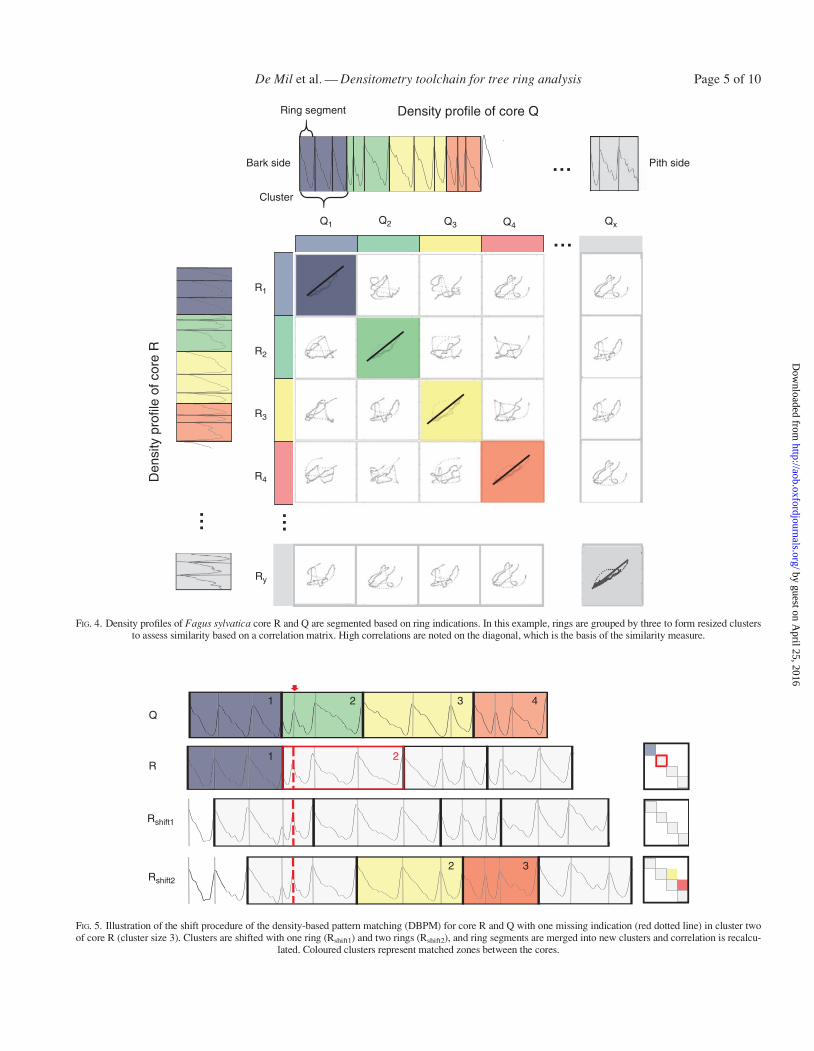
Density-based pattern matching (DBPM) is illustrated fortwo F. sylvatica core profiles, referred to as R and Q (Fig. 4),but is analogous for comparison of multiple cores. For eachcore, tree ring boundaries, manually or automatically indicatedin the GUI, are used to divide the density profile into separatering density profiles. Subsequently, these consecutive ring pro-files are merged into clusters with a user-specified size.Clustering thus allows the inclusion of sufficient density
information in order to reduce the number of false positiveswhile matching. All cluster sequences are correlated usingPearson correlation. This requires resizing of the clusters toequal length and standardizing density, emphasizing relativedifferences in wood density, rather than absolute differences.The DBPM starts arbitrarily on the bark side. If tree rings areindicated properly, i.e. without any false or missing rings andcross-dated, high correlations will appear on the diagonal of theR–Q correlation matrix, which is a similarity measure reflectingthe mutual structural synchronicity along the growth axis. Toaccount for false/missing rings or errors in ring indications (fur-ther referred to as anomalies), a method is proposed where ringsegments are shifted and re-clustered, followed by a recalcu-lation of the correlation matrix. Figure 5 illustrates the proced-ure for the same two cores as in Fig. 4, with a missingindication in the second cluster of core R. The initial situation,without any shifts, will only cause matching of the first clusterof Q and R. All further clusters from Q and R cannot bematched due to the anomaly. The maximum shift is cluster size1 because the initial situation is re-attained when the number ofshifts equals the cluster size. After shifting one ring (Rshift1), noclusters are correlated any longer with Q because the positionsare moved. Shifting two ring segments (Rshift2) results in amatch for the third and the fourth cluster of core Q with the se-cond and third cluster of core R. Evaluating all shifts results inlocalization of the cluster that contains the error. The approachthus allows the location of all ring indications based on densityand leads to actual matching (cross-dating) by tracking theanomalies and removing them using the GUI. False rings orerrors in ring indications can be interactively removed. Missingrings are marked and labelled in the GUI and will be accountedfor in further analysis. Broken cores, cracks, scars and otherartefacts can be labelled in order to exclude these for furtherprocessing (Supplementary Data Fig. S5). Different samplingdates are accounted for during the DBPM procedure.
The software allows DBPM parameters and the associatedplots to be verified with classic ring width curves and tree ringdescriptive statistics such as the corrected Gleichl€aufigkeit cri-terion (Buras and Wilmking, 2015) (Supplementary Data Fig.S6). Simultaneously, core volumes are loaded in the GUI to re-move/add rings, depending on the above-mentioned assessmentprocedure, after which all statistics are updated. Once all coresare cross-dated, a batch operation exports the density profiles,
1000A B C900
800
700
600
500
400
300
200
100
0
1000
900
800
700
600
500
400
300
200
100
0
1000
900
800
700
600
500
400
300
200
100
0Pith
Woo
d de
nsity
(kg
m–3
)
Bark Pith Bark Pith Bark
FIG. 3. Averaged wood density trend (smoothed line, error bands show 1 s.e.) and single density profile from pith to bark for (A) Quercus petraea, (B) Fagus sylva-tica and (C) Terminalia superba. The latter shows an increase in density from pith to bark. Magnification of a single ring illustrates the tree ring boundary type.
Page 4 of 10 De Mil et al. — Densitometry toolchain for tree ring analysis
by guest on April 25, 2016
http://aob.oxfordjournals.org/D
ownloaded from
Ring segment
Pith side
Density profile of core Q
Den
sity
pro
file
of c
ore
RBark side
Cluster
Q1
R1
R2
R3
R4
Ry
Q2 Q3 Q4 Qx
FIG. 4. Density profiles of Fagus sylvatica core R and Q are segmented based on ring indications. In this example, rings are grouped by three to form resized clustersto assess similarity based on a correlation matrix. High correlations are noted on the diagonal, which is the basis of the similarity measure.
Rshift1
R
Q1
1 2
2 3
2 3
4
Rshift2
FIG. 5. Illustration of the shift procedure of the density-based pattern matching (DBPM) for core R and Q with one missing indication (red dotted line) in cluster twoof core R (cluster size 3). Clusters are shifted with one ring (Rshift1) and two rings (Rshift2), and ring segments are merged into new clusters and correlation is recalcu-
lated. Coloured clusters represent matched zones between the cores.
De Mil et al. — Densitometry toolchain for tree ring analysis Page 5 of 10
by guest on April 25, 2016
http://aob.oxfordjournals.org/D
ownloaded from
associated ring width series and derived parameters such asmean density per ring or MXD for use in other statistical or treering analysis software packages. During the procedure, the usercan visually assess multiple profiles simultaneously.
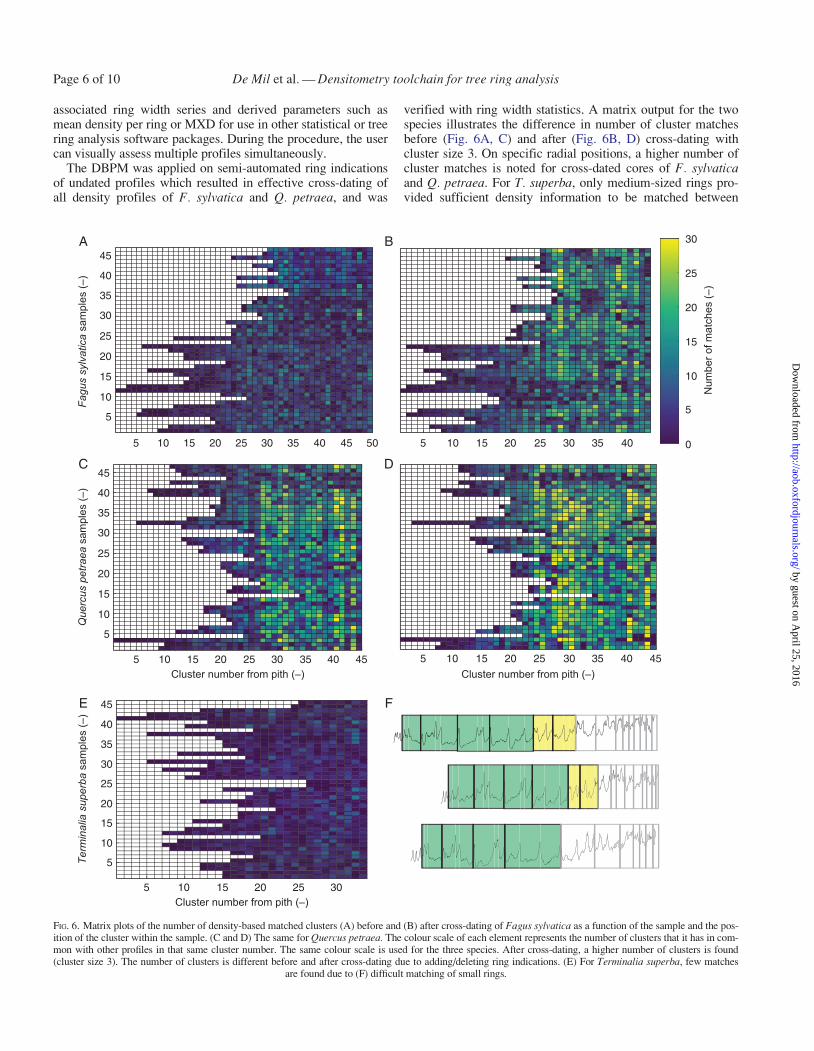
The DBPM was applied on semi-automated ring indicationsof undated profiles which resulted in effective cross-dating ofall density profiles of F. sylvatica and Q. petraea, and was
verified with ring width statistics. A matrix output for the twospecies illustrates the difference in number of cluster matchesbefore (Fig. 6A, C) and after (Fig. 6B, D) cross-dating withcluster size 3. On specific radial positions, a higher number ofcluster matches is noted for cross-dated cores of F. sylvaticaand Q. petraea. For T. superba, only medium-sized rings pro-vided sufficient density information to be matched between
Cluster number from pith (–) Cluster number from pith (–)
Fagu
s sy
lvat
ica
sam
ples
(–)
45A B
C D
E F
40
35
30
25
20
15
10
5
5 10 15 20 25 30 35 40 5 10 15 20 25 30 35 4045 50
Num
ber o
f mat
ches
(–)
Que
rcus
pet
raea
sam
ples
(–)
Cluster number from pith (–)
Term
inal
ia s
uper
ba s
ampl
es (–
)
30
25
20
15
10
5
0
45
40
35
30
25
20
15
10
5
45
40
35
30
25
20
15
10
5
5 10 15 20 25 30
5 10 15 20 25 30
35 40 45 5 10 15 20 25 30 35 40 45
FIG. 6. Matrix plots of the number of density-based matched clusters (A) before and (B) after cross-dating of Fagus sylvatica as a function of the sample and the pos-ition of the cluster within the sample. (C and D) The same for Quercus petraea. The colour scale of each element represents the number of clusters that it has in com-mon with other profiles in that same cluster number. The same colour scale is used for the three species. After cross-dating, a higher number of clusters is found(cluster size 3). The number of clusters is different before and after cross-dating due to adding/deleting ring indications. (E) For Terminalia superba, few matches
are found due to (F) difficult matching of small rings.
Page 6 of 10 De Mil et al. — Densitometry toolchain for tree ring analysis
by guest on April 25, 2016
http://aob.oxfordjournals.org/D
ownloaded from
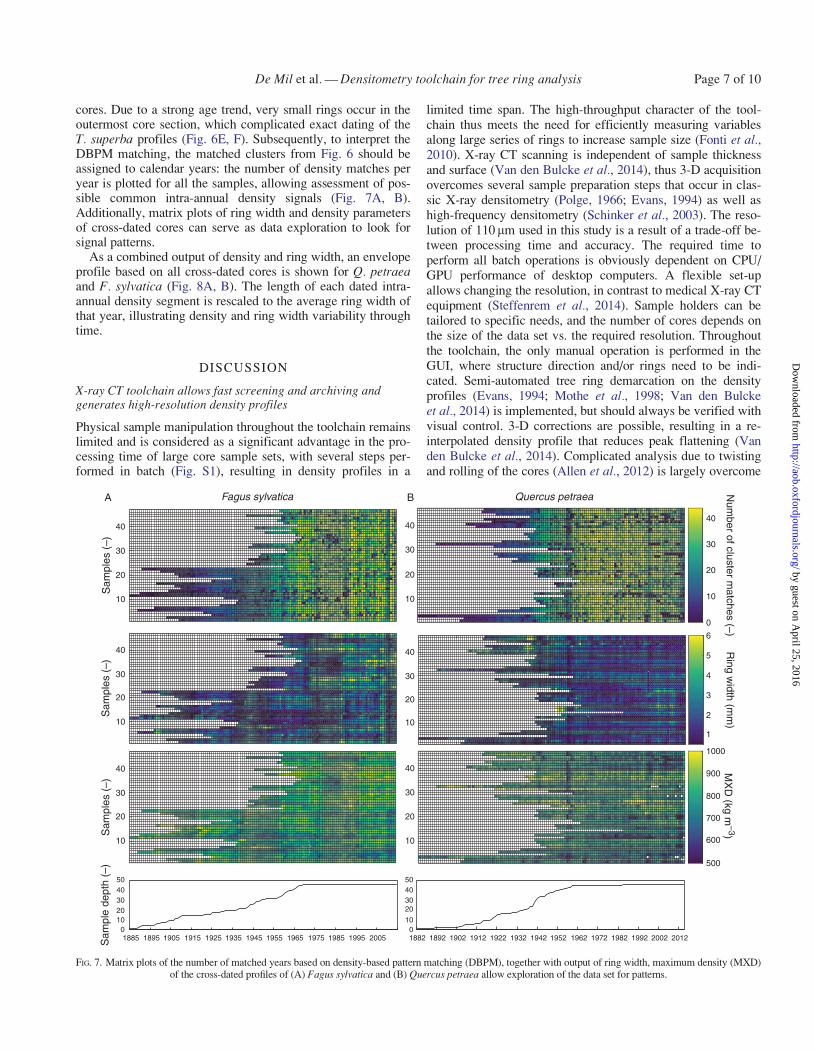
cores. Due to a strong age trend, very small rings occur in theoutermost core section, which complicated exact dating of theT. superba profiles (Fig. 6E, F). Subsequently, to interpret theDBPM matching, the matched clusters from Fig. 6 should beassigned to calendar years: the number of density matches peryear is plotted for all the samples, allowing assessment of pos-sible common intra-annual density signals (Fig. 7A, B).Additionally, matrix plots of ring width and density parametersof cross-dated cores can serve as data exploration to look forsignal patterns.
As a combined output of density and ring width, an envelopeprofile based on all cross-dated cores is shown for Q. petraeaand F. sylvatica (Fig. 8A, B). The length of each dated intra-annual density segment is rescaled to the average ring width ofthat year, illustrating density and ring width variability throughtime.
DISCUSSION
X-ray CT toolchain allows fast screening and archiving andgenerates high-resolution density profiles
Physical sample manipulation throughout the toolchain remainslimited and is considered as a significant advantage in the pro-cessing time of large core sample sets, with several steps per-formed in batch (Fig. S1), resulting in density profiles in a
limited time span. The high-throughput character of the tool-chain thus meets the need for efficiently measuring variablesalong large series of rings to increase sample size (Fonti et al.,2010). X-ray CT scanning is independent of sample thicknessand surface (Van den Bulcke et al., 2014), thus 3-D acquisitionovercomes several sample preparation steps that occur in clas-sic X-ray densitometry (Polge, 1966; Evans, 1994) as well ashigh-frequency densitometry (Schinker et al., 2003). The reso-lution of 110 lm used in this study is a result of a trade-off be-tween processing time and accuracy. The required time toperform all batch operations is obviously dependent on CPU/GPU performance of desktop computers. A flexible set-upallows changing the resolution, in contrast to medical X-ray CTequipment (Steffenrem et al., 2014). Sample holders can betailored to specific needs, and the number of cores depends onthe size of the data set vs. the required resolution. Throughoutthe toolchain, the only manual operation is performed in theGUI, where structure direction and/or rings need to be indi-cated. Semi-automated tree ring demarcation on the densityprofiles (Evans, 1994; Mothe et al., 1998; Van den Bulckeet al., 2014) is implemented, but should always be verified withvisual control. 3-D corrections are possible, resulting in a re-interpolated density profile that reduces peak flattening (Vanden Bulcke et al., 2014). Complicated analysis due to twistingand rolling of the cores (Allen et al., 2012) is largely overcome
40
A BFagus sylvatica Quercus petraea
30
20
10
4040
Num
ber of cluster matches (–)
Sam
ples
(–)
Sam
ples
(–)
Sam
ples
(–)
Sam
ple
dept
h (–
)
Ring w
idth (mm
)M
XD
(kg m–3)
30
20
10
0
6
5
4
3
2
1
1000
900
800
700
600
500
30
20
10
40
30
20
10
40
30
20
10
40
30
20
10
40
30
20
10
50403020100
50403020
100
1885 1895 1905 1915 1925 1935 1945 1955 1965 1975 1985 1995 2005 1882 1892 1902 1912 1922 1932 1942 1952 1962 1972 1982 1992 2002 2012
FIG. 7. Matrix plots of the number of matched years based on density-based pattern matching (DBPM), together with output of ring width, maximum density (MXD)of the cross-dated profiles of (A) Fagus sylvatica and (B) Quercus petraea allow exploration of the data set for patterns.
De Mil et al. — Densitometry toolchain for tree ring analysis Page 7 of 10
by guest on April 25, 2016
http://aob.oxfordjournals.org/D
ownloaded from

here due to software corrections, since several alignments andstructure corrections are implemented. Wood density is directlycalculated using a reference material and air, allowing accuratevalues to be obtained (De Ridder et al., 2011) and still avoidingthe need for calibration functions as in high-frequency densi-tometry (Wassenberg et al., 2014). Consequently, reliabletrends of wood density can be pictured for many cores in a fastand efficient way (Fig. 3). Extractives and minerals can influ-ence the density profile (Vansteenkiste et al., 2007), althoughfor our study species these problems did not occur due to lowextractive contents. Species with an extractive content that af-fects the density profile (Grabner et al., 2005) can be extractedwith solvents before scanning.
Density-based pattern matching as a suitable parameter forcross-dating
This study is innovative in its goal to use intra-annual densityprofiles to tackle the challenge of cross-dating, instead of evalu-ating ring averages of derived density parameters (Allen et al.,2012; Drew et al., 2013). The presented DBPM is a formaliza-tion of the classic cross-dating procedure, as the matching relieson higher resolution parameters. The approach of shifts to lo-cate dating errors presented herein is comparable with the meth-odology of shorter segments applied on ring widths inCOFECHA (Holmes, 1983; Grissino-Mayer, 2001), yet densityprofiling allows for shorter series, as more information is avail-able per ring (Fig. 4). This study uses Pearson correlation as asimilarity measure, but other similarity measures can also beimplemented. Although density and ring width matching aredifficult to compare, both parameters are complementary in the
final evaluation of cross-dating quality; therefore, classic ringwidth parameters are also considered.
It is shown that profiles at 110 lm resolution provide suffi-cient intra-annual density information for screening the studiedsamples for cross-dating quality. Moreover, the nature of theDBPM method implies that significantly small rings, not visibleon the density profile on this resolution, can be detected bymeans of DBPM shifting, similarly to anomalies, thus reducingthe effect of resolution on the matching (Fig. 5). Synchronousdensity matches (Fig. 6) offer scope for further exploration ofthe data set. The simultaneous matrix output of density and ringwidth parameters allows checking for patterns in the data set(Fig. 7).
The limited number of matches for T. superba (Fig. 6E, F) isdue to a significant growth trend where ring widths tend to de-crease drastically at higher age, which complicates matchingdue to insufficient intra-annual information. Moreover, due to adominating proportion of vessels and parenchyma, local densityvariations in these very narrow rings make them less clear to-ward the bark side (Schongart et al., 2006). The anatomical pat-tern of ring boundaries formed during senescent growth can beinsufficient for reliable demarcation (Stahle 1999), which iscertainly true for T. superba, due to its pioneer character andthe large number of senescent trees in the data set. The intrinsicbiological nature of the wood structure thus limits the use of thetechnique (Cherubini et al., 2013). It is unlikely that rings willbe better detected at a higher resolution, unless the resolutionattains the anatomically resolving threshold, and stem disksshould be used to account for wedging rings (Groenendijket al., 2014). Rejection of large sets of cores is reported in trop-ical regions (Schongart et al., 2006), mostly after the time-
1000
A B
900
800
700
600
500
2003
2004
2005
2006
2007
2008
2009
2010
2011
2012
2013
2014
2003
2004
2005
2006
2007
2008
2009
2010
2011
2012
2013
2014
Woo
d de
nsity
(kg
m–3
)
400
300
200
100
0
5040
Sam
ple
dept
h (–
)
3020100
50403020100
51 67 84 100 117 133 150 166 183 199 216 232 249 26522 39 55 72 88 105 121 138 154 171 187 204 220 237 254 270 287
Distance along growth axis (mm) Distance along growth axis (mm)
1000
900
800
700
600
500
400
300
200
100
0
FIG. 8. Envelope profile of (A) Fagus sylvatica and (B) Quercus petraea profiles visualizes ring width and density variation. Error bands show 1 s.e.
Page 8 of 10 De Mil et al. — Densitometry toolchain for tree ring analysis
by guest on April 25, 2016
http://aob.oxfordjournals.org/D
ownloaded from

consuming process of cross-dating. DBPM can reject series atan early stage, making tedious dating trials unnecessary.Compared with ring width matching, more series might bewithheld based on density parameters (Drew et al., 2013), thusincreasing sample size for further analysis of these difficultspecies.
Many authors do not profoundly discuss the cross-dating pro-cess, especially for tropical species, which makes it difficult toassess their work (Wils et al., 2009). The digital X-ray/flatbedimage archive together with the ring indications and profilespresented here ensures that all steps in the cross-dating processcan easily be checked and re-assessed. Matrix plots are used fordata exploration as they are a powerful tool for visually assess-ing sample quality. Typical output parameters (e.g. ring widthand MXD; Fig. 7) can be imported in conventional softwarepackages or in other open source tree ring analysis software(Bunn, 2010) to assess the link with climate. After cross-dating,the user can focus on certain sections containing features suchas intra-annual density fluctuations which can, when shown tobe synchronous, be considered as characteristic years. Suchyears can be spotted and, due to the flexible set-up, processedfor detailed anatomical studies with dedicated sample holders.A guided approach of additional scans of particular regions ofinterest is possible with resolution up to 35 lm (Vanden Bulcke et al., 2014) and eventually to the anatomicallyresolvable level (Van den Bulcke et al., 2009) (SupplementaryData Fig. S7).
Conclusion
A non-destructive X-ray CT-based screening procedure ispresented, going from field to desktop while reducing sampletreatment and analysis time. Many research disciplines arefocusing on sampling tree cores for densitometry and/or treering analysis, but classic methods are time-consuming, so ob-taining data without reducing accuracy is essential. In-house-developed software routines treat all data from input (treecores) to output (dated density profiles). Several batchprocesses are implemented in the toolchain, minimizing manualeffort. Moreover, wood density is determined by rescaling witha reference material.
In contrast to classic X-ray densitometry or high-frequencydensitometry, no physical surface treatment is necessary, andcores can be scanned immediately after drying. The digital ap-proach avoids the time needed to surface or microtome the sam-ples, and allows the screening and selection of large sets ofcores. Since many tropical tree species remain poorly studiedfor their dendrochronological potential, the toolchain allowsscreening of large sets of cores for such species. It should benoted that not all tropical species might show sufficient densityvariations at the ring boundaries to be detected with X-ray CT,which will require surface treatment followed by careful exam-ination of the ring boundaries via classic light microscopy.
High-throughput profiling in combination with exploratorytools such as DBPM with associated plots is necessary toestablish high-resolution chronologies, which is complementaryto other techniques that allow incorporation of detailed anatom-ical, chemical and isotope information (Fonti et al., 2010;Schollaen et al., 2014; Hietz et al., 2015) within tree ring
boundaries. The dated density profiles can be furthersynchronized at the intra-annual level by means of alignment ofintra-annual profiles once all cores are cross-dated (Benderet al., 2012).
The toolchain enables cross-dating entirely based on batch-generated X-ray CT profiles, which is a new approach in den-drochronology. The obtained similarity, i.e. a correlation-basedsimilarity criterion of density information, is a robust and ob-jective method in the decision-making process of cross-dating,which can improve tree ring analysis for species that are moredifficult to match and include more cores in the overallanalysis.
This study aims at filling a methodological gap concerningthe integrative approach of tree ring analysis and more continu-ous proxies such as density profiles, and illustrates how an X-ray CT-based toolchain with minimal labour input results in adigital archive and data exploration via pattern matching.
SUPPLEMENTARY DATA
Supplementary data are available online at www.aob.oxfordjournals.org and consist of the following. Figure S1: workflow ofthe X-ray CT toolchain for densitometry and correspondingtree ring analysis. Figure S2: screenshot of ring and grain anglecorrection on a Terminalia superba core. Figure S3: segmentingthe wood volume from background. Figure S4: graphical userinterface to include optical images. Figure S5: screenshot withring indications that are altered, with functions for missing ringsand broken cores. Figure S6: density-based pattern matchingvisualizations together with ring width descriptive statistics.Figure S7: screening (110 lm) of increment cores as a first stepfor detailed analysis at higher resolution (4 lm).
ACKNOWLEDGEMENTS
We thank the INERA RDC staff for providing the research in-frastructure in the Luki reserve of the Democratic Republic ofthe Congo, especially B. Angoboy Ilondea and J.-B. NdungaLoli-Di-Tubenzi. WWF-RDC provided logistic support. H.Grissino-Mayer inspired us, via the tips on his personal web-site (http://web.utk.edu/�grissino/), in handling and storingincrement cores in paper straws. This work was funded by theSpecial Research Fund PhD scholarship from GhentUniversity. Field work was partially financed by a grant pro-vided by the Leopold III fund for Nature Exploration andConservation.
LITERATURE CITED
Allen K, Drew DM, Downes GM, Evans R, Baker P, Grose M. 2012. Ringwidth, climate and wood density relationships in two long-lived Tasmaniantree species. Dendrochronologia 30: 167–177.
Battipaglia G, De Micco V, Brand WA, et al. 2014. Drought impact on wateruse efficiency and intra-annual density fluctuations in Erica arborea on Elba(Italy). Plant, Cell and Environment 37: 382–391.
Bender BJ, Mann M, Backofen R, Spiecker H. 2012. Microstructure align-ment of wood density profiles: an approach to equalize radial differences ingrowth rate. Trees 26: 1267–1274.
Briffa KR, Schweingruber FH, Jones PD, Osborn TJ, Shiyatov SG,
Vaganov EA. 1998. Reduced sensitivity of recent tree-growth to tempera-ture at high northern latitudes. Nature 391: 678–682.
De Mil et al. — Densitometry toolchain for tree ring analysis Page 9 of 10
by guest on April 25, 2016
http://aob.oxfordjournals.org/D
ownloaded from

Bunn AG. 2010. Statistical and visual crossdating in R using the dplR library.Dendrochronologia 28: 251–258.
Buntgen U, Frank D, Trouet V, Esper J. 2010. Diverse climate sensitivity ofMediterranean tree-ring width and density. Trees 24: 261–273.
Buras A, Wilmking M. 2015. Correcting the calculation of Gleichl€aufigkeit.Dendrochronologia 34: 29–30.
Chave J, Coomes D, Jansen S, Lewis SL, Swenson NG, Zanne AE. 2009.
Towards a worldwide wood economics spectrum. Ecology Letters 12:351–366.
Cherubini P, Humbel T, Beeckman H, et al. 2013. Olive tree-ring problematicdating: a comparative analysis on Santorini (Greece). PLoS One 8: 1–5.
De Micco V, Battipaglia G, Brand WA, et al. 2012. Discrete versus continuousanalysis of anatomical and d13C variability in tree rings with intra-annualdensity fluctuations. Trees 26: 513–524.
De Ridder M, Van den Bulcke J, Vansteenkiste D, et al. 2011. High-resolutionproxies for wood density variations in Terminalia superba. Annals ofBotany 107: 293–302.
Dierick M, Van Loo D, Masschaele B, et al. 2014. Recent micro-CT scannerdevelopments at UGCT. Nuclear Instruments and Methods in PhysicsResearch Section B: Beam Interactions with Materials and Atoms 324:35–40.
Dierick M, Masschaele B, Van Hoorebeke L. 2004. Octopus, a fast and user-friendly tomographic reconstruction package developed in LabView
VR
.Measurement Science and Technology 15: 1366–1370.
Drew DM, Allen K, Downes GM, Evans R, Battaglia M, Baker P. 2013.
Wood properties in a long-lived conifer reveal strong climate signals wherering-width series do not. Tree Physiology 33: 37–47.
Evans R. 1994. Rapid measurement of the transverse dimensions of tracheids inradial wood sections from Pinus radiata. Holzforschung 48: 168–172.
Fonti P, Von Arx G, Garc�ıa-Gonz�alez I, et al. 2010. Studying global changethrough investigation of the plastic responses of xylem anatomy in treerings. New Phytologist 185: 42–53.
Fritts HC. 1976. Tree rings and climate. New York: Academic Press.Gonzalez-Benecke CA, Riveros-Walker AJ, Martin TA, Peter GF. 2015.
Automated quantification of intra-annual density fluctuations using micro-density profiles of mature Pinus taeda in a replicated irrigation experiment.Trees 29: 185–197.
Grabner M, Muller U, Gierlinger N, Wimmer R. 2005. Effects of heartwoodextractives on mechanical properties of larch. IAWA Journal 26: 211–220.
Grissino-Mayer HD. 2001. Evaluating crossdating accuracy: a manual and tutor-ial for the computer program COFECHA. Tree-Ring Research 57: 205–221.
Groenendijk P, Sass-Klaassen U, Bongers F, Zuidema PA. 2014. Potential oftree-ring analysis in a wet tropical forest: a case study on 22 commercialtree species in Central Africa. Forest Ecology and Management 323: 65–78.
Hietz P, Horsky M, Prohaska T, Lang I, Grabner M. 2015. High-resolutiondensitometry and elemental analysis of tropical wood. Trees 29: 487–497.
Holmes RL. 1983. Computer-assisted quality control in tree-ring dating andmeasurement. Tree-Ring Bulletin 43: 69–78.
Hughes MK. 2002. Dendrochronology in climatology – the state of the art.Dendrochronologia 20: 95–116.
Koubaa A, Zhang SYT, Makni S. 2002. Defining the transition from earlywoodto latewood in black spruce based on intra-ring wood density profiles fromX-ray densitometry. Annals of Forest Science 59: 511–518.
Lachenbruch B, McCulloh KA. 2014. Traits, properties, and performance: howwoody plants combine hydraulic and mechanical functions in a cell, tissue,or whole plant. New Phytologist 204: 747–764.
Lewis SL, Lopez-Gonzalez G, Sonke B, et al. 2009. Increasing carbon storagein intact African tropical forests. Nature 457: 1003–1006.
Mannes D, Lehmann E, Cherubini P, Niemz P. 2007. Neutron imaging versusstandard X-ray densitometry as method to measure tree-ring wood density.Trees 21: 605–612.
Martin AR, Thomas SC. 2011. A reassessment of carbon content in tropicaltrees. PLoS One 6: e23533.
Mothe F, Duchanois G, Zannier B, Leban J-M. 1998. Analyse microdensito-metrique appliquee au bois: methode de traitement des donnees utilisee �al’INRA-ERQB (programme Cerd). Annales des Sciences Forestieres 55:301–313.
Muller-Landau HC. 2004. Interspecific and inter-site variation in wood specificgravity of tropical trees. Biotropica 36: 20–32.
Pilcher JR, Schweingruber FH, Kairi�uk�stis L, et al. 1990. Primary data. In:Cook ER, Kairi�uk�stis L, eds. Methods of dendrochronology. Dordrecht, TheNetherlands: Kluwer, 23–96.
Plourde BT, Boukili VK, Chazdon RL. 2015. Radial changes in wood specificgravity of tropical trees: inter- and intraspecific variation during secondarysuccession. Functional Ecology 29: 111–120.
Polge H. 1966. �Etablissement des courbes de variation de la densite du bois parexploration densitometrique de radiographies d’echantillons preleves �a latariere sur des arbres vivants. Applications dans les domaines technologiqueet physiologique. Annales des Sciences Forestieres 23: 215.
Polge H. 1970. The use of X-ray densitometric methods in dendrochonology.Tree-Ring Bulletin 30: 1–10.
Poorter L, McDonald I, Alarc�on A, et al. 2010. The importance of wood traitsand hydraulic conductance for the performance and life history strategies of42 rainforest tree species. New Phytologist 185: 481–492.
Preston KA, Cornwell WK, DeNoyer JL. 2006. Wood density and vessel traitsas distinct correlates of ecological strategy in 51 California coast rangeangiosperms. New Phytologist 170: 807–818.
Rossi S, Deslauriers A. 2007. Intra-annual time scales in tree rings.Dendrochronologia 25: 75–77.
Rydval M, Larsson L-A, McGlynn L, Gunnarson BE, et al. 2014. Blue inten-sity for dendroclimatology: should we have the blues? Experiments fromScotland. Dendrochronologia 32: 191–204.
Schinker M, Hansen N, Spiecker H. 2003. High-frequency densitometry – anew method for the rapid evaluation of wood density variations. IAWAJournal 24: 231–239.
Schollaen K, Heinrich I, Helle G. 2014. UV-laser-based microscopic dissectionof tree rings – a novel sampling tool for d 13C and d 18O studies. NewPhytologist 201: 1045–1055.
Schongart J, Orthmann B, Hennenberg KJ, Porembski S, Worbes M. 2006.
Climate–growth relationships of tropical tree species in West Africa andtheir potential for climate reconstruction. Global Change Biology 12:1139–1150.
Stahle DW. 1999. Useful strategies for the development of tropical tree-ringchronologies. IAWA Journal 20: 249–253.
Steffenrem A, Kvaalen H, Dalen KS, Høibø OA. 2014. A high-throughput X-ray-based method for measurements of relative wood density from unpre-pared increment cores from Picea abies. Scandinavian Journal of ForestResearch 29: 506–514.
Swenson NG, Enquist BJE. 2007. Ecological and evolutionary determinants ofa key plant functional trait: wood density and its community. AmericanJournal of Botany 94: 451–459.
Vaganov E, Hughes M, Shashkin A. 2006. Growth dynamics of conifer treerings. Images of past and future environments. Berlin: Springer-Verlag.
Van den Bulcke J, Boone MN, Van Acker J, Stevens M, Van Hoorebeke L.
2009. X-ray tomography as a tool for detailed anatomical analysis. Annalsof Forest Science 66: 508.
Van den Bulcke J, Wernersson ELG, Dierick M, et al. 2014. 3D tree-ring ana-lysis using helical X-ray tomography. Dendrochronologia 32: 39–46.
Vansteenkiste D, Van Acker J, Stevens M, Le Thiec D, Nepveu G. 2007.
Composition, distribution and supposed origin of mineral inclusions in ses-sile oak wood – consequences for microdensitometrical analysis. Annals ofForest Science 64: 11–19.
Vlassenbroeck J, Dierick M, Masschaele B, Cnudde V, Van Hoorebeke L,
Jacobs P. 2007. Software tools for quantification of X-ray microtomogra-phy at the UGCT. Nuclear Instruments and Methods in Physics Research,Section A: Accelerators, Spectrometers, Detectors and AssociatedEquipment 580: 442–445.
Wassenberg M, Montwe D, Kahle H, Spiecker H. 2014. Exploring high fre-quency densitometry calibration functions for different tree species.Dendrochronologia 32: 273–281.
Wils THG, Robertson I, Eshetu Z, Sass-Klaassen UGW, Koprowski M. 2009.
Periodicity of growth rings in Juniperus procera from Ethiopia inferred fromcrossdating and radiocarbon dating. Dendrochronologia 27: 45–58.
Wimmer R. 2002. Wood anatomical features in tree-rings as indicators of envir-onmental change. Dendrochronologia 20: 21–36.
Worbes M. 1989. Growth rings, increment and age of trees in inundation forests,savannas and a mountain forest in the neotropics. IAWA Bulletin 10:109–122.
Worbes M. 2002. One hundred years of tree-ring research in the tropics – a briefhistory and an outlook to future challenges. Dendrochronologia 20:217–231.
Zanne AE, Westoby M, Falster DS, et al. 2010. Angiosperm wood structure:Global patterns in vessel anatomy and their relation to wood density and po-tential conductivity. American Journal of Botany 97: 207–215.
Page 10 of 10 De Mil et al. — Densitometry toolchain for tree ring analysis
by guest on April 25, 2016
http://aob.oxfordjournals.org/D
ownloaded from