Ⅱ. fy2017 full year plan...©2017 topcon corporation 12 Ⅱ.fy2017 full year plan Ⅱ-. 1fy2017...
TRANSCRIPT
©2017 Topcon Corporation 12
Ⅱ. FY2017 Full Year Plan Ⅱ-1. FY2017 Full Year Plan Ⅱ-2. Strategic Plans For Each Business Ⅱ-3. Summary
©2017 Topcon Corporation 13
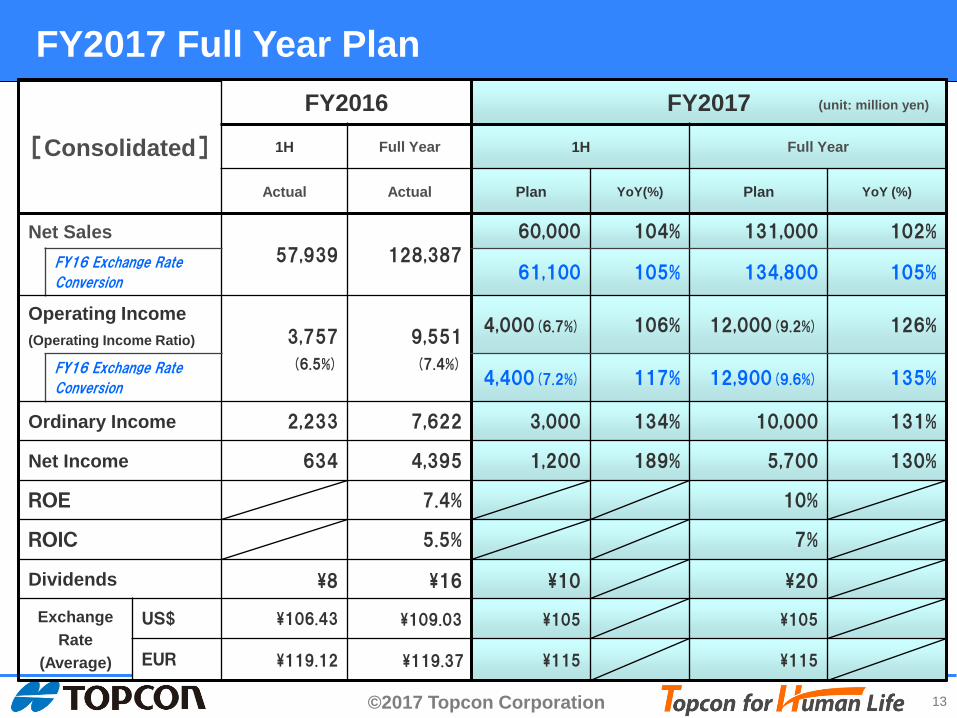
[Consolidated]
FY2016 FY2017 1H Full Year 1H Full Year
Actual Actual Plan YoY(%) Plan YoY (%)
Net Sales
57,939 128,387
60,000 104% 131,000 102%
FY16 Exchange Rate
Conversion 61,100 105% 134,800 105%
Operating Income (Operating Income Ratio) 3,757
(6.5%)
9,551
(7.4%)
4,000(6.7%) 106% 12,000(9.2%) 126%
FY16 Exchange Rate
Conversion 4,400(7.2%) 117% 12,900(9.6%) 135%
Ordinary Income 2,233 7,622 3,000 134% 10,000 131%
Net Income 634 4,395 1,200 189% 5,700 130%
ROE 7.4% 10%
ROIC 5.5% 7%
Dividends ¥8 ¥16 ¥10 ¥20
Exchange Rate
(Average)
US$ ¥106.43 ¥109.03 ¥105 ¥105
EUR ¥119.12 ¥119.37 ¥115 ¥115
FY2017 Full Year Plan (unit: million yen)
©2017 Topcon Corporation 14
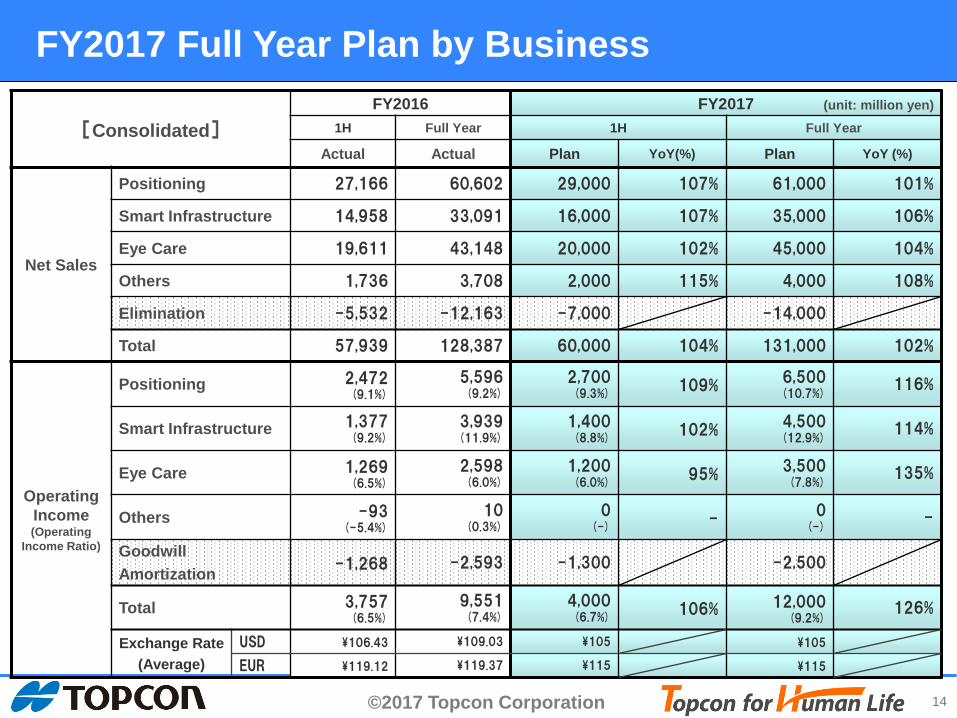
[Consolidated] FY2016 FY2017
1H Full Year 1H Full Year
Actual Actual Plan YoY(%) Plan YoY (%)
Net Sales
Positioning 27,166 60,602 29,000 107% 61,000 101%
Smart Infrastructure 14,958 33,091 16,000 107% 35,000 106%
Eye Care 19,611 43,148 20,000 102% 45,000 104%
Others 1,736 3,708 2,000 115% 4,000 108%
Elimination -5,532 -12,163 -7,000 -14,000
Total 57,939 128,387 60,000 104% 131,000 102%
Operating Income (Operating
Income Ratio)
Positioning 2,472 (9.1%)
5,596 (9.2%)
2,700 (9.3%)
109% 6,500 (10.7%)
116%
Smart Infrastructure 1,377 (9.2%)
3,939 (11.9%)
1,400 (8.8%)
102% 4,500 (12.9%)
114%
Eye Care 1,269 (6.5%)
2,598 (6.0%)
1,200 (6.0%)
95% 3,500 (7.8%)
135%
Others -93 (-5.4%)
10 (0.3%)
0 (-)
- 0
(-) -
Goodwill Amortization -1,268 -2,593 -1,300 -2,500
Total 3,757 (6.5%)
9,551 (7.4%)
4,000 (6.7%)
106% 12,000 (9.2%)
126%
Exchange Rate (Average)
USD ¥106.43 ¥109.03 ¥105 ¥105
EUR ¥119.12 ¥119.37 ¥115 ¥115
FY2017 Full Year Plan by Business (unit: million yen)
©2017 Topcon Corporation 15
Ⅱ. FY2017 Full Year Plan Ⅱ-1. FY2017 Full Year Plan Ⅱ-2. Strategic Plans For Each Business Ⅱ-3. Summary
©2017 Topcon Corporation 16
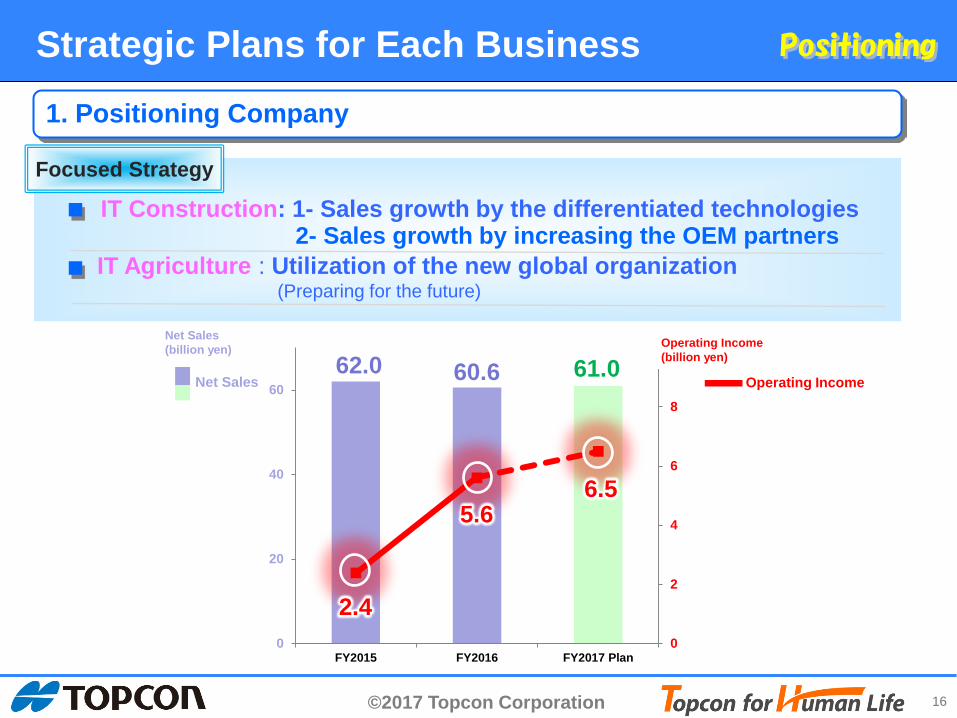
■ IT Construction: 1- Sales growth by the differentiated technologies
■ IT Agriculture : Utilization of the new global organization (Preparing for the future)
0
2
4
6
8
10
0
20
40
60
FY2015 FY2016 FY2017 Plan
60.6 61.0 62.0
2- Sales growth by increasing the OEM partners
6.5 5.6
2.4
Strategic Plans for Each Business
1. Positioning Company
Focused Strategy
Net Sales (billion yen) Operating Income
(billion yen)
Net Sales Operating Income
©2017 Topcon Corporation 17
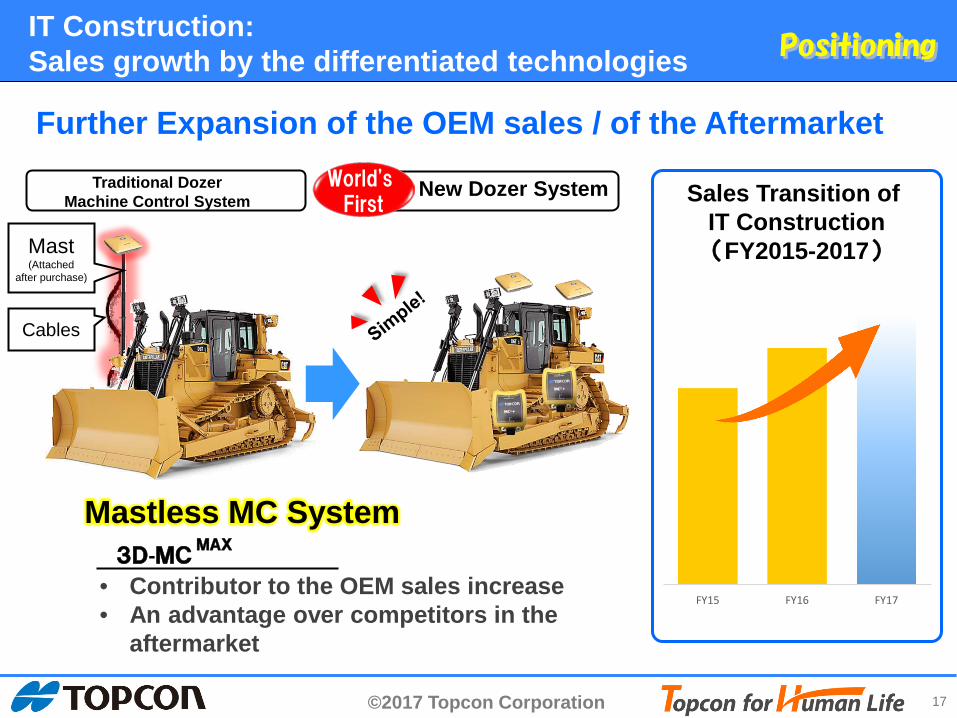
IT Construction: Sales growth by the differentiated technologies
Sales Transition of IT Construction (FY2015-2017)
Further Expansion of the OEM sales / of the Aftermarket
• Contributor to the OEM sales increase • An advantage over competitors in the
aftermarket
Mastless MC System 3D-MC MAX
FY15 FY16 FY17
World's First
Traditional Dozer Machine Control System New Dozer System
Mast (Attached
after purchase)
Cables
©2017 Topcon Corporation 18
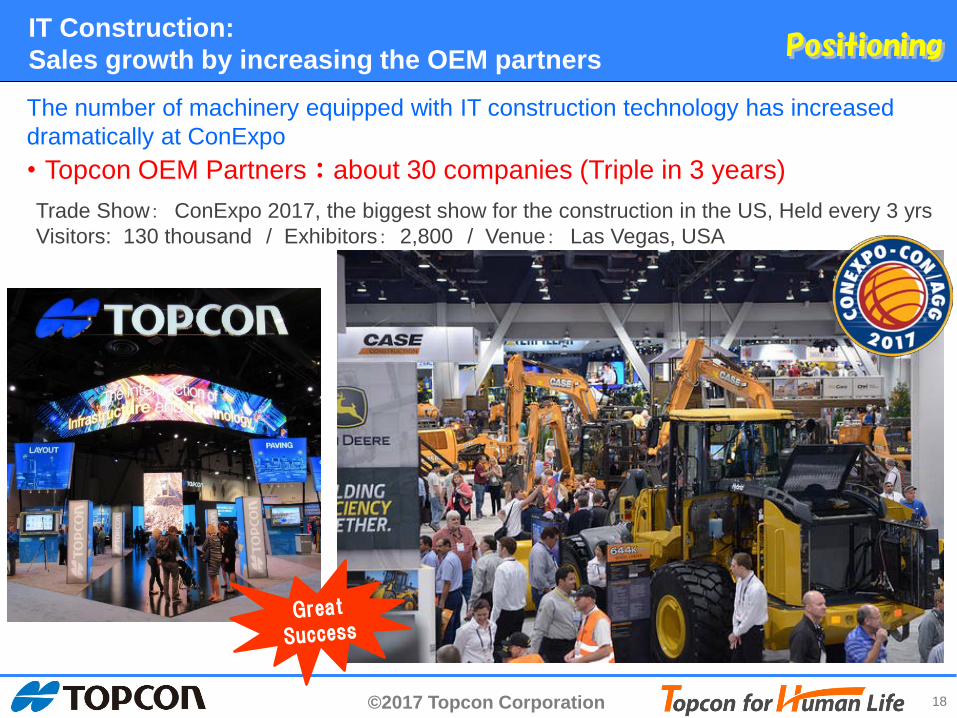
IT Construction: Sales growth by increasing the OEM partners
・Topcon OEM Partners:about 30 companies (Triple in 3 years) Trade Show: ConExpo 2017, the biggest show for the construction in the US, Held every 3 yrs Visitors: 130 thousand / Exhibitors: 2,800 / Venue: Las Vegas, USA
The number of machinery equipped with IT construction technology has increased dramatically at ConExpo
©2017 Topcon Corporation 19
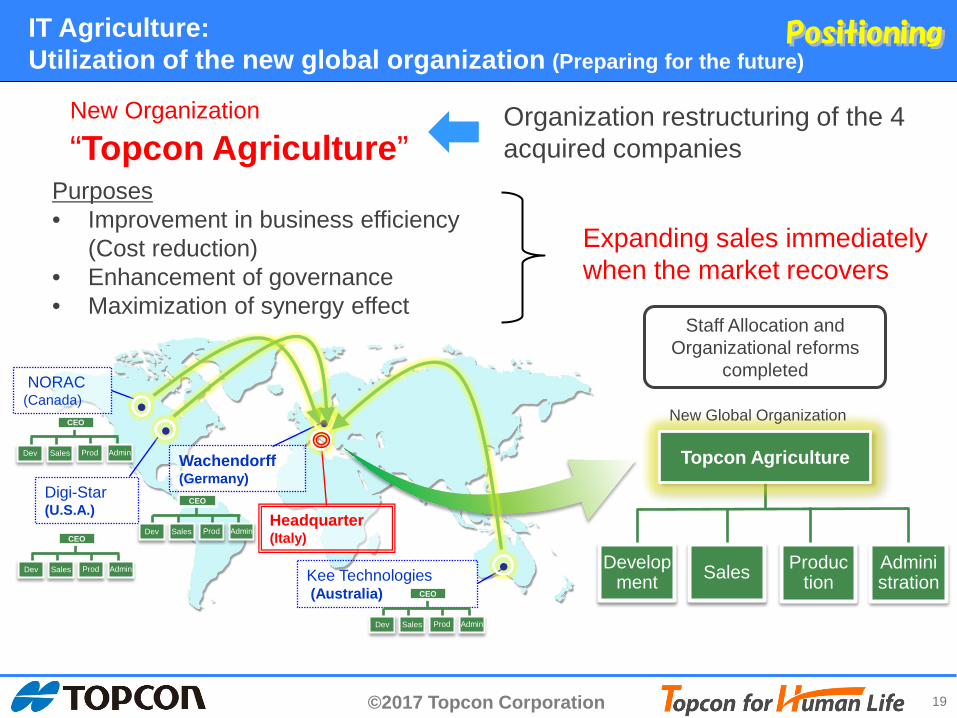
IT Agriculture: Utilization of the new global organization (Preparing for the future)
Kee Technologies (Australia)
Wachendorff (Germany)
Digi-Star (U.S.A.)
NORAC (Canada)
Produc tion
Development Sales Admini
stration
Topcon Agriculture
Purposes • Improvement in business efficiency
(Cost reduction) • Enhancement of governance • Maximization of synergy effect
Headquarter (Italy)
Staff Allocation and Organizational reforms
completed
New Global Organization
Prod Dev Sales Admin
CEO
Prod Dev Sales Admin
CEO
Prod Dev Sales Admin
CEO
Prod Dev Sales Admin
CEO
New Organization “Topcon Agriculture”
Organization restructuring of the 4 acquired companies
Expanding sales immediately when the market recovers
©2017 Topcon Corporation 20
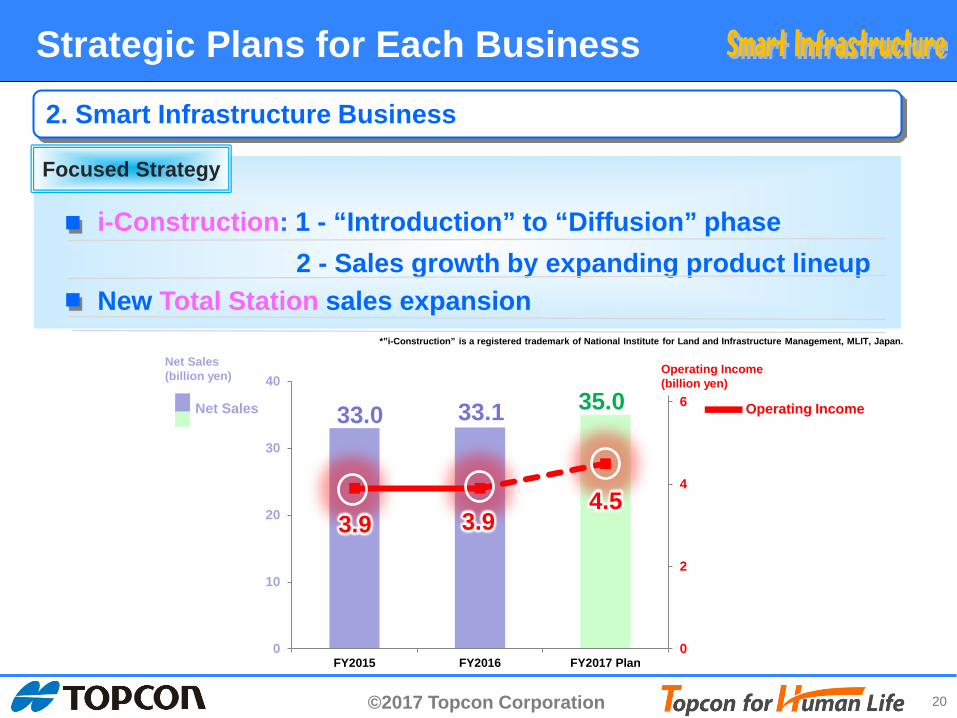
i-Construction: 1 - “Introduction” to “Diffusion” phase
■
■
2 - Sales growth by expanding product lineup
0
2
4
6
0
10
20
30
40
FY2015 FY2016 FY2017 Plan
33.0 35.0 33.1
4.5 3.9 3.9
Strategic Plans for Each Business
2. Smart Infrastructure Business
Focused Strategy
*”i-Construction” is a registered trademark of National Institute for Land and Infrastructure Management, MLIT, Japan.
Net Sales (billion yen) Operating Income
(billion yen)
Net Sales Operating Income
New Total Station sales expansion
©2017 Topcon Corporation 21
0
0.5
1
1.5
2
2.5
2016年 2017年 予測
2018年 予測
2019年 予測
2020年 予測
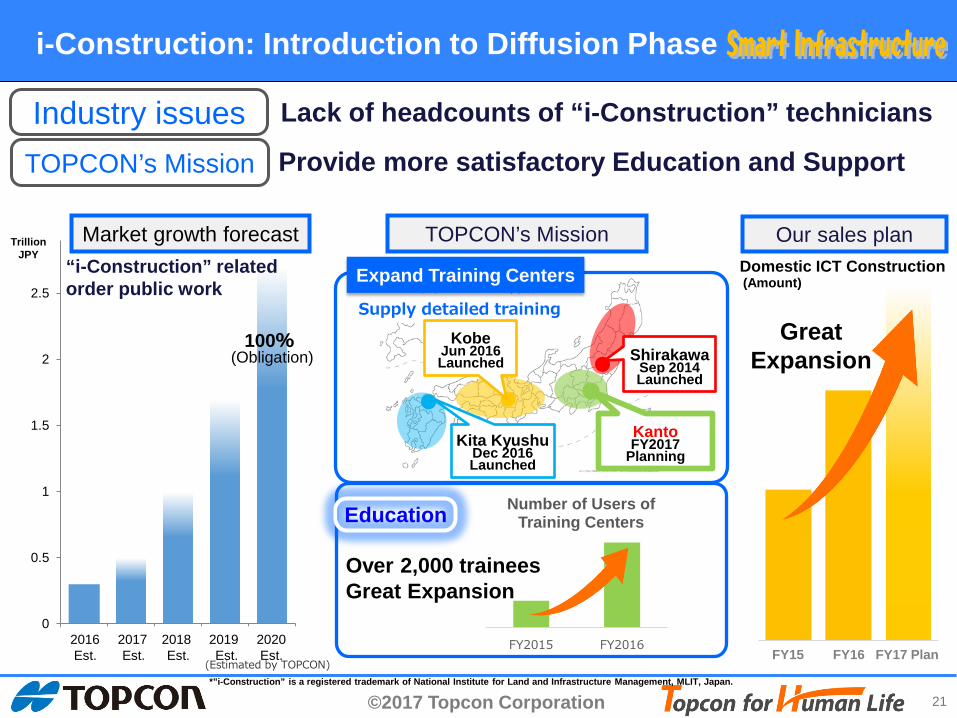
i-Construction: Introduction to Diffusion Phase
TOPCON’s Mission
Industry issues TOPCON’s Mission
Our sales plan Market growth forecast
100% (Obligation)
Domestic ICT Construction
FY15 FY16 FY17計画
(Amount)
Education
Great Expansion
FY2015 FY2016
Number of Users of Training Centers
Over 2,000 trainees Great Expansion
“i-Construction” related order public work
Trillion JPY
*”i-Construction” is a registered trademark of National Institute for Land and Infrastructure Management, MLIT, Japan.
Shirakawa Sep 2014 Launched
Kita Kyushu Dec 2016 Launched
Kanto FY2017
Planning
Supply detailed training
Expand Training Centers
Kobe Jun 2016 Launched
2016 2017 2018 2019 2020 Est. Est. Est. Est. Est.
(Estimated by TOPCON) FY15 FY16 FY17 Plan
Lack of headcounts of “i-Construction” technicians
Provide more satisfactory Education and Support
©2017 Topcon Corporation 22
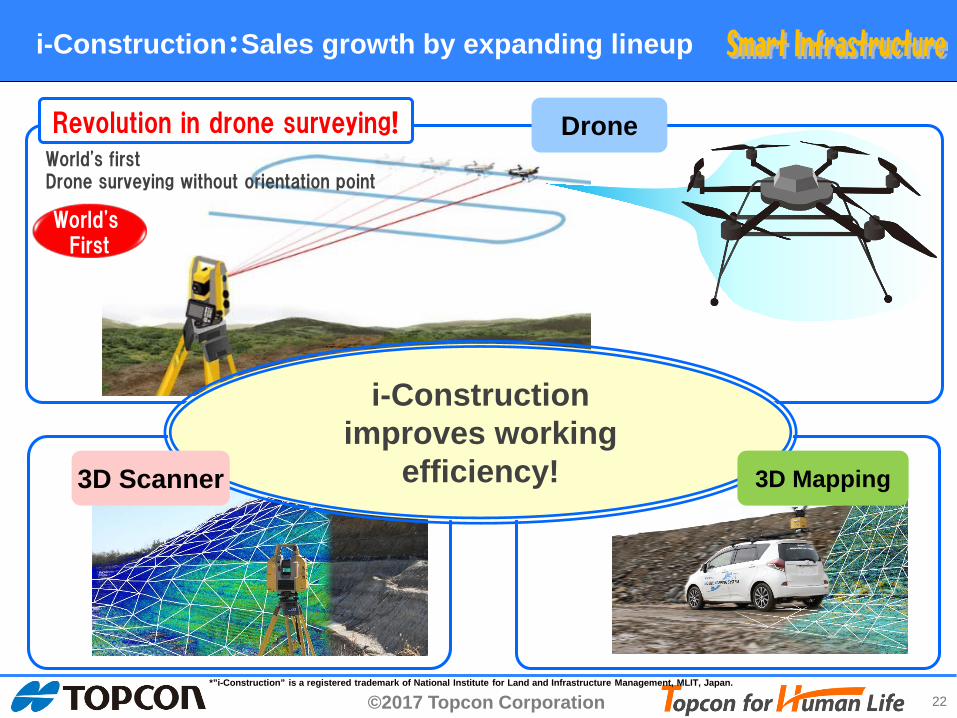
i-Construction:Sales growth by expanding lineup
World's first Drone surveying without orientation point
Revolution in drone surveying!
i-Construction improves working
efficiency!
World's First
Drone
3D Scanner 3D Mapping
*”i-Construction” is a registered trademark of National Institute for Land and Infrastructure Management, MLIT, Japan.
©2017 Topcon Corporation 23
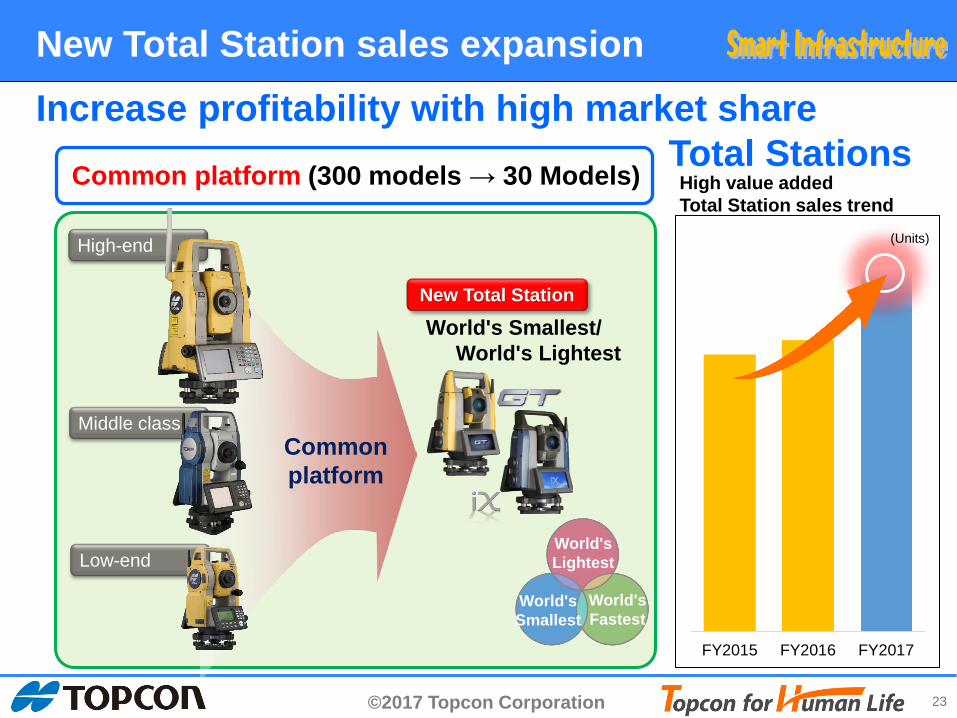
FY2015 FY2016 FY2017
Low-end
High-end
Middle class Common platform
World's Smallest/ World's Lightest
New Total Station
World's Lightest
World's Smallest
World's Fastest
Increase profitability with high market share Total Stations
Common platform (300 models → 30 Models)
(Units)
High value added Total Station sales trend
New Total Station sales expansion
©2017 Topcon Corporation 24
■
■
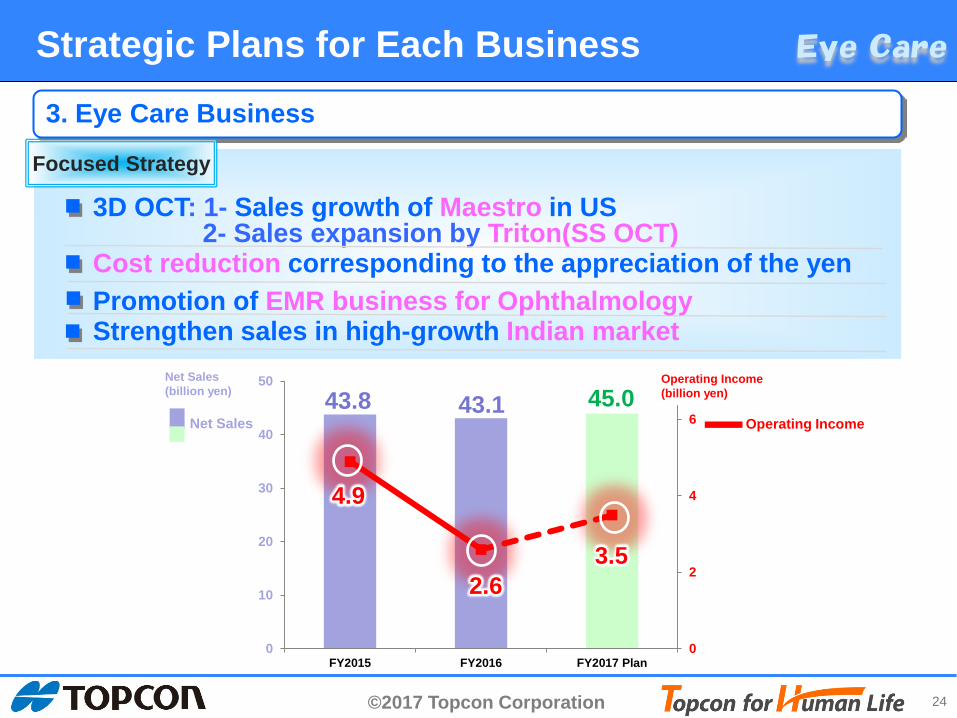
0
2
4
6
0
10
20
30
40
50
FY2015 FY2016 FY2017 Plan
43.8 45.0 43.1
2- Sales expansion by Triton(SS OCT)
Strengthen sales in high-growth Indian market ■
Cost reduction corresponding to the appreciation of the yen ■
3.5
4.9
2.6
Strategic Plans for Each Business
3. Eye Care Business
Focused Strategy
Net Sales (billion yen)
Operating Income (billion yen)
Net Sales Operating Income
3D OCT: 1- Sales growth of Maestro in US
Promotion of EMR business for Ophthalmology
©2017 Topcon Corporation 25
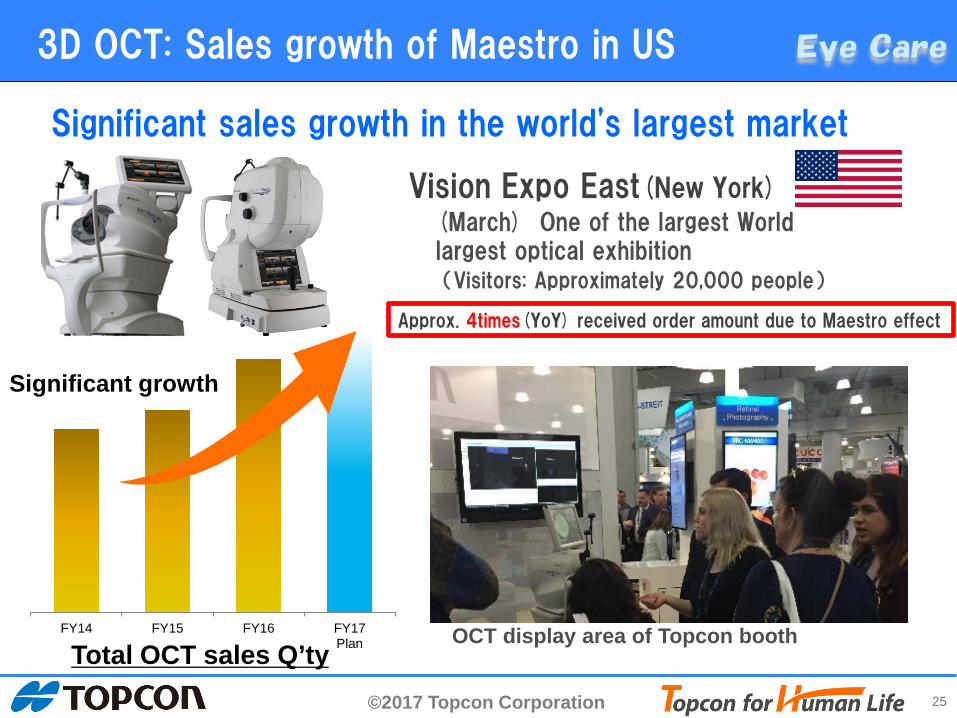
FY14 FY15 FY16 FY17Plan
Vision Expo East(New York)
Approx. 4times(YoY) received order amount due to Maestro effect
(Visitors: Approximately 20,000 people)
3D OCT: Sales growth of Maestro in US
Significant sales growth in the world's largest market
(March) One of the largest World largest optical exhibition
OCT display area of Topcon booth
Significant growth
Total OCT sales Q’ty
©2017 Topcon Corporation 26
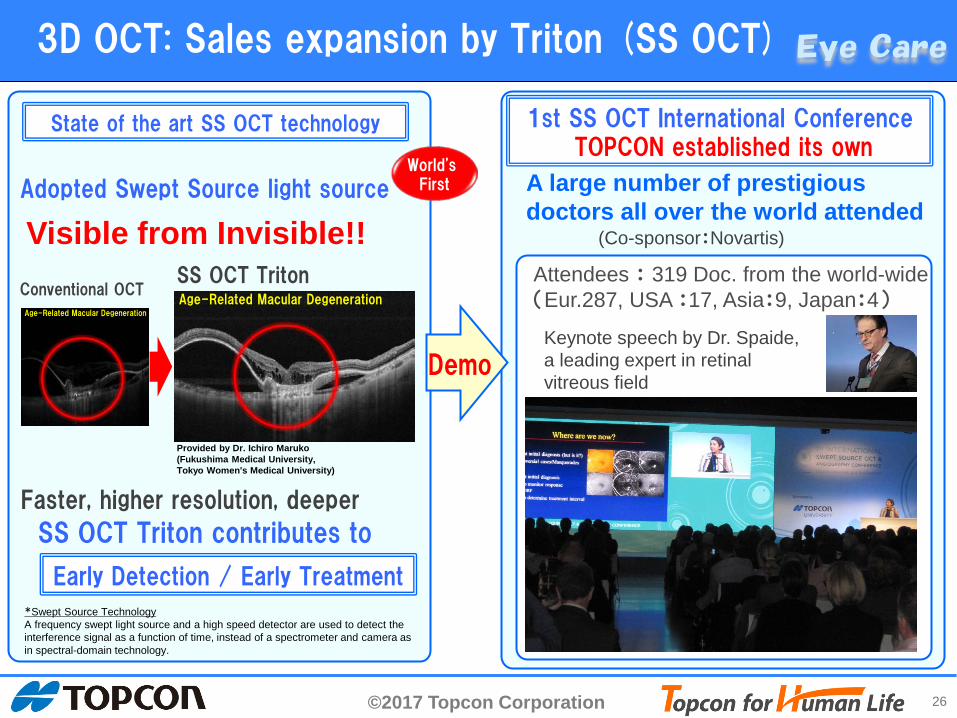
Visible from Invisible!!
Faster, higher resolution, deeper
Adopted Swept Source light source
3D OCT: Sales expansion by Triton (SS OCT)
Keynote speech by Dr. Spaide, a leading expert in retinal vitreous field
Attendees : 319 Doc. from the world-wide (Eur.287, USA :17, Asia:9, Japan:4)
(Co-sponsor:Novartis)
A large number of prestigious doctors all over the world attended
1st SS OCT International Conference TOPCON established its own
State of the art SS OCT technology
Demo
SS OCT Triton contributes to
Age-Related Macular Degeneration
Age-Related Macular Degeneration
Early Detection / Early Treatment
Conventional OCT SS OCT Triton
*Swept Source Technology A frequency swept light source and a high speed detector are used to detect the interference signal as a function of time, instead of a spectrometer and camera as in spectral-domain technology.
Provided by Dr. Ichiro Maruko (Fukushima Medical University, Tokyo Women's Medical University)
World's First
©2017 Topcon Corporation 27
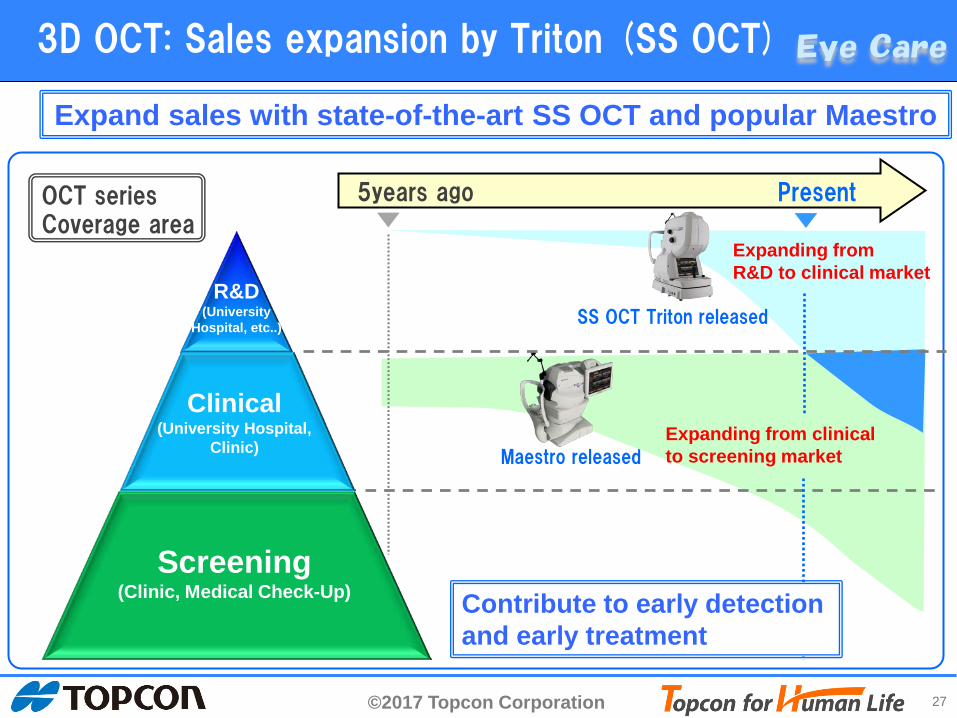
5years ago Present
Expand sales with state-of-the-art SS OCT and popular Maestro
Expanding from R&D to clinical market
SS OCT Triton released
Maestro released Expanding from clinical to screening market
OCT series Coverage area
Contribute to early detection and early treatment
R&D (University
Hospital, etc..)
Clinical (University Hospital,
Clinic)
Screening (Clinic, Medical Check-Up)
3D OCT: Sales expansion by Triton (SS OCT)
©2017 Topcon Corporation 28
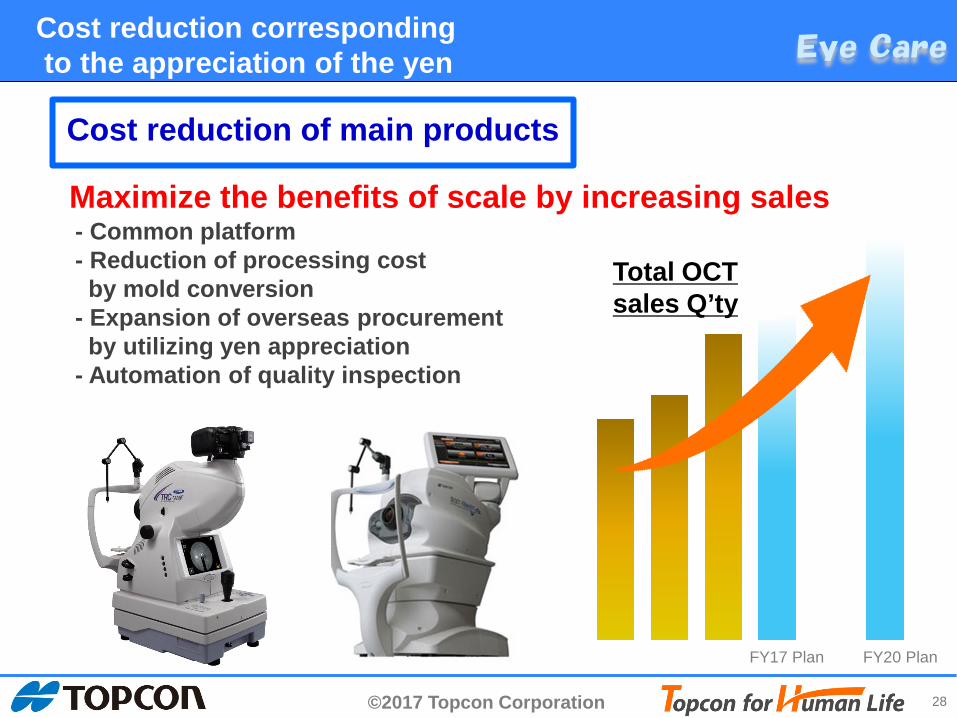
Cost reduction corresponding to the appreciation of the yen
Cost reduction of main products
- Common platform - Reduction of processing cost by mold conversion - Expansion of overseas procurement by utilizing yen appreciation - Automation of quality inspection
Maximize the benefits of scale by increasing sales
FY20 Plan FY17 Plan
Total OCT sales Q’ty
©2017 Topcon Corporation 29
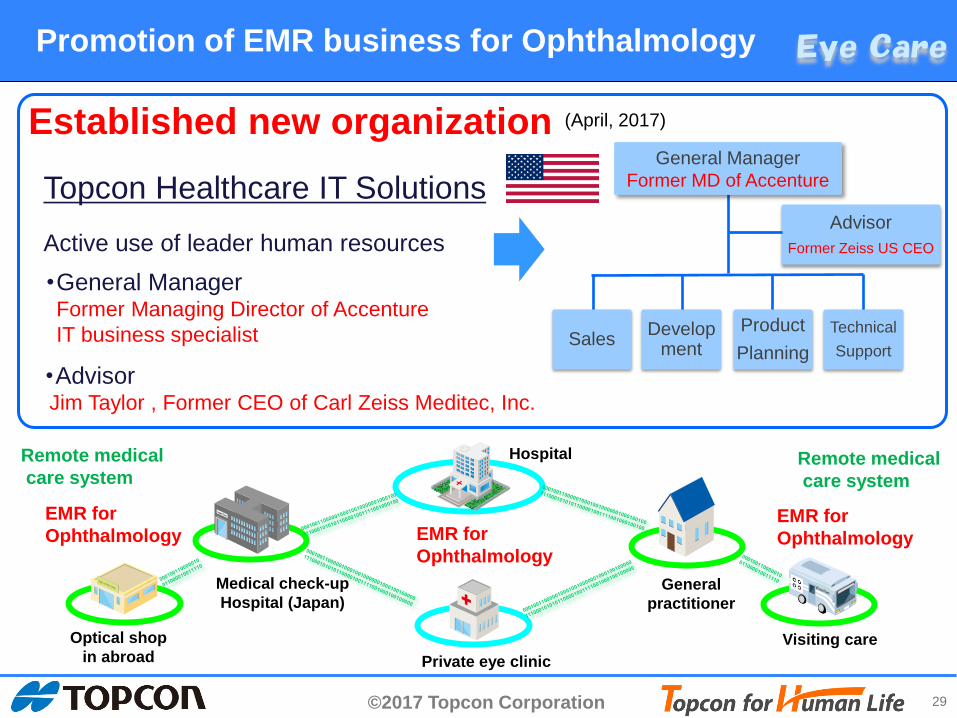
Topcon Healthcare IT Solutions
Established new organization
Promotion of EMR business for Ophthalmology
Sales Development
Technical Support
General Manager Former MD of Accenture
Advisor Former Zeiss US CEO
(April, 2017)
Product Planning
VisionVan
EMR for Ophthalmology
Active use of leader human resources ・General Manager Former Managing Director of Accenture IT business specialist
・Advisor Jim Taylor , Former CEO of Carl Zeiss Meditec, Inc.
Hospital
Private eye clinic
EMR for Ophthalmology
EMR for Ophthalmology
Remote medical care system
Optical shop in abroad
Medical check-up Hospital (Japan)
General practitioner
Visiting care
Remote medical care system
©2017 Topcon Corporation 30
FY2015 FY2016 FY2017 FY2018 FY2020
0
500
1,000
1,500
2,000
2,500
3,000
FY2015 FY2016 FY2017 FY2018 FY2020
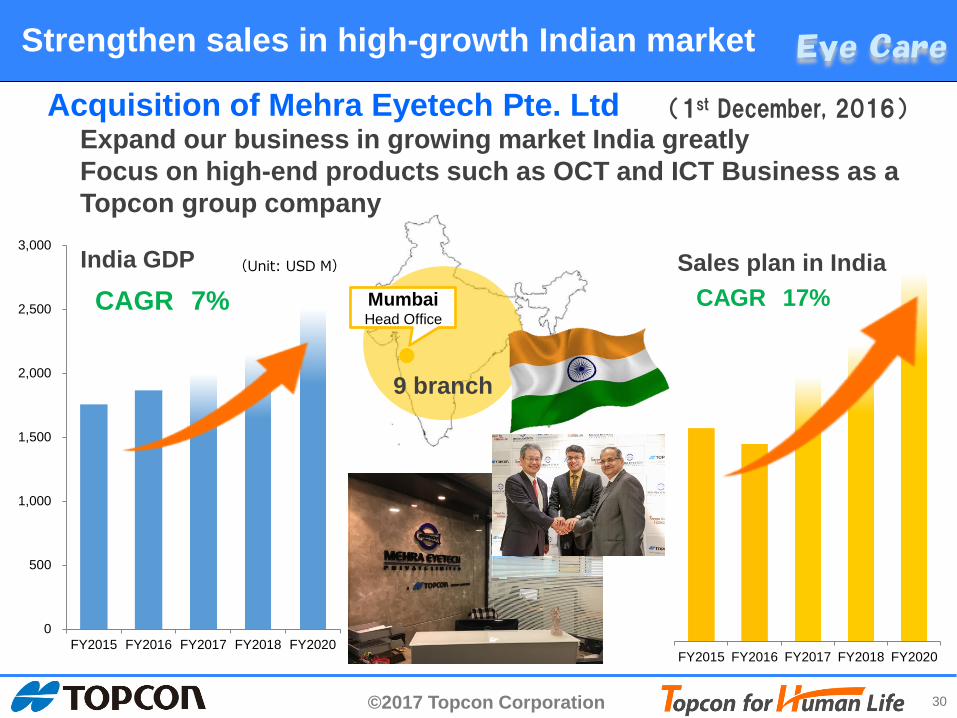
Strengthen sales in high-growth Indian market
Acquisition of Mehra Eyetech Pte. Ltd Expand our business in growing market India greatly Focus on high-end products such as OCT and ICT Business as a Topcon group company
(1st December, 2016)
CAGR 17% (Unit: USD M)
Mumbai Head Office
9 branch
CAGR 7% Sales plan in India India GDP
©2017 Topcon Corporation 31
Ⅱ. FY2017 Full Year Plan Ⅱ-1. FY2017 Full Year Plan Ⅱ-2. Strategic Plans For Each Business Ⅱ-3. Summary
©2017 Topcon Corporation 32
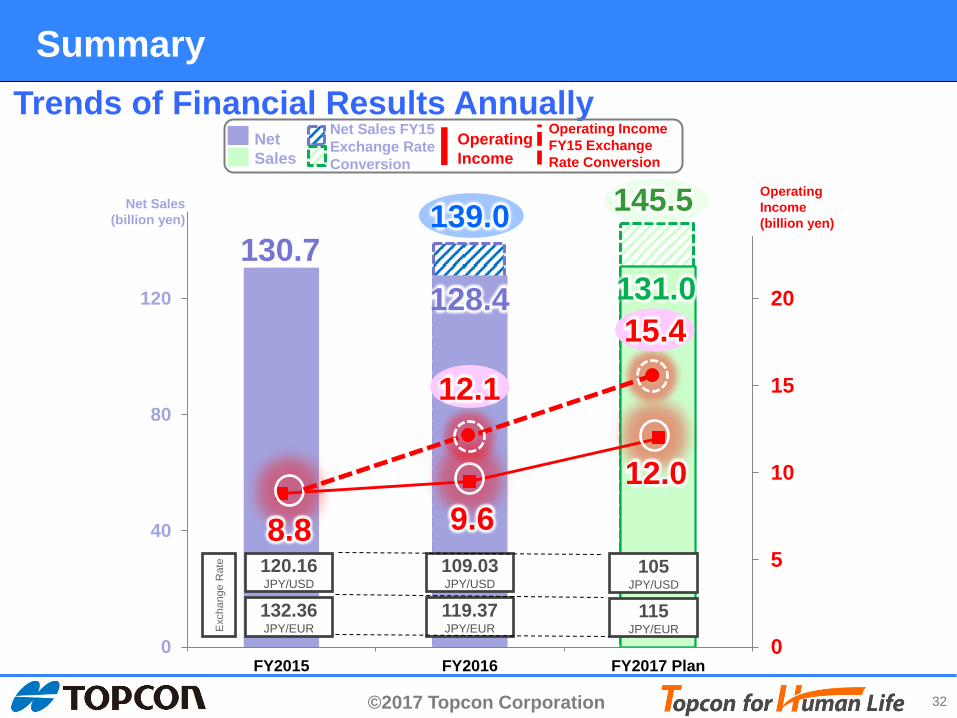
0
5
10
15
20
25
0
40
80
120
FY2015 FY2016 FY2017 Plan
130.7 128.4 131.0
139.0 145.5
12.1
15.4
120.16 JPY/USD
132.36 JPY/EUR
109.03 JPY/USD
119.37 JPY/EUR
105 JPY/USD
115 JPY/EUR E
xcha
nge
Rat
e
12.0 9.6 8.8
Summary Trends of Financial Results Annually
Net Sales (billion yen)
Operating Income (billion yen)
Net Sales
Operating Income
Net Sales FY15 Exchange Rate Conversion
Operating Income FY15 Exchange Rate Conversion
©2017 Topcon Corporation 33
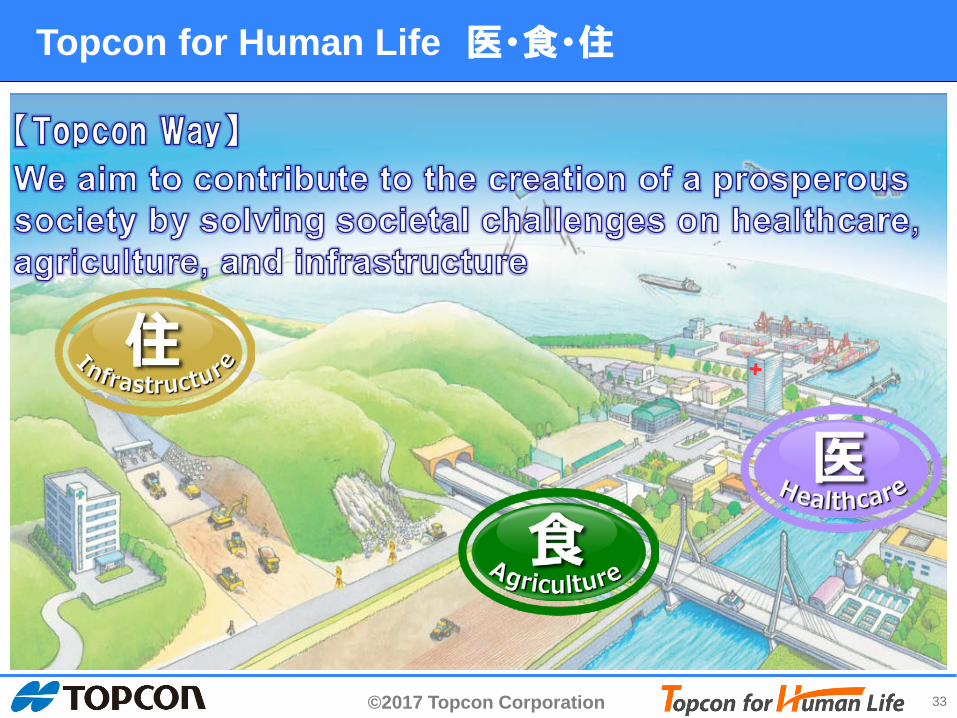
Topcon for Human Life 医・食・住