a guide for business - world business council for
TRANSCRIPT

Measuring socio-economic impact A guide for business
wbcsd social capital
business solutions for a sustainable world

Section 1: Section 2: Section 3: Section 4:
Why measure
socio-economic
impact?
What does it
mean to measure
socio-economic
impact?
What frameworks
are available for
business?
Where do we
go from here?
2
Table of contents
Foreword page 3
About the guide page 4
Acknowledgements page 39
Section 1 Section 2 Section 3 Section 4
The business case
The essentials
The tools
The road ahead
page 7 page 10 page 20 page 36
3
Measuring and reporting on corporate performance are essential
components of this transformation. We all know that what gets measured
gets managed, and with this guide we want to address an area which
has so far been neglected by too many businesses: the measurement and
management of their socio-economic impact.
The WBCSD is keen to accelerate business efforts in this domain. Scaling
up solutions will not happen without a solid understanding of what works
and what doesn’t – and having sound measurement systems in place is
fundamental to obtaining this insight.
Business as usual is not an option for a future-proofed economy in which
nine billion people live well within the limits of the planet by mid-century.
This requires redefining measures of success. This guide provides a valuable
starting point, and I am eager to galvanize business leaders to change the
rules of the game. Let’s get to work!
Peter Bakker
President, WBCSD
Foreword by Peter Bakker
There is urgency in addressing the world’s sustainability challenges,
including poverty, social unrest, climate change and environmental
degradation. Having the technologies, innovation capacity, resources and
skills, business has a key role to play in providing the radical solutions the
world desperately needs.
Companies around the world are already offering a great array of
innovative solutions to tackle key environmental and social challenges
– and they are benefiting from doing so. Unfortunately, even all these
valuable initiatives combined do not make a dent in the task of putting us
on a truly sustainable track.
We are at a tipping point on key planetary boundaries and social challenges
and need to radically scale up action to avoid devastating consequences
for society and our planet – and ultimately also for companies, as business
cannot succeed in societies that fail.
I am a capitalist. A capitalist is someone who puts capital to work, and
wants something back – we call it a return on capital. The mistake currently
lies in only expecting (and managing) a return on financial capital.
Capitalism requires a new operating system, and needs to be re-booted
so that we expect and manage the returns on financial, natural, and social
capital in a balanced way with a view to future-proofing our economies.

4
About the guide
Companies are increasingly interested in measuring socio-economic impact as part of maintaining their license to operate, improving the
business enabling environment, strengthening their value chains, and
fueling product and service innovation.
But while more and more tools are being developed to help companies measure socio-economic impact, it can be difficult to compare and choose among them. The tools available today are incredibly diverse. They
are based on different assumptions, they offer different functionality, they
focus on different types of impact, and they suit different purposes.
This guide is intended to help companies navigate a complex landscape of socio-economic impact measurement tools and identify those that best meet their needs. In the following pages, we aim to:
Introduce the terminology and basic theory used in this space for a
business audience;
Provide an overview of existing socio-economic impact measurement
tools for business needs;
Identify the benefits and the limits of different tools, and the ways they
complement each other;
Help companies select the right tool or combination of tools for their
purposes;
Empower companies to contribute to further tool development; and
Accelerate business efforts to measure socio-economic impact.
The WBCSD’s Measuring Impact Framework
The WBCSD released a framework for measuring socio-economic impact in 2008. The Measuring Impact Framework was developed over the course of two years in collaboration with more than 20 member companies that recognized measurement as key to obtaining and maintaining license to operate, improving the quality of stakeholder engagement, managing risk more effectively, and identifying ways to enhance the business contribution to society. The framework, co-branded by the International Finance Corporation, takes the user through a four-step process of identifying, measuring, assessing, and managing a company’s development impact. It is grounded in what business does, it moves beyond compliance, and it is flexible, designed to be tailored to meet individual companies’ needs. Over the past years, the WBCSD has documented case studies on lessons learned from companies’ application of the framework in practice. At the same time, the framework is one of an increasing number available, and companies have chosen to use it on its own or in combination with other tools.
More information at www.wbcsd.org/impact.aspx
measuring
IMPACTFramework Methodology
Understanding the business contribution to society
WBCSD environmental impact assessment tools
The WBCSD has developed a range of environmental impact assessment tools, most notably the Global Water Tool, the Corporate Ecosystem Service Review, the Guide to Corporate Ecosystem Valuation, and the Greenhouse Gas Protocol. The Council has also published the Water for Business guide to help companies navigate the diversity of tools and initiatives that exist in the water management space alone, and a similar effort is currently taking place around ecosystem and biodiversity tools.
Access all these resources at www.wbcsd.org/publications-and-tools/tools.aspx
5
About the guide
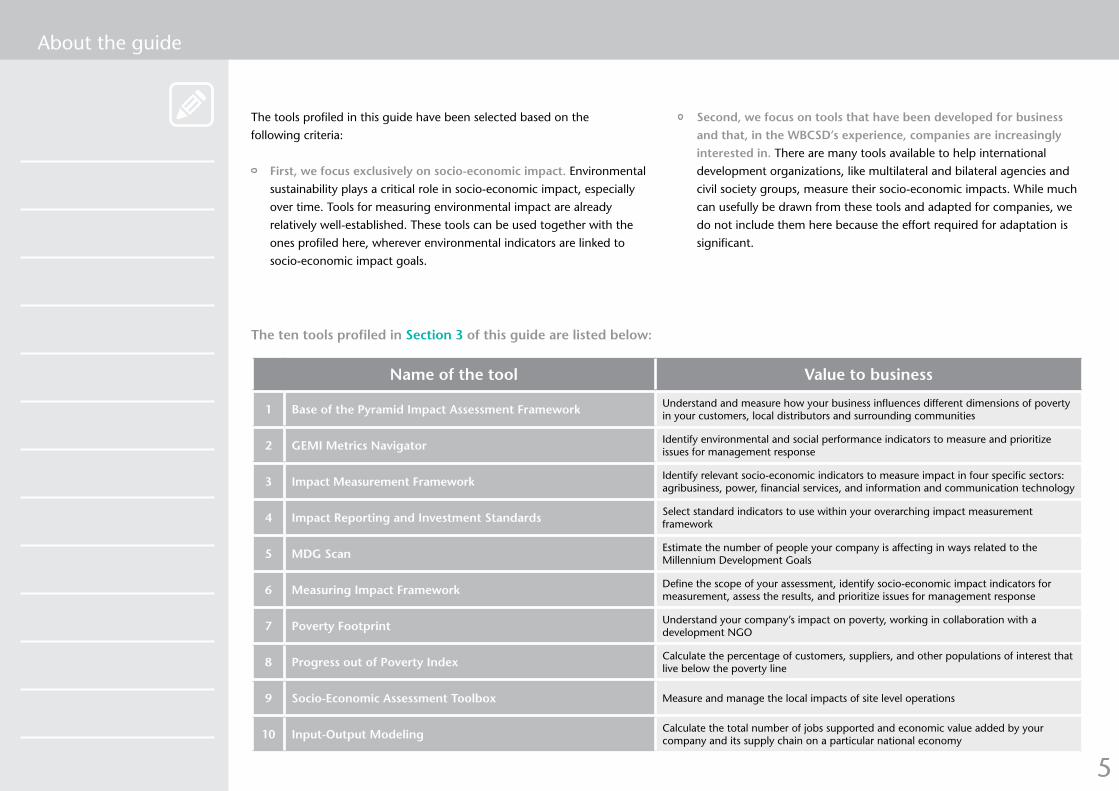
The tools profiled in this guide have been selected based on the
following criteria:
First, we focus exclusively on socio-economic impact. Environmental
sustainability plays a critical role in socio-economic impact, especially
over time. Tools for measuring environmental impact are already
relatively well-established. These tools can be used together with the
ones profiled here, wherever environmental indicators are linked to
socio-economic impact goals.
Name of the tool Value to business
1 Base of the Pyramid Impact Assessment Framework Understand and measure how your business influences different dimensions of poverty in your customers, local distributors and surrounding communities
2 GEMI Metrics Navigator Identify environmental and social performance indicators to measure and prioritize issues for management response
3 Impact Measurement Framework Identify relevant socio-economic indicators to measure impact in four specific sectors: agribusiness, power, financial services, and information and communication technology
4 Impact Reporting and Investment Standards Select standard indicators to use within your overarching impact measurement framework
5 MDG Scan Estimate the number of people your company is affecting in ways related to the Millennium Development Goals
6 Measuring Impact Framework Define the scope of your assessment, identify socio-economic impact indicators for measurement, assess the results, and prioritize issues for management response
7 Poverty Footprint Understand your company’s impact on poverty, working in collaboration with a development NGO
8 Progress out of Poverty Index Calculate the percentage of customers, suppliers, and other populations of interest that live below the poverty line
9 Socio-Economic Assessment Toolbox Measure and manage the local impacts of site level operations
10 Input-Output Modeling Calculate the total number of jobs supported and economic value added by your company and its supply chain on a particular national economy
Second, we focus on tools that have been developed for business and that, in the WBCSD’s experience, companies are increasingly interested in. There are many tools available to help international
development organizations, like multilateral and bilateral agencies and
civil society groups, measure their socio-economic impacts. While much
can usefully be drawn from these tools and adapted for companies, we
do not include them here because the effort required for adaptation is
significant.
The ten tools profiled in Section 3 of this guide are listed below:

6
About the guide
The road ahead
Reflects on the landscape of
available tools and suggests two
areas of focus for efforts to advance
the practice of socio-economic
impact measurement moving
forward.
Section 4Section 1
The business case
Provides an overview of the
business case for measuring a
company’s socio-economic impact.
Section 2
The essentials
Explains the terminology and basic
theory behind measuring socio-
economic impact, helping to bridge
the gap between the practice’s
origins in the development
community and its application in
the business world.
Section 3
The tools
Profiles a selection of tools
available to companies interested
in measuring their socio-
economic impacts, with a focus
on functionality, fit for purpose,
and cost and complexity of
implementation. It is important to
note that because many of the tools
are designed to be flexible, these
aspects will ultimately depend on
the choices made by the user.
Please note that inclusion of a tool does not signify endorsement. Again,
our objective is to help companies gauge for themselves which tool or
combination of tools best meets their socio-economic impact measurement
needs – thereby enabling and accelerating business action to align
profitable business ventures with the needs of society, and contribute to a
more sustainable world.
The remainder of this guide is divided into four parts:
7
Section 1: The business case
Section 1 Section 2 Section 3 Section 4
The business case
The essentials
The tools
The road ahead
8
Section 1: The business case
Section
1Section
2Section
3Section
4
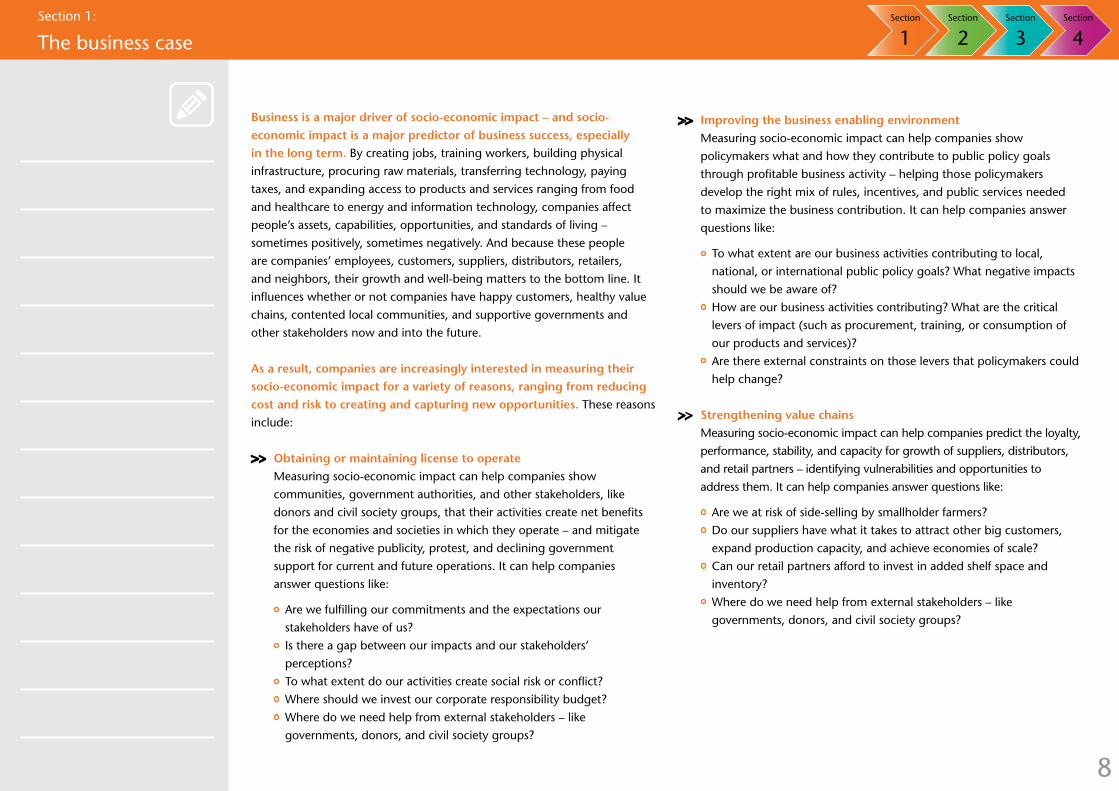
Business is a major driver of socio-economic impact – and socio-economic impact is a major predictor of business success, especially in the long term. By creating jobs, training workers, building physical
infrastructure, procuring raw materials, transferring technology, paying
taxes, and expanding access to products and services ranging from food
and healthcare to energy and information technology, companies affect
people’s assets, capabilities, opportunities, and standards of living –
sometimes positively, sometimes negatively. And because these people
are companies’ employees, customers, suppliers, distributors, retailers,
and neighbors, their growth and well-being matters to the bottom line. It
influences whether or not companies have happy customers, healthy value
chains, contented local communities, and supportive governments and
other stakeholders now and into the future.
As a result, companies are increasingly interested in measuring their socio-economic impact for a variety of reasons, ranging from reducing cost and risk to creating and capturing new opportunities. These reasons
include:
Obtaining or maintaining license to operate
Measuring socio-economic impact can help companies show
communities, government authorities, and other stakeholders, like
donors and civil society groups, that their activities create net benefits
for the economies and societies in which they operate – and mitigate
the risk of negative publicity, protest, and declining government
support for current and future operations. It can help companies
answer questions like:
Are we fulfilling our commitments and the expectations our
stakeholders have of us?
Is there a gap between our impacts and our stakeholders’
perceptions?
To what extent do our activities create social risk or conflict?
Where should we invest our corporate responsibility budget?
Where do we need help from external stakeholders – like
governments, donors, and civil society groups?
Improving the business enabling environment Measuring socio-economic impact can help companies show
policymakers what and how they contribute to public policy goals
through profitable business activity – helping those policymakers
develop the right mix of rules, incentives, and public services needed
to maximize the business contribution. It can help companies answer
questions like:
To what extent are our business activities contributing to local,
national, or international public policy goals? What negative impacts
should we be aware of?
How are our business activities contributing? What are the critical
levers of impact (such as procurement, training, or consumption of
our products and services)?
Are there external constraints on those levers that policymakers could
help change?
Strengthening value chains Measuring socio-economic impact can help companies predict the loyalty,
performance, stability, and capacity for growth of suppliers, distributors,
and retail partners – identifying vulnerabilities and opportunities to
address them. It can help companies answer questions like:
Are we at risk of side-selling by smallholder farmers?
Do our suppliers have what it takes to attract other big customers,
expand production capacity, and achieve economies of scale?
Can our retail partners afford to invest in added shelf space and
inventory?
Where do we need help from external stakeholders – like
governments, donors, and civil society groups?

9
Section 1: The business case
Section
1Section
2Section
3Section
4
Fueling product and service innovation. Measuring socio-economic impact can help companies understand
the needs, aspirations, resources, and incentives of their customers
– enabling them to develop winning new products and services and
improve existing offerings. It can help companies answer questions like:
Why haven’t our sales grown as expected?
What is the best way to segment new “base of the pyramid” markets?
How can we create demand for a product or service we know would
add value?
Where do we need help from external stakeholders – like
governments, donors, and civil society groups?
The figure below illustrates the variety of reasons companies are choosing to
measure their socio-economic impact.
Reduce cost and risk Capture opportunity
Obtain or maintain license to operate
Key stakeholders: communities and government authorities
Improve the business enabling environment
Key stakeholders: policymakers
Strengthen value chains
Key stakeholders: internal colleagues, suppliers, distributors, retailers, customers, and external partners such as NGOs and donors
Fuel product and service innovation
Key stakeholders: internal colleagues, customers, value chain partners, and external partners such as NGOs and donors
A mining company ensures that it is delivering socio-economic benefits in line with community expectations – building goodwill and mitigating operational risk – by tracking 32 social output Key Performance Indicators (KPIs) for 14 categories of social investment program.
A mobile telecommunications network operator measures the socio-economic impacts of mobile phones in order to inform dialogue with governments on regulatory frameworks that foster innovation and growth in the industry.
A biscuit manufacturer, which needs to operate its factory at full capacity in order to turn a profit, plans to track farmer-level socio-economic impact metrics like planting, farm gate price, and willingness to sell to the company in order to stay on top of any trends that might point to future problems with supply.
Through a socio-economic impact measurement exercise with a major international development NGO, a chain of agricultural supply stores found that more than 70% of its customers were women; with this information, the company was able to devise ways of engaging them more directly and serving them more effectively.
An equipment manufacturer uses a socio-economic impact assessment as the basis for engagement with a wide range of local stakeholders, identifying differences in perception and targeting its social investment and communication strategies accordingly.
A mining company uses socio-economic impact measurement to show host country governments how it contributes to development in the communities where it operates – so the government doesn’t feel it must obtain those contributions through taxation.
An Indian sugar buyer piloting a training program for its suppliers measured socio-economic impact indicators like productivity and farm income improvements in order to evaluate the program, predict likelihood of participation and uptake among future cohorts of farmers and ultimately justify its decision to expand the program.
A beverage manufacturer used a socio-economic impact study to show a civil society group how its small-scale distributors made enough money to stay in business, enabling the group to develop viable ways of leveraging the company’s distribution chain to improve access to critical health products.
Figure 1: Why measure socio economic impact?

10
Section 2: The essentia ls
Section 1 Section 2 Section 3 Section 4
The business case
The essentials
The tools
The road ahead

11
Section 2: The essentials
Section
1Section
2Section
3Section
4
While there are many reasons for companies to measure the socio-economic
impact of their activities, doing so is a relatively new phenomenon. Many
approaches have roots in the development community, where bilateral and
multilateral agencies like the UK Department for International Development
(DFID) and United Nations Development Programme (UNDP), international
financial institutions like the World Bank, and non-governmental or civil
society organizations like CARE have been doing it for many years.1 Socio-
economic impact is what these organizations are in business to achieve.
The development community has its own language and mental models,
which are reflected in many of the socio-economic impact measurement
frameworks available today – and which can be unfamiliar to corporate
users. In addition, because development organizations can be key
stakeholders and consumers of companies’ socio-economic impact
information, it is important to know how they think and what specific
impact measurement keywords may mean to them. “Impact” itself, for
example, can be a technical term – not always just shorthand for “results.”
Lesson 1A fundamental first step is to understand how business activities
translate into socio-economic impacts
Lesson 2Measurement can happen anywhere along the results chain
Lesson 3In the development community, the gold standard is to reach that last
link in the results chain; that last link is what is known as “impact”
Lesson 4Measuring “impact,” in the technical sense of the word, is challenging
to do
Lesson 5Prioritization and the judicious use of proxies can be key
A quick primer is therefore in order, with five key lessons:
1 - For further information on the wide range of tools available, the Donor Committee for Enterprise Development (DCED) provides an overview of donor agency policies and methodologies for results measurement at http://www.enterprise-development.org/page/rm#agencies while the Foundation Centre compiles over 150 tools, methods and standards for assessing social impact used by nonprofits, foundations, and other organizations in the TRASI database at http://trasi.foundationcenter.org/browse.php .
12
Section 2: The essentials
Section
1Section
2Section
3Section
4
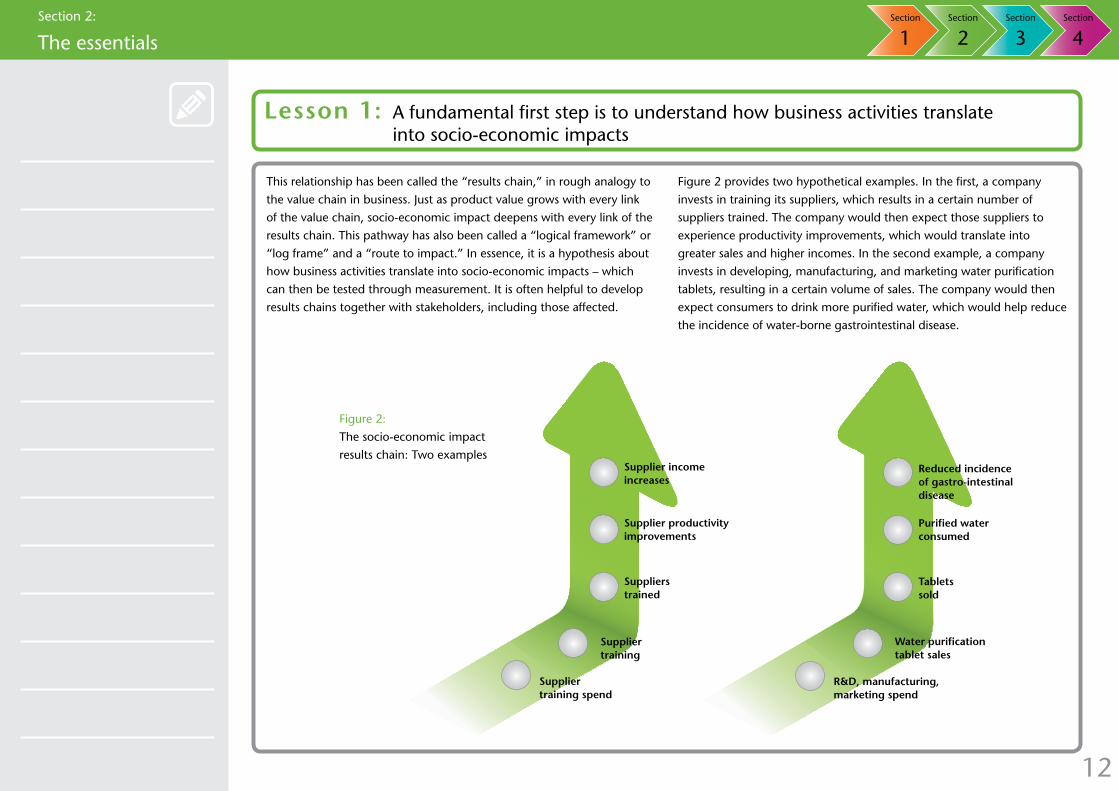
This relationship has been called the “results chain,” in rough analogy to
the value chain in business. Just as product value grows with every link
of the value chain, socio-economic impact deepens with every link of the
results chain. This pathway has also been called a “logical framework” or
“log frame” and a “route to impact.” In essence, it is a hypothesis about
how business activities translate into socio-economic impacts – which
can then be tested through measurement. It is often helpful to develop
results chains together with stakeholders, including those affected.
Figure 2 provides two hypothetical examples. In the first, a company
invests in training its suppliers, which results in a certain number of
suppliers trained. The company would then expect those suppliers to
experience productivity improvements, which would translate into
greater sales and higher incomes. In the second example, a company
invests in developing, manufacturing, and marketing water purification
tablets, resulting in a certain volume of sales. The company would then
expect consumers to drink more purified water, which would help reduce
the incidence of water-borne gastrointestinal disease.
Supplier income increases
Supplier productivity improvements
Supplier training
Suppliers trained
Supplier training spend
Reduced incidence of gastro-intestinal disease
Purified water consumed
Water purification tablet sales
Tablets sold
R&D, manufacturing, marketing spend
Figure 2:
The socio-economic impact
results chain: Two examples
Lesson 1: A fundamental first step is to understand how business activities translate into socio-economic impacts

13
Section 2: The essentials
Section
1Section
2Section
3Section
4
The results chain is made up of indicators, which can be measured in
terms of specific metrics. Figure 3 adds sample metrics to the results
chains illustrated in Figure 2.
Figure 3:
Metrics along the results chain
Lesson 2: Measurement can happen anywhere along the results chain
Reduced incidence of gastro-intestinal disease (% reduction vs. pre-sales)
Purified water consumed (% of total water consumed)
Water purification tablet sales (qualitative description)
Tablets sold (# sold)
R&D, manufacturing, marketing spend ($ spent)
Supplier income increases (% increase vs. pre-training)
Supplier productivity improvements (% increase in yield/hectare)
Supplier training (qualitative description)
Suppliers trained (# suppliers trained)
Supplier training spend ($ spent)
14
Section 2: The essentials
Section
1Section
2Section
3Section
4
Socio-economic “impact,” in the technical sense of the word, is goal-
level change in the assets, capabilities, opportunities, and standards
of living of people. Increases in educational attainment and income
or decreases in hunger and the incidence of disease are examples
of “impact.” Socio-economic “impact” can be positive or negative,
intended or unintended, temporary or sustainable over time. Positive and
sustainable “impact” is to the development community what sustainable
profit is to the business community. It is the end goal and ultimate
measure of success.
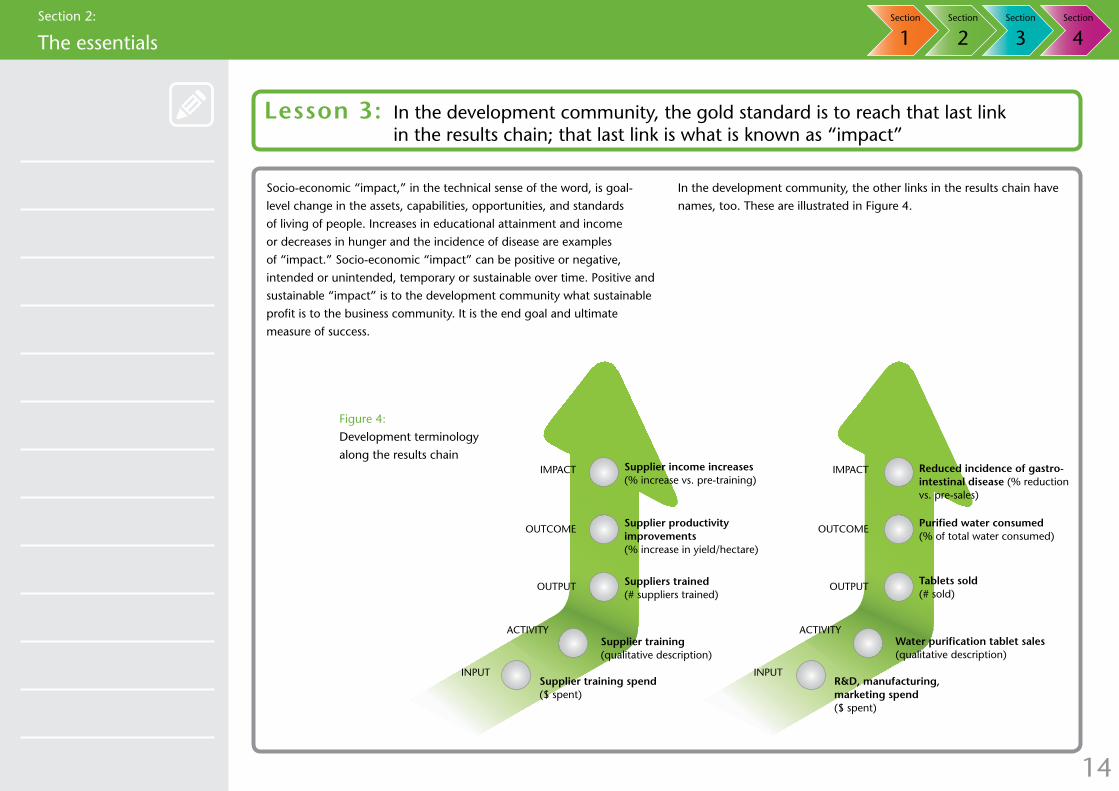
In the development community, the other links in the results chain have
names, too. These are illustrated in Figure 4.
Figure 4:
Development terminology
along the results chainReduced incidence of gastro-intestinal disease (% reduction vs. pre-sales)
Purified water consumed (% of total water consumed)
Water purification tablet sales (qualitative description)
Tablets sold (# sold)
R&D, manufacturing, marketing spend ($ spent)
Supplier income increases (% increase vs. pre-training)
Supplier productivity improvements (% increase in yield/hectare)
Supplier training (qualitative description)
Suppliers trained (# suppliers trained)
Supplier training spend ($ spent)
input
activity
output
outcome
impact
input
activity
output
outcome
impact
Lesson 3: In the development community, the gold standard is to reach that last link in the results chain; that last link is what is known as “impact”

15
Section 2: The essentials
Section
1Section
2Section
3Section
4
input
activity
output
outcome
impact
“Inputs”: The resources necessary to carry out an
activity. Since most resources are ultimately valued in
financial terms, the most common “input” indicator
is money spent.
“Activities”: The activities whose effects are to be
analyzed and measured. “Activity” indicators are
usually qualitative, and can range from product or
service sales to provision of training to compliance
with certain standards and policies.
“Outputs”: The results of the activity in question.
Common “output” indicators include volumes sold
and numbers of people reached.
“Outcomes”: Changes in the lives of the target
population. Common “outcome” indicators include
numbers and percentages of people adopting certain
behaviors, obtaining certain opportunities, and
having access to certain products and services.
“Impacts”: Goal-level changes in the lives of the
target population (and even future generations).
Common “impact” indicators include changes in
educational attainment, health status, and income
level.
Introducing the terminology
It is important to note that
results chains do not have to
be mapped and measured
in five steps. There may be
many more links in the chain,
especially between “outputs”
and “impacts.” Similarly,
results chains do not have
to be linear. “Activities” can
lead to multiple “outputs,”
each leading to multiple
“outcomes” and so on.
16
Section 2: The essentials
Section
1Section
2Section
3Section
4
There are a number of challenges involved in measuring “impact”-level metrics.
One challenge is time. “Impact”-level change can take a long time to materialize. For example, it could take years for consumption of micronutrient-fortified foods to have measurable effects on people’s health. This is a problem for organizations that lack the resources for longitudinal studies.
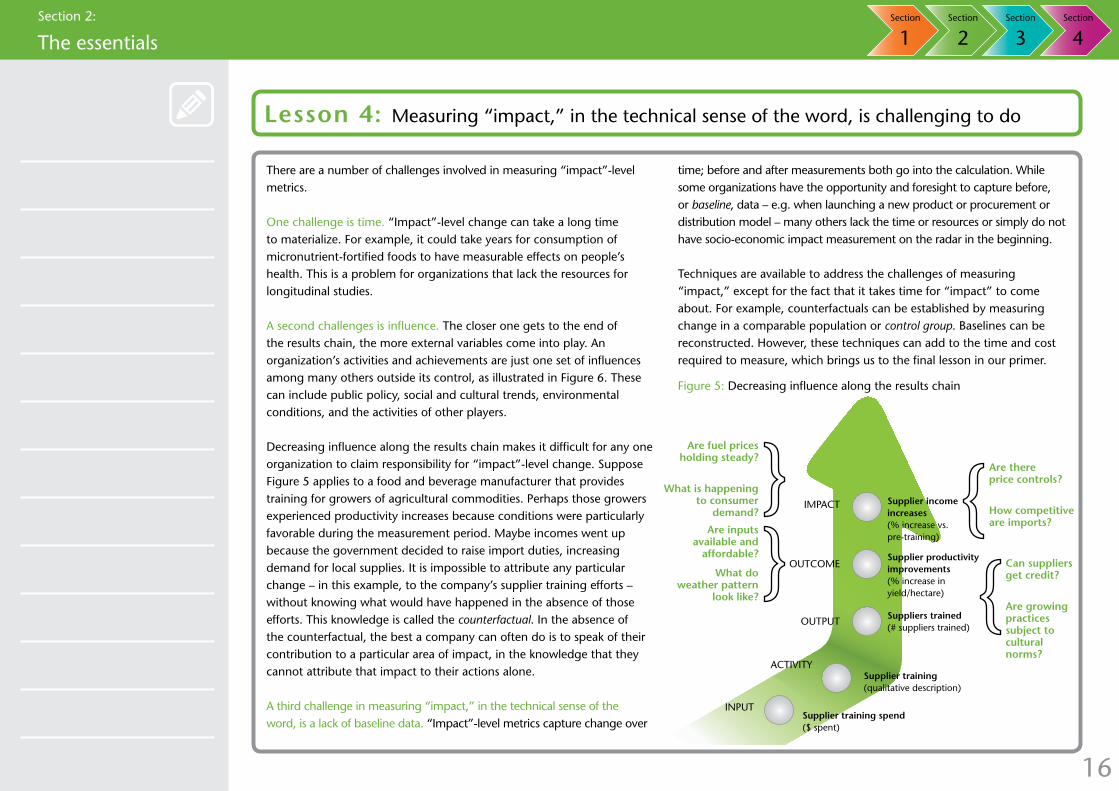
A second challenges is influence. The closer one gets to the end of the results chain, the more external variables come into play. An organization’s activities and achievements are just one set of influences among many others outside its control, as illustrated in Figure 6. These can include public policy, social and cultural trends, environmental conditions, and the activities of other players.
Decreasing influence along the results chain makes it difficult for any one organization to claim responsibility for “impact”-level change. Suppose Figure 5 applies to a food and beverage manufacturer that provides training for growers of agricultural commodities. Perhaps those growers experienced productivity increases because conditions were particularly favorable during the measurement period. Maybe incomes went up because the government decided to raise import duties, increasing demand for local supplies. It is impossible to attribute any particular change – in this example, to the company’s supplier training efforts – without knowing what would have happened in the absence of those efforts. This knowledge is called the counterfactual. In the absence of the counterfactual, the best a company can often do is to speak of their contribution to a particular area of impact, in the knowledge that they cannot attribute that impact to their actions alone.
A third challenge in measuring “impact,” in the technical sense of the word, is a lack of baseline data. “Impact”-level metrics capture change over
time; before and after measurements both go into the calculation. While some organizations have the opportunity and foresight to capture before, or baseline, data – e.g. when launching a new product or procurement or distribution model – many others lack the time or resources or simply do not have socio-economic impact measurement on the radar in the beginning.
Techniques are available to address the challenges of measuring “impact,” except for the fact that it takes time for “impact” to come about. For example, counterfactuals can be established by measuring change in a comparable population or control group. Baselines can be reconstructed. However, these techniques can add to the time and cost required to measure, which brings us to the final lesson in our primer.
Figure 5: Decreasing influence along the results chain
Supplier income increases (% increase vs. pre-training)
Supplier productivity improvements (% increase in yield/hectare)
Supplier training (qualitative description)
Suppliers trained (# suppliers trained)
Supplier training spend ($ spent)
input
activity
output
outcome
impact
Are inputs available and
affordable?
What do weather pattern
look like?
Are fuel prices holding steady?
What is happening to consumer
demand?
Are there price controls?
How competitive are imports?
Can suppliers get credit?
Are growing practices subject to cultural norms?
Lesson 4: Measuring “impact,” in the technical sense of the word, is challenging to do
17
Section 2: The essentials
Section
1Section
2Section
3Section
4
Resources are limited, in business and the development community alike. The cost and complexity of measuring must be proportional to the value that measuring helps to create. As a result, prioritization is key.
Companies have wide-ranging socio-economic impacts stemming from consumption of the products and services they offer, policies and practices in their own operations and along the value chain, their infrastructure development investments and tax payments, philanthropic initiatives, and more. It would be fascinating to measure them all, but companies must invest their measurement time and resources in alignment with their strategies to create value. It is important that these include core business strategies. Core business operations are larger-scale and more sustainable drivers of socio-economic impact, whether positive or negative, than philanthropy. Pure philanthropy is out of vogue even within the development community, where “harnessing the core competencies of business” has become a familiar refrain.
The challenge is therefore to find and focus on socio-economic impacts related to business performance. Internal and external stakeholder engagement can help a company identify and prioritize material impacts.
A related challenge is to select those indicators. The cost and complexity of measuring socio-economic impact must be proportional to the value that measuring enables a company to create.
“Impacts,” defined above, are goal-level changes in people’s assets, capabilities, opportunities, and standards of living. “Impacts” are what matter most for society and, from a long-term sustainability perspective, for business. However, they can take years to materialize and are difficult to measure and attribute to any one organization. It may be important to do so, for example for market research, communications, or compliance purposes. At the same time, to manage their performance,
organizations need real-time information that tells them what they can do now to improve.
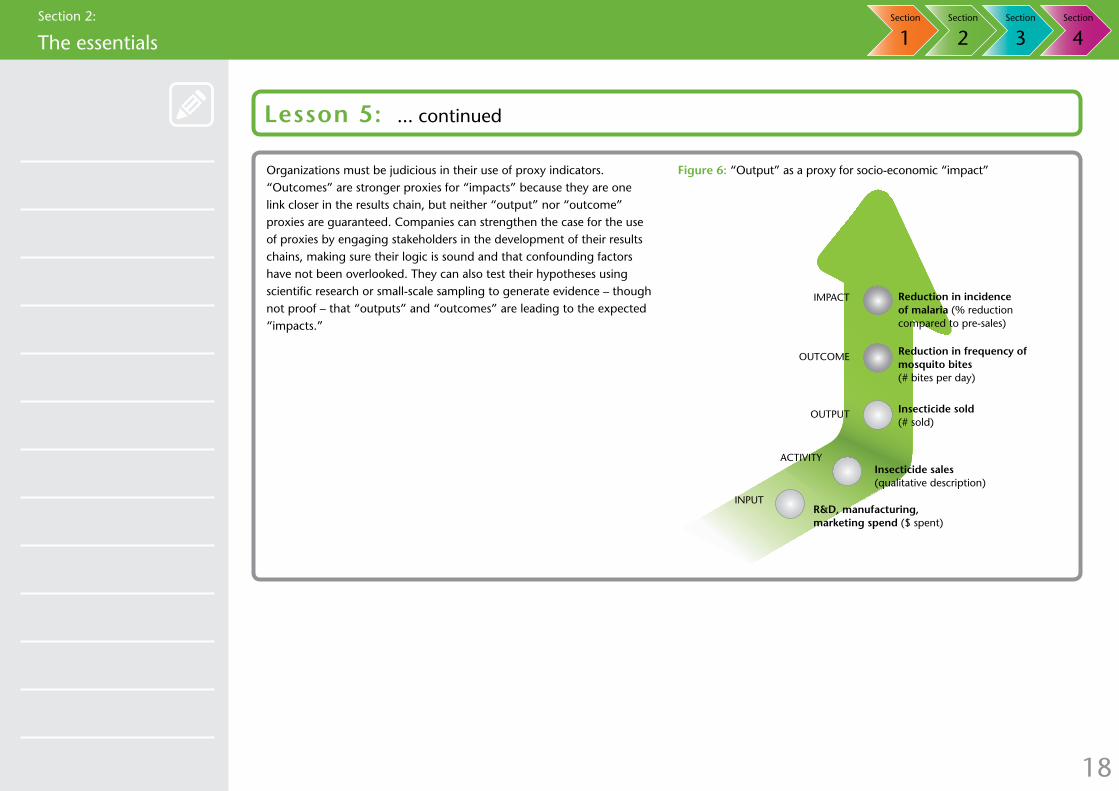
As a result, many organizations choose to measure “outcomes” and even “outputs” as proxies for “impact.” Cornell University’s Erik Simanis and Mark Milstein provide an example.2 S.C. Johnson, a leading maker of household products, markets insect repellent lotion and insecticide spray in low-income, rural areas of Ghana. The company hopes its products help reduce the incidence of malaria there (an “impact”), but there are so many other factors in the incidence of the disease that finding out for sure would be costly. Moreover, it would have little bearing on the bottom line. What affects the bottom line is the number of units of product sold (an “output”).
In this case, the company considers the number of units of product sold a good proxy for reduction in the incidence of malaria because the product is scientifically proven to kill mosquitoes, which cause malaria. As long as consumers are buying the products, it is reasonable to assume they are killing mosquitoes (if they were not, consumers would not purchase them again) and thus helping to reduce the incidence of malaria.
Lesson 5: Prioritization and the judicious use of proxies can be key
2 - Simanis, Erik and Mark Milstein (2012). “Back to Business Fundamentals: Making “Bottom of the Pyramid” Relevant to Core Business.” Field Action Science Reports Special Issue No. 4, online at http://factsreports.revues.org/1581 (accessed September 1, 2012). Page 88.
18
Section 2: The essentials
Section
1Section
2Section
3Section
4
Organizations must be judicious in their use of proxy indicators. “Outcomes” are stronger proxies for “impacts” because they are one link closer in the results chain, but neither “output” nor “outcome” proxies are guaranteed. Companies can strengthen the case for the use of proxies by engaging stakeholders in the development of their results chains, making sure their logic is sound and that confounding factors have not been overlooked. They can also test their hypotheses using scientific research or small-scale sampling to generate evidence – though not proof – that “outputs” and “outcomes” are leading to the expected “impacts.”
Lesson 5: ... continued
Reduction in incidence of malaria (% reduction compared to pre-sales)
Reduction in frequency of mosquito bites (# bites per day)
Insecticide sales (qualitative description)
Insecticide sold (# sold)
R&D, manufacturing, marketing spend ($ spent)
Figure 6: “Output” as a proxy for socio-economic “impact”
input
activity
output
outcome
impact
19
Section 2: The essentials
Section
1Section
2Section
3Section
4
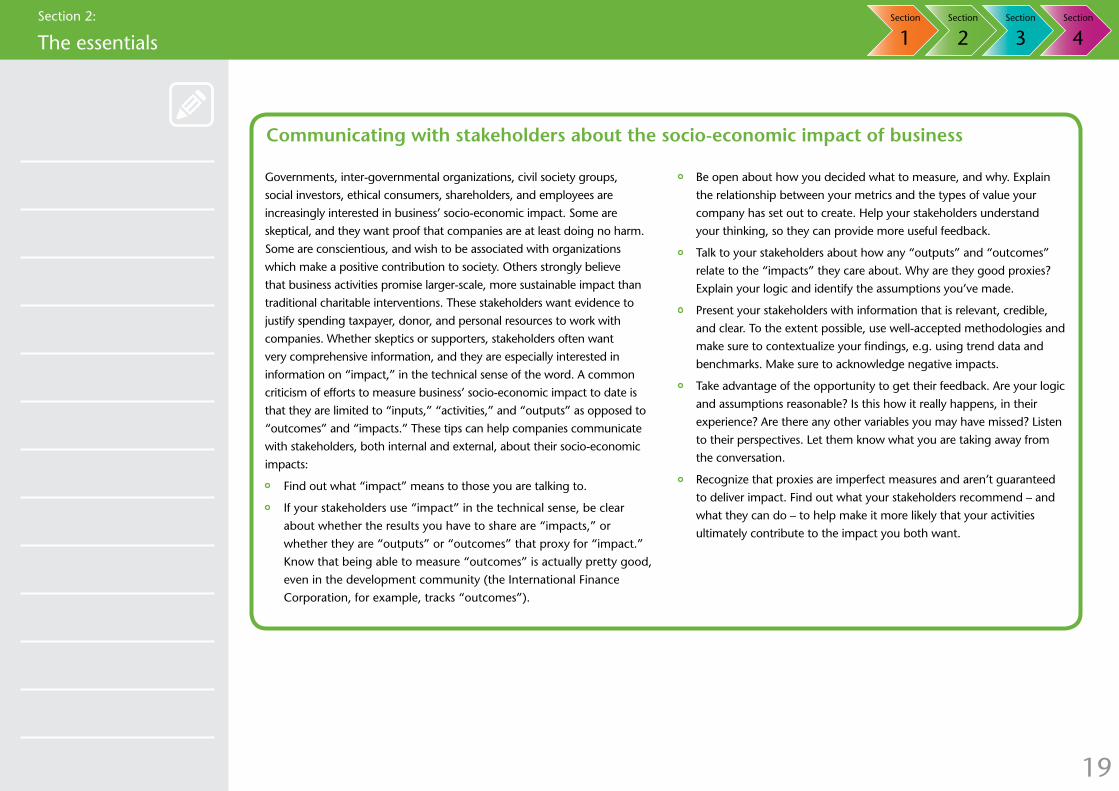
Communicating with stakeholders about the socio-economic impact of business
Governments, inter-governmental organizations, civil society groups,
social investors, ethical consumers, shareholders, and employees are
increasingly interested in business’ socio-economic impact. Some are
skeptical, and they want proof that companies are at least doing no harm.
Some are conscientious, and wish to be associated with organizations
which make a positive contribution to society. Others strongly believe
that business activities promise larger-scale, more sustainable impact than
traditional charitable interventions. These stakeholders want evidence to
justify spending taxpayer, donor, and personal resources to work with
companies. Whether skeptics or supporters, stakeholders often want
very comprehensive information, and they are especially interested in
information on “impact,” in the technical sense of the word. A common
criticism of efforts to measure business’ socio-economic impact to date is
that they are limited to “inputs,” “activities,” and “outputs” as opposed to
“outcomes” and “impacts.” These tips can help companies communicate
with stakeholders, both internal and external, about their socio-economic
impacts:
Find out what “impact” means to those you are talking to.
If your stakeholders use “impact” in the technical sense, be clear
about whether the results you have to share are “impacts,” or
whether they are “outputs” or “outcomes” that proxy for “impact.”
Know that being able to measure “outcomes” is actually pretty good,
even in the development community (the International Finance
Corporation, for example, tracks “outcomes”).
Be open about how you decided what to measure, and why. Explain
the relationship between your metrics and the types of value your
company has set out to create. Help your stakeholders understand
your thinking, so they can provide more useful feedback.
Talk to your stakeholders about how any “outputs” and “outcomes”
relate to the “impacts” they care about. Why are they good proxies?
Explain your logic and identify the assumptions you’ve made.
Present your stakeholders with information that is relevant, credible,
and clear. To the extent possible, use well-accepted methodologies and
make sure to contextualize your findings, e.g. using trend data and
benchmarks. Make sure to acknowledge negative impacts.
Take advantage of the opportunity to get their feedback. Are your logic
and assumptions reasonable? Is this how it really happens, in their
experience? Are there any other variables you may have missed? Listen
to their perspectives. Let them know what you are taking away from
the conversation.
Recognize that proxies are imperfect measures and aren’t guaranteed
to deliver impact. Find out what your stakeholders recommend – and
what they can do – to help make it more likely that your activities
ultimately contribute to the impact you both want.
20
Section 3: The tools
Section 1 Section 2 Section 3 Section 4
The business case
The essentials
The tools
The road ahead
21
Section 3: The tools
Section
1Section
2Section
3Section
4
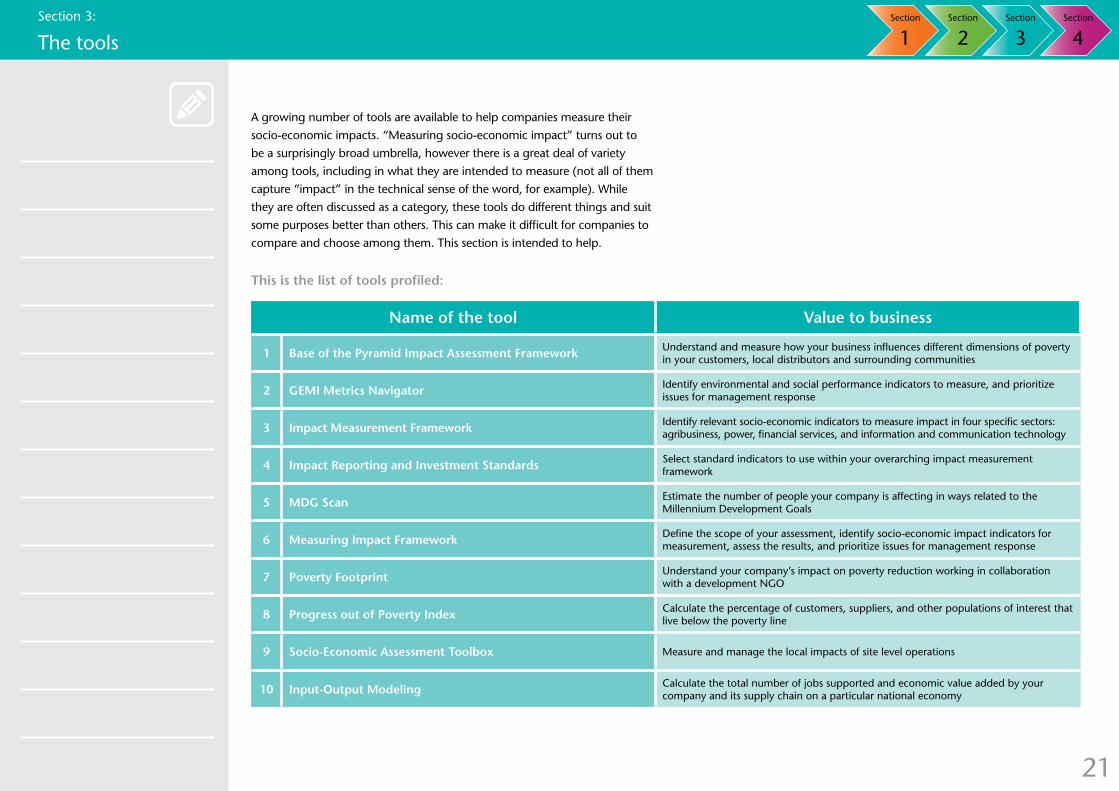
A growing number of tools are available to help companies measure their
socio-economic impacts. “Measuring socio-economic impact” turns out to
be a surprisingly broad umbrella, however there is a great deal of variety
among tools, including in what they are intended to measure (not all of them
capture “impact” in the technical sense of the word, for example). While
they are often discussed as a category, these tools do different things and suit
some purposes better than others. This can make it difficult for companies to
compare and choose among them. This section is intended to help.
This is the list of tools profiled:
Name of the tool Value to business
1 Base of the Pyramid Impact Assessment Framework Understand and measure how your business influences different dimensions of poverty in your customers, local distributors and surrounding communities
2 GEMI Metrics Navigator Identify environmental and social performance indicators to measure, and prioritize issues for management response
3 Impact Measurement Framework Identify relevant socio-economic indicators to measure impact in four specific sectors: agribusiness, power, financial services, and information and communication technology
4 Impact Reporting and Investment Standards Select standard indicators to use within your overarching impact measurement framework
5 MDG Scan Estimate the number of people your company is affecting in ways related to the Millennium Development Goals
6 Measuring Impact Framework Define the scope of your assessment, identify socio-economic impact indicators for measurement, assess the results, and prioritize issues for management response
7 Poverty Footprint Understand your company’s impact on poverty reduction working in collaboration with a development NGO
8 Progress out of Poverty Index Calculate the percentage of customers, suppliers, and other populations of interest that live below the poverty line
9 Socio-Economic Assessment Toolbox Measure and manage the local impacts of site level operations
10 Input-Output Modeling Calculate the total number of jobs supported and economic value added by your company and its supply chain on a particular national economy
22
Section 3: The tools
Section
1Section
2Section
3Section
4
How to use this guideThe following pages describe ten different socio-economic impact
measurement tools that have been developed for business and that, in the
WBCSD’s experience, companies are increasingly interested in. We provide a
short summary of each tool and its developer, and then assess 9 dimensions
a company will want to consider in choosing the best tool – or combination
of tools – for its needs:
Strategic fit Many socio-economic impact measurement tools are flexible, and can
be used in support of company efforts to obtain or maintain license
to operate, engage policymakers to improve the business enabling
environment, strengthen their value chains, or fuel product and service
development to capture new markets and grow revenues – depending
on specific design and implementation choices made by the user.
Examples include the Base of the Pyramid (BOP) Impact Assessment
Framework, the Initiative for Global Development’s (IGD) Impact
Measurement Framework, the Global Environmental Management
Initiative (GEMI) Metrics Navigator, and the WBCSD Measuring
Impact Framework. Other tools are more targeted. For example,
Anglo American’s Socio-Economic Assessment Toolbox (SEAT) has
been designed with social license to operate and the business enabling
environment in mind, and it can help strengthen value chains to the
extent local procurement is part of the business strategy. An important
factor in strategic fit is the extent to which a tool generates relevant,
credible information for those who need it – whether they be company
managers, local community members, governments, or NGOs. This
is a function of scope, the specific metrics chosen, the credibility of
the measurement process and how quickly it can be carried out, and
whether or not negative impacts are included as well as positive ones.
Strategic objectives include:
Secure license to operate
Improve business enabling environment
Strengthen value chains
Fuel product and service innovation
Applicable level(s) of analysis: Most frameworks are designed to be flexible and can be applied at
many different levels. For example, the GEMI Metrics Navigator and
WBCSD Measuring Impact Framework can be applied at the site, value
chain, business line, or company level, depending on the company’s
needs. However, several frameworks are designed to be applied at
specific levels and yield better or more meaningful results at those
levels. For example, Anglo American’s SEAT is designed for use at the
site level and the MDG Scan works best at the company level.
Levels of analysis include:
Site
Value chain
Business line
Company operations at the national level
Company
Guidance included
Frameworks vary in the nature of the guidance they offer. Some are
very comprehensive, helping the user to set the scope for a socio-
economic impact measurement exercise, select indicators/metrics,
gather and/or generate data, and interpret the results. Others are very
specific. For example, the Impact Reporting and Investment Standards
(IRIS) only helps select indicators/metrics and the Progress out of
Poverty Index (PPI) generates a single, albeit important, metric. For
this reason, again, combining frameworks can be useful. For instance,
a company might use IRIS indicators within the overall process laid out
in WBCSD’s Measuring Impact Framework.
Guidance is available for:
Setting scope
Selecting indicators/metrics
Gathering and/or generating data
Interpreting results

23
Section 3: The tools
Section
1Section
2Section
3Section
4
Metrics Some frameworks are agnostic as to the specific metrics companies
should choose, focusing instead on the process of choosing relevant
ones (e.g. GEMI Metrics Navigator and WBCSD Measuring Impact
Framework). Others propose specific metrics – some at the “input,”
“activity,” and “output” end of the spectrum (like IGD and IRIS) and
others pushing toward “outcomes” and “impacts” (like the BOP
Impact Assessment Framework and the Poverty Footprint). Still other
frameworks focus on generating a small number of specific metrics
(like the MDG Scan, which estimates the numbers of people reached
in the eight Millennium Development Goal areas, and the Progress
out of Poverty Index, which calculates the percentage of people below
the poverty line).
Types of metrics covered include:
Input, activity and output metrics
Outcome and impact metrics
Flexible – can be tailored to business needs
Data requirements Data requirements vary depending on the metrics in question. As a
result, it is impossible to generalize about the data requirements of
frameworks that are agnostic about metrics. Frameworks that focus
on “input,” “activity,” and “output” metrics tend to rely more heavily
on data a company already has or can easily collect. Those that
push toward “outcomes” and “impacts” require more external data
collection, including from stakeholders on the ground.
Data requirements include:
Internal company data
External data collection
Flexible – can be tailored to business needs
Key audiences Which audiences find socio-economic impact measurement relevant
depends on the type of information it generates and nature of
the process (including whether or not it is credible in their eyes).
Companies should make sure that the audiences for their socio-
economic impact measurement work align with the strategic fit they
are hoping to achieve. For example, a company measuring to support
efforts to improve the business enabling environment must make sure
the data is relevant and credible to government policymakers.
Target audiences include:
Company managers
Civil society groups
Donors
Impact investors
Governments
Level of effort Frameworks vary in the level of effort required to implement. They
involve different sets of tasks and have different cost and time
implications. While available cost and time data are patchy, factors
include the scope of the exercise and specific metrics selected; the
extent to which external data must be collected from stakeholders on
the ground; the level of stakeholder engagement conducted; whether
or not a public report must be prepared; the cost of third party
services; and company staff time required. There is a need to build
the knowledge base on the level of effort involved in implementing
these as user experience grows. It should be stressed that it is not
appropriate to compare these frameworks on the basis of level of
effort alone, since they offer different value in return.
The level of effort can vary by:
Tasks required
Cost
Time required

24
Section 3: The tools
Section
1Section
2Section
3Section
4
Developer services While socio-economic impact measurement frameworks offer
guidance in and of themselves, many developers offer services that
expand or deepen the guidance available. They may also offer to
implement their frameworks on behalf of or in collaboration with
companies, and to write public reports on the results.
Usage to date
Some frameworks are brand-new (like the IGD Impact Measurement
Framework). Others have been used tens or even hundreds of times
(like SEAT and IRIS).
For each framework, a case study and hyperlink for more information are
also provided.
What is not covered in this guide
“Measuring socio-economic impact” turns out to be a surprisingly
broad umbrella, and there is a great deal of variety among the resources
profiled in this Guide. We are aware that not all impact-related tools are
included here, most notably the following tools, which are already well
established with published guidance:
Environmental and Social Impact Assessments (EIAs and ESIAs)EIAs and ESIAs are intended to help companies anticipate the
environmental and social impacts of proposed projects, so they can be
mitigated or enhanced. While some EIA and ESIA tools are designed to be
used before, during, and after projects take place, such assessments are
most often conducted before – which can be required by government
and some investors. The practice of environmental and social impact
assessment is well-established, with EIA dating back to the 1960s.
Human Rights Impact Assessments (HRIAs)Just as EIAs and ESIAs are intended to help companies anticipate the
environmental and social impacts of proposed projects so they can be
mitigated or enhanced, HRIAs are intended to help companies anticipate
their impacts on stakeholders’ human rights, so they can be mitigated
or enhanced. While not yet required by law or most investors, HRIAs
reflect an emerging global norm that companies have a responsibility
to respect human rights within their spheres of influence. HRIAs have
been described as “the younger sibling of the environmental and social
impact assessments.”3 Nevertheless, numerous tools and resources exist,
to which a comprehensive guide was published in 2009.
Impact Reporting ToolsImpact reporting tools, most notably the Global Reporting Initiative’s
G3.1 Guidelines, are intended to help companies identify and present
material impact information to a range of stakeholders. A distinct
process and set of tools would be required to obtain or generate that
impact information.3 - Aim for Human Rights. 2009. “Guide to Corporate Human Rights Impact Assessment Tools.”Online at http://www.humanrightsimpact.org/fileadmin/hria_resources/Business_centre/HRB_Booklet_2009.pdf (accessed November 4, 2012).

25
Section 3: The tools
Section
1Section
2Section
3Section
4
Tools
Strategic fitApplicable level(s)
of analysisGuidance included Metrics Data requirements
Developer services
Secu
re li
cen
se t
o o
per
ate
Imp
rove
bus
ines
s en
ablin
g
envi
ron
men
t
Stre
ng
then
val
ue c
hai
ns
Fuel
pro
duc
t an
d s
ervi
ce
inn
ova
tio
n
Site
Val
ue c
hai
n
Bus
ines
s lin
e
Co
mp
any
op
erat
ion
s at
th
e n
atio
nal
leve
l
Co
mp
any
Sett
ing
sco
pe
Sele
ctin
g in
dic
ato
rs/m
etri
cs
Gat
her
ing
an
d/o
r
gen
erat
ing
dat
a
Inte
rpre
tin
g r
esul
ts
Inp
ut, a
ctiv
ity
and
out
put
Out
com
e an
d im
pac
t
Flex
ible
Inte
rnal
co
mp
any
dat
a
Exte
rnal
dat
a co
llect
ion
Flex
ible
Yes
No
1Base of the Pyramid Impact
Assessment Framework
2 GEMI Metrics Navigator
3Impact Measurement
Framework
4Impact Reporting and
Investment Standards (IRIS)
5 MDG Scan
6Measuring Impact
Framework
7 Poverty Footprint
8Progress out of Poverty
Index (PPI)
9Socio-Economic Assessment
Toolbox (SEAT)
10 Input-output modelling
addressed by this tool not addressed by this tool, but may be addressed through developer services
26
Section 3: The tools
Section
1Section
2Section
3Section
4
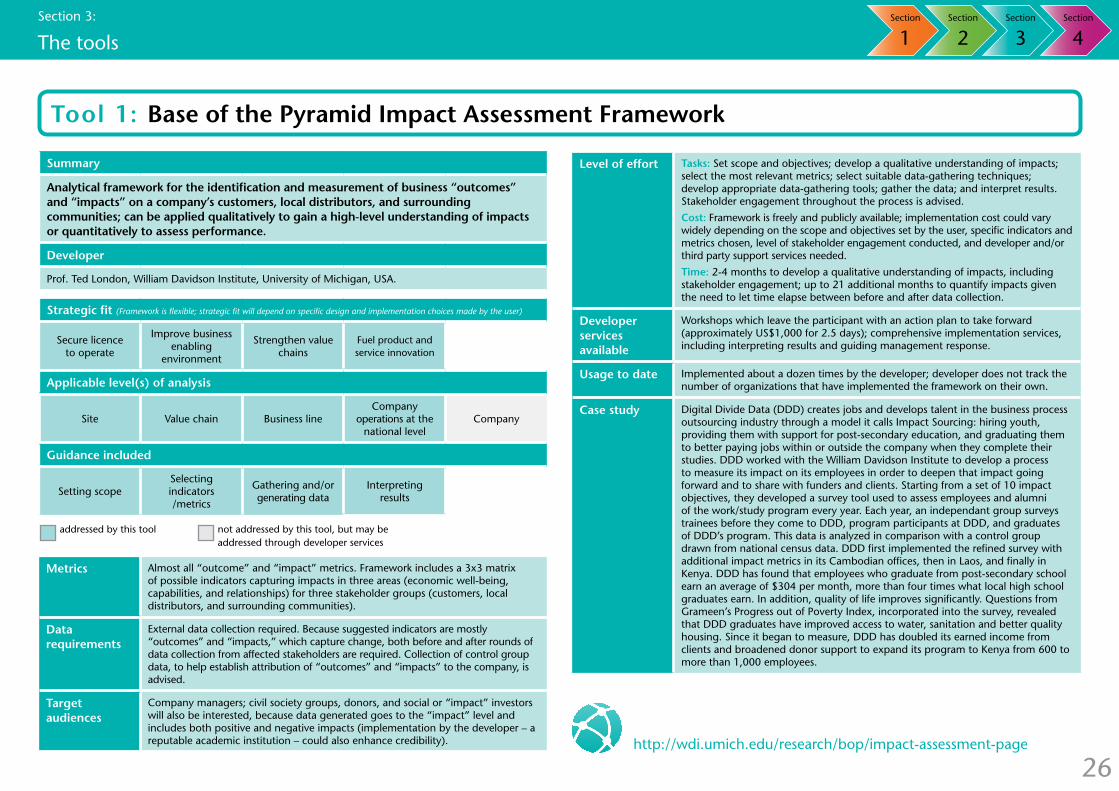
Metrics Almost all “outcome” and “impact” metrics. Framework includes a 3x3 matrix of possible indicators capturing impacts in three areas (economic well-being, capabilities, and relationships) for three stakeholder groups (customers, local distributors, and surrounding communities).
Data requirements
External data collection required. Because suggested indicators are mostly “outcomes” and “impacts,” which capture change, both before and after rounds of data collection from affected stakeholders are required. Collection of control group data, to help establish attribution of “outcomes” and “impacts” to the company, is advised.
Target audiences
Company managers; civil society groups, donors, and social or “impact” investors will also be interested, because data generated goes to the “impact” level and includes both positive and negative impacts (implementation by the developer – a reputable academic institution – could also enhance credibility).
Tool 1: Base of the Pyramid Impact Assessment Framework
Summary
Analytical framework for the identification and measurement of business “outcomes” and “impacts” on a company’s customers, local distributors, and surrounding communities; can be applied qualitatively to gain a high-level understanding of impacts or quantitatively to assess performance.
Developer
Prof. Ted London, William Davidson Institute, University of Michigan, USA.
Strategic fit (Framework is flexible; strategic fit will depend on specific design and implementation choices made by the user)
Secure licence to operate
Improve business enabling
environment
Strengthen value chains
Fuel product and service innovation
Applicable level(s) of analysis
Site Value chain Business lineCompany
operations at the national level
Company
Guidance included
Setting scopeSelecting indicators /metrics
Gathering and/or generating data
Interpreting results
Level of effort Tasks: Set scope and objectives; develop a qualitative understanding of impacts; select the most relevant metrics; select suitable data-gathering techniques; develop appropriate data-gathering tools; gather the data; and interpret results. Stakeholder engagement throughout the process is advised.
Cost: Framework is freely and publicly available; implementation cost could vary widely depending on the scope and objectives set by the user, specific indicators and metrics chosen, level of stakeholder engagement conducted, and developer and/or third party support services needed.
Time: 2-4 months to develop a qualitative understanding of impacts, including stakeholder engagement; up to 21 additional months to quantify impacts given the need to let time elapse between before and after data collection.
Developer services available
Workshops which leave the participant with an action plan to take forward (approximately US$1,000 for 2.5 days); comprehensive implementation services, including interpreting results and guiding management response.
Usage to date Implemented about a dozen times by the developer; developer does not track the number of organizations that have implemented the framework on their own.
Case study Digital Divide Data (DDD) creates jobs and develops talent in the business process outsourcing industry through a model it calls Impact Sourcing: hiring youth, providing them with support for post-secondary education, and graduating them to better paying jobs within or outside the company when they complete their studies. DDD worked with the William Davidson Institute to develop a process to measure its impact on its employees in order to deepen that impact going forward and to share with funders and clients. Starting from a set of 10 impact objectives, they developed a survey tool used to assess employees and alumni of the work/study program every year. Each year, an independant group surveys trainees before they come to DDD, program participants at DDD, and graduates of DDD’s program. This data is analyzed in comparison with a control group drawn from national census data. DDD first implemented the refined survey with additional impact metrics in its Cambodian offices, then in Laos, and finally in Kenya. DDD has found that employees who graduate from post-secondary school earn an average of $304 per month, more than four times what local high school graduates earn. In addition, quality of life improves significantly. Questions from Grameen’s Progress out of Poverty Index, incorporated into the survey, revealed that DDD graduates have improved access to water, sanitation and better quality housing. Since it began to measure, DDD has doubled its earned income from clients and broadened donor support to expand its program to Kenya from 600 to more than 1,000 employees.
addressed by this tool not addressed by this tool, but may be addressed through developer services
http://wdi.umich.edu/research/bop/impact-assessment-page
27
Section 3: The tools
Section
1Section
2Section
3Section
4
addressed by this tool not addressed by this tool, but may be addressed through developer services
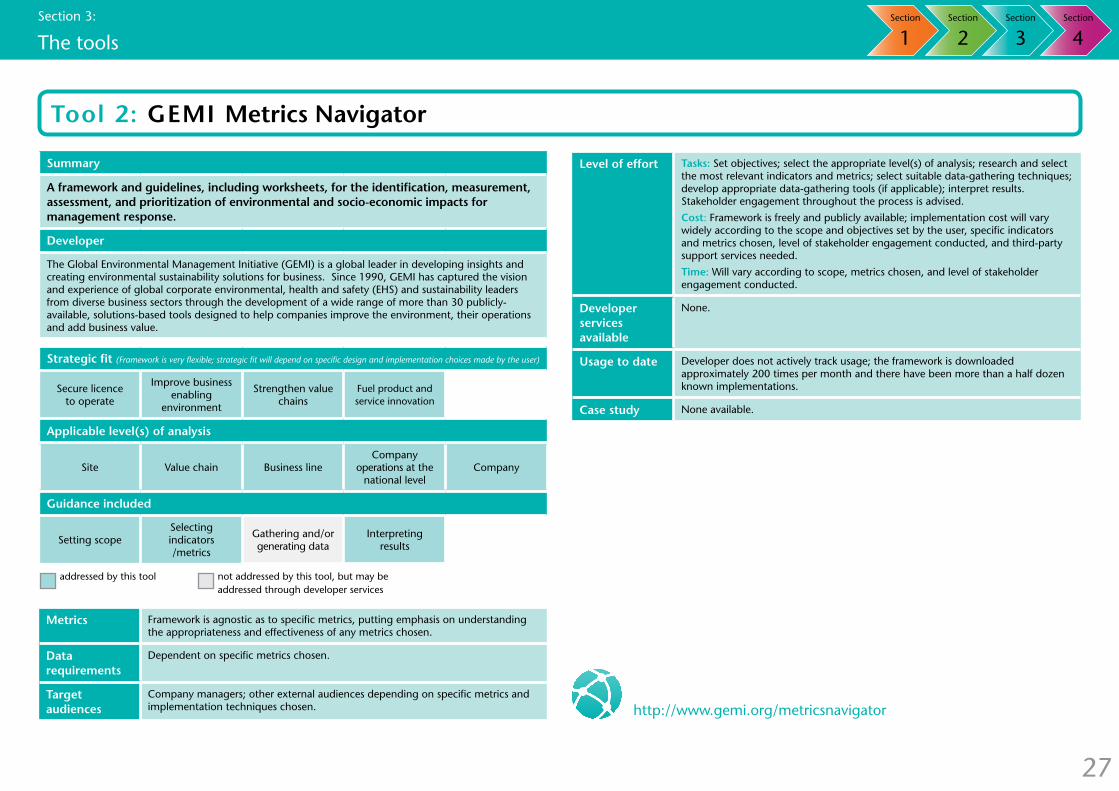
Metrics Framework is agnostic as to specific metrics, putting emphasis on understanding the appropriateness and effectiveness of any metrics chosen.
Data requirements
Dependent on specific metrics chosen.
Target audiences
Company managers; other external audiences depending on specific metrics and implementation techniques chosen.
Tool 2: GEMI Metrics Navigator
Summary
A framework and guidelines, including worksheets, for the identification, measurement, assessment, and prioritization of environmental and socio-economic impacts for management response.
Developer
The Global Environmental Management Initiative (GEMI) is a global leader in developing insights and creating environmental sustainability solutions for business. Since 1990, GEMI has captured the vision and experience of global corporate environmental, health and safety (EHS) and sustainability leaders from diverse business sectors through the development of a wide range of more than 30 publicly-available, solutions-based tools designed to help companies improve the environment, their operations and add business value.
Strategic fit (Framework is very flexible; strategic fit will depend on specific design and implementation choices made by the user)
Secure licence to operate
Improve business enabling
environment
Strengthen value chains
Fuel product and service innovation
Applicable level(s) of analysis
Site Value chain Business lineCompany
operations at the national level
Company
Guidance included
Setting scopeSelecting indicators /metrics
Gathering and/or generating data
Interpreting results
http://www.gemi.org/metricsnavigator
Level of effort Tasks: Set objectives; select the appropriate level(s) of analysis; research and select the most relevant indicators and metrics; select suitable data-gathering techniques; develop appropriate data-gathering tools (if applicable); interpret results. Stakeholder engagement throughout the process is advised.
Cost: Framework is freely and publicly available; implementation cost will vary widely according to the scope and objectives set by the user, specific indicators and metrics chosen, level of stakeholder engagement conducted, and third-party support services needed.
Time: Will vary according to scope, metrics chosen, and level of stakeholder engagement conducted.
Developer services available
None.
Usage to date Developer does not actively track usage; the framework is downloaded approximately 200 times per month and there have been more than a half dozen known implementations.
Case study None available.
28
Section 3: The tools
Section
1Section
2Section
3Section
4
addressed by this tool not addressed by this tool, but may be addressed through developer services
Tool 3: Impact Measurement Framework
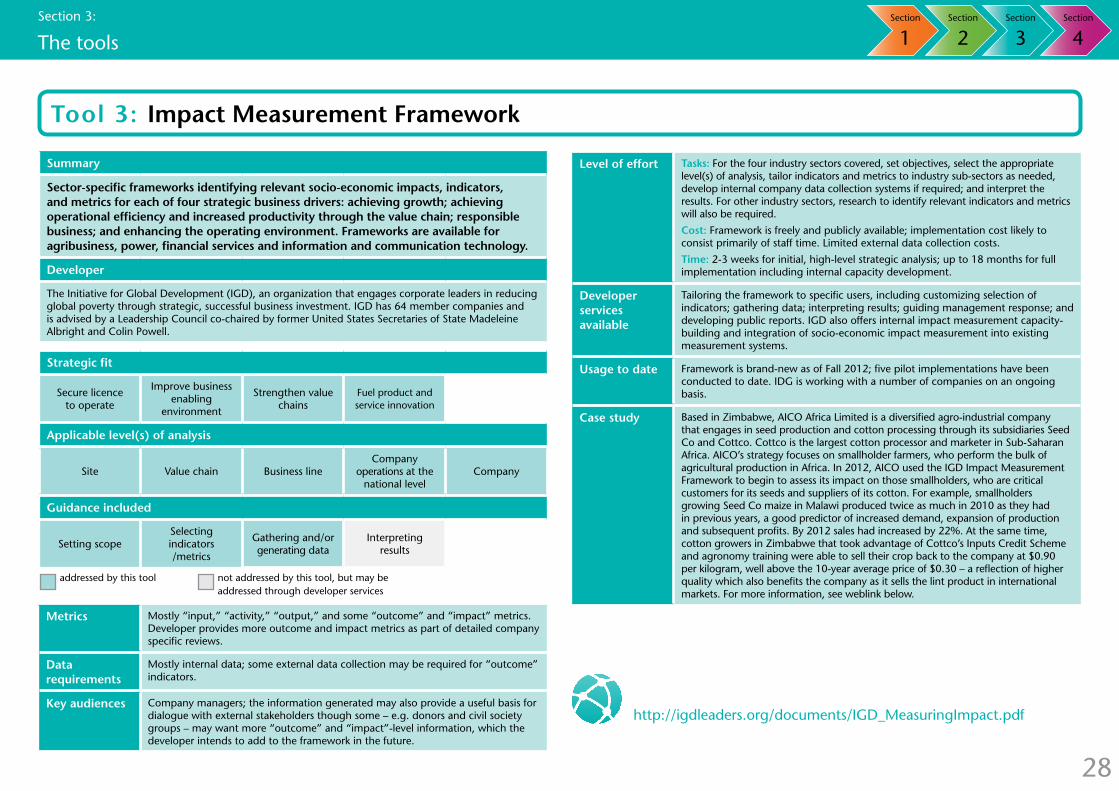
Metrics Mostly “input,” “activity,” “output,” and some “outcome” and “impact” metrics. Developer provides more outcome and impact metrics as part of detailed company specific reviews.
Data requirements
Mostly internal data; some external data collection may be required for “outcome” indicators.
Key audiences Company managers; the information generated may also provide a useful basis for dialogue with external stakeholders though some – e.g. donors and civil society groups – may want more “outcome” and “impact”-level information, which the developer intends to add to the framework in the future.
Summary
Sector-specific frameworks identifying relevant socio-economic impacts, indicators, and metrics for each of four strategic business drivers: achieving growth; achieving operational efficiency and increased productivity through the value chain; responsible business; and enhancing the operating environment. Frameworks are available for agribusiness, power, financial services and information and communication technology.
Developer
The Initiative for Global Development (IGD), an organization that engages corporate leaders in reducing global poverty through strategic, successful business investment. IGD has 64 member companies and is advised by a Leadership Council co-chaired by former United States Secretaries of State Madeleine Albright and Colin Powell.
Strategic fit
Secure licence to operate
Improve business enabling
environment
Strengthen value chains
Fuel product and service innovation
Applicable level(s) of analysis
Site Value chain Business lineCompany
operations at the national level
Company
Guidance included
Setting scopeSelecting indicators /metrics
Gathering and/or generating data
Interpreting results
http://igdleaders.org/documents/IGD_MeasuringImpact.pdf
Level of effort Tasks: For the four industry sectors covered, set objectives, select the appropriate level(s) of analysis, tailor indicators and metrics to industry sub-sectors as needed, develop internal company data collection systems if required; and interpret the results. For other industry sectors, research to identify relevant indicators and metrics will also be required.
Cost: Framework is freely and publicly available; implementation cost likely to consist primarily of staff time. Limited external data collection costs.
Time: 2-3 weeks for initial, high-level strategic analysis; up to 18 months for full implementation including internal capacity development.
Developer services available
Tailoring the framework to specific users, including customizing selection of indicators; gathering data; interpreting results; guiding management response; and developing public reports. IGD also offers internal impact measurement capacity-building and integration of socio-economic impact measurement into existing measurement systems.
Usage to date Framework is brand-new as of Fall 2012; five pilot implementations have been conducted to date. IDG is working with a number of companies on an ongoing basis.
Case study Based in Zimbabwe, AICO Africa Limited is a diversified agro-industrial company that engages in seed production and cotton processing through its subsidiaries Seed Co and Cottco. Cottco is the largest cotton processor and marketer in Sub-Saharan Africa. AICO’s strategy focuses on smallholder farmers, who perform the bulk of agricultural production in Africa. In 2012, AICO used the IGD Impact Measurement Framework to begin to assess its impact on those smallholders, who are critical customers for its seeds and suppliers of its cotton. For example, smallholders growing Seed Co maize in Malawi produced twice as much in 2010 as they had in previous years, a good predictor of increased demand, expansion of production and subsequent profits. By 2012 sales had increased by 22%. At the same time, cotton growers in Zimbabwe that took advantage of Cottco’s Inputs Credit Scheme and agronomy training were able to sell their crop back to the company at $0.90 per kilogram, well above the 10-year average price of $0.30 – a reflection of higher quality which also benefits the company as it sells the lint product in international markets. For more information, see weblink below.
29
Section 3: The tools
Section
1Section
2Section
3Section
4
addressed by this tool not addressed by this tool, but may be addressed through developer services
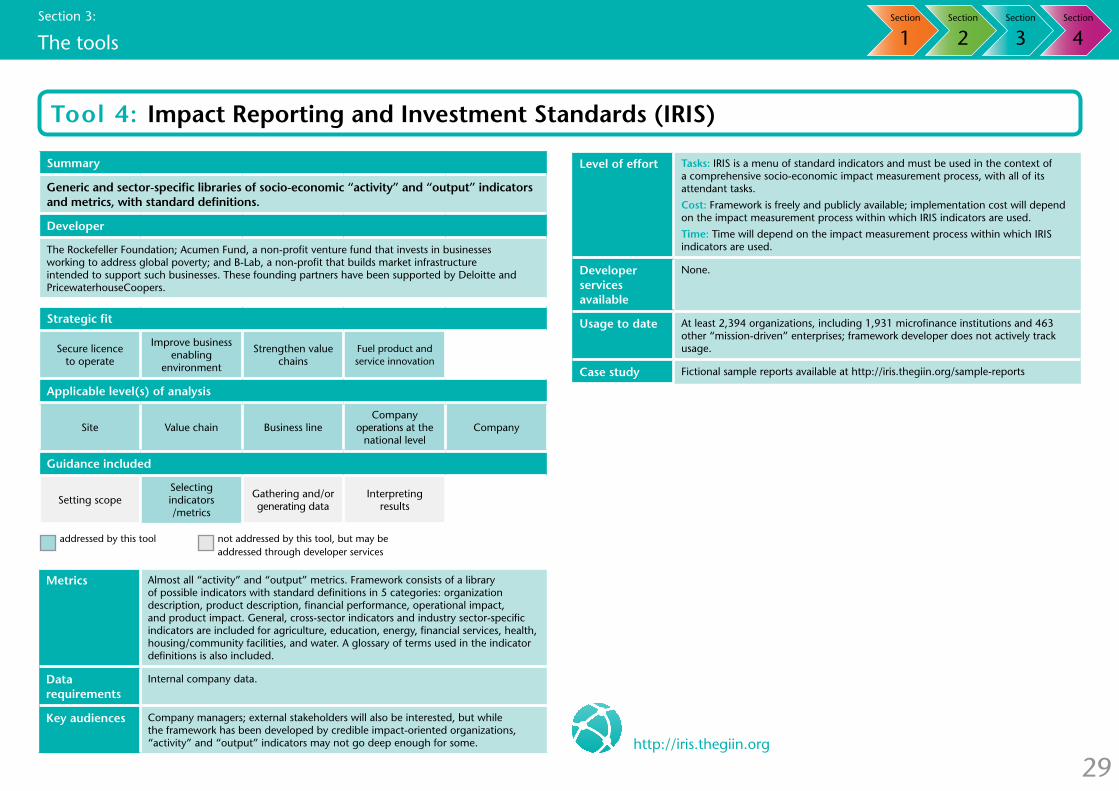
Metrics Almost all “activity” and “output” metrics. Framework consists of a library of possible indicators with standard definitions in 5 categories: organization description, product description, financial performance, operational impact, and product impact. General, cross-sector indicators and industry sector-specific indicators are included for agriculture, education, energy, financial services, health, housing/community facilities, and water. A glossary of terms used in the indicator definitions is also included.
Data requirements
Internal company data.
Key audiences Company managers; external stakeholders will also be interested, but while the framework has been developed by credible impact-oriented organizations, “activity” and “output” indicators may not go deep enough for some.
Tool 4: Impact Reporting and Investment Standards (IRIS)
Summary
Generic and sector-specific libraries of socio-economic “activity” and “output” indicators and metrics, with standard definitions.
Developer
The Rockefeller Foundation; Acumen Fund, a non-profit venture fund that invests in businesses working to address global poverty; and B-Lab, a non-profit that builds market infrastructure intended to support such businesses. These founding partners have been supported by Deloitte and PricewaterhouseCoopers.
Strategic fit
Secure licence to operate
Improve business enabling
environment
Strengthen value chains
Fuel product and service innovation
Applicable level(s) of analysis
Site Value chain Business lineCompany
operations at the national level
Company
Guidance included
Setting scopeSelecting indicators /metrics
Gathering and/or generating data
Interpreting results
http://iris.thegiin.org
Level of effort Tasks: IRIS is a menu of standard indicators and must be used in the context of a comprehensive socio-economic impact measurement process, with all of its attendant tasks.
Cost: Framework is freely and publicly available; implementation cost will depend on the impact measurement process within which IRIS indicators are used.
Time: Time will depend on the impact measurement process within which IRIS indicators are used.
Developer services available
None.
Usage to date At least 2,394 organizations, including 1,931 microfinance institutions and 463 other “mission-driven” enterprises; framework developer does not actively track usage.
Case study Fictional sample reports available at http://iris.thegiin.org/sample-reports

30
Section 3: The tools
Section
1Section
2Section
3Section
4
addressed by this tool not addressed by this tool, but may be addressed through developer services
Metrics Numbers of people positively affected by a company for each of 8 Millennium Development Goal (MDG) areas.
Data requirements
Internal company data. Calculations require a relatively small number of “output”-level metrics associated with a company’s operations, products and services, and community investments (as well as external country and industry sector data which are built into the model).
Key audiences While the resulting metrics are too highly aggregated to inform business action on their own, the underlying structure of the model can help company managers organize their thinking, prioritizing, and strategic planning. Externally, metrics could be of strong interest to development stakeholders, especially UN bodies, because
Tool 5: MDG Scan
they relate to the MDGs; however, the number of people positively affected may not be enough information for many development stakeholders, and the calculations may be difficult to explain. Negative effects, including side-effects and knock-on effects, are omitted. Furthermore, in an effort to be relatively quick and easy to use, the model makes important simplifications and assumptions. It is important to remember that the data generated are rough estimates. Preliminary sensitivity analysis of employment and economic effects, for example, found a margin of error of 25%.
Level of effort Tasks: Collect and input the required data.
Cost: Framework is freely and publicly available online; implementation cost likely to consist primarily of staff time needed to collect and input required data. Required data is country-level, so aggregation (e.g. from business unit level) may be necessary.
Time: Once the required data has been collected, estimates can be generated in 10 minutes.
Developer services available
While both developers offer a range of services, the MDG Scan is a self-service tool.
Usage to date At least 20 companies; results for 14 companies are available online.
Case study Based in the Netherlands, AkzoNobel is the largest global paints and coatings company and a leading producer of specialty chemicals including food fortification products. In 2008, the company decided to go beyond demonstrating compliance to try to understand its positive impacts on society using the online MDG Scan. Using data inputted by company staff, the tool estimated that AkzoNobel had benefited approximately 77,000 people in the area of MDG 1, eradication of extreme poverty and hunger. At the same time, the tool’s underlying framework, which asked the company to input data in three areas – impact from operations, impact from specific products, and impact from community projects – inspired and enabled the company to make a more comprehensive assessment of its socio-economic contributions in emerging markets for the first time. This more comprehensive assessment has allowed AkzoNobel to set priorities and targets and focus its efforts in high-potential areas like sales of nutritional products. AkzoNobel’s food fortification product Ferrazone, for example, had been consumed by 35 million people in 4 emerging markets, helping to fight iron deficiency and promoting cognitive development in an estimated 1.5 million children younger than 5. For more information, see http://www.mdgscan.com/#page=Textpage&item=recommendations
Summary
An online tool that uses company-provided “output” data and publicly-available country and industry sector data to estimate the numbers of people positively affected by a company for each of 8 Millennium Development Goal (MDG) areas. The MDGs are targets laid out by the United Nations for the international community to achieve by 2015.
Developer
The Dutch National Committee for International Cooperation and Sustainable Development (NCDO), an arm of the Dutch Department of Development Cooperation that works to inspire and help the Dutch private sector to develop sustainable development in developing countries, and Sustainalytics, an independent sustainability research provider for the financial industry.
Strategic fit (Model works best for companies with more than 30 local employees and local turnover over US$3 million)
Secure licence to operate
Improve business enabling
environment
Strengthen value chains
Fuel product and service innovation
Applicable level(s) of analysis
Site Value chain Business lineCompany
operations at the national level
Company
Guidance included
Setting scopeSelecting indicators /metrics
Gathering and/or generating data
Interpreting results
http://www.mdgscan.com

31
Section 3: The tools
Section
1Section
2Section
3Section
4
addressed by this tool not addressed by this tool, but may be addressed through developer services
Metrics Framework is agnostic as to specific metrics, emphasizing the process of developing results chains and selecting indicators and metrics accordingly. Includes a library of possible indicators and metrics, grouped by business activity, at the “input,” “activity,” “output,” “outcome,” and “impact” levels.
Data requirements
Dependent on specific metrics chosen.
Key audiences Company managers; other external audiences depending on specific metrics and implementation techniques chosen.
Tool 6: Measuring Impact Framework
Level of effort Tasks: Set objectives; select the appropriate level(s) of analysis; research and select the most relevant indicators and metrics; select suitable data-gathering techniques; develop appropriate data-gathering tools (if applicable); and interpret results (including assessing contribution to development goals, if desired). Stakeholder engagement throughout the process is advised.
Cost: Framework is freely and publicly available; implementation cost will vary widely depending on the scope and objectives set by the user, specific indicators and metrics chosen, level of stakeholder engagement conducted, and third-party support services needed.
Time: Will vary according to scope, specific metrics chosen, and level of stakeholder engagement conducted.
Developer services available
The Measuring Impact Framework is a self-service tool.
Usage to date At least a dozen companies, including 5 documented cases available online; developer does not actively track usage.
Case study Eskom is a vertically-integrated, state-owned electricity utility that generates, transmits, and distributes 95% of the power used in South Africa. According to its joint shareholder compact with the Department of Public Enterprises, Eskom is required to integrate its commercial, environmental, and socio-economic roles into its core strategy. To help, it applied the WBCSD Measuring Impact Framework to identify, measure, and analyze data on some 150 quantitative and qualitative indicators of impact associated with construction, operations, and end usage of electricity among customers. Eskom also engaged stakeholders to assess and interpret the results. A critical issue proved to be the gap between supply and demand of electricity – a gap that was estimated to cost the South African economy more than US$11.7 billion in the 2011 financial year. Eskom’s socio-economic impact measurement exercise revealed that consumers were not aware of energy-saving methods, which could be part of narrowing that gap. As a result, the company is changing its marketing and communications materials to educate South African communities on how they can reduce their energy use. For more information, see http://www.wbcsd.org/Pages/EDocument/EDocumentDetails.aspx?ID=14837&NoSearchContextKey=true
Summary
A framework and guidelines, including worksheets, for the identification, measurement, assessment, and prioritization of socio-economic impacts for management response, including sample indicators and metrics.
Developer
The World Business Council for Sustainable Development (WBCSD) is a CEO-led organization of forward-thinking companies that galvanizes the global business community to create a sustainable future for business, society and the environment. The Measuring Impact Framework Methodology was developed in the period 2006-2008 in collaboration with more than 20 WBCSD members, reviewed by 15 external experts, and co-branded with the International Finance Corporation.
Strategic fit (Framework is very flexible; strategic fit will depend on specific design and implementation choices made by the user)
Secure licence to operate
Improve business enabling
environment
Strengthen value chains
Fuel product and service innovation
Applicable level(s) of analysis
Site Value chain Business lineCompany
operations at the national level
Company
Guidance included
Setting scopeSelecting indicators /metrics
Gathering and/or generating data
Interpreting results
http://www.wbcsd.org/work-program/development/measuring-impact.aspx
32
Section 3: The tools
Section
1Section
2Section
3Section
4
addressed by this tool not addressed by this tool, but may be addressed through developer services
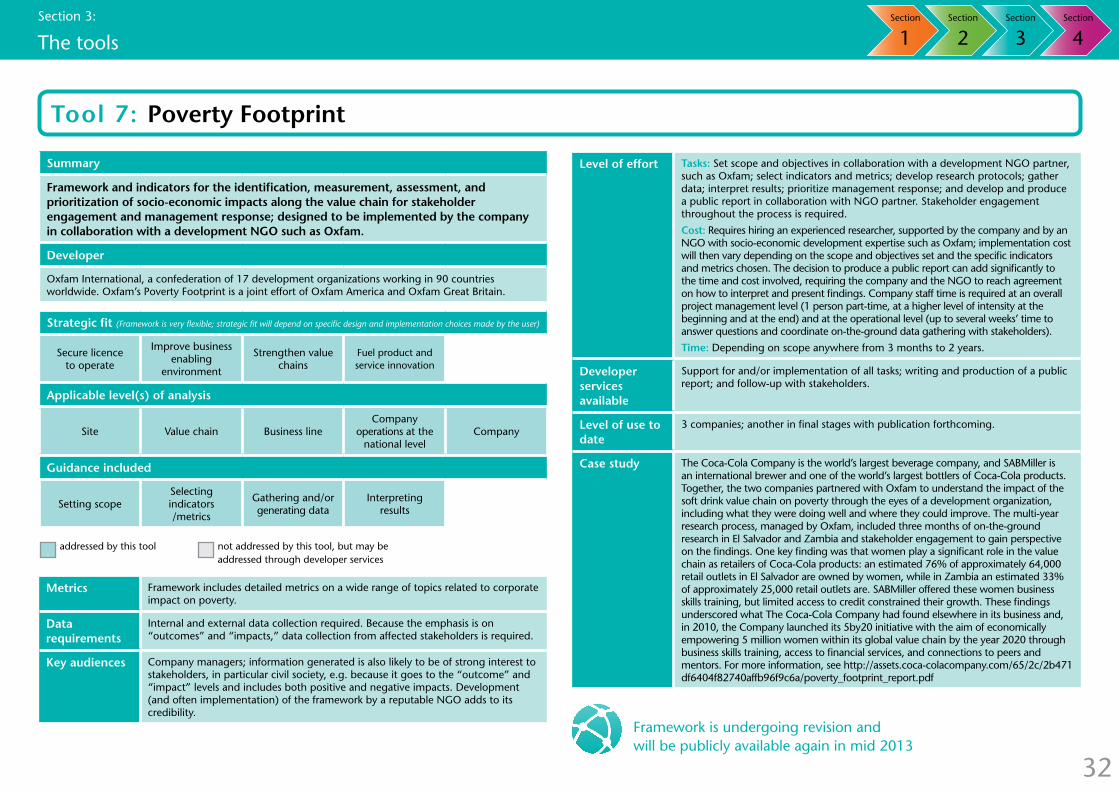
Tool 7: Poverty Footprint
Metrics Framework includes detailed metrics on a wide range of topics related to corporate impact on poverty.
Data requirements
Internal and external data collection required. Because the emphasis is on “outcomes” and “impacts,” data collection from affected stakeholders is required.
Key audiences Company managers; information generated is also likely to be of strong interest to stakeholders, in particular civil society, e.g. because it goes to the “outcome” and “impact” levels and includes both positive and negative impacts. Development (and often implementation) of the framework by a reputable NGO adds to its credibility.
Level of effort Tasks: Set scope and objectives in collaboration with a development NGO partner, such as Oxfam; select indicators and metrics; develop research protocols; gather data; interpret results; prioritize management response; and develop and produce a public report in collaboration with NGO partner. Stakeholder engagement throughout the process is required.
Cost: Requires hiring an experienced researcher, supported by the company and by an NGO with socio-economic development expertise such as Oxfam; implementation cost will then vary depending on the scope and objectives set and the specific indicators and metrics chosen. The decision to produce a public report can add significantly to the time and cost involved, requiring the company and the NGO to reach agreement on how to interpret and present findings. Company staff time is required at an overall project management level (1 person part-time, at a higher level of intensity at the beginning and at the end) and at the operational level (up to several weeks’ time to answer questions and coordinate on-the-ground data gathering with stakeholders).
Time: Depending on scope anywhere from 3 months to 2 years.
Developer services available
Support for and/or implementation of all tasks; writing and production of a public report; and follow-up with stakeholders.
Level of use to date
3 companies; another in final stages with publication forthcoming.
Case study The Coca-Cola Company is the world’s largest beverage company, and SABMiller is an international brewer and one of the world’s largest bottlers of Coca-Cola products. Together, the two companies partnered with Oxfam to understand the impact of the soft drink value chain on poverty through the eyes of a development organization, including what they were doing well and where they could improve. The multi-year research process, managed by Oxfam, included three months of on-the-ground research in El Salvador and Zambia and stakeholder engagement to gain perspective on the findings. One key finding was that women play a significant role in the value chain as retailers of Coca-Cola products: an estimated 76% of approximately 64,000 retail outlets in El Salvador are owned by women, while in Zambia an estimated 33% of approximately 25,000 retail outlets are. SABMiller offered these women business skills training, but limited access to credit constrained their growth. These findings underscored what The Coca-Cola Company had found elsewhere in its business and, in 2010, the Company launched its 5by20 initiative with the aim of economically empowering 5 million women within its global value chain by the year 2020 through business skills training, access to financial services, and connections to peers and mentors. For more information, see http://assets.coca-colacompany.com/65/2c/2b471df6404f82740affb96f9c6a/poverty_footprint_report.pdf
Summary
Framework and indicators for the identification, measurement, assessment, and prioritization of socio-economic impacts along the value chain for stakeholder engagement and management response; designed to be implemented by the company in collaboration with a development NGO such as Oxfam.
Developer
Oxfam International, a confederation of 17 development organizations working in 90 countries worldwide. Oxfam’s Poverty Footprint is a joint effort of Oxfam America and Oxfam Great Britain.
Strategic fit (Framework is very flexible; strategic fit will depend on specific design and implementation choices made by the user)
Secure licence to operate
Improve business enabling
environment
Strengthen value chains
Fuel product and service innovation
Applicable level(s) of analysis
Site Value chain Business lineCompany
operations at the national level
Company
Guidance included
Setting scopeSelecting indicators /metrics
Gathering and/or generating data
Interpreting results
Framework is undergoing revision and will be publicly available again in mid 2013

33
Section 3: The tools
Section
1Section
2Section
3Section
4
addressed by this tool not addressed by this tool, but may be addressed through developer services
Metrics Percentage of surveyed population(s) that fall below the national poverty line and the $1/day and $2/day international poverty benchmarks can be used periodically to track change in the poverty rate, as “impact” indicators.
Data requirements
External data collection required. Framework includes country-specific, 10-question household surveys for 45 developing and emerging countries. Surveys must be implemented through household visits. Questions are simple and answers can be verified through observation. Questions have been selected for statistical correlation to poverty.
Tool 8: Progress out of Poverty Index (PPI)
Key audiences Company managers for whom income data or segmentation is useful, e.g. for supply chain management, development of distribution channels, product or service development, and/or consumer marketing. Externally, income data is of intense interest to stakeholders including NGOs, bilateral and multilateral development agencies, international financial institutions, “impact investors,” and governments.
Level of effort Tasks: Identify target population; select sample size and identify households; conduct household interviews; consolidate survey data; use PPI methodology to calculate poverty rates.
Cost: Framework is freely and publicly available. Implementation cost will depend on survey sample size and geographic distribution, and whether company staff are in a position to implement the survey as part of their day-to-day operations (e.g. loan officer visits to borrowers’ homes) or whether a third party must be hired.
Time: Will vary according to survey sample size and geographic distribution, as well as survey staffing and execution strategy.
Developer services available
Third-party certification of the PPI measurement process according to Grameen Foundation standards.
Usage to date More than 70 users as of 2010.
Case study CARD Bank Inc. is a licensed, deposit-taking financial institution serving more than 580,000 mostly low-income clients in the Philippines. In 2009, CARD set out to diversify from a focus on credit to a full suite of financial services. More comprehensive and accurate information on its clients would be critical to the transformation. As a result, CARD updated its management information systems to include a special form for the collection of PPI data each time a new client joins the bank, initiates a new loan cycle, opens a savings account, or exits the institution. This has expanded the data available for business analytics and enabled the bank to segment its clients more effectively, paving the way for more targeted product development and marketing. For example, analysis of poverty and savings data showed that a client’s poverty status did not influence their ability to save as much as their access to a suitable savings product. CARD is using this information to design additional products and increase the accessibility of existing savings and loan products – for example, through lower minimum balances and deposit pickups at the client’s home or business. CARD is also using this information to capture opportunities for cross-selling products to clients it might not previously have considered likely target markets. For more information, see http://www.progressoutofpoverty.org/sites/default/files/CARD%20PPI%20Mini%20Case%20Study.pdf
Summary
A methodology, including detailed guidelines, survey instruments, and worksheets, for calculating the percentage of a surveyed population (such as customers) that falls below the national poverty line and the $1/day and $2/day international poverty benchmarks.
Developer
The Grameen Foundation, a non-profit organization established to support microfinance practitioners and to spread the Grameen Bank philosophy worldwide, along with the Consultative Group to Assist the Poor, an independent policy and research center dedicated to advancing financial access for the world’s poor, and the Ford Foundation, a philanthropy (separate from the Ford Motor Company) that promotes social change through grants and loans that build knowledge and strengthen organizations and networks.
Strategic fit
Secure licence to operate
Improve business enabling
environment
Strengthen value chains
Fuel product and service innovation
Applicable level(s) of analysis
Site Value chain Business lineCompany
operations at the national level
Company
Guidance included
Setting scopeSelecting indicators /metrics
Gathering and/or generating data
Interpreting results
http://progressoutofpoverty.org
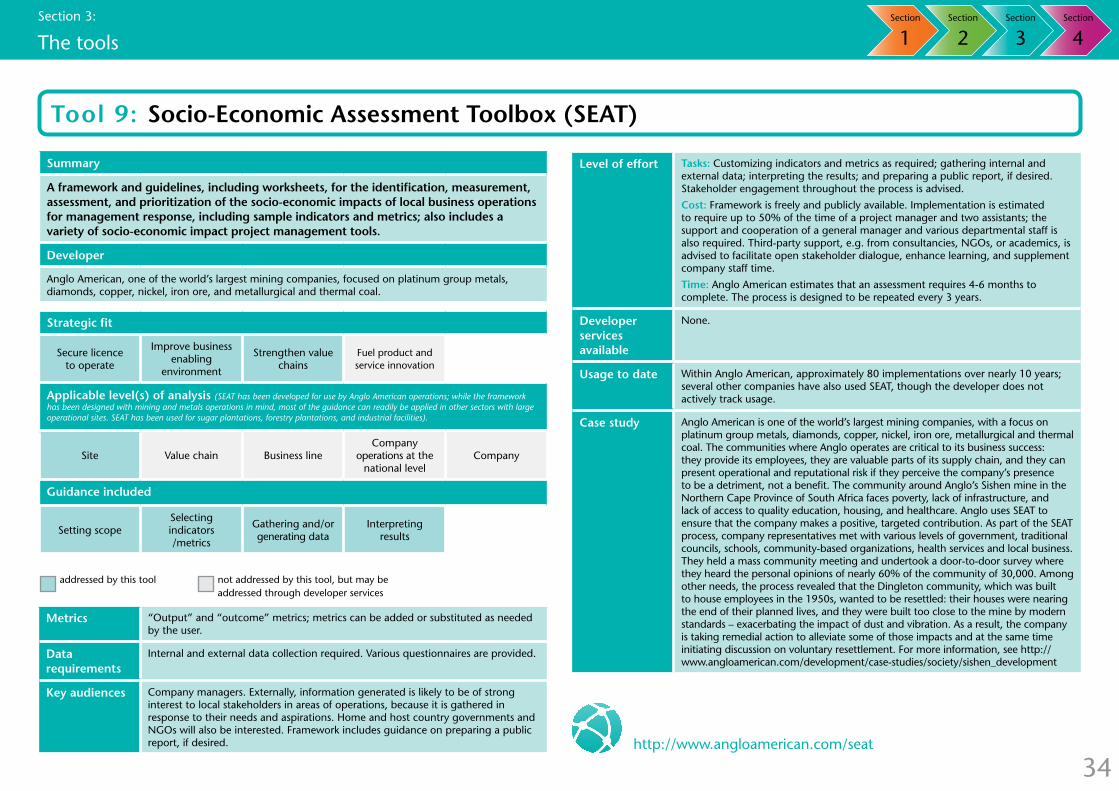
34
Section 3: The tools
Section
1Section
2Section
3Section
4
addressed by this tool not addressed by this tool, but may be addressed through developer services
Tool 9: Socio-Economic Assessment Toolbox (SEAT)
Metrics “Output” and “outcome” metrics; metrics can be added or substituted as needed by the user.
Data requirements
Internal and external data collection required. Various questionnaires are provided.
Key audiences Company managers. Externally, information generated is likely to be of strong interest to local stakeholders in areas of operations, because it is gathered in response to their needs and aspirations. Home and host country governments and NGOs will also be interested. Framework includes guidance on preparing a public report, if desired.
Level of effort Tasks: Customizing indicators and metrics as required; gathering internal and external data; interpreting the results; and preparing a public report, if desired. Stakeholder engagement throughout the process is advised.
Cost: Framework is freely and publicly available. Implementation is estimated to require up to 50% of the time of a project manager and two assistants; the support and cooperation of a general manager and various departmental staff is also required. Third-party support, e.g. from consultancies, NGOs, or academics, is advised to facilitate open stakeholder dialogue, enhance learning, and supplement company staff time.
Time: Anglo American estimates that an assessment requires 4-6 months to complete. The process is designed to be repeated every 3 years.
Developer services available
None.
Usage to date Within Anglo American, approximately 80 implementations over nearly 10 years; several other companies have also used SEAT, though the developer does not actively track usage.
Case study Anglo American is one of the world’s largest mining companies, with a focus on platinum group metals, diamonds, copper, nickel, iron ore, metallurgical and thermal coal. The communities where Anglo operates are critical to its business success: they provide its employees, they are valuable parts of its supply chain, and they can present operational and reputational risk if they perceive the company’s presence to be a detriment, not a benefit. The community around Anglo’s Sishen mine in the Northern Cape Province of South Africa faces poverty, lack of infrastructure, and lack of access to quality education, housing, and healthcare. Anglo uses SEAT to ensure that the company makes a positive, targeted contribution. As part of the SEAT process, company representatives met with various levels of government, traditional councils, schools, community-based organizations, health services and local business. They held a mass community meeting and undertook a door-to-door survey where they heard the personal opinions of nearly 60% of the community of 30,000. Among other needs, the process revealed that the Dingleton community, which was built to house employees in the 1950s, wanted to be resettled: their houses were nearing the end of their planned lives, and they were built too close to the mine by modern standards – exacerbating the impact of dust and vibration. As a result, the company is taking remedial action to alleviate some of those impacts and at the same time initiating discussion on voluntary resettlement. For more information, see http://www.angloamerican.com/development/case-studies/society/sishen_development
Summary
A framework and guidelines, including worksheets, for the identification, measurement, assessment, and prioritization of the socio-economic impacts of local business operations for management response, including sample indicators and metrics; also includes a variety of socio-economic impact project management tools.
Developer
Anglo American, one of the world’s largest mining companies, focused on platinum group metals, diamonds, copper, nickel, iron ore, and metallurgical and thermal coal.
Strategic fit
Secure licence to operate
Improve business enabling
environment
Strengthen value chains
Fuel product and service innovation
Applicable level(s) of analysis (SEAT has been developed for use by Anglo American operations; while the framework has been designed with mining and metals operations in mind, most of the guidance can readily be applied in other sectors with large operational sites. SEAT has been used for sugar plantations, forestry plantations, and industrial facilities).
Site Value chain Business lineCompany
operations at the national level
Company
Guidance included
Setting scopeSelecting indicators /metrics
Gathering and/or generating data
Interpreting results
http://www.angloamerican.com/seat
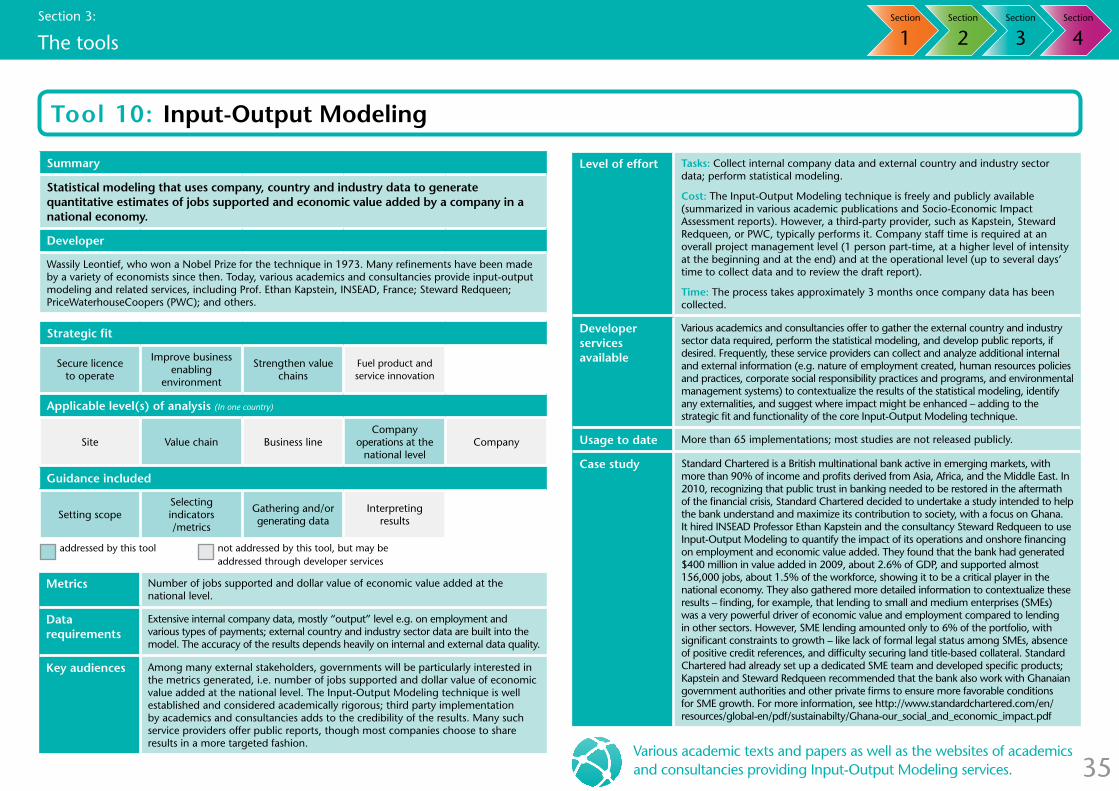
35
Section 3: The tools
Section
1Section
2Section
3Section
4
addressed by this tool not addressed by this tool, but may be addressed through developer services
Metrics Number of jobs supported and dollar value of economic value added at the national level.
Data requirements
Extensive internal company data, mostly “output” level e.g. on employment and various types of payments; external country and industry sector data are built into the model. The accuracy of the results depends heavily on internal and external data quality.
Key audiences Among many external stakeholders, governments will be particularly interested in the metrics generated, i.e. number of jobs supported and dollar value of economic value added at the national level. The Input-Output Modeling technique is well established and considered academically rigorous; third party implementation by academics and consultancies adds to the credibility of the results. Many such service providers offer public reports, though most companies choose to share results in a more targeted fashion.
Tool 10: Input-Output Modeling
Level of effort Tasks: Collect internal company data and external country and industry sector data; perform statistical modeling.
Cost: The Input-Output Modeling technique is freely and publicly available (summarized in various academic publications and Socio-Economic Impact Assessment reports). However, a third-party provider, such as Kapstein, Steward Redqueen, or PWC, typically performs it. Company staff time is required at an overall project management level (1 person part-time, at a higher level of intensity at the beginning and at the end) and at the operational level (up to several days’ time to collect data and to review the draft report).
Time: The process takes approximately 3 months once company data has been collected.
Developer services available
Various academics and consultancies offer to gather the external country and industry sector data required, perform the statistical modeling, and develop public reports, if desired. Frequently, these service providers can collect and analyze additional internal and external information (e.g. nature of employment created, human resources policies and practices, corporate social responsibility practices and programs, and environmental management systems) to contextualize the results of the statistical modeling, identify any externalities, and suggest where impact might be enhanced – adding to the strategic fit and functionality of the core Input-Output Modeling technique.
Usage to date More than 65 implementations; most studies are not released publicly.
Case study Standard Chartered is a British multinational bank active in emerging markets, with more than 90% of income and profits derived from Asia, Africa, and the Middle East. In 2010, recognizing that public trust in banking needed to be restored in the aftermath of the financial crisis, Standard Chartered decided to undertake a study intended to help the bank understand and maximize its contribution to society, with a focus on Ghana. It hired INSEAD Professor Ethan Kapstein and the consultancy Steward Redqueen to use Input-Output Modeling to quantify the impact of its operations and onshore financing on employment and economic value added. They found that the bank had generated $400 million in value added in 2009, about 2.6% of GDP, and supported almost 156,000 jobs, about 1.5% of the workforce, showing it to be a critical player in the national economy. They also gathered more detailed information to contextualize these results – finding, for example, that lending to small and medium enterprises (SMEs) was a very powerful driver of economic value and employment compared to lending in other sectors. However, SME lending amounted only to 6% of the portfolio, with significant constraints to growth – like lack of formal legal status among SMEs, absence of positive credit references, and difficulty securing land title-based collateral. Standard Chartered had already set up a dedicated SME team and developed specific products; Kapstein and Steward Redqueen recommended that the bank also work with Ghanaian government authorities and other private firms to ensure more favorable conditions for SME growth. For more information, see http://www.standardchartered.com/en/resources/global-en/pdf/sustainabilty/Ghana-our_social_and_economic_impact.pdf
Summary
Statistical modeling that uses company, country and industry data to generate quantitative estimates of jobs supported and economic value added by a company in a national economy.
Developer
Wassily Leontief, who won a Nobel Prize for the technique in 1973. Many refinements have been made by a variety of economists since then. Today, various academics and consultancies provide input-output modeling and related services, including Prof. Ethan Kapstein, INSEAD, France; Steward Redqueen; PriceWaterhouseCoopers (PWC); and others.
Strategic fit
Secure licence to operate
Improve business enabling
environment
Strengthen value chains
Fuel product and service innovation
Applicable level(s) of analysis (In one country)
Site Value chain Business lineCompany
operations at the national level
Company
Guidance included
Setting scopeSelecting indicators /metrics
Gathering and/or generating data
Interpreting results
Various academic texts and papers as well as the websites of academics and consultancies providing Input-Output Modeling services.

36
Section 4: The road ahead
Section 1 Section 2 Section 3 Section 4
The business case
The essentials
The tools
The road ahead
37
Section 4: The road ahead
Section
1Section
2Section
3Section
4
This guide has been developed to help companies perform three essential
tasks. Firstly, to define and articulate the business case for socio-economic
impact measurement within their organization. Secondly, it helps business
actors understand the essentials of impact measurement theory and
communicate with internal and external stakeholders on the subject. Finally,
it helps companies to navigate the landscape of measurement tools, and
identify those that best meet their needs.
The guide analyzes tools that have been developed for business and that,
in the WBCSD’s experience, companies are increasingly interested in. This
analysis is both an art and a science in that:
Few of the tools profiled here are ready to use “off-the-shelf”; with one
or two exceptions, they must be customized for each user, depending
on the nature of the company, its strategy, and its goals for measuring
socio-economic impact. Combining tools or elements of tools may also
be useful.
Many of these tools have been designed to be flexible; therefore,
their strategic fit will depend greatly on user choices in the set-up and
implementation of the measurement exercise.
The landscape of tools is still evolving. Tools are being updated as user
experience builds, and new ones are emerging with some regularity.
As the landscape evolves and as interest and experience mount, at the
WBCSD we see two major opportunities to advance the practice of socio-
economic impact measurement moving forward:
Integrating socio-economic impact measurement into business performance management and reporting
Measuring socio-economic impact can help companies with a host of
strategic imperatives, including obtaining or maintaining license to operate,
engaging policymakers to improve the business enabling environment,
strengthening their value chains, and fueling product and service innovation
to capture new markets and grow revenues. But for measuring to reach
its full potential as an enabler of value creation – for the business and
its stakeholders – it must be fully aligned with corporate strategy and
integrated into ongoing business performance management and reporting.4
To achieve this, we need to redesign the scope of corporate strategy and
processes across measurement, management, and reporting. Integrating
measurement can highlight the strategic drivers of a company’s socio-
economic impact, and the activities and pathways through which that impact
is created. Ideally, we should work towards one standard for business which
takes financial, socio-economic and environmental performance into account.
Today, stakeholder pressure and enthusiasm are common motivations for
companies to measure their socio-economic impacts – but is almost as
common for the same stakeholders to criticize companies’ measurement
efforts for failing to drive action. To the extent that socio-economic impact
measurement is considered a separate, stand-alone, communications
exercise, it will not take off, and it will not generate the value companies
and their stakeholders hope to see.
Using socio-economic impact measurement to drive more effective collaboration between business, government, and civil society
Today’s global challenges affect us all, and they are too complex and
systemic for any one organization or even sector – business, government, or
civil society – to solve alone. Collaboration is essential.
For collaboration to happen, government and civil society stakeholders need
evidence that business has what it takes to be part of the solution. These
stakeholders are increasingly aware of the logic – that by creating jobs,
training workers, building physical infrastructure, procuring raw materials,
transferring technology, paying taxes, and expanding access to products
and services ranging from food and healthcare to energy and information
4 - The WBCSD is launching a work program on integrated reporting that demonstrates clearly and concisely the organization’s ability to create and sustain value in the short, medium, and long term by linking its strategy, governance, and financial performance to the social and environmental context within which it operates. For more information on integrated reporting, see the International Integrated Reporting Council (IIRC) website, http://www.theiirc.org/.
38
Section 4: The road ahead
Section
1Section
2Section
3Section
4
technology, companies can improve people’s assets, capabilities,
opportunities, and standards of living sustainably and at scale. They have
seen the case studies. Many have already partnered with companies and
provided support for company-led initiatives. But with donors and citizens
demanding accountability in a resource-constrained world, they want to see
the data. Socio-economic impact measurement can help to provide it.
Socio-economic impact measurement can also help business, government,
and civil society design more effective collaborations by providing insight
into the value it is possible to create and the roles the different partners
can play in creating it. A better understanding of industry perspectives, in
particular, can highlight strategic drivers of the socio-economic impacts
of companies in a particular sector, geography or environment, and the
pathways through which that impact is created. This helps prospective
partners understand what companies’ highest-potential impacts are, where
they come from, how they unfold, and what can be done in partnership
and at scale to mitigate or leverage them.
Socio-economic impact and business success are closely intertwined. The
practice of measuring socio-economic impact is in its early stages – but if
it can be integrated into business performance management and used to
drive more effective collaboration among business, government, and civil
society, it holds great promise as an enabler of our collective efforts to meet
people’s needs and accelerate the transition toward the WBCSD’s vision of a
sustainable world in which the 9 billion people expected to share the earth
by the year 2050 can live well, and within the limits of our one planet.
For any comments, questions and suggestions on the content of
this guide, or to share experience in applying one or more of the
frameworks portrayed, please contact [email protected]
Visit the WBCSD website at www.wbcsd.org/impact.aspx for regular updates and case studies on
companies’ work toward measuring their socio-economic impact
39
About the guide
About the World Business Council for Sustainable Development (WBCSD)
The World Business Council for Sustainable Development is a CEO-led organization of forward-thinking companies that galvanizes the global business community to create a sustainable future for business, society and the environment. Together with its members, the council applies its respected thought leadership and effective advocacy to generate constructive solutions and take shared action. Leveraging its strong relationships with stakeholders as the leading advocate for business, the council helps drive debate and policy change in favor of sustainable development solutions.
The WBCSD provides a forum for its 200 member companies – who represent all business sectors, all continents and a combined revenue of more than US$7 trillion – to share best practices on sustainable development issues and to develop innovative tools that change the status quo. The Council also benefits from a network of 60 national and regional business councils and partner organizations, a majority of which are based in developing countries.
www.wbcsd.org
Disclaimer
This publication is released in the name of the WBCSD.
Like other WBCSD publications, it is the result of a
collaborative effort by members of the secretariat and
senior executives from member companies. A wide range
of members reviewed drafts, thereby ensuring that the
document broadly represents the perspective of the
WBCSD membership. It does not mean, however, that
every member company agrees with every word.
Copyright © WBCSD, February 2013
ISBN: 978-2-940521-01-2
Acknowledgements
The WBCSD would like to thank the following people for their contributions to the preparation of this document:
Company representatives
Lisa Neuberger Accenture
Matthew Mooney Accenture
Elizabeth Stokes AkzoNobel
Jon Samuel Anglo American
Angela Fratila DuPont
Louise Koch Grundfos LIFELINK
Holly Dublin PPR Group
José Retana PricewaterhouseCoopers
Anna Swaithes SABMiller
David Grant SABMiller
Andy Wales SABMiller
Marco Stampa Saipem
Rafaella Bersani Saipem
WBCSD Regional Network partners
Sebastián Bigorito BCSD Argentina
Ana Muro BCSD Argentina
Virginia Vilariño BCSD Argentina
Silvia Lara AED Costa Rica
Olga Sauma AED Costa Rica
Other contributors
Brad Presner Acumen Fund
Hélène Mancheron BOP Innovation Center
Nelleke van der Vleuten BOP Innovation Center
Zahid Torres-Rahman Business Fights Poverty
Richard Gilbert Business Action for Africa
Caroline Ashley Business Innovation Facility
Jessica Davis BSR
Erik Simanis Cornell University
Christina Gradl endeva
Aline Krämer endeva
Sonja Patscheke FSG
Amy Goldman Global Environmental Management Initiative
Theresa Fay-Bustillos Ideal Philanthropy & Sustainability
Helen Mant Initiative for Global Development
Chris Jochnick Oxfam America
Cécile Churet SAM Sustainable Asset Management
Reintje van Haeringen SNV
René Kim Steward Redqueen
Wouter Scheepens Steward Redqueen
Ted London University of Michigan
Heather Esper University of Michigan
The WBCSD would also like to acknowledge the important contributions of Dalberg Global Development Advisors (Serena Guarnaschelli, Mara De Monte, Tamara Pironnet) in the initial survey of measurement tools and to Beth Jenkins in the development of this document.
The WBCSD secretariat’s Social Capital team (Marcel Engel, Filippo Veglio, Kitrhona Cerri) managed the writing and publication of this document.
www.wbcsd.org/impact.aspx
World Business Council for Sustainable Development www.wbcsd.org
4, chemin de Conches, CH-1231 Conches-Geneva, Switzerland, Tel: +41 (0)22 839 31 00, E-mail: [email protected]
1500 K Street NW, Suite 850, Washington, DC 20005, US, Tel: +1 202 383 9505, E-mail: [email protected]