a history of performanceregistrars (ordinary shares) capita registrars the registry 34 beckenham...
TRANSCRIPT

A History ofPErforMANCE
REPORT & FINANCIAL STATEMENTS 2011
SThre
e p
lc
REP
OR
T & FIN
AN
CIA
L STATEM
ENTS 2
011

sthree plcCompany Information and Corporate Advisers
Executive Directors
Russell Clements, Chief Executive OfficerGary Elden, Chief Strategy OfficerAlex Smith, Chief Financial Officer
Non-Executive Directors
Clay Brendish, Non Executive ChairmanPaul Bowtell, Non ExecutiveAlicja Lesniak, Non ExecutiveTony Ward, Non Executive (SID)Nadhim Zahawi, Non Executive
Group Company Secretary & Registered Office
Steve Hornbuckle, Group Company Secretary5th Floor, GPS House215-227 Great Portland StreetLondon W1W 5PN [email protected]
Company number
3805979
Contact details
Tel: 0207 268 6000Fax: 0207 268 6001Email: [email protected]: www.sthree.com
Auditors
PricewaterhouseCoopers LLP1 Embankment PlaceLondonWC2N 6RH
Registrars (ordinary shares)
Capita RegistrarsThe Registry34 Beckenham RoadBeckenhamKentBR3 4TUTel: (UK) 0871 664 0300*Tel: (Non UK) +44 208 639 3399Email: [email protected]: www.capitaregistrars.com* Calls cost 10p per minute plus network extras, lines areopen 8.30am-5.30pm Mon-Fri
Financial Advisers & Stockbrokers
UBS Investment Bank1 Finsbury AvenueLondonEC2M 2PP
Investec Investment Banking2 Gresham StreetLondon EC2V 7QP
Financial PR
Citigate Dewe Rogerson3 London Wall BuildingsLondon WallLondon EC2M 5SY

01SThree plc Report & financial statements 2011
Inside Front Cover Company Information and Corporate Advisers
02 Overview, Business Model & Strategy
08 Chairman’s Trading & Governance Overview
10 Financial Highlights
12 Chief Executive Officer’s Review
16 Chief Financial Officer’s Review
18 Chief Strategy Officer’s Review
20 Board of Directors and Secretary
22 Directors’ Report
28 Directors’ Remuneration Report
37 Corporate Governance Report
49 Corporate Responsibility Report
54 Independent Auditors’ Report
56 Consolidated Income Statement
57 Consolidated Statement of Comprehensive Income
58 Statements of Financial Position (Consolidated and Company)
59 Consolidated Statement of Changes in Equity
60 Company Statement of Changes in Equity
61 Statement of Cash Flows (Consolidated and Company)
62 Notes to the Financial Statements
96 Five Year Financial Summary
Inside Back Cover Shareholder Information
CoNtENts

SThree plc02 Report & financial statements 2011
ovErviEw, BusiNEss ModEl & strAtEgyfor the year ended 27 November 2011
OverviewSThree is a specialist permanent and contract staffing business, currently comprised of four main operating brands, Computer Futures, Huxley Associates, Progressive and Real Staffing Group, all of which operate under a well established multi-brand strategy. The first office, as Computer Futures, opened in London in 1986, whilst international expansion started in 1998 with the launch of an office in Brussels. Each brand shares common services such as finance, information services, human resources and legal. The Group has grown organically and has a diverse client base of over 7,000 clients. Currently 60 offices are located globally, with ambitious expansion plans and our priority is to grow the business in line with the strategy below.
From our well-established position in the ICT sector, the Group has broadened its operations by building fast-growing businesses serving the Engineering & Energy, Banking, Pharmaceuticals & Biotechnology, Accountancy and job board sectors. The Group began trading on the London Stock Exchange in November 2005 and in 2007 launched a US Level One ADR facility. From its inception, the Group has avoided the high volume, low margin business model in favour of a focus on high quality business. The Group’s main subsidiary undertakings
are disclosed in the notes to the financial statements.
This section, the Chairman’s and other officers’ sections of this Annual Report provide information relating to the Group’s activities, its business and strategy and the principal risks and uncertainties faced by the business, including analysis using financial and other KPIs where necessary. These, together with the Directors’ Remuneration Report, Corporate Governance and Corporate Responsibility Reports, provide an overview of the Group, including environmental and employee matters and give an indication of future developments in the Group’s business. This provides a balanced assessment of the Group’s position and prospects, in accordance with the Business Review requirements of the Companies Act 2006.
Business model & strategySThree specialises in placing permanent and contract staff in niche segments of the staffing market, with the ultimate aim of being the most respected and highly valued international, specialist staffing services business.
For permanent placements, the Group charges a commission, which is typically expressed as a percentage of a candidate’s starting salary, the quantum of which depends upon the particular role specialism, underlying market, geography
Russell ClementsChief Executive Officer
CalgaryTorontoVancouver
San DiegoAustin
Rio de JaneiroBuenos Aires
Mexico City
LyonOslo
BerlinCologneEindhoven
LilleGenevaNuremberg
StavangerVienna
Johannesburg
BrisbaneMelbourne
Shanghai
Tokyo
INDICATIVE OFFICE ROLLOUT2012 & 2013
Kuala Lumpur
Abu Dhabi

03SThree plc Report & financial statements 2011
OvERvIEw, BuSINESS MOdEL & STRATEgy
and candidate skills. For contract placements, a daily, weekly or monthly rate may be charged, which includes a mark up on top of the candidate’s own rate, the quantum of which depends upon the particular role specialism, underlying market, geography and candidate skills.This simple but successful basic recruitment business model is built around the following core principles:
Pure play specialist staffing – SThree has a twenty five year track record of success as a pure play specialist staffing company and we feel no need to fundamentally change this approach. We do not position ourselves as a Recruitment Process Outsourcer (RPO) but as a specialist solution provider with our consultants offering expertise in high value niches. This means that we do not need to trade value for volume to grow our business even in our mature markets.
Focus on highly skilled, niche candidates – A key criteria for deciding the attractiveness of a market is the extent to which the candidate’s skills
are in short supply. This ‘niche within a niche’ approach means we are typically representing a candidate for whom there is competition amongst employers. This mitigates against margin pressure, ensures that we benefit from wage/rate inflation and operate in markets where a high rate of employee churn is the norm.
Growth through our multi-brand model – The specialist staffing market is highly fragmented with the typical player a small niche operator. This reflects the profile of the candidates whose skillsets are developed around specialist expertise and who have a strong preference for dealing with equally specialist recruiters. By engaging with the candidate in this way the recruiter is able to offer the client higher quality candidates. For this reason SThree operates as a ‘House of Brands’ rather than a ‘Branded House’ with four major specialist Brands.
Organic growth our default assumption – We have never acquired another business to date and none of the ambitious plans we have for the future is predicated upon us doing so in the future. We are not philosophically opposed to the idea of acquisitions in principle. However in the event we did buy a business it would be a small bolt-on acquisition which expedited our growth into a specific geography and/or segment.
Growth through international & sectoral expansion – Having started in the UK we now generate around two thirds of our business from our international operations. We have established a total of sixty offices in seventeen countries and are adding approximately six new international offices each year. In parallel having initially focused exclusively on the ICT sector, we now derive around forty percent of our Gross Profit from the Engineering & Energy, Banking, Pharmaceuticals & Biotechnology, Accountancy and job board sectors.
Growth through home grown management – We prefer wherever possible to grow the business using management that we have developed

SThree plc04 Report & financial statements 2011
OvERvIEw, BuSINESS MOdEL & STRATEgy
ourselves – typically from early on in the individual’s career and often direct from University. We then provide industry-leading training and career development. Well over 90% of our management have come through this route. We only hire external management on rare occasions where to do so would strengthen our bandwidth in a particular geography and/or sector.
Senior management engagement through equity participation – Given the low barriers to entry a key strategic challenge to scaling staffing businesses is retention of senior staff. Uniquely in our sector we operate a ‘tracker share’ or ‘Minority Interest’ model which allows selected management to buy a stake in the business for which they are responsible, at an early stage. This means they are owner managers who do not need to leave SThree for an external wealth creation opportunity.
Growth in line with our values – SThree has a strong cultural identity which has been a critical element in our
historical success and a major reason why we have retained key staff. The SThree values are ‘Energy’, ‘Reward’, ‘Rapport’ and ‘Respect’. These values are common across the SThree brands and although the brands have distinctive propositions, our values help ensure that we have a coherent set of shared beliefs across the organisation and an identity as SThree.
Key Performance Indicators (‘KPIs’)Both financial and non-financial Key Performance Indicators (KPIs) are used throughout the Group to drive the business forward and monitor progress, with the principal indicators listed in the table below, including how these apply in a strategic, remuneration or risk context. Further analysis is provided within the Chairman’s and other officers’ sections of this Annual Report, where this is appropriate.
For financial KPIs, comparison figures are shown for both the current and prior year, whilst for non-financial KPIs, other generally applicable metrics are indicated.
KPIs (financial) 2011 2010Definition and method of calculation
Strategic/Remuneration/Risk context
Revenue £542.5m £474.5m Total fees earned by the Group, before any cost deductions.
These are very broad indicators of how the business is trading.
Gross Profit (‘GP’) £195.5m £166.4m Revenue less cost of sales. Also known as Net Fee Income.
Profit Before Tax (‘PBT’) and exceptionals
£30.3m £21.6m Gross profit, less administration expenses and finance income/costs before exceptional items.
Same as above, although this measure also shows how efficient the Group is in terms of managing its cost base, a key strategic measure and component of the Group’s bonus arrangements.
Total Shareholder Return (‘TSR’)
(14%) 16% TSR is defined as share price growth plus dividends attributable to shareholders over a specific period.
Generally used by investors but also for the Group’s LTIP (over a three year period).
Earnings Per Share (‘EPS’) adjusted
16.8p 11.9p Adjusted EPS is defined as profit before exceptional items for the year attributable to the Group’s equity shareholders divided by the weighted average number of shares in issue during the year.
Generally used by investors but also for the Group’s LTIP (over a three year period).

05SThree plc Report & financial statements 2011
OvERvIEw, BuSINESS MOdEL & STRATEgy
KPIs (financial) 2011 2010Definition and method of calculation
Strategic/Remuneration/Risk context
Group Gross Margin 36.0% 35.1% Gross profit as a percentage of revenue.
Increasing margins, day rates and fees, are all indicators of business quality and therefore important to maintain/ improve as a niche specialist. As such, they are key strategic measures and components of the Group’s bonus arrangements.
Contract Margin 21.4% 21.6% Contract gross profit as a percentage of contract revenue.
Gross Profit per Day Rate
£86.70 £84.24 Contract gross profit per average number of working days.
Permanent fees average
£13.0k £12.1k Average fees of permanent placements that started during the period.
Geographical diversification –international (non UK & Ireland) mix
63% 59% Split of gross profit by location of client, whether by country or other regional classification.
These indicate how well the Group is diversifying geographically, or by sector and are important as the Group seeks to reduce its risk exposure to slower growth, more mature markets. As such, they are key strategic measures and components of the Group’s bonus arrangements.
Sectoral diversification – non ICT
40% 38% Split of gross profit by candidate skill set, categorised by sector.
Contract/Perm mix 48%/52% 51%/49% Proportion of gross profit attributable to contract and permanent placements.
Having a mix of both contract and perm business helps to protect the Group from cyclical extremes, typical of the recruitment sector.
Conversion Ratio 15.3% 12.8% The conversion ratio is the operating profit stated as a percentage of gross profit and measures both how productive consultants are and how effective the Group is at controlling the costs and expenses associated with its normal operations and its level of investment for the future.
These indicate how efficient the business is in terms of controlling costs and consultant productivity, turning profit into cash or collecting cash. As such, they are key strategic measures and components of the Group’s bonus arrangements. Focusing on these measures also helps protect the Group in poor economic conditions.Cash Conversion 102% 123% Cash conversion is calculated as the
cash flows from operating activities for the year after deducting capex, stated as a percentage of operating profit before exceptional items and is a measure of the Group’s ability to convert profit into cash.
Days’ Sales Outstanding (‘DSO’) or debtor days
36 37 Represents the length of time it takes the Company to receive payments from its debtors. It is calculated by comparing how many days’ billings it takes to cover the debtor balance.
Risk Management (see also section below and Corporate Governance Report)
N/A N/A The Group has a well defined ERM framework embedded throughout the business using an EBITDA measurement scale to assess impact and probability. Risk appetite levels are set by the Board and risks are regularly reviewed to ensure continued alignment with strategy.
Some of the specific risk mitigation actions taken during 2011 are detailed below.

SThree plc06 Report & financial statements 2011
OvERvIEw, BuSINESS MOdEL & STRATEgy
KPIs (financial) 2011 2010Definition and method of calculation
Strategic/Remuneration/Risk context
People Measures (Headcount/Churn)
2,272 heads
The overall Group churn % has
decreased year on
year
1,863 heads These are measures of employee retention and also an indicator of how well a business is run. Lower churn will generally result in increased productivity, as churn often occurs once consultants have become productive, through avoiding having to spend time constantly re-training each new intake. During the year, churn reduced in all but four existing countries, with one country staying the same.
To achieve its strategic growth plans and expand efficiently the Group must attract and retain sufficient headcount, thereby building the experience pool and avoiding constant re-training. As such, they are key strategic measures and components of the Group’s bonus arrangements.
Interviews Interviews have
increased year on
year
Number of interviews conducted by consultants per year.
Whilst this provides a general measure of sales team activity, the number of interviews required to translate into a placement can vary dramatically between perm/contract as well as sectors.
Credit Risk (see also DSO above) – aged debt metrics: A. Current B. 0-30 days C. 31-60 days D. 61-90 days E. Over 91 days
A. 71% B. 21% C. 6% D. 1% E. 1%
100%
A. 64% B. 26% C. 7% D. 1% E. 2%
100%
The Group has a well defined credit policy, which sets out certain minimum requirements in order to do business with potential clients/customers. The policy includes specific targets for DSO, ageing of receivables, credit evaluation and payment collection.
Adherence to this policy helps to ensure that the Group’s exposure to customer/client default is kept to a minimum. The policy also helps to protect the Group in poor economic conditions.
Strategic Development/UK Framework (country expansion limits)
9 new offices in
year
6 new offices in year
The Group has significantly enhanced its strategic development capabilities, to fully assess emerging market risks, off strategy risks, development pipeline and also set other new venture minimum KPIs, to ensure that they grow in a controlled and risk-contained manner, whilst also not neglecting the existing UK business.
Measures specifically focused on developing the business help to ensure that the Group is able to maximise its return on investments and minimise risks in each geography, whilst also building on the experience gained in setting up each strategic new venture.
Compliance targets (by country/sector)
Contract retention/
100% basic/ higher risk
sector documents
Contract retention/
100% basic sector
documents
Above industry standard contractor compliance targets in respect of client/contractor terms, rates/duration/ types and ID collection are set annually, plus there is zero tolerance on code of conduct breaches or fines. Measures are in line with Board approved risk appetite levels and reviewed on a monthly basis.
Compliance processes are regularly reviewed to align with changing local legislation, guard against deemed employment and to significantly mitigate risks in higher risk sectors, e.g. oil & gas/resources, where insurance cover may also be strengthened.
Environmental (see also Corporate Responsibility report)
N/A N/A Steadily improving targets are being set to reduce the Group’s carbon footprint and also make savings in energy expenditure.
Measures are agreed strategically, but with local implementation parameters, based on specific office location, age etc.

07SThree plc Report & financial statements 2011
OVERVIEW, BUSINESS MODEL & STRATEGY
Risk managementThe Group has well defined Enterprise Risk Management (‘ERM’) processes, having articulated both Group and local risk appetite measures, all of which are monitored via the various KPIs described above and underpinned by a formal Risk Management Policy.
Using this framework, the Board regularly assesses and re-evaluates the Group’s material key risks and the following are highlighted as specific areas of focus by the Board during 2011, showing the various actions taken to mitigate the risk and reduce both likelihood and impact in each case:
Headcount/churn – regional MDs targets/bonuses are now set against specific retention criteria, with localised plans in place. Initiatives such as the ‘Talent Drain’ and the ‘Identity’ project were launched to specifically identify/remedy areas with higher levels of churn, whilst a Group wide profiling initiative, including psychometric testing, has also started.
Attracting talent – an improved talent management process was rolled out, in line with the Group’s five year plan, to identify talent early enough to give relevant support/development and allow for effective time line projections into the plan. A career portal to search for internal candidates who may not have applied for positions or who may not be considered was also launched, along with a dedicated resource to actively headhunt suitable senior external staff. There are now also more sophisticated on-boarding processes to improve cultural/other assimilation for those relocating.
Tracker share (‘minority interest’) arrangements – these arrangements are now better targeted and administratively streamlined, with governance strengthened, to promote co-ordinated sector growth across the business.
Supporting the business – project ‘Connect’ was initiated to ensure all support functions and processes are fully aligned and effective as the Group expands, whilst the Group’s structure was also further rationalised in line with the corporate simplification project announced in 2010. Consequently the Group now has far fewer subsidiary companies, having started with 218 in 2010 and with fewer than 40 remaining at the end of 2011.
Cyclicality of business – continued focus on KPIs such as geographical/ sectoral diversification, contract/perm mix, profit and cash conversion and debt ratios, all help to ensure that the business is as aligned as possible with the prevailing economic conditions. Strategy and performance are regularly reviewed and the cost base can be quickly adapted, should conditions dictate. Currently investment is targeted to growth markets or geographies and sectors with a good strategic fit.
Russell Clements Chief Executive Officer
27 January 2012
13%
23%
7%
20%
37%
Geographic Analysis byLocation of Client
UK&I Benelux FranceGermany ROW
UK&I Benelux FranceGermany ROW
Gross ProfitFY 2011 £195.5m
20%
10%
7%
22%
41%
Gross ProfitFY 2010 £166.4m

SThree plc08 Report & financial statements 2011
Clay BrendishChairman
CHAirMAN’s trAdiNg & govErNANCE ovErviEwfor the year ended 27 November 2011
Trading OverviewThe Group achieved another strong set of results, despite the ongoing global economic uncertainty and some very challenging market conditions. Our global expansion has continued as planned, with our more experienced UK employees increasingly being used as the catalyst to ensure that each new office is not only set up on the right footing, but is also able to make a sound financial contribution at the earliest possible opportunity. As these businesses begin to take shape, the key individuals within each region have the opportunity to invest in those businesses by way of the Group’s established tracker share (or ‘minority interest’) model, as we continue to back our home-grown entrepreneurial talent.
Only by increasing our geographic and sector diversification will we be able to optimise our performance when the market eventually returns to more normal conditions. Our tried and tested strategy remains focused on pursuing organic growth, through continued development of the Group’s longer established businesses, whilst at the same time also increasing the Group’s revenues from other sectors and countries. Our business model continues to prioritise quality over volume, in order to optimise the superior margins we consistently achieve. This, together with the multi-brand/niche focused strategy we operate and our highly diversified client base, remain crucial if we are to continue to achieve our goals.
The Board has recommended an increased final dividend for the year in addition to the interim ordinary and special dividends, paid in early December 2011. This reflects not only the current year’s trading, but also our confidence in the cash generative nature of the business going forward. It also recognises the importance we place on providing income as well as capital returns to our investors.
Governance OverviewAs Chairman, I oversee the Group’s governance arrangements, which I regard to be as good as any within the FTSE 350. We are both inclusive and responsive to
our stakeholders, annually engaging with investors on a range of issues, such as the appointment of a new Chairman, the tracker share model, introduction of and changes to the LTIP and on other key remuneration issues.
Following our early application of the principles of the UK Corporate Governance Code (‘the Code’) last year, we continue to enhance our reporting on Remuneration, Governance and Corporate Responsibility (‘CR’) issues, in order to accommodate best practice, as well as changing investor needs. This reflects both our solid stewardship as well as our well embedded governance framework.
During the year, the Board reviewed and improved a number of key areas. Some of these are as follows:
Diversity – under the leadership of the Natasha Clarke, Group’s Director of Strategic Capability, the Group launched its ‘Identity’ project in order to review and improve levels of gender diversity throughout the business. Initial analysis from this project indicated that, despite making up 45% of new hires, women made up only 12% of promotions – a statistic that we absolutely must improve upon if we are to develop a credible pipeline at all management levels. Work is now well underway to agree and implement local action plans, as well as to set specific targets, in all regions to start to address this issue. One of our Non Executives, Alicja Lesniak, has played a crucial role in mentoring women senior management and also providing project guidance.
Succession planning – the Nomination Committee has continued the work it began in 2010 in order to equip senior management for Executive or other high profile Group roles. All NEDs act as mentors to individual members of the Executive Committee, facilitating significant remit/role and/or location changes. As a result, plans are now in place to promote these individuals to undertake Board or other key Group roles during 2012/13. In fact, development initiatives have been strengthened

09SThree plc Report & financial statements 2011
ChAIRMAN’S TRAdINg & gOvERNANCE OvERvIEw
throughout the Group to ensure that there is an appropriate management pipeline at all levels, including a tailored course at Henley Management College.
Board Evaluation – as recommended by the Code, the Board, for the first time, commissioned Lintstock Ltd, an independent third party, to undertake its annual Board/Committee evaluation exercise, via the following framework:
The results of this analysis were issued in January 2012 and recommendations are to be implemented as the year progresses, with regular ‘one on one’ sessions also planned. The following summarises some of the suggested actions:
• Board – increase strategic content/reviews, with less focus on routine items and more regular lessons learnt/Post Implementation Review (‘PIR’) sessions; Strengthen development, training and key risk content, including more presentations from senior management and executive support roles;
• Audit Committee – review membership and better distil Internal Audit information, whilst also rigorously testing that function;
• Remuneration Committee – review membership, whilst also increasing HR Director support; increase frequency and scope of reviews of
the global remuneration structure and performance;
• Nomination Committee – increase activity, broaden and introduce greater formality of succession arrangements
I am very pleased to say that the evaluation exercise concluded that, overall and individually, the performance of the Board, each Committee and each Director was and is effective and that all Directors demonstrate full commitment in their respective roles.
The Bribery Act – following implementation of the Bribery Act in July 2011, comprehensive workshop sessions were held in many offices, supplemented by detailed guidance notes. This ensures that our employees are fully equipped to comply with the legislative changes.
Values – the SThree business is built on an absolute focus of understanding our niche markets and delivering high quality and timely permanent and contract specialist staffing services to our clients. It remains therefore, first and foremost, a people business and it is only as a direct result of the talent and dedication of our people that we are able to continue to grow. We therefore continue to embed our ‘Values’ initiative, which looks to ensure that the SThree core values of Respect, Rapport, Energy and Reward are at the forefront of everything that we do, whilst also ensuring that our employees feel that they gain from, as well as give something to, the business they work so hard for.
Finally, after what has been another turbulent and challenging year, I would like to thank all employees for their valued contribution. Despite the continuing market uncertainties, we believe that our prospects for further growth remain excellent and we are confident of a bright future.
Clay Brendish Chairman 27 January 2012
External facilitator questionnaires completed on line
External facilitator performance reports/feedback
Issues identified/Action plan agreed by Board/Committees with annual follow up/reporting of progress
Full Board assessment reviewed by Board
Chairman assessment to SID/ Individual Director assessments
to Chairman
Committee assessments toCommittee Chairmen
Board/Directors Committees and Chairman

SThree plc10 Report & financial statements 2011
fiNANCiAl HigHligHts
“we start 2012 against a backdrop of increased economic uncertainty. while demand is lower than in the prior year, it is also undoubtedly the case that overall, market conditions remain in far better shape than those we saw in the aftermath of the global financial crisis. It is also true that just as sentiment can deteriorate very quickly, it can also move in a positive direction equally rapidly.
“whatever 2012 has in store for us, we remain confident that we will make the best of it. Our seasoned management team has seen all market scenarios and has become increasingly adept in recent years at driving the best available result in uncertain circumstances. we will manage the business prudently but we will not lose sight of the great medium term prospects for our business and where appropriate we will invest to ensure that the group’s future lives up to its potential.”
Russell ClementsChief Executive Officer

11SThree plc Report & financial statements 2011
FINANCIAL hIghLIghTS
oPErAtioNAl HigHligHts
— A strong performance given the changing market sentiment during the year; — Non-UK&I share of gross profit increased significantly to 63% (2010: 59%), with the trend
expected to continue as the Group becomes ever more international; — New offices opened in Doha, Antwerp, Sao Paulo, Zurich, Luxembourg, Mumbai, Chicago,
Boston and Moscow, bringing the Group total to sixty offices in seventeen countries;— Permanent placements increased by 13.5% to 7,434 (2010: 6,551), with average fees growing
strongly;— Number of active contractors at year end increased by 7.6% to 4,692 (2010: 4,359), with
average gross profit per day rates remaining strong;— Contract versus Permanent mix of gross profit 48%:52% in favour of Contract (2010: 51%:49%);— Continued sector diversification, with non-ICT(1) disciplines now representing 40% of total gross
profit (2010: 38%);— 78% of gross profit now derived from outside of the UK ICT market (2010: 76%);— Total Group headcount at year end increased by 22.0% to 2,272 (2010: 1,863);— Year end net cash and term investments of £55.6m (2010: £55.2m) reflecting continued strong
cash generation.
(1) Non ICT sectors primarily comprise Engineering & Energy, Pharmaceuticals & Biotechnology, Banking and Accountancy & Finance.
fiNANCiAl HigHligHts2011 2010 Change
Revenue £542.5m £474.5m +14.3%Gross Profit £195.5m £166.4m +17.5%Operating profit £30.0m £21.2m +41.2%Profit before taxation £30.3m £21.6m +40.0%Basic earnings per share 16.8p 11.9p +41.2%Diluted earnings per share 16.4p 11.5p +42.6%Proposed ordinary final dividend 9.3p 8.0p +16.3%Total ordinary dividend 14.0p 12.0p +16.7%Total dividend (ordinary and special) 25.0p 12.0p +108.3%

SThree plc12 Report & financial statements 2011
CHiEf EXECutivE offiCEr’s rEviEw
Overview With the specialist staffing market having started the year in line with the improving trend seen in the latter part of 2010, the year ultimately proved to be one of two contrasting halves. The first half was characterised by steadily strengthening sentiment and activity – even if certain markets were still trading somewhat below pre-downturn levels. This changed progressively through the second half as the macro-economic picture deteriorated and stock markets responded accordingly. Given the sentiment-driven nature of the staffing market, demand deteriorated in line with associated decreases in client and (in particular) candidate confidence. As such, in the final quarter, the optimism felt in the earlier part of the year was overtaken by a sense of greater uncertainty.
That said, market conditions remained significantly more robust than those we experienced in the depths of the 2008/09 downturn and provided the Group with a platform that allowed us to deliver a substantial improvement in profitability whilst continuing to invest in the future of the business. In addition to increasing sales headcount significantly, we also opened a further 9 offices, bringing the overall total to 60, of which 38 are outside the UK. Notwithstanding this ongoing investment, we were also in a position to reward our shareholders with both a significant improvement in the ordinary dividend as well as through the payment of a substantial special dividend. Overall then, we can regard our results for 2011 with some satisfaction.
Financial OutcomeDuring the year the Group Gross Profit (GP) was up 17.5% at £195.5m (2010: £166.4m) and Profit before Tax (PBT) of £30.3m was up 40% (2010: £21.6m).
Although 2011 was again a year of investment, the Group had another strong performance in terms of cash generation. At the end of 2011 net cash (including term
investments) had increased to £55.6m (2010: £55.2m), after buying back £7.6m of shares and paying ordinary dividends of £14.5m during the 2011 financial year. Our strong cash performance, combined with the knowledge that even in the most difficult of circumstances the Group remains highly cash generative, provided the context for the Board’s decision to increase the total 2011 ordinary dividend to 14.0p (2010: 12.0p), up 16.7%. At the half year the Group also declared a special dividend of 11.0p per share, which was paid to shareholders on 2 December 2011. As a result, the total payout to shareholders for 2011 was 25.0p per share (2010:12.0p), up 108.3%.
The Board believes that the circumstances which allowed for the payment of the special dividend are not a one-off and hence will periodically review the capital structure of the Group with a view to, where prudent, returning surplus cash to shareholders.
Geographical ExpansionThe Group continued its well established programme of international office roll-outs in a further 9 locations during the year. New offices were opened in Doha, Antwerp, Sao Paulo, Zurich, Luxembourg, Mumbai, Chicago, Boston and Moscow bringing the Group total to 60 offices in 17 countries.
In aggregate, Group GP generated from outside of the UK&I was £124.2m (2010: £98.1m), up 26.6%. Given the more mature nature of the UK&I staffing market and despite a strong start to the year, including a recovery in the contract market, 2011 UK&I GP of £71.3m ended the year a more modest 4.5% up on the prior year (2010: £68.3m). The UK performance was particularly pleasing given the very weak UK investment banking market; demand in most other sectors was healthy.
As a consequence of the faster growth recorded outside of the UK&I, the Group’s non UK&I/UK&I business mix underwent
30%
47%
23%
UK&I Europe ROW
Indicative Future MixGross Profit (c. 5 years)
13%
51%
36%
UK&I Europe ROW
GeographicalGross Profit 2011
10%
49%
41%
UK&I Europe ROW
GeographicalGross Profit 2010
Business mix

13SThree plc Report & financial statements 2011
ChIEF EXECuTIvE OFFICER’S REvIEw
a further shift in favour of our international operations. For 2011 the ratio was 63:37 in favour of non UK&I GP compared with 59:41 in 2010. We see no reason why this trend will not continue on an ongoing basis ensuring the Group becomes ever more internationally diverse. Notwithstanding this, we have confidence in the long term value of our UK&I franchise and expect to see very positive returns as sentiment ultimately improves. Given our focus on niche specialisms, in more normal conditions our candidates remain highly sought-after, even in more mature markets and we have demonstrated over many years that our UK&I business does not require high rates of GDP growth to post strong growth.
All of our international markets are less developed than the UK, offering us the opportunity to drive margin improvement and benefit from structural market growth in each. A particularly notable example of this is Germany which with GP of £44.3m (2010: £33.9m) grew by 30.6% and is now our second largest geography after the UK. By the end of 2011 we had grown our headcount in Germany by 45.7% to 322 consultants (2010: 221). We believe Germany has enormous scope for further growth over the medium term given the scale of the German economy, the size of the working population and the latter’s “STEM” (Science, Technology, Engineering & Maths) bias which dovetails well with SThree’s sectorial strengths.
Further international office expansion is planned for 2012/13. Currently we expect to open new offices in Oslo, Johannesburg, Rio de Janeiro, Brisbane, Lyon, Shanghai, Calgary and Tokyo.
Sector DiversificationIn recent years the Group has diversified its portfolio of sectors substantially. However, we have consistently noted that the rationale for doing so was not a reflection of concern that our longest established franchise – the ICT sector – does not have attractive long term
characteristics. As such, it is pleasing to note that ICT performed robustly with 2011 GP of £116.6m (2010: £102.6m), up 13.7% on the prior year. Nonetheless, our non ICT businesses once again grew faster. As a result our non ICT franchises accounted for 40.4% of total GP (2010: 38.3%). In Gross Profit (GP) terms this amounted to £78.9m, up 23.8% on the previous year (2010: £63.8m).
The major non ICT segments for the Group are Engineering & Energy, Pharmaceuticals & Biotechnology, Banking and Accountancy & Finance. Of these Banking had a very challenging 2011, particularly compared with a strong 2010. By contrast our Energy teams enjoyed strong trading conditions throughout the year and this franchise continues to make an ever more significant contribution to the Group.
As usual, the GP breakdowns given above are a reflection of the skill set of the candidate rather than the business sector of the client company. Measured by the latter, rather than a 60% exposure to the ICT market, only 19% of the Group’s transactions in 2011 (2010: 19%) were with ICT firms per se. This mitigates the Group’s exposure to this type of customer, who are typically (particularly in mature markets) more margin-sensitive.
“High Margin High Value” Our selective approach to customers has a direct bearing on our ability to consistently pursue our “High Margin High Value” approach. The Group has an established strategy which is focused on the quality of the business we transact. Given the highly fragmented nature of the specialist staffing market we do not see the case for buying market share and, in the process, exchange value for volume. In particular, we consciously avoid the lower margin business which is often a prerequisite of dealing with larger price-sensitive clients in our more competitive markets.
4%
4%
9%
7%
16%60%
Sector Analysis byCandidate Skillset
ICT Engineering & Energy BankingAccountancy & Finance Pharma & Biotech Other
ICT Engineering & Energy BankingAccountancy & Finance Pharma & Biotech Other
Gross ProfitFY 2011 £195.5m
Gross ProfitFY 2010 £166.4m
6%
6%
5%
10%
11%62%

SThree plc14 Report & financial statements 2011
ChIEF EXECuTIvE OFFICER’S REvIEw
In parallel we look to go “up the food chain” and place more highly paid candidates, either as a function of the latter’s seniority and/or their niche specialisation. This factor, along with the positive impact of an increasing contribution from higher value geographies (e.g. Germany) was reflected in the robustness of our fees and contract rates during the year. The Group’s overall contract margin stayed broadly stable at 21.4% (2010: 21.6%) and the average gross profit per day rate (GPDR) improved somewhat, up 2.8 % to £86.58 (2010: £84.20) on a constant currency basis.
A similar but much more pronounced value theme was seen in the Group’s permanent business. The average fee recorded in 2011 was £13,028 (2010: £12,123) up 7.5% on a constant currency basis. It is worth noting that this was achieved despite the fact that the Banking market (with its associated higher-than-average fees) was weak throughout 2011.
Contract/Permanent Business MixThe recovery seen in 2010 was very much led by the permanent market with demand for contract staff far more subdued for most of the year. By contrast, 2011 (particularly the first half) saw a pick-up in demand for contractors; however, once again, the permanent market grew at a faster rate. The number of contract runners at the end of 2011 had improved to 4,692 (2010: 4,359) representing an increase of 7.6%. During the year the Group made a total of 7,434 permanent placements (2010: 6,551) an increase of 13.5%.
The net effect of the above was that permanent GP represented 52% of the Group’s total in 2011 compared with 49% of GP for 2010. The evolution of this metric in the near term will be at least somewhat dictated by the macro-economic backdrop in 2012. Given benign conditions we would normally expect a continuation of the recent trend which has
favoured an increase in the permanent weighting. However, in a more challenging environment contract tends to be the more resilient of the two. Either way we are pleased to have a balanced business with our significant contract presence providing some downside protection.
Headcount Market conditions during the year allowed us to continue to grow sales headcount in line with the post downturn hiring programme we began in the second half of 2009. As a result the Group ended 2011 with a total of 2,272 staff (2010: 1,863) an increase of 22.0% on the prior year and in line with our overall prior peak in November 2008 of 2,274. Sales headcount growth was primarily focused on Rest of World, up 72%, and Europe, up 35%. The UK was up 14% but still remains very substantially below its peak headcount and is, increasingly, contributing staff to other parts of our international network.
Headcount growth for 2012 is likely to be far less significant than that seen in 2011. This partly reflects a more uncertain economic outlook but is also driven by our desire to see the large number of new staff we have recruited during the year become fully productive prior to further hiring. In any case, we will only look to grow heads where the current and recent performance of the specific team and the strength of the demand pipeline merit it being considered.
OutlookTrying to predict the kind of market conditions the Group will face during 2012 with any accuracy is extremely difficult given the current levels of global economic and political uncertainty. The specialist staffing market does not have a linear relationship with GDP growth and there is ample historical precedent for growth in the former to outstrip the latter. However, the staffing market is sentiment driven and uncertainty is the enemy of confidence.
48%
52%
Gross Profit FY 2011
Perm Contract
51%
49%
Gross Profit FY 2010
Perm Contract
Permanent/contract analysis

15SThree plc Report & financial statements 2011
ChIEF EXECuTIvE OFFICER’S REvIEw
The market ended 2010 on an “up” which was sustained until the middle of 2011. Thereafter, we saw a sequential decline throughout the second half which resulted in an end to the year which was far more subdued than the beginning. Nonetheless, although current demand is lower than in the prior year, it is undoubtedly the case that overall, market conditions remain in far better shape than those we saw in the aftermath of the global financial crisis. It is also true that just as sentiment can deteriorate very quickly, it can also move in a positive direction equally rapidly.
Whatever 2012 has in store for us, we remain confident that we will make the best of it. We will manage the business prudently but we will not lose sight of the great medium term prospects for our business and where appropriate we will invest to ensure that the Group’s future lives up to its potential. In the meantime we are an agile, cash rich business with a twenty five year track record of profitability. Our seasoned management team has seen all market scenarios and has become increasingly adept in recent years in driving the best available result from uncertain circumstances.
Russell Clements Chief Executive Officer
27 January 2012

SThree plc16 Report & financial statements 2011
CHiEf fiNANCiAl offiCEr’s rEviEw
Revenue for the year increased by 14.3% to £542.5m (2010: £474.5m). Gross profit for the year increased by 17.5% to £195.5m (2010: £166.4m), representing a Group gross profit margin of 36.0% (2010: 35.1%). The Group gross profit margin increased as a result of the remix in business towards permanent, which represented 52% of gross profit in 2011, up from 49% in 2010. Permanent revenues are accounted for at 100% gross margin, whereas contract gross profit is shown after the associated cost of sale.
Administrative expenses increased by 14.1% to £165.6m (2010: £145.2m), as the Group scaled up its operations, hiring more heads and opening new offices. As a result, the Group’s conversion ratio grew to 15.3% (2010: 12.8%).
Group headcount was 2,272 at 27 November 2011, up 22.0% on the prior year headcount at 28 November 2010 of 1,863. Average total headcount for the year was 2,042 up 15.2% year on year (2010: 1,772).
Profit before tax increased by 40.0% to £30.3m (2010: £21.6m) as the Group benefitted from positive operational gearing from the business expansion and investment in 2010 and early 2011.
Taxation on profit was £10.0m (2010: £7.4m), representing an effective tax rate of 33% (2010: 34%). The slight reduction in the effective tax rate was driven by the geographical mix of taxable profits and the 2% point reduction in the UK Corporation Tax rate during 2011. Based on the current structure of the Group and existing local taxation rates and legislation, it is expected that the underlying effective tax rate will remain at around or slightly below this level in the near to medium term.
Basic earnings per share were 16.8p (2010: 11.9p), up 41.2%. This was driven by an increase in profit before tax of 40.0% and the lower effective tax rate. The weighted average number of shares used for basic EPS increased slightly to 120.6m (2010: 119.9m). Fully diluted earnings per share were 16.4p (2010: 11.5p), up 42.6%.
The Board previously declared an interim ordinary dividend of 4.7p per share (2010: 4.0p). The Board has decided to recommend a final ordinary dividend of 9.3p per share (2010: 8.0p), bringing the total ordinary dividend for the year to 14.0p per share (2010: 12.0p). The final ordinary dividend will be paid on 6 June 2012 to those shareholders on the register as at 4 May 2012.
During the year, the Board also declared a special dividend of 11.0p per share which was paid on 2 December 2011(2010: nil), as a means of returning surplus cash to shareholders to improve their total returns. The Board will periodically review the capital structures of the Group and intends to return further cash when it feels it is prudent to do so.
Balance SheetThe Group had net assets of £82.5m at 27 November 2011 (2010: £81.9m). Net cash including term investments amounted to £55.6m (2010: £55.2m).
Tangible fixed asset capital expenditure amounted to £3.0m (2010: £2.8m), relating to investment in IT hardware and the fit out of new offices. Intangible asset additions, primarily relating to IT software purchases and development costs, remained level at £2.9m (2010: £2.9m). Total capital expenditure is planned to be slightly ahead of these levels in 2012 as the business continues its office opening programme
Alex SmithChief Financial Officer
fiNANCiAl rEviEwRevenue Gross Profit
2011 2010 Change 2011 2010 ChangeContract £441.5m £393.1m +12.3% £94.5m £85.0m +11.2%Permanent £101.0m £81.4m +24.1% £101.0m £81.4m +24.1%Total £542.5m £474.5m +14.3% £195.5m £166.4m +17.5%

17SThree plc Report & financial statements 2011
ChIEF FINANCIAL OFFICER’S REvIEw
and invests further in developing the infrastructure to support the globalising business.
As a result of the Group gross profit growing in H2 by 14.5% year on year to £105.5m (2010 H2: £92.2m), net trade debtors increased by £7.4m to £70.5 m (2010: £63.1m) representing a DSO of 36 days (2010: 37 days) and total trade and other payables increased from £86.2m to £95.6m.
Cash FlowAt the start of the year the Group had net cash of £55.2m (including assets held to maturity of £3.5m). During the year, the Group generated cash from operating activities of £36.4m (2010: £31.8m). Income taxes paid increased to £8.0m (2010: £2.8m).
During the year, the Group paid ordinary dividends of £14.5m (2010: £14.4m) and dividends to tracker share or “Minority Interest” participants of £0.7m (2010: £1.0m). The Group also bought back £7.6m of shares held in treasury, with the intention of using these to settle the acquisitions of certain tracker shares and/or awards of shares under the Group’s share plans.
At 27 November 2011 the Group had net cash of £55.6m.
The Group has recently signed a committed revolving credit facility of £20m with Royal Bank of Scotland which expires in January 2017. The Group is not currently drawing down against this facility.
Treasury Management and Currency RiskThe main functional currencies of the Group are Sterling, the Euro and the Dollar. The Group has significant operations outside the United Kingdom and as such is exposed to movements in exchange rates.
The Board has undertaken a review of its currency hedging strategy to ensure that it remains appropriate. The Group does not actively manage its exposure to foreign exchange risk by the use of
financial instruments. The impact of foreign exchange will become a more significant issue for the Group as we expect the business mix to move further towards International, with the International business accounting for 64% of gross profit in 2011 (2010: 60%). The Group will continue to monitor its policies in this area.
Other Principal Risks and Uncertainties affecting the BusinessOther principal risks and uncertainties generally affecting the business activities of the Group are detailed within the Directors’ Report section of the Annual Report for the year ended 27 November 2011, a copy of which will be made available on the Company’s website at www.sthree.com. In the view of the Board, there is no material change expected to the Group’s key risk factors in the foreseeable future.
Our strong balance sheet and net cash continue to give us the confidence to maximise the opportunities that lie ahead.
Alex Smith Chief Financial Officer27 January 2012
78%
22%
2011
UK, ICT Gross Pro�tOther sectors and geographies
76%
24%
2010
UK, ICT Gross Pro�tOther sectors and geographies
69%
31%
2009
UK, ICT Gross Pro�tOther sectors and geographies
Business mix – a transformation

SThree plc18 Report & financial statements 2011
CHiEf strAtEgy offiCEr’s rEviEwfor the year ended 27 November 2011
I am very pleased to report that, despite the ongoing macro economic uncertainty, the Group was able to further expand its business in new geographies, opening nine new offices in the year, compared with six last year. In addition, several new offices are already well advanced and planned to open in H1 2012. This, combined with our ongoing re-branding, consolidation and lead brand/sector specialisation initiatives, helps to ensure that we are continually aligned to our niche market opportunities.
Our strategic development team and the cross functional ‘Strategic Implementation Group’ (‘SIG’) activities have been further strengthened during the year to ensure that that they remain fit for purpose. This structure enables Group-wide experts to share and continually evolve best practice as we move into increasingly more complex and lucrative higher margin sectors and geographies.
This necessitated a review of our new venture risk evaluation processes, which are essential to protect the existing business as we expand our model, in order to increase our risk and compliance focus in some of the more complex areas, whilst also working more closely with external partners to facilitate set up and administration of new ventures, supplemented by expert advice.
Each quarter, the Board review completed new ventures, completed rebrands, scheduled openings, a summary of post implementation reviews (‘PIR’), current research projects/business plans, key strategic initiatives, key risks and agree changes to the five year plan.
We have also strengthened our strategy review and PIR processes, so that the Board can more rigorously engage in reviewing and testing the Group’s strategy on an ongoing basis, whilst also
1 2
3 4
Increase headcountin an existing officeinto a new sector.e.g. Sydney Banking
Increase officefootprint inexisting geography.e.g. Perth
Increase headcountin an existingoffice in anestablished sector.e.g. Munich ICT
THE GROUP’S EXPANSION HAS FOUR MAJORDIMENSIONS: The majority of planned growth comes fromadditional heads in existing locations, in both existing and newsectors.
Open entirelynew regions.e.g. Sao Paulo
Profile of international growth
Gary EldenChief Strategy Officer

19SThree plc Report & financial statements 2011
Complex ventures operationally; will definitely require external resources and significant competitor analysis
Ventures in virgin territory; in some cases external resources may aid us
Ventures where SThree has some experience in the country, but the venture incurs a higher operational risk than Amber ventures; i.e. complex regulation, a European country which we have extensively tested but have no physical presence
Ventures where SThree has a presence in the country but not in the city
Ventures where SThree already has a presence in the city
A current SThree office under review, may lead to exit
Increasing
risk
broadening the scope of some of the proposals under consideration.
Accordingly, each new venture is now categorised as set out below, based on the degree of associated risk.
Whilst our tried and tested strategy remains primarily focused on pursuing organic growth, we remain open to and are continually assessing, other market opportunities as they arise. Despite the current market uncertainties, I am excited by the opportunities available and look forward to creating an even more diversified Group in 2012.
Gary Elden Chief Strategy Officer
27 January 2012
ChIEF STRATEgy OFFICER’S REvIEw

SThree plc20 Report & financial statements 2011
BoArd of dirECtors ANd sECrEtAryReport & Financial Statements 2011
The Board brings together a wealth of experience across differing sectors and businesses on an international basis. Most importantly, all share a passion for the business and have a desire to maximise the opportunities available.
russEll ClEMENtsChief Executive OfficerRussell Clements has served as SThree’s Chief Executive Officer since 2004 having previously held the position of Deputy Chief Executive Officer since 2001. He worked for VNU Business Publications, before joining Computer Futures in 1986 shortly after its inception as the group’s second employee. He subsequently served as Sales Director and Managing Director of Computer Futures. Russell holds a degree in Government from the University of Essex and is also a graduate of the Advanced Management Program at the Wharton Business School, University of Pennsylvania. He is former Chairman of the Association of Professional Staffing Companies (APSCo).
AlEX sMitH Chief Financial OfficerAlex Smith joined SThree in May 2008, having held a number of senior financial and operational roles in the leisure and retail sectors. Most recently he held the position of Integration Finance Director at TUI Travel PLC. Prior to this he was Finance Director of First Choice’s UK Mainstream business, at WH Smith plc, as Managing Director of its Travel Retail business and held senior financial roles at Travelodge and Forte PLC. Alex has a degree in Economics from Durham University and is an Associate of the Institute of Chartered Accountants in England & Wales.
gAry EldEN Chief Strategy OfficerGary Elden was appointed to the Board in July 2008, having been with the Group since 1990, when he joined Computer Futures. He has held a number of senior positions, including that of founding Managing Director of Huxley Associates. In his role as Chief Strategy Officer, he has responsibility for the expansion of the Group’s international operations and non-ICT disciplines.
stEvE HorNBuCklE Group Company SecretarySteve Hornbuckle was appointed to the role in October 2006. Steve has over twenty years’ company secretarial experience, having held Deputy and Assistant Secretary positions within a variety of listed companies, including Intertek Group plc, BPB plc, Kidde plc, Railtrack Group plc, London & Manchester Group plc and English China Clays plc. Steve is a Fellow of the Institute of Chartered Secretaries (‘ICSA’), sits on the ICSA Company Secretaries’ Forum and Investor Relations Society Policy Committee and was voted Company Secretary of the Year in 2011.

21SThree plc Report & financial statements 2011
ClAy BrENdisHChairmanClay Brendish, CBE joined the SThree Board in May 2010 as Non Executive Chairman. Clay is currently Non Executive Chairman of Anite Group plc. Clay has Non-Executive Directorshipship with Herald Investment Trust plc. He is a trustee of Economist Newspapers Limited a Director of The Test and Itchen Association Limited and a member of the Administrative Board of the Elster Group SE.
In August 2011 Clay retired as a Non-Executive Director of the BT Board and in May 2001 Clay retired as Deputy Chairman of CMG plc, a European ICT company that was established in 1964. Clay’s appointment as Deputy Chairman followed CMG’s merger with Admiral plc in June 2000. Prior to the merger Clay was Executive Chairman of Admiral plc that he co-founded in 1979. Admiral plc employed over 2500 people in 8 countries. As Chairman, Clay had primary responsibility for the strategic direction of Admiral, investor relations and acquisitions.
toNy wArdNon Executive Director (Senior Independent Non Executive Director)Tony Ward, OBE was appointed to the SThree Board in August 2006 and to the SThree Remuneration and Nomination Committees in October 2006. Tony currently chairs the Remuneration Committee and has over thirty years experience in a variety of senior executive roles with blue chip companies, including BAA plc, Kingfisher plc and Grand Metropolitan Group plc. He joined BAA in 1997 as Group HR Director and was Services Director from 1999 until March 2007, being responsible for activities including IT, Security, Rail and Airside Operations. Tony was a board director of BAA plc between November 1999 and July 2006. Tony is a Non Executive Director of the OCS Group Limited, an advisor to Manchester Square Partners LLP, and a Consumers’ Association Council Member; a Fellow of the Chartered Institute of Personnel Development; a former Deputy Chairman of the Commission for Racial Equality; and a graduate of the University of Leeds.
BOARd OF dIRECTORS ANd SECRETARy
PAul BowtEll Non Executive DirectorPaul Bowtell was appointed to the SThree Board and as Chairman of the SThree Audit Committee, in November 2007 and Nomination Committee in April 2008 and is currently a Non Executive Director of Capita Group plc and Chief Financial Officer of Gala Coral Group. Paul has extensive experience gained from senior finance roles in a variety of companies including most recently as Chief Financial Officer of TUI Travel PLC, but also with First Choice Holidays PLC and British Gas, a subsidiary of Centrica plc, where he was appointed Finance Director in 2002. Prior to that, Paul was with WH Smith plc, where he held a number of corporate centre roles before becoming Finance Director of the UK Retail business, as well as senior tax roles at Forte and Arthur Andersen. Paul is an Associate of the Institute of Chartered Accountants in England & Wales.
AliCjA lEsNiAk Non Executive DirectorAlicja Lesniak was appointed to the SThree Board in May 2006, to the SThree Audit Committee in July 2006, the Remuneration Committee in February 2008 and the Nomination Committee in April 2008. Alicja is currently a Non Executive Director of Channel 4 and Next Fifteen Communications Group plc and was, until 30 September 2009, CFO of Aegis plc and has over thirty years experience in fast moving service businesses, in the latter twenty years holding senior financial and managerial roles within the advertising/media sector, including seven years with BBDO Worldwide, latterly as Chief Financial Officer for BBDO EMEA, and seven years at WPP Group plc, where she held positions as Chief Financial Officer for Ogilvy & Mather Worldwide and Managing Director of J Walter Thompson in the UK. Prior to joining the advertising sector she held senior management positions with Arthur Andersen & Co, having originally qualified as a Chartered Accountant with them in 1976. Alicja is a Fellow of the Institute of Chartered Accountants in England & Wales and holds a degree in Mathematics from Imperial College.
NAdHiM ZAHAwiNon Executive DirectorNadhim Zahawi, MP was appointed to the SThree Board and to the Remuneration and Audit Committees in May 2008. Nadhim is the former CEO and co-founder of YouGov plc, a leading international online market research agency and became MP for Stratford on Avon in May 2010. He is a member of the Business Innovation and Skills Select Committee of the House of Commons. He is the author of Masters of Nothing – The crash and how it will happen again unless we understand human nature. He was previously European marketing director at Smith & Brooks, with responsibility for marketing brands such as Warner Bros, Disney and Barbie. Nadhim is a patron of Peace One Day and holds a degree in Chemical Engineering from UCL.

SThree plc22 Report & financial statements 2011
Steve HornbuckleGroup Company Secretary
dirECtors’ rEPortfor the year ended 27 November 2011
The Directors present their Annual Report on the activities of the Group, together with the financial statements and auditors’ report for the year ended 27 November 2011.
Principal risks and uncertaintiesA commentary on the Board’s main areas of risk mitigation focus during 2011 is included in the Overview, Business Model & Strategy section. However, some of the principal risks facing the business generally are set out as follows:
Macro-economic environment/cyclicality – The performance of the Group has a relationship and dependence on the underlying growth of the economies of the countries in which it operates in so far as it impacts client and candidate confidence. Whilst 2011 saw some improvement in certain markets, the situation was by no means fully recovered by historical standards. This risk is mitigated in part by maintaining:
• a balance of temporary and permanent recruitment;
• a broad exposure across geographies and sectors;
• a flexible cost base that enables us to react swiftly to changes in market conditions by increasing or reducing costs as appropriate; and
• a strong balance sheet with committed debt facilities.
A key part of the Group’s strategy is to continue to grow the size of its international businesses to reduce the Group’s reliance on any one specific economy, geography or sector.
Competitive environment – The Group continues to face competitor risk in the markets where the provision of permanent and temporary recruitment is most competitive and fragmented, being generally the UK, Ireland and the Netherlands. There is strong competition for clients and candidates, although
we generally resist pricing and margin pressures across our specialist activities. The Group’s strategy is to grow its international businesses more aggressively in new geographies (particularly outside Europe) and sectors, to focus on more specialist niches, which tend to be less competitive, whilst also improving the efficiency and operations of our businesses generally. Where markets are still in a development phase, pricing pressure is less of a risk and our strategy is to rapidly grow our businesses in these territories. In all markets we are subject to both existing and new competition from both small start-ups as well as large multi-nationals, as costs of entry can be relatively low, although these costs have gradually risen with increased levels of compliance required from local regulators and clients.
Commercial relationships/insolvency risk – The Group benefits from close commercial relationships with key clients, predominantly in the private sector, although it is not dependent on any single key client. The Group is always subject to the risk that some customers might be unable to fulfil obligations and even more so in a poor economic climate.
Availability of candidates – The availability of highly skilled/quality candidates is essential to operating in niche/high margin areas and changes in the other risk areas can affect candidate supply. Expanding into newer geographies/sectors can provide protection against potentially lower candidate availability in some more mature markets.
Contractual risk – Clients increasingly require more complex levels of compliance in their contractual arrangements. The Group takes these responsibilities seriously and contracts are therefore closely controlled via the Group’s centralised Legal and Business Administration functions and subject to regular audit in order to reduce non-

23SThree plc Report & financial statements 2011
dIRECTORS’ REPORT
compliance risks. The Group sets out clear guidance on the approval of contractual terms and monitors the application thereof, especially any exceptions to the standard liability/insurance position, which require approval via the Legal Department or Group Company Secretary. The placing of temporary workers generally represents greater risk for the organisation than permanent placements and wherever possible contractual clauses place responsibility for supervision and control directly with the client, excluding any consequential loss and limiting the Group’s aggregate liability.
People – The Group is heavily reliant on the ability to recruit, train and develop people to meet its growth strategy. At the same time, the Group’s business model demands flexibility to expand or consolidate, depending on the economic environment. In response to this, the Group is focused on engaging with and developing its key managers in each sector/geography and is committed to ensuring it has competitive pay and benefits structures, clearly linked to performance, combined with a succession planning process. Through training and development, it seeks to provide individuals with leadership, sales, key customer management and general business skills that support the Group’s expansion needs, whilst providing a rewarding and challenging career. Regional and Country managers are also focused on allocating resources in respect of the best Group opportunities available.
Information Technology (‘IT’) – The Group is reliant on delivering its service to clients through a number of technology systems. These are housed in various locations and the Group has capacity to cope with a data or system loss as a result of a significant event through the establishment of disaster recovery sites that are physically based in separate locations to the ongoing operations. A number of important
suppliers provide critical IT infrastructure and the performance and robustness of these suppliers is monitored to ensure business-critical processes are safeguarded as far as is practicably possible. IT systems are periodically reviewed to ensure they remain effective and project management teams review risks associated in upgrading key systems, utilising robust management tools which monitor progress across the life of any IT project. The business also continues to review and enhance its ability to cope with a significant data or other loss via its business continuity arrangements.
Regulatory environment and legislative changes – The specialist recruitment industry is governed by increasing levels of compliance, which vary from country to country and market to market. The Group is committed to meeting all of its regulatory responsibilities and continues to strengthen its internal controls and other processes with respect to legal and contractual obligations. As employment laws are changed or harmonised, this creates new risks and opportunities. The contract market is more heavily regulated and changes in legislation (such as changes in managed service company legislation or to contract worker rights) may impact the Group. The Group therefore ensures that its policies, processes and systems reflect best practice, wherever possible in order to meet the legal requirements of the markets in which it operates.
Foreign exchange – The Group has significant operations outside the UK and is consequently exposed to movements in exchange rates. As the business mix moves further towards international, the impact of foreign exchange will become a more significant issue. The Board therefore regularly reviews its treasury strategy to ensure that it remains appropriate and currently the Group does not actively manage its exposure to foreign

SThree plc24 Report & financial statements 2011
exchange risk by the use of financial instruments.
Post balance sheet eventsThere have been no significant events since the balance sheet date other than the RBS revolving credit facility, put in place in January 2012.
Results and dividendsInformation in respect of the Group’s profits, dividends and other key financial information is contained within the Overview, Chairman’s and other officers’ sections of this Annual Report.
Directors and their interestsThe Directors of the Company, including biographies, are shown within the Board of Directors and Secretary section, earlier in this Annual Report, with further details of Board Committee membership being set out in the Corporate Governance Report. All Directors served throughout the financial year and, in accordance with the UK Corporate Governance Code, will retire at the 2012 AGM and submit themselves for re-election, with further information contained in the Notice of Meeting.
Other than employment contracts and Minority Interest loans to Gary Elden, none of the Directors had a material interest in any contract with the Company or its subsidiary undertakings. Key terms of the Directors’ service contracts, interests in shares and options and tracker share (‘Minority Interest’) loans are disclosed in the Directors’ Remuneration Report.
Supplier payment policy, essential contractors and change of controlIt is Group policy to comply with terms of payment negotiated with suppliers. Where payment terms are not negotiated, the Group endeavours to adhere to the suppliers’ standard terms. SThree plc acts as a holding company for the Group and does not trade and consequently does not have an average creditors’ payment period. Trade creditors of the Group at 27 November 2011 were equivalent to 26 days’ purchases (2010: 24 days). The Group has business relationships with a
number of contractors but is not reliant on any single one.
There are no significant agreements to which the Company is party that take effect, alter or terminate upon a change of control of the Company following a takeover offer, with the exception of the RBS revolving credit facility agreement, in place from January 2012.
The Company does not have agreements with any Director or employee that would provide compensation for loss of office or employment resulting from a takeover, except that provisions of the Group’s share plans and tracker share (‘Minority Interest’) arrangements, may cause options, awards or minority shareholdings to vest on a takeover.
Share capitalDetails of the authorised and issued share capital of the Company, together with movements during the year are shown in the notes to the financial statements.
Tracker share arrangements (‘minority interests or MI model’)The Group regards its tracker share model as a key factor in its success and it is planned to create more of these each year, on similar terms to those previously created, subject to shareholder approval.
Entrepreneurial employees within the Group often create ideas for new business opportunities, which the Group may elect to pursue and develop. Historically the Group has engaged with such key employees in setting up new brands for the purpose of pursuing these new ideas, which have typically evolved organically out of one of the existing SThree businesses, with the relevant managers then being given the opportunity to manage and develop that new brand. Typically, those managers of the new SThree brand will be able to invest, at the Company’s discretion, in the new venture and share in its success as well as the risk of failure.
As in prior years, only the Group’s key entrepreneurial employees may be invited to invest in the creation of any new tracker
dIRECTORS’ REPORT

25SThree plc Report & financial statements 2011
share business. In order to receive equity ownership such employees must invest in any stake at fair value and be actively engaged in that business for a minimum term of between three and five years. Should the employee wish to dispose of their stake, the Company retains pre-emption rights.
The minimum term for each new tracker share stake is set at the outset and will normally be five years, but will never be less than three years, in order to allow the Group flexibility to adapt to the individual needs of its brands and businesses and differing rates of growth.
Although there are a number of different businesses in which key employees are invited to invest, each invitation will be on generally similar terms to that used previously and it is normally therefore
appropriate to put only one resolution to shareholders each year, with each authority being granted for five years, although automatically renewed at each following AGM, or any adjournment thereof.
The proposed resolution, together with the standard terms upon which the tracker shares are normally based, are outlined within the notice of AGM.
Substantial shareholdingsAs at the date of this document, the Group has been notified, in accordance with the Companies Act, of the following significant interests in the ordinary share capital of the Company, although any interests of Directors which amount to over 3% are shown in the Directors’ interests table within the Directors’ Remuneration Report.
Name of shareholderNumber
of sharesPercentage
shareholding
AXA 5,153,356 4.23%
Blackrock 6,137,031 4.99%
William Frederick Bottriell 9,327,764 7.66%
F&C Management 6,096,679 5.02%
Fidelity 6,028,475 4.95%
HBOS plc 6,983,314 5.21%
JO Hambro 6,223,977 5.19%
JP Morgan Asset Management (UK) Limited 7,021,061 5.07%
Legal & General Group plc 4,841,179 3.97%
Martin Currie Investment Management Limited 4,314,627 3.12%
Standard Life Investments Limited 11,330,732 9.46%
Sunil Wickremeratne 10,691,874 8.78%
Authority to make purchases of own sharesThe Company is, until the date of the forthcoming AGM, generally and unconditionally authorised to buy back a proportion of its own ordinary shares. During the year various share purchases were made, which are held as treasury shares and the Directors will seek to renew the authority to purchase up to 10% of the Company’s issued share capital at the AGM.
Directors’ indemnities, insurance and conflicts of interestSection 236 of the Companies Act 2006 allows companies the power to extend indemnities to Directors against liability to third parties (excluding criminal and regulatory penalties) and also to pay Directors’ legal costs in advance, provided that these are reimbursed to the Company should the individual Director be convicted or, in an action brought by the Company, where judgement is
dIRECTORS’ REPORT

SThree plc26 Report & financial statements 2011
given against the Director. The Group currently has a Directors’ and Officers’ insurance policy in place which provides this cover. The Board also confirms that there are appropriate procedures in place to ensure that its powers to authorise Directors’ conflicts of interest are operated effectively.
Corporate governancePlease refer to the separate Corporate Governance Report.
Financial instrumentsInformation in respect of financial instruments is set out in the notes to the financial statements.
Corporate Responsibility (‘CR’)The Board pays due regard to environmental, health and safety and employment responsibilities and devotes appropriate resources to monitoring compliance with and improving standards. The Chief Executive Officer has responsibility for these areas at Board level, ensuring that the Group’s policies are upheld and providing the necessary resources. Further information is contained in the Corporate Responsibility Report, whilst information on employee share plans and share ownership is contained in the Directors’ Remuneration Report.
Health and safety – The Group is committed to providing for the health, safety and welfare of all its employees. Every effort is made to ensure that country health and safety legislation, regulations or similar codes of practice are complied with.
Employees – The Group is committed to achieving equal opportunities and complying with anti-discrimination legislation and all employees are encouraged to train and develop their careers. Group policy is to offer the opportunity to benefit from fair employment, without regard to sex, sexual orientation, marital status, race, religion or belief, age or disability.
The Group gives full and fair consideration to the employment of disabled persons for suitable jobs. In the event of employees
becoming disabled, every effort is made to ensure that employment continues within the existing or a similar role. It is the Group’s policy to support disabled employees in all aspects of their training, development and promotion where it benefits both the employee and the Group.
Community – The Group is committed to providing support to the community and society through a number of charitable activities. During the period the Group made charitable donations of £47,855 (2010: £64,957) although no donations for political purposes of any kind were made during the year.
Annual General Meeting (‘AGM’)The AGM of the Company will be held on 19 April 2012, at 5th Floor, 215-227, Great Portland Street, London, W1W 5PN. A separate notice details all business to be transacted.
AuditorsAs required by Section 418(2) of the Companies Act 2006, each Director in office, at the date of this report, hereby confirms that:
• so far as the Director is aware, there is no relevant audit information of which the Company’s auditors are unaware; and
• he/she has taken all steps that he/she ought to have taken as a Director in order to make him/herself aware of any relevant audit information and to establish that the Company’s Auditors are aware of such information.
PricewaterhouseCoopers LLP have indicated their willingness to continue in office. Accordingly, a resolution will be put to the forthcoming AGM proposing their re-appointment as auditors for the ensuing year.
Statement of Directors’ responsibilitiesThe Directors are responsible for preparing the Annual Report, the Directors’ Remuneration Report and the financial
dIRECTORS’ REPORT

27SThree plc Report & financial statements 2011
statements in accordance with applicable law and regulations.
Company law requires the Directors to prepare financial statements for each financial year. Under that law the Directors have prepared the Consolidated Group and Company financial statements in accordance with International Financial Reporting Standards (IFRSs) as adopted by the European Union. Under company law the Directors must not approve the financial statements unless they are satisfied that they give a true and fair view of the state of affairs of the Consolidated Group and the Company and of the profit or loss of the Company and Consolidated Group for that period. In preparing these financial statements, the Directors are required to:
• select suitable accounting policies and then apply them consistently;
• make judgements and accounting estimates that are reasonable and prudent;
• state whether applicable IFRSs as adopted by the European Union have been followed, subject to any material departures disclosed and explained in the financial statements;
• prepare the financial statements on the going concern basis unless it is inappropriate to presume that the company will continue in business.
The Directors are responsible for keeping adequate accounting records that are sufficient to show and explain the Company’s transactions and disclose with reasonable accuracy at any time the financial position of the Company and the Consolidated Group and enable them to ensure that the financial statements and the Directors’ Remuneration Report comply with the Companies Act 2006 and, as regards the Consolidated Group financial statements, Article 4 of the IAS Regulation. They are also responsible for safeguarding the assets of the Company and the Consolidated Group and hence
for taking reasonable steps for the prevention and detection of fraud and other irregularities.
The Directors are responsible for the maintenance and integrity of the Company’s website. Legislation in the United Kingdom governing the preparation and dissemination of financial statements may differ from legislation in other jurisdictions. Each of the Directors, whose names and functions are listed above confirm that, to the best of their knowledge:
• the Consolidated Group and Company financial statements, which have been prepared in accordance with IFRSs as adopted by the European Union, give a true and fair view of the assets, liabilities, financial position and profit of the Consolidated Group and Company; and
• the Directors’ report, together with the Overview, Chairman’s and other officers’ sections of this Annual Report, provide a fair review of the development and performance of the business and the position of the Consolidated Group and Company, together with a description of the principal risks and uncertainties that it faces.
By order of the Board
Steve Hornbuckle Group Company Secretary 27 January 2012
Registered Office: 5th Floor, 215-227, Great Portland Street, London, W1W 5PN
dIRECTORS’ REPORT

SThree plc28 Report & financial statements 2011
Tony WardChairman of the Remuneration Committee
dirECtors’ rEMuNErAtioN rEPortfor the year ended 27 November 2011
IntroductionThis report has been prepared in accordance with the Companies Act 2006 and the Directors’ Remuneration Regulations 2002, relevant provisions of the Listing Rules and the UK Corporate Governance Code. The Regulations require the auditors to report to the Company’s shareholders on the ‘auditable part’ of the Directors’ Remuneration Report and to state whether in their opinion this part of the report has been properly prepared in accordance with the Companies Act 2006 (as amended by the Regulations). The report has therefore been divided into separate sections for unaudited and audited information and, as required by the Regulations, a resolution to approve the report will be proposed at the forthcoming Annual General Meeting.
Year in focus – summary• base salary increases to address
the market differential in line with the Group’s well communicated remuneration policy and recognise the continued business development;
• LTIP structure and performance targets reviewed to ensure they remain appropriate;
• Up to 20% of bonus opportunity relates to key strategic objectives, in support of future profitability and managing business risk, with strengthened risk/compliance elements for senior individuals below Board level;
• Opportunities to participate in employee share schemes created for our staff in several countries, in addition to the UK, to deliver the policy of significant employee shareholder participation.
uNAuditEd iNforMAtioNRemuneration CommitteeThe Remuneration Committee (the ‘Committee’) determines the remuneration policy and the individual remuneration packages of the Chairman, the Executive Directors, the Group Company Secretary and certain key senior management posts. The Committee’s Terms of Reference were updated during 2010, particularly in the light of the UK Corporate Governance
Code and ICSA best practice guidelines, and are available at www.sthree.com. During the year the Committee comprised only independent Non Executive Directors, being Tony Ward (Chairman), Alicja Lesniak and Nadhim Zahawi. The Chief Executive Officer and Group HR Director regularly attend meetings by invitation, except for matters related to their own remuneration. The Committee met four times during the year and no member of the Committee has any personal financial interest (other than as a shareholder) in the matters decided.
The Committee have appointed Deloitte LLP (“Deloitte”) as its remuneration advisor. During the year the Committee took advice from Deloitte in relation to remuneration maters, for which it paid £36,200 (2010: £41,500), excluding VAT. Deloitte have also undertaken work on specific corporate tax matters in relation to IP and royalties for the Company. Deloitte have confirmed that they have complied with the Code of Conduct for remuneration consultants and the Committee are satisfied that their advice is objective and independent.
Remuneration policyThe remuneration policy has been designed to support the longer-term business objectives of the Group and to promote shareholder value creation, whilst ensuring that it has the capability to attract and retain Directors and senior managers of a high calibre to achieve business success. At all times, the Committee considers best practice guidelines and reward across the wider group in setting elements of remuneration.
Individual pay levels are determined by reference to performance, experience, potential and comparative market conditions. In setting the policy the Committee considers, for benchmarking purposes, the remuneration of relevant senior management in comparable quoted companies. There are three main elements of the remuneration package for Executive Directors:
• fixed pay/benefits – basic annual salary/benefits, including company car

29SThree plc Report & financial statements 2011
dIRECTORS’ REMuNERATION REPORT
allowance, pension contributions and health insurance cover;
• variable annual pay – cash/share based bonus payments; and
• variable long term pay – share based long-term incentives.
In setting total remuneration, the Group’s policy is to position the base salaries of Directors and senior management at
between lower quartile and median for the relevant comparative market, with a higher than average proportion of their remuneration being performance related. This policy was examined by Deloitte during the last benchmarking exercise and will continue to be reviewed to ensure that it remains appropriate. The ratio of fixed to variable pay at various performance levels is shown as follows:
0% 20% 40% 60% 80% 100% 120%
Maximum
Target
Ratio of fixed and variable pay at target and maximum performance
Fixed pay
Variable pay
Executive Directors’ base salary and benefitsDuring 2011 the Committee undertook a benchmarking of total compensation with the support of Deloitte. As part of this review, the Committee considered external market data, but also the progress in implementing the business strategy through continued expansion.
The Committee concluded that the base salary for Russell Clements, CEO and Alex Smith, CFO remained significantly below the Committee’s stated policy of base pay being between lower quartile and median when measured against a selected comparator group drawn from the FTSE250 Support Services sector. Likewise, the base salary for Gary Elden, CSO was also behind the market level, albeit to a lesser extent.
In the CEO’s case the benchmark differential was significantly below our reference point. The Committee had historically indicated that it would look to limit base salary increases to no more than 10% per year in order to reach a competitive level, and so in-line with this
commitment, a 9.9% salary increase was approved. The Committee noted that CEO’s base salary still remains someway below the target competitive range.
In the CFO’s case, he is now an experienced, competent and well regarded CFO of a FTSE 250 size business, being highly externally marketable, as well as having taken on additional responsibilities since the COO, Sunil Wickremeratne, left the business in 2010. However, the base salary of the CFO was below our benchmarking reference point and therefore a 9.9% salary increase was agreed. This positions the CFO’s base salary within our competitive range.
The CSO took on additional responsibilities at the time of the COO’s departure and he has now moved to the US, where he has settled well into his role and is having a significantly positive impact on local management whilst also maintaining his Group-wide strategic responsibilities. The Committee approved a salary increase of 7.4%, which still places the CSO’s base salary below median against the comparator group.

SThree plc30 Report & financial statements 2011
dIRECTORS’ REMuNERATION REPORT
Director Date Appointed
Base Salary –
2010
Base Salary –
2011%
Increase
Base Salary (from
1 December 2011)
Russell Clements, CEO 11 November 2005 £317,000 £348,400 9.9% £382,892Gary Elden, CSO 14 April 2008 £241,500 £265,400 7.4% £285,040Alex Smith, CFO 7 May 2008 £235,400 £258,700 9.9% £284,311Sunil Wickremeratne, former COO 11 November 2005 £266,500 N/A N/A N/ATotal £1,060,400 £872,500 £952,243
All of these increases were effective from 1 December 2011. The table below illustrates the base salaries of the Executive Directors, along with their date of appointment:
Executive Directors are also eligible to receive a car allowance; life and private
medical insurance; plus an employer’s contribution to their personal pension schemes equivalent to 10% of their basic salaries, subject to each making 5% personal contributions. Bonuses and benefits are not pensionable and are detailed in the later emoluments table.
Annual bonus schemeExecutives receive annual bonus payments based on the achievement of stretching targets, set annually by the Committee. The maximum bonus opportunity for Executive Directors is 120% of salary, although for individuals below Board level this can be uncapped, with deferral into shares for achievement over 100% of salary, vesting in equal tranches over two years, provided the Executive remains employed with the Group.
Currently where the agreed targets are achieved, 50% of salary is payable, with maximum bonus payable for achieving 110% of target and with pro rata payment for achievement between 90% and
110% of target. No bonus is paid for achievement below 90% of target. The table below shows the category of targets agreed and measured by the Committee in 2011.
Achievement was based on the Committee’s assessment of the performance during the year against each stated measure, despite the continuing market uncertainties, with the percentage of salary being accrued for all Executive Directors and having due consideration for risk management, as well as environmental, social and governance (‘ESG’) issues, to ensure that the incentive structure does not inadvertently encourage irresponsible behaviour.
Performance measureMaximum potential
(% salary)
Actual achievement
(% salary)
Profit Before Tax (pre-exceptional) 57.6% 9.3%Cash Conversion 38.4% 38.4%Geographical & Sector Diversification 8.0% 5.9%High Value/High Margin 4.0% 4.0%Business Efficiency/Effectiveness 4.0% 3.3%UK Specific 4.0% 3.5%People Measures 4.0% 2.8%Total 120% 67.2%

31SThree plc Report & financial statements 2011
Long Term Incentive Plan (‘LTIP’)The Long Term Incentive Plan (‘LTIP’) was introduced in November 2006, for Executive Directors and other members of the senior management team, in order to provide an incentive to increase shareholder value and support alignment with shareholder interests through building a stake in SThree shares. The main features of the LTIP are as follows:
• Awards of shares can be made, each year, to Executive Directors and other Senior Executives in the form of forfeitable shares or share options (nil-cost or market value);
• The maximum annual face value of awards which may be made to Executive Directors is 175% of salary, whilst over a three-year period the Committee intends that an Executive Director will not receive aggregate awards in excess of a face value of 450% of salary;
• All Executive Directors’ awards must be subject to a performance condition, assessed over the three years following the date of grant, with no facility to re-test performance. For other participants, the Committee has discretion to decide whether or not a performance condition should apply to grants;
• From 2010 onwards, the performance criteria was revised from a relative Total Shareholder Return (‘TSR’) only, to add an Earnings Per Share (‘EPS’) growth measure, with each separate measure applying to 50% of the total LTIP award.
• The current TSR peer group consists of some 40 UK-listed companies, all being recruitment or service companies from the FTSE Support Services, AIM or Fledgling indices, as follows: Empresaria Group plc, Experian plc, Garner plc, Harvey Nash Group plc, Hays plc, Healthcare Locums plc, Hexagon Human Capital plc, Highams Systems Services Group plc, Hyder Consulting plc, Hydrogen Group plc, Impeilam Group plc, Interquest Group plc, Kellan Group plc, Management Consulting Group plc, Matchtech Group plc, Michael Page International plc, Mitie Group plc, Morson Group plc, Mouchel Group plc, Network Group Holdings plc, Networkers International plc, Office2office plc, Penna Consulting plc, Pinnacle Staffing Group plc, Prime People plc, Regus plc, Rethink Group plc, Ricardo plc, Robert Walters plc, RPS Group plc, RTC Group plc, Saville Group plc, Servoca plc, Staffline Group plc, Tribal Group plc, Waterman Group plc, White Young plc, Work Group plc, World Careers Network plc and WS Atkins plc. This list is reviewed annually;
• The TSR and EPS measures used for the 2011 LTIP awards are summarised in the table below and these targets are intended to be used for the forthcoming LTIP awards to be made in early 2012. Targets are reviewed annually by the Committee, in the light of the current trading environment, internal and external forecasts, as well as the guidelines of key investor bodies.
• The preferred EPS growth measure is Compound Average Growth Rate
dIRECTORS’ REMuNERATION REPORT
Percentage of award that vestsCompany’s TSR ranking
against comparator group over performance period
Company’s EPS growth over performance period
None Below median Below RPI plus 6% pa30% Median RPI plus 6% pa80% N/A RPI plus 13% pa or better100% Upper quartile or better RPI plus 15% pa or better
Pro rata on a straight line Between median and upper quartileBetween RPI plus 6%-13% and
RPI plus 13%-15%

SThree plc32 Report & financial statements 2011
(‘CAGR’), as it rewards value creation equally over the period covered by the incentive. Pre-exceptional, undiluted EPS is used as the basis for awards, so that any material abnormal influences are excluded, with any abnormal influences which are not material but still significant, being highlighted to the Committee for consideration as to their treatment;
Employee Benefit Trust and share plans generallyThe Group has a culture that encourages tax efficient share participation at all levels. An Employee Benefit Trust (‘EBT’), originally funded by gifts from Directors, hold assets comprising shares in the Company, with shares also held as ‘Treasury Shares’. Shares in the EBT or held in Treasury, are held for awards and grants under the Group’s various share option and share award schemes, which include the LTIP, Savings Related Share Option Scheme (‘SAYE Scheme’) and a Savings & Investment Plan (‘SIP’) as well as to satisfy tracker share purchases. The Company intends to make available similar share plans in other jurisdictions, subject to local laws, etc, where commercially viable and has set the critical mass of headcount for roll out in each country at 100 employees. This roll out will continue into 2012, for those countries which have already met this criteria, with new countries to be progressively added each year in line with the agreed headcount threshold.
Generally, in the event of a takeover, or similar, under the Group’s share plans, shares may generally vest or options exercised early, with the Committee normally taking into account the length of time between the start of any holding period and the triggering event, as well as the level of any performance criteria, up to the date of the triggering event. The Committee may also alter the rules of any share plan provided that this is not to the advantage of participants, in which case
prior approval of the Company in general meeting must be obtained, whilst any amendment that is to the disadvantage of participants requires the consent of a majority of them. Under the SIP, shares are purchased on a monthly basis, at the then market price and matching shares are awarded on a 1:1 basis, provided that participants do not sell their purchased shares and also remain in employment within the Group for at least one year. In terms of dilution, the Committee intends that awards under the LTIP, EBT and other share plans should be satisfied by a combination of existing EBT shares, Treasury Shares, market purchases and new issue shares. Where new issue shares are used, this will comply with the guidelines provided by the Association of British Insurers. Expected value calculations of share incentives are not disclosed as these are not considered meaningful.
Executive Directors’ service contractsIt is the Company’s policy that Executive Directors should have contracts with a rolling term providing for a maximum of 12 months’ notice. Consequently, in the event of an early termination, the contractual right is to 12 months’ basic salary and benefits, with mitigation being generally required to reduce any compensation payable to a departing Director. Each contract provides an entitlement to a basic annual salary, performance bonus scheme participation, a company car allowance, pension contributions as well as health insurance cover and are terminable by 12 months’ notice given by either party.
dIRECTORS’ REMuNERATION REPORT

33SThree plc Report & financial statements 2011
Non Executive Directors (‘NEDs’)All Non-Executive Directors (‘NEDs’) have specific letters of appointment, available upon request, and their remuneration is determined by the Board within the limits set by the Articles of Association and normally based on independent surveys of fees paid to Non-Executive Directors of similar companies. Fees are set taking into account the commitment and responsibilities of the relevant role. As part of the recent benchmarking exercise, the Board took the opportunity to review the fees payable to the Non Executive Directors and agreed that these should be increased from 1 December 2011, from £35,000 pa to £40,000 pa, which will maintain them at the lower quartile position. At the same time, the fees payable for chairing each Committee (excluding the Nomination Committee) will also rise by £1,000 pa, from £5,000 to £6,000 pa. The fee increases are the first since the Group was floated in 2005. However, Clay Brendish, being more recently appointed as Chairman, will remain on a fee of £125,000 pa. The table above shows the NEDs dates of appointment, fees and Committee chair positions.
Non Executive Directors are appointed for an initial term of three years, terminable by either the Company or the Non-Executive Director at will, and, in normal circumstances, subject to performance and re-election at Annual General Meetings, they would be expected to serve for a second three-year term. Non-Executive Directors may be requested to serve for a further (third) three-year term subject to rigorous review at the relevant time and their agreement. Upon termination or resignation, Non- Executive Directors are not entitled to compensation and no fee is payable in respect of the unexpired portion of the term of appointment. Non-Executive Directors cannot participate in any Company incentive scheme.
Total Shareholder Return (‘TSR’)The graph below shows the Total Shareholder Return (‘TSR’) of the Company since flotation on 16 November 2005, for the Group and the FTSE Support Services index, which is considered the most illustrative comparator index for investors, as the Company is a constituent of this index and its constituents are also used for comparing pay and benefit levels.
dIRECTORS’ REMuNERATION REPORT
Non Executive Director Date appointedTotal fees –
2010Total fees –
2011Total fees –
2012 Committee chair
Clay Brendish 1 May 2010 £72,900 £125,000 £125,000 Nomination CommitteeAlicja Lesniak 3 May 2006 £35,000 £35,000 £40,000 N/ATony Ward 14 August 2006 £40,000 £40,000 £46,000 Remuneration CommitteePaul Bowtell 5 November 2007 £40,000 £40,000 £46,000 Audit CommitteeNadhim Zahawi 1 May 2008 £35,000 £35,000 £40,000 N/ATotal £222,900 £275,000 £297,000
0
50
100
150
200
250
300
SThree FTSE 350 Support Services
Nov05
May06
Nov06
May07
Nov07
May08
Nov08
May09
Nov09
May10
Nov10
May11
Nov11
TSR
(reb
ased
to 1
00)

SThree plc34 Report & financial statements 2011
dIRECTORS’ REMuNERATION REPORT
AuditEd iNforMAtioNDirectors’ remunerationThe table below summarises all Directors’ emoluments and pension contributions for the current and the prior year for comparison. No other awards were made to any Director during the year to 27 November 2011.
Director
Salary & fees
£’000
Pension contributions
£’000Benefits*
£’000Bonuses
£’0002011 Total
£’0002010 Total
£’000
Executive DirectorsRussell Clements 348.4 34.8 10.5 234.2 627.9 718.2Gary Elden** 271.0 8.8 39.1 182.1 501.0 549.7Alex Smith 258.7 25.9 10.5 173.9 469.0 536.0Sunil Wickremeratne*** – – – – – 605.5Non Executive Directors**** 275.0 – – – 275.0 264.9Aggregate emoluments 1,153.1 69.5 60.1 590.2 1,872.9 2,764.3* Benefits in kind normally include a company car as well as medical and life insurance and are included above where relevant.
** Gary Elden’s salary is paid in US dollars, following his relocation to the US during the year and this has been converted into pounds sterling at an average exchange rate based on the time he has been in the US, of 0.62543. He is also paid a US housing allowance and received a loan of £22,482 to assist his relocation.
*** Sunil Wickremeratne (who left in 2010) and William Bottriell, both former Directors, receive £5,000 per annum for services provided from time to time.
**** Audited Information includes the individual NED fees set out earlier for both 2011 and 2010.
DirectorDate of
grant/award
Market price at grant/
awardShares
awarded
Shares vesting in
yearVesting
date
Shares outstanding as at 27 Nov 2011
Russell Clements 6/2/2008 196.75p 175,959 175,959 6/2/2011 0Russell Clements 3/2/2009 154.50p 246,213 – 2/2/2012 246,213Russell Clements 11/2/2010 299.40p 158,817 – 10/2/2013 158,817Russell Clements 1/2/2011 371.30p 140,748 – 1/2/2014 140,748Gary Elden 6/2/2008 196.75p 108,476 108,476 6/2/2011 0Gary Elden 3/2/2009 154.50p 187,572 – 2/2/2012 187,572Gary Elden 11/2/2010 299.40p 120,991 – 10/2/2013 120,991Gary Elden 1/2/2011 371.30p 107,217 – 1/2/2014 107,217Alex Smith 6/2/2008 196.75p 143,869 143,869 6/2/2011 0Alex Smith 3/2/2009 154.50p 182,834 – 2/2/2012 182,834Alex Smith 11/2/2010 299.40p 117,935 – 10/2/2013 117,935Alex Smith 1/2/2011 371.30p 104,511 – 1/2/2014 104,511
Long Term Incentive Plan (‘LTIP’), other share options/awards and tracker sharesLTIPExecutive Directors’ awards of forfeitable, deferred shares or options under the LTIP are set out in the table below, showing changes during the year. Awards are subject to the performance criteria detailed earlier. The next awards are to be made in early 2012.
LTIP awards made in February 2008 vested from 7 February 2011 to the extent of 100% in accordance with the Group’s relative TSR performance, on that date the share price was 397p per share. For the participants above, no options lapsed during the year. In respect of Gary Elden, some 12,500 notionally vested shares currently remain within the Trust.
Awards are structured to include tax approved options, granted at market value, with a corresponding funding award granted at an option exercise price of £1, in respect of each award granted. Unapproved awards are granted at nil cost.

35SThree plc Report & financial statements 2011
dIRECTORS’ REMuNERATION REPORT
The Company has also introduced a Joint Ownership Plan (‘JOP’), in respect of some of the unapproved LTIP awards, with JOP options over existing LTIP awards being granted to participants at prices of 60p, 73p and 78p per share. In order to satisfy upfront tax and NIC liabilities on JOP awards, loans have been made available to all participants. These loans carry interest at the HMRC official rate applicable and are to be repaid on or around the third anniversary of the related LTIP grant. Current loan amounts outstanding are: Russell Clements £55,532; Gary Elden £43,957; and Alex Smith £43,021. Prior to the introduction of the JOP, the Committee undertook modelling to ensure that there was no potentially significant cost to the Company.
SAYE – DirectorDate of
grant/awardOption price at
grant/awardShares
awardedShares lapsed
Vesting date
Shares outstanding as at
27 Nov 2011
Russell Clements 26/6/2009 158.40p 5,729 – 01/09/2012 5,729Gary Elden 26/6/2009 158.40p 5,729 – 01/09/2012 5,729Alex Smith 26/6/2009 158.40p 5,729 – 01/09/2012 5,729
Director
Ordinary shares held at 28 Nov
2010Ordinary shares
purchasedOrdinary shares
sold
Ordinary shares held at 27 Nov
2011Percentage of share capital
Russell Clements 3,762,761 265,257 (103,737) 3,924,281 3.23%Gary Elden 3,386,038 152,830 (110,723) 3,428,145 2.86%Alex Smith 1,628 175,344 (84,818) 92,154 0.08%Clay Brendish 13,500 24,800 0 38,300 0.03%Paul Bowtell 10,000 40,000 0 50,000 0.04%Alicja Lesniak 4,245 0 0 4,245 0.01%Tony Ward 12,063 2,000 0 14,063 0.01%Nadhim Zahawi 14,720 1,268 0 15,988 0.01%
Save As You Earn (‘SAYE’)Executive Directors’ awards under the SAYE scheme are set out in the table below, with each award being exercisable three years from the date of grant, for a period of six months, at the relevant option price.
Tracker share (‘minority interest’) arrangementsGary Elden holds small percentage shareholdings in a number of SThree businesses under the Group’s tracker share arrangements. The earliest of these was created in November 2006 and in some cases loans were provided by the Group to enable all senior individuals to acquire their shares. In Gary Elden’s case, loans totalling £305,216 were granted under normal commercial terms on 30 November 2006 and 6 February 2007. All loans outstanding are expected to be repaid in full and details of the individual arrangements are also disclosed in the statutory accounts of the relevant businesses concerned. As an Executive Director, Gary cannot participate in any arrangement approved by shareholders after his appointment to the Board. However, at the AGM in April 2009, shareholders ratified his participation in the 2008 arrangements, as these were approved at the AGM in April 2008, but not actually created until after his Board appointment in July 2008. No other awards or share options are held by the Executive Directors.
Directors’ interests in sharesDirectors’ interests in the share capital of the Company as at 27 November 2011 are shown in the table below and any changes to the date of this report, are set out thereafter. No Director had any other interest in the share capital of the Company or its subsidiaries, or exercised any share options, during the year, other than as already disclosed.
For the Executive Directors, changes during the year include the acquisition and subsequent disposal (including for tax and NIC) of shares vesting under the LTIP, following the performance testing of awards granted in February 2008,

SThree plc36 Report & financial statements 2011
dIRECTORS’ REMuNERATION REPORT
plus the addition of shares accrued in lieu of dividends paid during the performance period of these awards, in line with other LTIP participants.
Interests in shares relate only to ordinary shares of 1p each, but may include partnership and matching shares held in trust under the SIP, which are subject to forfeiture conditions in certain circumstances. SIP participants and ordinary shareholders may also reinvest dividends by way of a Dividend Reinvestment Plan (‘DRIP’). Since 27 November 2011, Russell Clements has acquired 1,074 shares, Gary Elden 734 shares and Alex Smith 886 shares, under the SIP or DRIP, which are in addition to the totals shown in the table above.
The Company has in place formal shareholding guidelines for Executive Directors. As such, all Executive Directors must attain a level of shares equivalent to at least 100% base salary within five years of 1 December 2008, or their date of appointment. Although there is no formal shareholding requirement below Executive Director level, most Executive Committee members already hold shareholdings well in excess of this level in line with the Group’s culture of encouraging share participation at all levels. In particular, it is estimated that over 30% of the Company’s share capital is currently held by Directors, Founders, the Employee Benefit Trusts, senior management and other employees.
On 25 November 2011, the last dealing day before the year end, the closing market price of SThree plc ordinary shares was 219.5p. The highest and lowest closing prices of these shares during the year, was 447.6p and 213p respectively, based on the London Stock Exchange Daily Official List.
ApprovalThis report was approved by the Committee, on behalf of the Board, on the date shown below and signed on its behalf by:
Tony Ward, OBE Chairman of the Remuneration Committee 27 January 2012

37SThree plc Report & financial statements 2011
CorPorAtE govErNANCE rEPortfor the year ended 27 November 2011
Relevant section of the Code Commentary (including relevant Code provision)
A. LeadershipA.1 The Role of the Board The Board provides entrepreneurial leadership and overall control of the Group, setting
a framework of prudent and effective controls to enable risks to be properly assessed and managed. Its primary role is to create value for stakeholders, to agree and approve the Group’s long-term strategic objectives and to develop robust corporate governance and risk management practices, whilst ensuring that the necessary financial and other resources are in place to enable those objectives to be met. In undertaking this, the Board also reviews management performance and sets the Company’s values and standards, with all Directors acting in what they consider to be the best interests of the Company, consistent with their statutory duties. Certain powers are delegated to the Remuneration Committee, Audit Committee and Nomination Committees, with details of the roles and responsibilities of these Committees being set out under the relevant section below. In addition, the Board has agreed Terms of Reference for its other formal committees in order to facilitate more efficient working practices and these include the Executive Committee, the Investment Committee, a Routine Business Committee, a Disclosure Committee and CR Committee, all of which provide a clear framework of delegated authorities. In December 2011, all terms of reference were updated in accordance with the Code and ICSA best practice guidelines.
A.1.1 The Board is responsible to shareholders for the proper management of the Group and has identified key financial and operational areas that require regular reporting and which enable the performance of Executive management to be reviewed and monitored. These are set out in a schedule of matters reserved to the Board, which is reviewed on a regular basis. The schedule outlines all matters requiring specific consent of the Board, which include, inter-alia, the approval of Group strategy and operating plans, the annual budget, the Annual Report, the Interim Report and related announcements, major divestments and capital expenditure, large acquisitions and disposals, the recommendation of dividends and the approval of treasury and risk management policies. The schedule therefore facilitates structured delegation, subject to certain financial limits and provides a practical framework for executive management/reporting, which seeks to achieve the objectives of maintaining effective financial and operational controls, whilst allowing appropriate flexibility to manage the business. The current schedule of matters reserved to the Board is available on the Company’s website, www.sthree.com.
A.1.2 The Directors of the Company, including biographies, are set out earlier in this Annual Report, with further details of Board Committee membership being set out below. The number of, and attendance at, Board and Committee meetings during the
The Board believes that high standards of corporate governance are intrinsic to the Company’s culture and values. In particular:
• They are central to its core values and strategy, including integrity, professional excellence and sustainability, as stated throughout this Annual Report;
• They underpin the objectivity of our processes in support of financial and risk management, the design and operation of remuneration structures,
succession planning, as well as our work on diversity and values;
• They are the basis for the accountability of Executive management to the Board and of the Board to the Company’s shareholders.
The following table outlines how the Company has applied the main/supporting principles and provisions of the UK Corporate Governance Code, published by the Financial Reporting Council in May 2010 (‘the Code’).
Steve HornbuckleGroup Company Secretary

SThree plc38 Report & financial statements 2011
CORPORATE gOvERNANCE REPORT
year, is also shown in a table below. Almost all meetings were fully attended and, outside these, there was frequent contact between Directors on a range of matters.
A.1.3 Appropriate insurance cover is in place in respect of legal action against the Directors.
A.2.1 There is a clear division of responsibilities between the Chairman and the Chief Executive Officer, set out in writing and approved by the Board so that no one individual has unfettered powers of decision.
A.3 The Chairman The Chairman leads the Board in the determination of its strategy and achieving its objectives and is responsible for co-ordinating the business of the Board, ensuring its effectiveness, timing and setting its agenda but he has no involvement in the day-to-day running of the Group’s business. The Chairman allows adequate debate by all, whilst facilitating the effective contribution of the Non Executive Directors (‘NEDs’), overseeing Board induction and evaluation, ensuring constructive relations between Executive and NEDs and that the Directors receive accurate, timely and clear information to undertake Board affairs and facilitate effective communication with shareholders. The Chief Executive Officer has direct charge of the Group on a day-to-day basis and overall responsibility to the Board for the operational and financial performance of the Group, under a job description which clearly sets out these responsibilities.
A.3.1. As stated below, on appointment, the Chairman met the independence criteria set out under the Code.
A.4.1 Tony Ward is appointed as the Senior Independent NED and is available to shareholders to discuss strategy or governance issues or should there be matters of concern that have not, or cannot, be addressed through the normal channels.
A.4.2 The Chairman meets with the NEDs without the Executive Directors being present, either before or after each Board meeting and this is formally minuted, whilst the Senior Independent Non Executive Director (‘SID’) holds annual discussions with the other NEDs without the Chairman being present and also with the Executives, in order to appraise the Chairman’s performance.
A.4.3 Each Director ensures that if he/she has any concerns which cannot be resolved, about the Company or a proposed action, such concerns are recorded in the minutes, whilst upon resignation, Non-Executives are invited to provide a written statement to the Chairman for circulation to the Board, of any concerns.
B. Effectiveness The Board comprises a balance of Executive and NEDs who bring a wide range of skills,
experience and knowledge to its deliberations. The NEDs fulfil a vital role in corporate accountability and have a particular responsibility to ensure that the strategies proposed by the Executive Directors are fully discussed and critically examined, not only in the best long term interests of shareholders, but also to take proper account of the interests of customers, employees and other stakeholders. The NEDs are all experienced and influential individuals and through their mix of skills and business experience they contribute significantly to the effective functioning of the Board and its Committees, ensuring that matters are fully debated and that no one individual or small group dominates the decision making process. Directors have a wide range of experience of various industry sectors relevant to the Group’s business and each member brings independent judgement to bear in the interests of the Company on issues of strategy, performance, resources and standards of conduct. The Board is of sufficient size to match business needs and members have an appropriate and varied range of skills, vital to the success of the Group. The composition and performance of the Board and each Committee is regularly evaluated so as to ensure that the balance of skills, expected
A.2 Division of responsibilities
A.4 Non Executive Directors (‘NEDs’)
B.1 Composition of the Board

39SThree plc Report & financial statements 2011
time commitment, knowledge and experience is right and the Directors can thereby ensure that the balance reflects the changing needs of the Group’s business, being refreshed as necessary. Most importantly of all, Board members feel a strong cultural affinity with the Group, engaging fully as a committed team and in a wide variety of activities with our various employees around the globe, whether it be an office visit or the annual sales conference.
B.1.1 Excluding the Chairman, the other NEDs have been determined by the Board throughout the year as being independent in character and judgement with no relationships or circumstances which are likely to affect, or could appear to affect, each Director’s judgement.
B.1.2 The Board comprises a Non Executive Chairman, who is not classed as independent because of his position but who met the independence criteria set out in the Code on appointment, three Executive Directors and four independent NEDs, thus complying with the Code, which requires at least half of the Board to consist of independent NEDs.
Appointments to the Board are the responsibility of the full Board, upon the recommendation of the Nomination Committee and after appropriate external consultation, bearing in mind the Board’s existing balance of skills and experience, the specific role needs identified, and with due regard for diversity, including gender. Succession planning aspects are regularly reviewed by the Committee, in order to ensure an orderly progression/refreshment of senior management/Board members and maintain an appropriate balance of skills, experience and diversity both within the Company and on the Board. See also the Chairman’s Trading & Governance Overview section earlier in the Annual Report.
B.2.1/2 Under the direction of the Nomination Committee, each formal selection process is conducted, using external advisors, consisting of a series of interview stages, involving Directors and other senior Executives, against the background of a specific role definition and objective criteria. Details of the composition, work and responsibilities of this Committee are set out under the relevant section below.
B.2.3 NEDs are initially appointed for three year terms, with all Directors being subject to annual re-election. The Company’s Articles of Association also deals with removal, appointment, election/re-election of Directors.
B.3.1 The Nomination Committee last initiated a search for a new Director in late 2009, preparing a detailed job specification and setting out an assessment of the time commitment expected, in that instance for Clay Brendish. All potential Director candidates are required to disclose any significant outside commitments prior to appointment and must undertake that they have sufficient time to meet these, in addition to Company business, particularly in the event of a crisis.
B.3.2 Upon joining, each NED receives a formal appointment letter which identifies their responsibilities and expected minimum time commitment, being typically two days per month. These letters are available for inspection at the Company’s registered office.
At scheduled Board and Committee meetings, Directors receive detailed reports/presentations from management on the performance of the Group or specific areas of focus/responsibility. NEDs attend the Group’s annual conference in order to join senior management from each geographic area to discuss current initiatives, whilst Board meetings are also regularly held at office locations globally, in order to allow Directors to meet local managers and improve their understanding of the business. Directors are briefed regarding their responsibilities and on other relevant regulatory, legal, governance or accounting matters. Regular updates are provided on all relevant topics, as required
B.2 Appointments to the Board
B.3 Commitment
B.4 Development
CORPORATE gOvERNANCE REPORT

SThree plc40 Report & financial statements 2011
and Directors are encouraged to attend external seminars on areas of relevance to their role in order to facilitate their professional development. These measures help to ensure that the Directors continue to develop their knowledge of the Group’s business and get to know its senior management, as well as being aware of their general responsibilities. In addition, the Board encourages Executive Directors to accept external appointments in order to broaden their experience, although currently no such positions are held.
B.4.1 An induction programme is tailored for new appointments to ensure that it is appropriate for their role, dependent on previous experience. Directors and other senior Executives attend analysts’ briefing sessions and major shareholders may, upon appropriate request, meet new NEDs.
B.4.2 As part of the annual Board evaluation process, the Chairman assesses and agrees any training and development needs in respect of individual Directors, including on environmental, social and governance (‘ESG’) matters, if appropriate. Subject areas identified to be addressed during the 2011 evaluation exercise include risk management, brand, regional and sectoral knowledge.
Board and Committee meeting papers are circulated well in advance of the relevant meeting and where a Director is unable to attend he/she is provided with a copy of the papers and has the opportunity to comment on the matters under discussion. Minutes of all Committee meetings are circulated to all the Directors, irrespective of Committee membership. The Group Company Secretary is responsible for ensuring good information flows between the Board/Committees and senior individuals/NEDs, as well as assisting in other areas and has primary responsibility for advising the Board, via the Chairman, on all governance matters.
B.5.1 Directors are entitled to obtain independent professional advice, at the Company’s expense, in the performance of their duties as Directors, although no such advice was sought during the year. All Committees are serviced by the Group Company Secretary’s team and are appropriately resourced.
B.5.2 Directors have access to the advice and services of the Group Company Secretary, who is responsible to the Board for ensuring that its procedures are complied with and to assist in arranging any additional information as required. The appointment and removal of the Group Company Secretary is a matter reserved for the Board as a whole and the last appointment was made in October 2006.
B.6.1/2 As recommended by the Code, the Board, for the first time, commissioned Lintstock Ltd, an independent third party, to undertake its annual Board/Committee evaluation exercise. Lintstock Ltd have no other relationship with the Group.
The first stage of this review involved agreeing with Lintstock Ltd the context for the evaluation and tailoring each questionnaire. Respondents were then requested to complete these online, addressing the performance of the Board, Committees, Chairman and individuals, with anonymity of respondents ensured, in order to promote an open and frank exchange of views. Questionnaires addressed the following issues:
• Board composition, expertise and dynamics; • Board support, time management and Board Committees; • Strategic, operational and risk oversight; • Succession planning and human resource management; and • Priorities for change.
The results of this analysis were issued in January 2012 and recommendations are to be implemented as the year progresses, with regular ‘one on one’ sessions also planned. Subsequent evaluations will build upon the lessons gained in this and ongoing annual
B.5 Information and Support
B.6 Board Evaluation
CORPORATE gOvERNANCE REPORT

41SThree plc Report & financial statements 2011
evaluations, to ensure that recommendations resulting from each review are followed up and that year on year progress is measured. As part of this process, the Chairman also discusses the individual performance of Directors, in consultation with other Directors.
The evaluation process is considered to be both formal and rigorous and assessments concluded that, overall and individually, the performance of the Board, each Committee and each Director was and is effective and that Directors demonstrate full commitment in their respective roles. See also the Chairman’s Trading & Governance Overview section earlier in the Annual Report.
B.6.3 The SID holds annual discussions with the other NEDs without the Chairman being present and also with the Executives, in order to appraise the Chairman’s performance.
B.7.1 Although the Company’s Articles of Association permit Directors to remain in office for up to three years before Annual General Meeting (‘AGM’) re-election, all Directors will retire and seek re-election annually, as recommended by the Code.
B.7.2 Reference to performance and commitment of Directors, as well as an explanation of the reason why each retiring Director should be re-elected, are all provided in the Notice of AGM. The Company also complies fully with the Code in respect of its AGM voting arrangements and RNS disclosure.
C. Accountability The Overview, Chairman’s and other officers’ sections of this Annual Report, taken
together, provide information relating to the Group’s activities, its business and strategy and principal risks and uncertainties faced by the business, including analysis using financial and other KPIs where necessary. These, together with the Directors’ Remuneration Report, Corporate Governance and Corporate Responsibility Reports, provide an overview of the Group, including environmental and employee matters and gives an indication of future developments in the Group’s business. This provides a balanced and understandable assessment of the Group’s position and prospects, in accordance with the Code.
C.1.1 The Directors’ responsibility for preparing the accounts and the statement by the auditors about their reporting responsibilities are set out in the Directors’ Report and Independent Auditors’ Report, respectively.
C.1.2 An explanation of the business model and the strategy for delivering the objectives of the Group is included as part of the Overview, Chairman’s and other officers’ sections of this Annual Report.
C.1.3 A ‘going concern’ statement is included in the Directors’ report.
C.2.1 The Board’s statement regarding its review of the effectiveness of the Group’s risk management and internal control systems is set out below and is reviewed annually.
Details of the composition, work and responsibilities of this Committee are set out under the relevant section below.
B.7 Re-election
C.1 Financial and Business Reporting
C.2 Risk Management and Internal Control
C.3 Audit Committee and Auditors
CORPORATE gOvERNANCE REPORT

SThree plc42 Report & financial statements 2011
D. Remuneration The Directors’ Remuneration Report sets out in full, the policies and practices which
demonstrate the Company’s implementation of this Code principle and provisions.
Details of the composition, work and responsibilities of this Committee are set out under the relevant section below and in the Directors’ Remuneration report.
E. Relations with Shareholders Communications with shareholders are given a high priority. The Company produces
Annual and Interim Reports for shareholders and the Company’s website contains up-to-date information on the Group’s activities, investor presentations and published financial results. Shareholders can also subscribe for e-mail alerts of important announcements made. There are regular meetings with institutional shareholders, whilst ensuring that price sensitive information is released at the same time to all, in accordance with the requirements of the UK Listing Authority. Presentations are made after the Company has published its full and half yearly results and there is also regular dialogue on specific issues, such as the appointment of a new Chairman, the tracker share model, introduction of and changes to the LTIP and on other key remuneration issues.
E.1.1 The Chairman, Senior Independent and other NEDs are available to shareholders to discuss governance or strategy issues or should there be matters of concern that have not, or cannot, be addressed through the Executive Directors. During the year, both the Chairman and SID conversed with shareholders, with appropriate feedback being provided to the Board.
E.1.2 Views of analysts, brokers and institutional investors are sought on a non-attributed basis via periodic sentiment surveys and these, as well as regular analyst and broker publications, are circulated to all Directors to ensure that they develop a full understanding of the views of major shareholders. Any issues or concerns can be raised at the Board and Directors routinely receive regular reports on share price, trading activity and sector updates.
The Board views the AGM as a valuable opportunity to communicate with private and institutional investors and welcomes participation.
E.2.1 The Company proposes a separate resolution on each substantially separate issue and the proxy appointment forms for each resolution provide shareholders with the option to direct their proxy to vote either for or against the resolution or to withhold their vote.
E.2.2 The Company’s registrars ensure that all valid proxy appointments received for the AGM are properly recorded and counted and a schedule of proxy votes cast is made available to all shareholders attending the meeting. There is also full disclosure of the voting result via RNS and on the Company’s website as soon as practicable after the AGM.
E.2.3 All Board members are encouraged to attend the AGM and the Chairmen of the Audit, Nomination and Remuneration Committees are available to answer questions.
E.2.4 The Notice of AGM is posted at least twenty working days prior to the date of the meeting and the Company’s website contains copies of all Notices issued.
D.1 Level and Components
D.2 Procedure
E.1 Dialogue with Shareholders
E.2 Constructive use of AGM
CORPORATE gOvERNANCE REPORT

43SThree plc Report & financial statements 2011
CORPORATE gOvERNANCE REPORT
Board and Committee Composition and Attendance (in accordance with A.1.2 of the Code)As stated, the Board has established various Committees, each with clearly defined terms of reference, procedures and powers. In December 2011, the Committees’ terms of reference were updated, in the light of the Code and ICSA best practice guidelines and approved by the Board. Copies are available on request
from the Group Company Secretary or downloadable from www.sthree.com.
In addition to the scheduled Board meetings held during the year, the Board met for an off site strategy session, for the AGM and annual conference. The number of Board/Committee meetings held and attendance thereat is set out in the table below.
Required attendance as a formal member Actual attendanceDirectors Board Audit Remuneration Nomination Board Audit Remuneration NominationRussell Clements 10 N/A N/A N/A 10 4 5 2Gary Elden 10 N/A N/A N/A 10 N/A N/A N/AAlex Smith 10 N/A N/A N/A 10 4 N/A N/AClay Brendish 10 N/A N/A 2 9 N/A 1 2Paul Bowtell 10 4 N/A 2 10 4 N/A 2Alicja Lesniak 10 4 5 2 10 4 5 1Tony Ward 10 N/A 5 2 10 N/A 5 2Nadhim Zahawi 10 4 5 N/A 8 4 5 1
Directors were unable to attend meetings due to one unavoidable other business commitment (Clay Brendish) or two unavoidable parliamentary commitments (Nadhim Zahawi), although full Board packs were distributed and separate discussions held on matters of relevance.
Audit Committee (in accordance with C.3.1 to C.3.7 of the Code)The Audit Committee consists of Paul Bowtell (Chairman), Alicja Lesniak and Nadhim Zahawi, and accordingly comprises at least three independent NEDs as required by the Code. The Chief Executive Officer, the Chief Financial Officer, the Group Company Secretary and the external auditors attend all meetings at the request of the Committee. Paul Bowtell is a Chartered Accountant and is considered by the Board to have recent and relevant financial experience, given his current role as Chief Financial Officer of Gala Coral Group.
The Committee’s principal responsibilities are set out in its terms of reference and, broadly, are: to monitor the integrity of the financial statements of the Company and any formal announcements relating to the Company’s financial performance; reviewing any significant financial
reporting issues and judgements contained within them; to review the Company’s internal financial controls, internal control and risk management systems and reporting thereon, including advising on risk appetite, tolerance and strategy, as well as risk exposures and assessment; advising on proposed strategic transactions, including conducting due diligence appraisals and focussing on risk aspects; assessing material breaches of risk limits; advising on risk performance and remuneration aspects; reviewing arrangements by which Group employees may raise concerns about possible improprieties in financial reporting or other such matters and ensuring appropriate follow up; assessing procedures for detecting fraud or preventing bribery; overseeing the remit of the risk management function; to monitor and review the effectiveness of the Company’s internal audit function; to make recommendations to the Board, for it to put to the shareholders for their approval in general meeting, in relation to the appointment, re-appointment and removal of the external auditor and to approve the remuneration and terms of engagement of the external auditor; to annually review and monitor the external

SThree plc44 Report & financial statements 2011
CORPORATE gOvERNANCE REPORT
auditor’s independence and objectivity and the effectiveness of the audit process, taking into consideration relevant UK professional and regulatory requirements; to develop and implement policy on the engagement of the external auditor to supply non-audit services, taking into account relevant ethical and professional guidance regarding the provision of non-audit services by the external audit firm, reporting to the Board, identifying any matters in respect of which it considers that action or improvement is needed and making recommendations as to the steps to be taken and generally to identify and report on any business areas where action or improvement are needed and recommend actions to be taken.
The Committee considers matters relating to the recommendation for appointment, re-appointment, remuneration and terms of engagement of the Company’s external auditor, PricewaterhouseCoopers LLP (’PwC’). Both the Committee and the external auditors themselves have safeguards in place to ensure that objectivity and independence is maintained, including the periodic rotation of the audit partner. In addition to the annual appointment of the external auditors by the shareholders, the Committee regularly reviews their independence taking into consideration relevant UK professional and regulatory requirements. The Committee reviews performance and fees charged, including compensation structure and meets with the external auditor at least once a year without management present.
The Committee considers that the relationship with the external auditors is working well and remains satisfied with their effectiveness. Accordingly, to date, it has not considered it necessary to require PwC to re-tender for the audit work. The external auditors are required to rotate audit partners responsible for the Group audit every five years and the current lead audit partner has been in place for three years. There are no contractual obligations
restricting the Group’s choice of external auditor.
The Committee has set clear guidelines on non audit work which may or may not be undertaken by the external auditor and closely monitors this. Policy provides that non-audit work may be carried out by the external auditor only where that work does not impair independence or objectivity and where the Committee believes that it is in the Group’s best interests to make use of the external auditor’s knowledge of the business, skills and experience. Such work has included detailed local statutory audits or services required due to legislation, as well as assurance work and other specialist services where no internal resource is available. The Committee continuously monitors the quality and volume of this work, the level of fees incurred, as well as safeguards, in order to assess whether to use other accounting firms (or appropriately qualified organisations) and, as a result, last year appointed BDO LLP to provide the Group’s general tax advice.
In accordance with APB Ethical Standards and FRC guidance, our policy clearly specifies: (i) which types of non audit work are excluded, for example, book-keeping; design, implementation and operation of systems; actuarial and internal audit/control functions; executive management functions and legal or other financial services; (ii) the types of work for which external auditors can be engaged without referral to the Committee, i.e. provided such services are specifically listed within the policy and fall below £50,000; and (iii) for which types of work a referral to the Committee is necessary, i.e. non listed services or those listed within the policy which are above £50,000.
Details of fees paid to the external auditors for both audit and non audit work are given in the Notes to the financial statements. The Committee has fully evaluated this work against its policy and remains comfortable that it is appropriate and the fees justified. For 2011, much

45SThree plc Report & financial statements 2011
CORPORATE gOvERNANCE REPORT
of this work related to specific projects, including the continuation of the Group’s corporate simplification project, for which comparative quotes were obtained, as well as tax restructuring, however the level of non audit fees was significantly reduced compared to the prior year and was also less than the total audit fees incurred in the year.
Following its creation, the Group has further enhanced its internal audit function, which is now at an appropriate size and mix of skills for the business and the Committee firmly believes that this function remains effective and continues to add significant value.
The Group has in place a dedicated independent whistle blowing hotline, as part of the arrangements set up and monitored by the Committee, so that employees are able to report any matters of concern, where this does not conflict with local laws or customs.
Nomination Committee (in accordance with B.2.1, B.2.2 and B.2.4 of the Code)The Nomination Committee consists of Clay Brendish (Chairman), Tony Ward, Alicja Lesniak and Paul Bowtell and accordingly comprises a majority of independent NEDs as required by the Code.
The Nomination Committee’s terms of reference are, broadly: to regularly review the structure, size and composition (including the skills, knowledge and experience and diversity) of the Board, make recommendations with regard to any changes and to review and prepare relevant job descriptions for new appointees. The Committee also considers future succession planning for Board and other senior Executive roles, reviewing leadership and other role needs, bearing in mind the balance of skills, knowledge, experience and diversity already on the Board, so as to maintain an appropriate balance. The
Committee engages external search consultants with respect to both Executive and Non-Executive Board appointments, and considers applicants from all backgrounds, as was the case for the most recent appointment, being Clay Brendish. In this, and in other cases, the Committee first conducted an evaluation of the balance of skills, knowledge and experience on the Board and, in the light of this, prepared an appropriate description of the role and capabilities required for the particular appointment, with the successful appointee being selected from candidates proposed by external advisors and chosen entirely on merit.
In terms of succession planning, the Group has continued its ‘Top 60’ leadership initiative, bringing together key managers from around the globe at regular sessions, in order to identify and develop the most talented individuals for executive positions. As part of this initiative, Egon Zehnder International carried out detailed evaluations of senior individuals below Board level, with succession plans then prepared for each. See also the Chairman’s Trading & Governance Overview section earlier in the Annual Report.
Remuneration Committee (in accordance with D.2.1 and D.2.2 of the Code)The Remuneration Committee is responsible for making recommendations to the Board on Group policy for the remuneration of the Chairman, the Executive Directors, the Group Company Secretary and certain key senior management posts and for the determination, within agreed terms of reference, of additional benefits for each of the Executive Directors, including pension rights and any compensation for loss of office. The Committee is also responsible for the implementation and operation of he Group’s employee share incentive arrangements. The Committee comprises

SThree plc46 Report & financial statements 2011
CORPORATE gOvERNANCE REPORT
at least three independent NEDs as required by the Code. Full information on the composition, role and operation of the Remuneration Committee and remuneration details are disclosed in the Directors’ Remuneration Report.
Effectiveness of the Company’s risk management and internal control systems (in accordance with C.2.1 of the Code)The Board has overall responsibility for monitoring the effectiveness of the Company’s risk management and internal control systems in order to safeguard shareholders’ investments and the Group’s assets. Executive Directors and senior management are responsible for the implementation and maintenance of the systems, which are subject to periodic, and at least annual, review by the Board, via the Audit Committee where appropriate. As explained above, in response to business requirements, the Group has also created an internal audit function in order to facilitate this process.
The Board, via the Audit Committee, monitors the continuous process by which critical risks to the business are identified, evaluated and managed and this process explicitly includes the risks and opportunities to enhance value arising from ESG matters. The process is consistent with the Turnbull Guidance on Internal Control and has been in operation for the period under review and up to the date of approval of this Annual Report.
The Board assesses the Company’s risk management and internal control systems, including material controls such as financial, operational and compliance controls and enterprise risk management (‘ERM’) systems. These are designed to manage, rather than eliminate, the risk of failure to achieve the Group’s objectives, and can only provide reasonable, not absolute, assurance against material mis-statement or loss. The Board considers, in assessing what constitutes reasonable accuracy, the materiality of financial and
nonfinancial risks and the relationship between the cost, or benefit, resulting from the risk management or internal control systems.
In order to manage the business effectively, the Board continually assesses actual results compared with the budgeted and forecast performance of the Group, as well as other key performance indicators, some of which are detailed in the Overview, Business Model & Strategy section of this Annual Report.
Assessment of risk and Enterprise Risk Management (‘ERM’) frameworkThe Board, through the Audit Committee, has overall responsibility for risk management activities and implementing policies to ensure that all risks are evaluated, measured and kept under review by way of appropriate KPIs and this forms the basis for the Group’s ERM framework. Under this framework, all Executive, Regional and Country Directors, key support functions and other relevant parties take ownership of their related risks, creating specific sub-Group risk registers, with risks being categorised according to probability and financial impact and measured according to strictly defined criteria, as set out under the Board approved risk management policy. More significant risks are distilled to form the Group’s key risk register, which is closely monitored by the Committee and risks include, amongst others, those relevant to the processes for financial reporting and the preparation of consolidated accounts, with appropriate mitigation measures.
As part of these processes, regular strategy and risk leadership workshops are held, bringing together Executive Directors, Regional MDs, Country Directors and key function heads, with ERM specialists in attendance, underpinned as follows:
• Country Directors own localised risk registers, with regular presentations

47SThree plc Report & financial statements 2011
CORPORATE gOvERNANCE REPORT
made to the Board which include progress on risk mitigation, with underlying reviews of risks/integrity;
• Audit Committee meetings may include presentations by MDs/Country Directors, etc, on their approach to business risk management and tracking of improvement areas;
• A Board approved risk management policy and procedure document are in place, communicated Group-wide;
• Group risk appetite has been defined and formalised, with strategic and localised measures agreed, monitored via appropriate KPIs, with remuneration also being subject to specific risk targets;
• Job descriptions include reference to risk responsibilities.
The Group’s ERM arrangements have been designed to meet, as closely as possible, the appropriate BSI standard (BS 3100) on risk management processes. Consequently, the Group has continued to reap the benefits of its enhanced ERM framework through improved strategic and individual region/sector focus on key risk areas, with greater clarity on risk ownership, identification of opportunities as well as threats, whilst also facilitating better monitoring of progress, mitigation measures and ensuring appropriate forward looking assessment, including, where relevant, ESG matters.
Association of British Insurers (‘ABI’) guidelines on responsible investment disclosuresIn respect of the Company’s compliance with the ABI guidelines on responsible investment disclosures, the Board confirms the following, in relation to its responsibilities, policies and procedures, with appropriate KPIs detailed within the Overview, Business Model & Strategy section of this Annual Report:
• As part of its ERM procedures, the Board takes account of the significance
of ESG matters to the business of the Company. Adherence to these procedures and disclosure of relevant issues is monitored by the internal audit function and also reviewed by external ERM specialists, as part of the overall risk management framework.
• The Board has reviewed but has not identified any significant ESG risks to the Company’s short and long-term value or opportunities to enhance value.
• The Board has received adequate information to make this assessment by way of its ERM procedures and, where necessary, has taken account of ESG matters in the training of Directors as well as ensuring inclusion in bonus structures.
• The Board has ensured that the Company has in place effective systems for managing and mitigating significant risks. Where relevant, these incorporate performance management systems and appropriate remuneration incentives.
• There are no ESG-related risks and opportunities that may significantly affect the Company’s short and long term value or the future of the business.
Going concernThe Board has reviewed the Group’s budget for the financial year ending 25 November 2012 and medium term financial projections, for the next three years. After taking account of the cash flow projections, including proposed capital expenditure and considering the availability of borrowing facilities, the Board has concluded that it is appropriate to prepare the accounts of both the Group and the Company on the going concern basis.

SThree plc48 Report & financial statements 2011
Corporate and Environmental ResponsibilityThe Board recognises that the Group has a responsibility to act ethically in relation to the physical and social environment in which it operates, and that failure to do so could adversely impact on the Group’s long and short term value as a result of financial penalty and/or loss of stakeholder support. It takes such responsibilities seriously, paying due regard to international and local laws in all its dealings. Further details are disclosed in the Corporate Responsibility Report.
Share capitalInformation on the Company’s share capital is set out within the Directors’ Report.
Steve Hornbuckle Group Company Secretary 27 January 2012
CORPORATE gOvERNANCE REPORT

49SThree plc Report & financial statements 2011
Russell ClementsChief Executive Officer
CorPorAtE rEsPoNsiBility rEPortfor the year ended 27 November 2011
IntroductionAs we continue to grow our global business and expand into new markets, we recognise the need for a more strategic approach to Corporate Responsibility (‘CR’), which starts from the concept of ‘corporate citizenship.’ That is, looking at the core purpose of our business and the knowledge and skills of our people, in balance with social and environmental needs to which we are well placed to respond.
At a time when world economies are struggling and unemployment levels are rising, our role and expertise in staffing solutions is becoming ever more critical. Through recognising talent and matching skilled individuals to unique business needs, we support economic sustainability and growth. This knowledge provides a valuable proposition to our clients, candidates and to those taking part in our community engagement projects.
As a professional services company focused on specialist recruitment everything we do is about people. This too lies at the heart of our approach to CR.
Our CR journeyThis year we embarked on a transition to build a more business-focused and strategic CR programme, and are committed to defining KPIs and targets in 2012.
We are proud of past achievements in fundraising, and this will continue as we progress our efforts on skills-based volunteering. By sharing core skills through volunteering we can increase social value while providing opportunities for our employees that respond to emerging business needs. For example, business benefits such as employee engagement, cross team working, leadership and skills development.
Global CR vision and strandsOur vision for CR is aligned to the Company’s organising thought of ‘recognising and developing talent’. Through CR we recognise and develop the talent of four core groups: young
people; job seekers; community organisations; and our employees.
We have continued to concentrate on three strands: Community, Environment and Workplace.
CR PrinciplesWe are evolving our CR strategy around the following guiding principles:
• Core skills and expertise – Projects that utilise the best of SThree and provide opportunities for learning;
• ‘Glocal’ – Global vision with local delivery;
•Employee engagement – Initiatives that support engagement and team building;
•Partnership approach – Working closely with community organisations to respond to real needs and engaging with clients and suppliers to leverage impact;
•Supports the values – Projects that reinforce the SThree values of: Respect; Energy; Rapport; and Reward; and
•Represents SThree – A CR programme that fits the business and of which employees and other stakeholders can be proud.
CR highlightsWe are proud of our achievements in 2011, which include the following:
• Fundraising – Over £203,000 donated during our three year partnership with SOS Children’s Villages, which has gone to projects in Africa, China, Haiti, India and Syria, with nearly £90,000 donated to SOS Children this year;
• Volunteering – 65 employees, roughly 3% of our workforce, took part in pilot projects for our new formal skills-based employer supported scheme, providing approximately 320 hours of support, impacting 193 beneficiaries. We continued to work closely with Time & Talents for Westminster and commenced new relationships with

SThree plc50 Report & financial statements 2011
CORPORATE RESPONSIBILITy REPORT
City Action and East London Business Alliance (ELBA) to support our volunteering in London;
• Six University scholarships funded, four at the University of Birmingham and two at the University of Manchester;
• 37 out of 43 offices in the UK, Ireland and Europe recycling;
• 94% of employees said they are proud to work for SThree and 90% would recommend SThree as a great place to work;
• Member of FTSE4Good for over three years (since September 2008).
CommunityBuilding on our previous work with young people who are NEET (not in education, employment or training), in 2011 we made ‘Employability and Raising Aspiration’ a central focus for our community engagement. We believe this fits the so called ‘sweet spot’ in terms of what we can best offer as a business in responding to priority community needs.
Due to a high level of employee-led initiative, projects across the business have not always been fully captured through a central reporting system. Moving forward we are looking to better coordinate activities and replicate the best projects across our global offices.
EnvironmentWe are increasingly aware of the role that business must play in the global challenge of climate change and are committed to our part in that process.
This year we commissioned Global Action Plan, the UK’s leading environmental behaviour change charity, to measure our UK carbon footprint and their analysis showed that this was 2,873 tonnes of CO2, between December 2009 and the end of November 2010, including office utilities, paper use and company related car travel (regrettably we could not include air and train travel, or waste as insufficient data was available for the period).
CO2 emissions for our UK utilities have reduced slightly over the last three years, as follows.
UK utilities 2007-2008 2008-2009 2009-2010Footprint (gas, electricity & water) 2,348 2,309 2,293
We understand that in order to improve future carbon footprint exercises and develop our environmental management we need to first improve data collection procedures and this will be key focus area for us in 2012.
For the last few years we have offset our UK carbon footprint. This year we decided
to offset half of the footprint volume, re-investing the other half we would have spent on offsetting, on employee engagement initiatives that will help us reduce the intensity of our carbon footprint in the future.
To offset half the footprint, we invested in ClimateCare’s Mixed Portfolio which
150 people attended a sports event and family day in the Netherlands with sweepstake raffle

51SThree plc Report & financial statements 2011
includes a range of projects such as Gold Standard efficient cooking stoves in Ghana and Uganda.
We continue to investigate ways to make our operations more resource efficient and have initiated a programme to ensure that our IT usage is maximised, using low power consumption PCs, server virtualisation and video conferencing in all new offices. In addition our UK car fleet has decreased its average CO2 emissions from 184 g/km to 157 g/km, with a cap also imposed on the overseas car fleet.
Since 2006 we have recycled UK company mobile phones to benefit Aspire – supporting those with a spinal injury. We also ran a ‘Recycling Countdown’ of offices going ‘bin free’, with 37 recycling facilities set up across the UK, Ireland and Europe to recycle paper, cans, glass and plastic as well as printer cartridges. Only a few offices remain to go ‘bin free’ in 2012.
WorkplaceWe recognise the value and importance of our employees. Managing talent is an absolute priority for us – this is the very essence of what we do, and the promise we make. We are committed to the following and continually strive to create a workplace in which the following are our identifying characteristics:
• Recruitment – Applicants to our business are always assessed fairly and treated with respect at every stage of the hiring process;
• Training & development – We offer appropriate training to all our people in order to help them complete their daily work to the best of their abilities;
• Diversity & equality – We ensure that all areas of our business embrace diversity and offer fairness and equality of opportunity in every respect;
• Talent – We want to harness the full potential of all our people and we actively encourage and support those who demonstrate the right performance levels, behave in accordance with our values and who have the talent to progress;
• Reward – We recognise service, effort and achievement and reward personal success; and
• Engagement & communications – talking to our people and listening to what they have got to say is a priority. We actively seek opportunities to respond to their feedback. This is how we improve our business.
Governance and ethicsIn 2012 we plan to initiate a programme of ESG training throughout the business. Further information on governance matters is provided within the Chairman’s Statement and Corporate Governance report sections earlier.
Diversity, talent and leadershipThis year we established ‘Identity’, an initiative to increase awareness of the importance of women in leadership roles and also improve organisational capability.
An internal online community has been developed to address topics such as work-life balance, career progression, and role models. We have incorporated programmes and modules into team leader and management training to support gender diversity capability, and
CORPORATE RESPONSIBILITy REPORT
Students from Lambeth Academy had ‘A Capital Experience’ at Real Staffing, Soho, as part of a day organised by Career Academies UK
Natasha Clarke-Tidey, Director Of Strategic Capability, Executive champion for Identity

SThree plc52 Report & financial statements 2011
have run a series of workshops and set up a network of Identity champions across the business.
A key objective of the business is to attract, develop and retain talent to achieve our organic growth strategy. To support this, the Learning & Development department designed a management programme called ‘Momentum’ with a focus on ‘developing people’, which included the latest tools to assist managers in supporting and developing their teams in ‘real time’. This has had a positive impact across the business and enabled managers to increase engagement and performance within teams.
During the year we increased our commitment to leadership development, and ran a series of management development centres, attended by over 80 middle to senior managers. In response to listening to our people and their ideas on how they wanted to improve their working practices, we also implemented a learning strategy to support the application of both formal courses and flexible learning during day to day business life.
We continue to partner with an external business school where an initial cohort of 11 Directors attended a Business Leaders’ programme. An element of the programme provided attendees with the opportunity to work on Executive sponsored projects, so as to give a contextual platform for their development.
Values: Respect; Energy; Rapport; & Reward Building on our earlier work, continued marketing took place to raise awareness of the values, their importance and the associated behaviours. The campaign consisted of new office design and artwork, values newsletters, values and culture book for all employees, intranet articles and email campaigns.
Employees worldwide have attended workshops, with the values being
embedded into business processes, starting with the appraisal and promotion processes, with talent acquisition and the on-boarding of new employees to follow in 2012.
Our Rapport survey this year showed that 96% of employees feel that the SThree values are relevant to them.
Employee engagementA key priority for 2011 was to build upon our prior year launch of the SThree Rapport survey, with the response rate this year being 87%, up from the previous year’s 82%. The results of the survey were also highly encouraging; 79% of respondents felt that their managers had effectively responded to last year’s feedback, whilst 94% of respondents said that they were proud to work for SThree and 90% would recommend SThree as a great place to work.
In 2012, we have tasked ourselves with creating team and country action plans to build upon the strengths and areas for improvement identified in the survey results. We believe that this will enable us to focus on aspects that will have the most impact in our various locations. At a Group level, career development is a key priority for SThree to ensure we build and retain a strong talent pipeline. An example of us responding to this priority in 2011 was the set up of ‘My Career Portal’, a platform which has given people control over their internal profile and development plans and visibility on new opportunities globally.
Wellbeing and health & safetyHealth & safety training was provided as an e-learning interactive session for employees, with over 180 UK employees now having completed the training.
We also have a dedicated benefits specialist and look for ways to improve the SThree employee experience, for example our cycle scheme, whereby employees can receive the cost of purchasing a bicycle. To date 65 people have joined
CORPORATE RESPONSIBILITy REPORT
Values Artwork

53SThree plc Report & financial statements 2011
the scheme, with 30 new participants this year.
OutlookWe will continue to work towards a more KPI and target driven strategy, which will build on the above.
Russell Clements Chief Executive Officer 27 January 2012
CORPORATE RESPONSIBILITy REPORT

SThree plc54 Report & financial statements 2011
iNdEPENdENt Auditors’ rEPortfor the year ended 27 November 2011
iNdEPENdENt Auditors’ rEPort to tHE MEMBErs of stHrEE PlCWe have audited the financial statements of SThree plc for the year ended 27 November 2011 which comprise the Consolidated Income Statement, Consolidated Statement of Comprehensive Income, the Consolidated and Company Statements of Financial Position, the Consolidated and Company Statements of Changes in Equity, the Consolidated and Company Statements of Cash Flow and the related notes. The financial reporting framework that has been applied in their preparation is applicable law and International Financial Reporting Standards (IFRSs) as adopted by the European Union and, as regards the parent company financial statements, as applied in accordance with the provisions of the Companies Act 2006.
Respective responsibilities of directors and auditors As explained more fully in the Statement of Directors’ Responsibilities set out in the Directors’ Report, the directors are responsible for the preparation of the financial statements and for being satisfied that they give a true and fair view. Our responsibility is to audit and express an opinion on the financial statements in accordance with applicable law and International Standards on Auditing (UK and Ireland). Those standards require us to comply with the Auditing Practices Board’s Ethical Standards for Auditors.
This report, including the opinions, has been prepared for and only for the Company’s members as a body in accordance with Chapter 3 of Part 16 of the Companies Act 2006 and for no other purpose. We do not, in giving these opinions, accept or assume responsibility for any other purpose or to any other person to whom this report is shown or into whose hands it may come save where expressly agreed by our prior consent in writing.
Scope of the audit of the financial statements An audit involves obtaining evidence about the amounts and disclosures in the financial statements sufficient to give reasonable assurance that the financial statements are free from material misstatement, whether caused by fraud or error. This includes an assessment of: whether the accounting policies are appropriate to the Group’s and Company’s circumstances and have been consistently applied and adequately disclosed; the reasonableness of significant accounting estimates made by the directors; and the overall presentation of the financial statements. In addition, we read all the financial and non-financial information in the Report & Financial Statements to identify material inconsistencies with the audited financial statements. If we become aware of any apparent material misstatements or inconsistencies we consider the implications for our report.
Opinion on financial statementsIn our opinion:
• the financial statements give a true and fair view of the state of the Group’s and Company’s affairs as at 27 November 2011 and of the Group’s profit and the Group’s and Company’s cash flows for the year then ended;
• the Consolidated financial statements have been properly prepared in accordance with IFRSs as adopted by the European Union;
• the Company financial statements have been properly prepared in accordance with IFRSs as adopted by the European Union and as applied in accordance with the provisions of the Companies Act 2006; and
• the financial statements have been prepared in accordance with the requirements of the Companies Act 2006 and, as regards the Consolidated financial statements, Article 4 of the lAS Regulation.

55SThree plc Report & financial statements 2011
INdEPENdENT AudITORS’ REPORT
Opinion on other matters prescribed by the Companies Act 2006 In our opinion:
• the part of the Directors’ Remuneration Report to be audited has been properly prepared in accordance with the Companies Act 2006;
• the information given in the Directors’ Report for the financial year for which the financial statements are prepared is consistent with the financial statements; and
• the information given in the Corporate Governance Report set out earlier with respect to internal control and risk management systems and about share capital structures is consistent with the financial statements.
Matters on which we are required to report by exception We have nothing to report in respect of the following:
Under the Companies Act 2006 we are required to report to you if, in our opinion:
• adequate accounting records have not been kept by the Company, or returns adequate for our audit have not been received from branches not visited by us; or
• the Company financial statements and the part of the Directors’ Remuneration Report to be audited are not in agreement with the accounting records and returns; or
• certain disclosures of directors’ remuneration specified by law are not made; or
• we have not received all the information and explanations we require for our audit; or
• a corporate governance statement has not been prepared by the Company.
Under the Listing Rules we are required to review:
• the Directors’ statement, set out earlier, in relation to going concern;
• the parts of the Corporate Governance Report relating to the company’s compliance with the nine provisions of the UK Corporate Governance Code specified for our review; and
• certain elements of the report to shareholders by the Board on directors’ remuneration.
Julian Jenkins(Senior Statutory Auditor) for and on behalf of PricewaterhouseCoopers LLP
Chartered Accountants and Statutory Auditors
London
27 January 2012

SThree plc56 Report & financial statements 2011
27 November 28 November 2011 2010
Note £’000 £’000
Revenue 2 542,450 474,451Cost of sales (346,920) (308,083)
Gross profit 2 195,530 166,368Administrative expenses 3 (165,567) (145,152)
Operating profit 29,963 21,216Finance income 5 361 451Finance cost 5 (25) (18)
Profit before taxation 30,299 21,649Taxation 6 (10,034) (7,366)
Profit for the year 20,265 14,283
Profit for the year attributable to:Equity holders of the Company 20,265 14,216Non-controlling interest – 67
20,265 14,283
Earnings per share 8 pence pence
Basic 16.8 11.9Diluted 16.4 11.5
The accompanying notes on pages 62 to 95 are an integral part of these consolidated financial statements.
All amounts relate to continuing operations.
CoNsolidAtEd iNCoME stAtEMENtyear ended 27 November 2011

57SThree plc Report & financial statements 2011
*Restated Year ended Year ended 27 November 28 November 2011 2010
Note £’000 £’000
Profit for the year 20,265 14,283Other comprehensive income:Exchange differences on retranslation of foreign operations 103 (3,603)
Other comprehensive income for the year (net of tax) 103 (3,603)
Total comprehensive income for the year 20,368 10,680
Total comprehensive income attributable to:Owners of the parent 20,368 10,539Non-controlling interest – 141
20,368 10,680
* An explanation of the restatement is provided in Note 1 under basis of preparation.
The accompanying notes on pages 62 to 95 are an integral part of these consolidated financial statements.
CoNsolidAtEd stAtEMENt of CoMPrEHENsivE iNCoMEyear ended 27 November 2011

SThree plc58 Report & financial statements 2011
Consolidated Company 27 November 28 November 27 November 28 November 2011 2010 2011 2010 Note £’000 £’000 £’000 £’000
ASSETSNon-current assetsProperty, plant and equipment 9 5,263 5,447 – –Intangible assets 10 8,548 10,161 – –Investments in subsidiaries 11 – – 247,002 245,652Deferred tax assets 18 6,395 8,670 199 1,300
20,206 24,278 247,201 246,952
Current assetsTrade and other receivables 12 111,093 97,935 8,346 157Cash and cash equivalents 22 55,605 51,718 – –Assets classified as held-to-maturity 13 – 3,500 – –
166,698 153,153 8,346 157
Total assets 186,904 177,431 255,547 247,109
EqUITY AND LIABILITIESEquity attributable to the owners of the parentShare capital 19 1,230 1,218 1,230 1,218Share premium 2,925 2,925 2,925 2,925Other reserves (8,087) (282) (6,862) 1,046Retained earnings 86,399 78,057 232,621 174,472
Total equity 82,467 81,918 229,914 179,661
Non-current liabilitiesProvisions for liabilities and charges 17 1,678 1,354 – –
1,678 1,354 – –
Current liabilitiesProvisions for liabilities and charges 17 4,894 4,237 – –Trade and other payables 15 95,561 86,150 1,883 67,003Financial liabilities 16,22 – – 23,750 445Current tax liabilities 14 2,304 3,772 – –
102,759 94,159 25,633 67,448
Total liabilities 104,437 95,513 25,633 67,448
Total equity and liabilities 186,904 177,431 255,547 247,109
The accompanying notes on pages 62 to 95 are an integral part of these financial statements.
These financial statements were approved by the Board of Directors on 27 January 2012.On behalf of the Board of Directors.
Alex SmithChief Financial Officer
Registered number 3805979
stAtEMENts of fiNANCiAl PositioNAs at 27 November 2011

59S
Thre
e pl
cR
epor
t & fi
nanc
ial s
tate
men
ts 2
011
A
ttri
but
able
Cap
ital
C
urre
ncy
to
ow
ners
N
on-
Sha
re
Sha
re
red
emp
tio
n C
apit
al
Trea
sury
tr
ansl
atio
n R
etai
ned
o
f th
e co
ntro
lling
To
tal
N
ote
ca
pit
al
pre
miu
m
rese
rve
rese
rve
shar
es
rese
rve
earn
ing
s p
aren
t in
tere
st
equi
ty
£’
000
£’00
0 £’
000
£’00
0 £’
000
£’00
0 £’
000
£’00
0 £’
000
£’00
0
Bal
ance
at
29 N
ove
mb
er 2
009
1,
218
2,92
5 16
8 87
8 –
2,41
6 72
,562
80
,167
4,
650
84,8
17
Pro
fit fo
r th
e ye
ar e
nded
28
Nov
embe
r 20
10
–
– –
– –
– 14
,216
14
,216
67
14
,283
Oth
er c
ompr
ehen
sive
inco
me
–
– –
– –
(3,7
44)
– (3
,744
) 14
1 (3
,603
)
Tota
l com
preh
ensi
ve in
com
e fo
r th
e ye
ar (r
esta
ted* )
–
– –
– –
(3,7
44)
14,2
16
10,4
72
208
10,6
80D
ivid
ends
pai
d to
equ
ity h
olde
rs
7 –
– –
– –
– (1
4,36
9)
(14,
369)
–
(14,
369)
Div
iden
ds p
aid
to n
on-c
ontr
ollin
g in
tere
st
–
– –
– –
– –
– (9
70)
(970
)E
mpl
oyee
sha
re a
war
ds
–
– –
– –
– 1,
347
1,34
7 –
1,34
7C
urre
nt ta
x on
em
ploy
ee s
hare
opt
ions
6
– –
– –
– –
155
155
– 15
5D
efer
red
tax
on e
mpl
oyee
sha
re o
ptio
ns
6 –
– –
– –
– 25
8 25
8 –
258
Loss
on
disp
osal
of n
on-c
ontr
ollin
g in
tere
st n
et a
sset
s
– –
– –
– –
(52)
(5
2)
52
–Tr
ansf
er to
rese
rves
non
con
trol
ling
inte
rest
net
ass
ets
–
– –
– –
– 3,
940
3,94
0 (3
,940
) –
Tota
l mov
emen
ts in
equ
ity
–
– –
– –
(3,7
44)
5,49
5 1,
751
(4,6
50)
(2,8
99)
Bal
ance
at
28 N
ove
mb
er 2
010
1,
218
2,92
5 16
8 87
8 –
(1,3
28)
78,0
57
81,9
18
– 81
,918
Pro
fit fo
r th
e ye
ar e
nded
27
Nov
embe
r 20
11
–
– –
– –
– 20
,265
20
,265
–
20,2
65O
ther
com
preh
ensi
ve in
com
e
– –
– –
– 10
3 –
103
– 10
3
Tota
l com
preh
ensi
ve in
com
e fo
r th
e ye
ar
–
– –
– –
103
20,2
65
20,3
68
– 20
,368
Div
iden
ds p
aid
to e
quity
hol
ders
7
– –
– –
– –
(14,
518)
(1
4,51
8)
– (1
4,51
8)D
istr
ibut
ions
to tr
acke
r sh
are
hold
ers
–
– –
– –
– (6
79)
(679
) –
(679
)Is
sue
of s
hare
cap
ital
19
12
– –
– –
– –
12
– 12
Pur
chas
e of
ow
n sh
ares
19
–
– –
– (7
,908
) –
– (7
,908
) –
(7,9
08)
Em
ploy
ee s
hare
aw
ards
4
– –
– –
– –
2,42
6 2,
426
– 2,
426
Cur
rent
tax
on e
mpl
oyee
sha
re o
ptio
ns
6 –
– –
– –
– 1,
776
1,77
6 –
1,77
6D
efer
red
tax
on e
mpl
oyee
sha
re o
ptio
ns
6 –
– –
– –
– (9
28)
(928
) –
(928
)
Tota
l mov
emen
ts in
equ
ity
12
–
– –
(7,9
08)
103
8,34
2 54
9 –
549
Bal
ance
at
27 N
ove
mb
er 2
011
1,
230
2,92
5 16
8 87
8 (7
,908
) (1
,225
) 86
,399
82
,467
–
82,4
67
* An
expl
anat
ion
of th
e re
stat
emen
t is
prov
ided
in N
ote
1 un
der
basi
s of
pre
para
tion.
The
acco
mpa
nyin
g no
tes
on p
ages
62
to 9
5 ar
e an
inte
gral
par
t of t
hese
con
solid
ated
fina
ncia
l sta
tem
ents
.
Co
Nso
lid
AtE
d s
tAtE
MEN
t o
f C
HA
Ng
Es iN
Eq
uit
yye
ar e
nd
ed
27
No
vem
be
r 201
1

STh
ree
plc
60R
epor
t & fi
nanc
ial s
tate
men
ts 2
011
C
apit
al
A
ttri
but
able
S
hare
S
hare
re
dem
pti
on
Cap
ital
Tr
easu
ry
Ret
aine
d
to C
om
pan
y
N
ote
C
apit
al
pre
miu
m
rese
rve
rese
rve
shar
es
earn
ing
s sh
areh
old
ers
£’
000
£’00
0 £’
000
£’00
0 £’
000
£’00
0 £’
000
Bal
ance
at
29 N
ove
mb
er 2
009
1,21
8 2,
925
168
878
– 18
3,50
6 18
8,69
5
Tota
l com
preh
ensi
ve in
com
e an
d pr
ofit f
or th
e ye
arto
28
Nov
embe
r 20
10
20
–
– –
– –
4,87
9 4,
879
Div
iden
ds p
aid
to e
quity
hol
ders
7 –
– –
– –
(14,
369)
(1
4,36
9)E
mpl
oyee
sha
re a
war
ds
– –
– –
– 34
0 34
0D
efer
red
tax
on e
mpl
oyee
sha
re o
ptio
ns
– –
– –
– 11
6 11
6
Tota
l mov
emen
ts in
equ
ity
– –
– –
– (9
,034
) (9
,034
)
Bal
ance
at
28 N
ove
mb
er 2
010
1,21
8 2,
925
168
878
– 17
4,47
2 17
9,66
1
Tota
l com
preh
ensi
ve in
com
e an
d pr
ofit f
or th
e ye
arto
27
Nov
embe
r 20
11
20
–
– –
– –
70,5
29
70,5
29D
ivid
ends
pai
d to
equ
ity h
olde
rs
– –
– –
– (1
4,51
8)
(14,
518)
Issu
e of
sha
re c
apita
l
19
12
– –
– –
– 12
Pur
chas
e of
ow
n sh
ares
19
– –
– –
(7,9
08)
– (7
,908
)E
mpl
oyee
sha
re a
war
ds
– –
– –
– 2,
426
2,42
6C
urre
nt ta
x on
em
ploy
ee s
hare
opt
ions
–
– –
– –
416
416
Def
erre
d ta
x on
em
ploy
ee s
hare
opt
ions
–
– –
– –
(962
) (9
62)
Gai
n on
dis
posa
l of s
hare
s fro
m tr
acke
r sh
areh
olde
rs
– –
– –
– 25
8 25
8
Tota
l mov
emen
ts in
equ
ity
12
– –
– (7
,908
) 58
,149
50
,253
Bal
ance
at
27 N
ove
mb
er 2
011
1,23
0 2,
925
168
878
(7,9
08)
232,
621
229,
914
Of t
he a
bove
rese
rves
onl
y th
e re
tain
ed p
rofit
of £
232,
621,
000,
(201
0: £
174,
472,
000)
is d
istr
ibut
able
.
The
acco
mpa
nyin
g no
tes
on p
ages
62
to 9
5 ar
e an
inte
gral
par
t of t
hese
fina
ncia
l sta
tem
ents
.
Co
MPA
Ny
stA
tEM
ENt
of
CH
AN
gEs
iN E
qu
ity
yea
r en
de
d 2
7 N
ove
mb
er 2
011

61SThree plc Report & financial statements 2011
Consolidated Company *Restated 27 November 28 November 27 November 28 November 2011 2010 2011 2010 Note £’000 £’000 £’000 £’000
Cash flows from operating activitiesProfit before taxation 30,299 21,649 70,909 8,123Depreciation and amortisation charge 7,659 6,313 – –Finance income 5 (361) (451) (56) (70)Finance cost 5 25 18 1,203 976Loss on disposal of property, plant and equipment 67 110 – –Loss on disposal of intangible assets 11 1 – –Non-cash charge for employee share options 2,426 1,656 992 340
Operating cashflow before changes inworking capital and provisions 40,126 29,296 73,048 9,369(Increase)/decrease in receivables (12,005) (3,652) (8,189) 2,379Increase/(decrease) in payables 8,443 9,746 (56,204) 11,375Decrease in provisions (197) (3,625) – –
Cash flows from operating activitiesCash generated from operating activities 36,367 31,765 8,655 23,123Income tax paid (7,951) (2,758) (8,750) (2,200)
Net cash generated from/(used in) operating activities 28,416 29,007 (95) 20,923
Cash flows from investing activitiesPurchase of property, plant and equipment 9 (2,918) (2,836) – –Purchase of intangible assets 10 (2,911) (2,922) – –Purchase of held-to-maturity investment 13 – (3,500) – –Proceeds from disposal of held-to-maturity investment 13 3,500 3,203 – –
Net cash used in investing activities (2,329) (6,055) – –
Cash flows from financing activitiesFinance income 5 361 451 56 70Finance cost 5 (25) (18) (1,203) (976)Employee subscription for share awards 19c 135 435 – –Repayment to non-controlling interest (71) – –Purchase of own shares (7,557) – (7,557) –Issue of share capital of subsidiary companies to non–controlling interest – 34 – –Issue of share capital to Equity holders 12 – 12 –Recapitalisation of subsidiary company – – – (6,000)Repurchase of non-controlling interest – – – (243)Dividends paid to equity holders 7 (14,518) (14,369) (14,518) (14,369)Dividends paid to tracker share holders (679) (970) – –
Net cash used in financing activities (22,342) (14,437) (23,210) (21,518)
Net increase/(decrease) in cash and cash equivalents 3,745 8,515 (23,305) (595)Cash and cash equivalents at the beginning of the year 51,718 45,272 (445) 150Effect of exchange rate changes 142 (2,069) – –
Cash and cash equivalents at the end of the year 22 55,605 51,718 (23,750) (445)
*An explanation of the restatement is provided in Note 1 under basis of preparation.The accompanying notes on pages 62 to 95 are an integral part of these financial statements.
stAtEMENt of CAsH flowsyear ended 27 November 2011

SThree plc62 Report & financial statements 2011
NotEs to tHE fiNANCiAl stAtEMENts
1 Accounting policies
SThree plc (‘the Company’) and its subsidiaries (together ‘the Group’) operate predominantly in the United Kingdom and Continental Europe. The Group’s activities and business are set out in the Directors’ Report.
The Company is a public limited company incorporated and domiciled in the United Kingdom and the Company is listed on the London Stock Exchange. The address of its registered office is 5th Floor, GPS House, 215-227 Great Portland Street, London, W1W 5PN.
The principal accounting policies applied in the preparation of the consolidated financial statements are set out below.
Basis of preparation
These financial statements have been prepared in accordance with International Financial Reporting Standards (‘IFRSs’) as adopted and endorsed by the European Union (‘EU’) and with those parts of the Companies Act 2006 applicable to companies reporting under IFRS. Therefore the Group financial statements comply with Article 4 of the EU International Accounting Standards Regulation.
The Group’s consolidated financial statements have been prepared under the historical cost convention. The Company’s financial statements have been prepared on the same basis and as permitted by Section 408 of the Companies Act 2006, no income statement and statement of comprehensive income is presented for the Company.
During the period the Board elected to separate the Consolidated statement of comprehensive income into a Consolidated income statement and Consolidated statement of comprehensive income. The decision to separate the statements has been to align with industry presentation practice and to clearly disclose the entity’s profit for the period.
The financial year of the Group comprises 52 weeks and not a calendar year.
Restatement of the consolidated statementsIncluded in other comprehensive income for the period ended 28 November 2010 was £1,347,000 relating to employee share awards, and deferred and current tax on employee share options of £258,000 and £155,000 respectively. These represented transactions with owners and should have been reflected directly in equity. Therefore, these amounts have been removed from the consolidated statement of comprehensive income for the year affected.
As a result of this change other comprehensive income for the year ended 28 November 2010 has been restated to (£3,603,000) compared to (£1,843,000) previously reported.
In the Statement of cash flows for the period ended 28 November 2010, the tax paid was disclosed as a gross amount and excluded any refunds of tax paid in the period of £3.2m. The corresponding entry reduces the effects of foreign exchange rates on cash and therefore has no impact on the cash flows from operating activities or opening and closing cash and cash equivalents. As a result of this change, income tax paid has been restated to (£2,758,000) compared to (£5,958,000) and the effect of exchange rate changes has been restated to (£2,069,000) compared to £1,131,000 as previously reported.
The restatements have no impact on the income statement or operating profit.
Significant accounting policies
The Group’s accounting policies, as set out below, have been consistently applied to all the periods presented, unless otherwise stated.
The Group’s consolidated financial statements have been prepared in accordance with IFRS since 1 December 2004. The preparation of financial statements in conformity with IFRS requires the use of certain critical accounting estimates. It also requires management to exercise its judgement in the process of applying the Group’s accounting policies. Management consider that the areas involving a higher degree of judgement or complexity, or areas where assumptions and estimates affect the consolidated financial statements, do not substantially impact the results.
There were no new International Financial Reporting Standards or interpretations that had to be implemented during the year that affect these financial statements.
As at the date of authorisation of these financial statements, the following standards and interpretations were in issue but not yet effective. The Group has not applied these standards and interpretations in the preparation of financial statements.
The revised Standard IAS 24 ‘Related Parties Disclosure’ is effective from periods commencing on or after 1 January 2011. The standard revises the definition of a related party and clarifies that disclosure is required of any commitments of a related party

63SThree plc Report & financial statements 2011
Notes to the FiNaNcial statemeNts
to do something if a particular event occurs or does not occur in the future, including executory contracts (recognised and unrecognised).
IFRS 9 ‘Financial Instruments’ will establish principles for the financial reporting of financial assets that will present relevant and useful information to users of financial statements for their assessment of the amounts, timing and uncertainty of the entity’s future cash flows. The standard is applicable for periods commencing on or after 1 January 2015.
The impact on the Group’s financial statements of the future adoption of these standards and interpretations is still under review, but the Group does not expect any of these changes to have a material effect on the results or net assets of the Group.
Consolidation
The consolidated financial statements incorporate the financial statements of the Company and of its subsidiaries. Subsidiaries are all entities over which the Company has the power to govern the financial and operating policies, generally accompanying a shareholding of more than one half of the voting rights. Subsidiaries are fully consolidated from the date on which control is transferred to the Group; they are de-consolidated from the date when control ceases.
Foreign currencies
(i) Functional and presentation currencyItems included in the financial statements of each of the Group’s subsidiaries are measured using the currency of the primary economic environment in which that subsidiary operates (its ‘functional currency’). The consolidated financial statements are presented in Sterling, which is the company’s functional and the Group’s presentation currency.
(ii) Transactions and balancesForeign currency transactions are translated into the functional currency using the exchange rates prevailing at the dates of the transactions. Foreign exchange gains and losses resulting from the settlement of such transactions and from the translation at period-end exchange rates of monetary assets and liabilities denominated in foreign currencies are recognised in the income statement.
(iii) Group companiesThe results and financial position of all of the Group’s subsidiaries (none of which has the currency of a hyper-inflationary economy) that have a functional currency different from the Group’s presentation currency are translated into the presentation currency as follows:– assets and liabilities for each statement of financial position presented are translated at the rate ruling at the end of the
reporting period;– income and expenses for each income statement are translated using the average rate of exchange (unless this average
is not a reasonable approximation of the cumulative effect of the rates prevailing on the transaction dates, in which case income and expenses are translated at the dates of the transactions);
– all resulting exchange differences are recognised in other comprehensive income.
The Group treats specific inter-company loan balances, which are not intended to be settled for the foreseeable future, as part of its net investment in the relevant subsidiaries. On consolidation, exchange differences arising from the translation of the net investment in foreign entities and of borrowings and other currency instruments designated as hedges of such investments, are taken to shareholders’ equity. When a foreign operation is sold, such exchange differences are removed from equity and recognised in the income statement as part of the gain or loss on sale.
Revenue and revenue recognition
Revenue comprises the fair value of the consideration received or receivable for the provision of services provided in the ordinary course of the Group’s activities. Revenue is shown net of value added tax and other sales taxes, returns, rebates and discounts and after elimination of sales within the Group.
Contract revenue for the supply of professional services is recognised based on the number of hours worked by a contractor.
Revenue for permanent placements is recognised when candidates commence employment.
A provision is established for non-fulfilment of permanent placement and contract obligations, which is offset within Trade and other receivables on the face of the Statement of financial position and offset against revenue in the income statement.
1 Accounting policies (continued)

SThree plc64 Report & financial statements 2011
Notes to the FiNaNcial statemeNts
Finance income
Interest income is recognised as the interest accrues to the net carrying amount of the financial asset.
Segment reporting
The Group operates in one business segment being that of recruitment services. The Group operates in three geographic segments being the United Kingdom and Ireland, Continental Europe and the Rest of the World.
Dividends
Interim and special dividends are recognised in the financial statements at the time they are paid. The final dividends declared to the Company’s shareholders are recognised as a liability in the Company’s and Group’s financial statements in the period in which the dividends are approved by the Company’s shareholders.
The Company recognises dividends from subsidiaries at the time that they are received.
Property, plant and equipment
Property, plant and equipment is stated at historical cost less accumulated depreciation. Historical cost includes expenditure that is directly attributable to the acquisition of the items.
Depreciation is calculated using the straight-line method to allocate the depreciable value of property, plant and equipment to the income statement over their useful economic lives as follows:
Computer equipment 33.33% per annumLeasehold improvement 20% per annumFixtures and fittings 20% per annumMotor vehicles 33.33% per annum
Assets’ residual values and useful lives are reviewed and adjusted, if appropriate, at the end of the reporting period.
Subsequent costs are included in the asset’s carrying amount or recognised as a separate asset, as appropriate, only when it is probable that future economic benefits associated with the item will flow to the Group and the cost of the item can be measured reliably. All other repairs and maintenance are charged to the income statement during the financial period in which they are incurred.
Gains and losses on disposals are determined by comparing proceeds with carrying amounts. These are included in the income statement. An assets carrying amount is written down immediately to its recoverable amount if the assets carrying value is greater than its estimated recoverable amount.
Intangible assets
GoodwillGoodwill represents the excess of the cost of an acquisition over the fair value of the Group’s share of the net identifiable assets of the acquired subsidiary at the date of acquisition. Goodwill on the acquisition of subsidiaries is included in intangible assets. Goodwill is tested annually for impairment and carried at cost less accumulated impairment losses. Any impairment is recognised immediately in the income statement and is not subsequently reversed. Gains and losses on the disposal of an entity include the carrying amount of goodwill relating to the entity sold.
Assets under constructionPurchased fixed assets or internally generated intangible assets that are still under development are classified as ‘Assets under construction’. These assets are reclassified over the phased completion dates and are amortised from the date they are available for use.
Computer softwareThe cost of acquired computer software licenses is capitalised. These costs are amortised over their estimated useful lives (up to three years) on a straight line basis.
Costs associated with maintaining computer software programmes are recognised as an expense to the income statement when incurred.
1 Accounting policies (continued)

65SThree plc Report & financial statements 2011
Notes to the FiNaNcial statemeNts
Software and system development costsCosts incurred on development projects (relating to the design or improvement of systems) where the related expenditure is separately identifiable, measurable and management are satisfied as to the ultimate technical and commercial viability of the project, such that it will generate future economic benefits based on all relevant available information are recognised as intangible assets in line with IAS 38 ‘Intangible Assets’. Capitalised software and system development costs are amortised from the date the system is available for use over their expected useful lives (not exceeding five years) on a straight line basis.
Research expenditure is recognised as an expense to the income statement as incurred.
TrademarksTrademarks are initially recognised at cost. They have a definite useful life and are carried at cost less accumulated amortisation. Amortisation is calculated using the straight-line method to allocate the cost of trademarks over their estimated useful lives (up to twelve years).
Impairment of assets
Assets that are not subject to amortisation are tested annually for impairment.
Assets that are subject to amortisation are reviewed for impairment whenever events or changes in circumstances indicate that the carrying amount may not be recoverable. An impairment loss is recognised for the amount by which the asset’s carrying amount exceeds its recoverable amount, by analysing individual assets or classes of assets that naturally belong together. The recoverable amount is the higher of an asset’s fair value less costs to sell and value in use. Value in use is measured based on the expected future discounted cash flows (‘DCF’ model) attributable to the asset. For the purposes of assessing impairment, assets are grouped at the lowest levels for which there are separately identifiable cash flows (cash generating units).
Investments
The Company’s investments in shares in Group companies are stated at cost less provisions for impairment. Any impairment is charged to the income statement as it arises.
Where share-based payments are granted to the employees of subsidiary undertakings by the parent company, they are treated as a capital contribution to the subsidiary and the Company’s investment in the subsidiary is increased accordingly.
Financial assets
Non-derivative financial assets are classified as either ‘held to maturity’ or ‘loans and receivables’. The classification depends on the nature and purpose of the financial assets and is determined at the time of initial recognition.
Held to maturity financial assetsHeld-to-maturity financial assets comprises investments with fixed or determinable payments and fixed maturity for which there is a positive intention and ability to hold to maturity and which have not been designated at fair value through the income statement or as available for sale.
Held-to-maturity financial assets are measured at amortised cost using the effective interest rate method.
Loans and receivablesLoans and receivables are non-derivative financial assets with fixed or determinable payments that are not quoted in an active market. They are included in current assets, except for maturities greater than 12 months after the end of the reporting period. These are classified as non-current assets. The Group’s loans and receivables comprise ‘trade and other receivables’ and ‘cash and cash equivalents’ in the statement of financial position.
Trade and other receivablesTrade accounts receivable are recorded at net realisable value after deducting an allowance for doubtful accounts. The Group makes judgements on an entity by entity basis as to its ability to collect outstanding receivables and provides an allowance for doubtful accounts based on a specific review of significant outstanding invoices. For those invoices not specifically reviewed, provisions are provided at differing percentages based on the age of the receivable. In determining these percentages, the Group analyses its historical collection experience and current economic trends. Trade receivable balances are written off when the Group determines that it is unlikely that future remittances will be received.
Cash and cash equivalentsCash and cash equivalents include cash in hand, deposits held at call with banks, other short-term highly liquid investments with original maturities of three months or less and bank overdrafts. Bank overdrafts are shown within current financial liabilities on
1 Accounting policies (continued)

SThree plc66 Report & financial statements 2011
Notes to the FiNaNcial statemeNts
the statement of financial position unless they form part of a cash pooling arrangement in which case they are reported net of related cash balances.
Financial liabilities
All non-derivative financial liabilities are classified as ‘other financial liabilities’ and are initially measured at fair value, net of transaction costs. Other financial liabilities are subsequently measured at amortised cost using the ‘effective interest rate’ method. Financial liabilities are classified as current liabilities unless the Group has an unconditional right to defer settlement of the liability for at least twelve months after the end of the reporting period.
Net investment hedging
Financial instruments are classified as net investment hedges when they hedge the Group’s net investment in an overseas operation. The effective element of any foreign exchange gain or loss from remeasuring the derivative instrument is recognised directly in other comprehensive income. Any ineffective element is recognised immediately in the Group income statement.
Leases
Leases where substantially all the risks and rewards of ownership of assets remain with the lessor are accounted for as operating leases. Payments made under operating leases net of any incentives received from the lessor are charged to the income statement on a straight-line basis over the lease periods.
Trade and other payables
Trade and other payables are stated at cost.
Short term financial liabilities and overdrafts
Financial liabilities are recognised initially at fair value, net of transaction costs incurred. Financial liabilities are subsequently stated at amortised cost; any difference between the proceeds (net of transaction costs) and the redemption value is recognised in the income statement over the period of the borrowings using the effective interest method.
Financial liabilities are classified as current liabilities unless the Group has an unconditional right to defer settlement of the liability for at least 12 months after the end of the reporting period.
Provisions
Provisions are recognised when the Group has a legal or constructive obligation as a result of past events and it is more likely than not that an outflow of resources will be required to settle the obligation and the amount has been reliably estimated.
Provisions are recognised as the present value of the expenditures expected to be required to settle the obligation. No provision is recognised for future operating losses.
Where there are a number of similar obligations, the likelihood that an outflow will be required in settlement is determined by considering the class of obligation as a whole. A provision may be recognised even if the likelihood of an outflow with respect to any one item included in the same class of obligations may be small.
Taxation
Corporation tax expense represents the sum of the tax currently payable and deferred tax.
The tax currently payable is based on taxable profits for the period. Taxable profit differs from profit as reported in the income statement because it excludes items of income or expense that are taxable or deductible in other years and it further excludes items that are never taxable or deductible. The Group’s liability for current tax is calculated using tax rates that have been enacted or substantially enacted by the end of the reporting period.
Deferred tax is provided in full, using the liability method, on temporary differences arising between the tax bases of assets and liabilities and their carrying amounts in the consolidated financial statements. Deferred tax is determined using tax rates that have been enacted or substantially enacted by the end of the reporting period and are expected to apply when the related deferred tax asset is realised or the deferred tax liability is settled.
Deferred tax assets are recognised to the extent that it is probable that future taxable profit will be available against which the temporary differences can be utilised.
1 Accounting policies (continued)

67SThree plc Report & financial statements 2011
Notes to the FiNaNcial statemeNts
Share capital
Ordinary shares are classified as equity. Incremental costs directly attributable to the issue of new shares or options are shown in equity as a deduction, net of tax, from the proceeds.
Where any group company purchases the company’s equity share capital (treasury shares), the consideration paid, including any directly attributable incremental costs is deducted from the equity attributable to the company’s equity holders until the shares are cancelled or reissued.
Employee benefits
Wages, salaries, bonuses, social security contributions, paid annual leave and sick leave are accrued in the period in which the associated services are rendered by employees of the Group.
Pension obligations — the Group has defined contribution plans and pays contributions to privately administered pension plans on a mandatory, contractual or voluntary basis. The Group has no further payment obligations once the contributions have been paid.
Bonus plans — The Group recognises a liability and an expense for bonuses based on the Directors’ best estimate of the amounts due. The Group recognises a provision where contractually obliged or where there is a past practice of payments that has created a constructive obligation.
Termination benefits — Termination benefits are payable when employment is terminated before the normal retirement date, or whenever an employee accepts voluntary redundancy in exchange for those benefits. The Group recognises termination benefits when it is demonstrably committed to either terminating the employment of current employees according to a detailed formal plan without the possibility of withdrawal, or providing termination benefits as a result of an offer made to encourage voluntary redundancy.
Employee Benefit Trust
The Employee Benefit Trust (‘EBT’) was originally funded by gifts from certain of the Company’s shareholders and Directors. The assets and liabilities of the EBT are consolidated into the Group’s consolidated financial statements.
The shares in the EBT are held to satisfy awards and grants under the employee share award, share option schemes and Long Term Incentive Plan (‘LTIP’), all of which were gifted or newly issued shares and hence no cost is attributed to those shares and no amounts are shown in the Group’s financial statements.
Share-based compensation
The cost of equity-settled transactions with employees is measured by reference to the fair value at the date at which equity instruments are granted and is recognised as an expense over the vesting period, which ends on the date on which the relevant employees become fully entitled to the award. Fair value is determined by using an appropriate valuation model. In valuing equity-settled transactions, no account is taken of any vesting conditions, other than market conditions.
No expense is recognised for awards that do not ultimately vest, except for awards where vesting is conditional upon a market condition, which are treated as vesting irrespective of whether or not the market condition is satisfied, provided that all other performance conditions are satisfied.
At the end of each reporting period before vesting, the cumulative expense is calculated, representing the extent to which the vesting period has expired and management’s best estimate of the achievement or otherwise of non-market conditions and the number of equity instruments that will ultimately vest or, in the case of an instrument subject to a market condition, be treated as vesting as described above. The movement in cumulative expense since the previous end of the reporting period is recognised in the income statement, with a corresponding entry in equity.
For certain share based payment settlements there exists an obligation on the Group to repay amounts if the employee leaves the employment of the Group before the settlement vests. In these circumstances a provision is established in relation to this obligation.
Where the terms of an equity-settled award are modified or a new award is designated as replacing a cancelled or settled award, the cost based on the original award terms continues to be recognised over the original vesting period. In addition, an expense is recognised over the remainder of the new vesting period for the incremental fair value of any modification, based on the difference between the fair value of the original award and the fair value of the modified award, both as measured on the date of the modification. No reduction is recognised if this difference is negative.
1 Accounting policies (continued)

SThree plc68 Report & financial statements 2011
Notes to the FiNaNcial statemeNts
Where an equity-settled award is cancelled, it is treated as if it had vested on the date of cancellation and any cost not yet recognised in the income statement for the award is expensed immediately. Any compensation paid, up to the fair value of the award, at the cancellation or settlement date is deducted from equity, with any excess over fair value being treated as an expense in the income statement.
Significant judgements and estimates
The preparation of financial statements in conformity with generally accepted accounting principles requires the use of estimates and assumptions that affect the reported amounts of assets and liabilities at the date of the financial statements and the reported amounts of revenues and expenses during the reporting period. Although these estimates are based on the Directors’ best knowledge of the amounts, actual results may ultimately differ from those estimates. The ‘critical accounting judgements and key sources of estimation uncertainty’ made by the Directors in these financial statements are set out below.
A number of significant assumptions and estimates are involved in using DCF models to forecast operating cash flows, e.g. with respect to factors such as market growth rates, revenue volumes, market prices for services and working capital requirements. Forecasts of future cash flows are based on best estimates of future revenues and operating expenses using historical trends, general market conditions, industry trends and forecasts and other available information. These assumptions are subject to review by management and the Board of Directors. The cash flow forecasts are adjusted by an appropriate pre-tax discount rate derived from the Group’s cost of capital.
(i) The determination of the carrying amount of capitalised software and systems development costs and assets under construction and the estimation of useful economic life and recoverability of such assets is deemed to be judgemental.
(ii) The Group follows the guidance in IAS 39 to determine when trade and other receivables are impaired. This determination requires significant judgement. In making this judgement, the Group evaluates, amongst other factors, the duration and extent to which the carrying values of a receivable is less than its cost, the risk profile of the client and other credit rating factors, the financial health, historical experience of and near-term business outlook for the client.
(iii) Revenue is recognised when the supply of professional services has been rendered. It also includes an assessment of professional services received by the client for the placement of temporary services between the date of the last received timesheet and the year end. Unsubmitted timesheets are estimated to the extent that an open contract has not expired during the period under assessment. Management apply judgement to several factors in estimating the revenue and cost of sales accruals; any difference compared to actual experience would result in the amount payable to the contractor and receivable from the client being adjusted in the next financial year. The judgement applied, and the assumptions underlying these judgements are considered to be appropriate. However, a change in these assumptions would impact upon both the amount of revenue and cost of sales recognised.
(iv) The Group recognised a net deferred tax asset of £6.4m (2010: £8.7m), of which £5.5m (2010: £7.1m) related to trading losses that are to be carried forward and relieved against profits arising in future periods. The judgement to recognise the deferred tax asset is dependent upon the Group’s expectations regarding future profitability based upon subsidiary revenue and cost forecasts for future years which contain a degree of inherent uncertainty.
(v) The fair value of equity settled share-based payments is partly derived from estimates of factors such as lapse rates and achievement of performance criteria. It is also derived from assumptions such as the future volatility of the Company’s share price, expected dividend yields and risk-free interest rates.
2 Segmental analysis
IFRS 8 ‘Segmental Reporting’ requires management to apply the ‘management approach’ to segmental reporting. This requires management to determine those segments whose operating results are reviewed regularly by the entity’s chief operating decision maker to make strategic decisions and assess sector performance.
Revenue and Gross Profit by reportable segment
Management has determined the chief operating decision maker to be the Executive Committee made up of the Chief Executive Officer, the Chief Financial Officer, the Chief Strategy Officer, the Chief Information Officer, the Director of Strategic Capability, the Regional Managing Directors and key function heads. Operating segments have been identified based on reports reviewed by the Executive Committee, which considers the business primarily from the geographic perspective.
1 Accounting policies (continued)

69SThree plc Report & financial statements 2011
Notes to the FiNaNcial statemeNts
The Group’s management reporting and controlling systems use accounting polices that are the same as those described in note 1 in the summary of significant accounting policies under IFRS.
The Group measures the performance of its operating segments through a measure of segment profit or loss which is referred to as “Gross Profit” in the management and reporting system. Gross Profit is the measure of segment profit/(loss) used in segment reporting and comprises revenue less cost of sales.
Intersegment revenue is recorded at values which approximate third party selling prices and is not significant.
United Kingdom & Ireland *Restated 27 November 28 November 2011 2010 £’000 £’000
Revenue from external customers 242,667 227,872Gross Profit 71,348 68,282Total Assets 105,185 118,971Total Liabilities 52,828 63,063Capital Expenditure 3,983 4,751
Continental Europe 27 November 28 November 2011 2010 £’000 £’000
Revenue from external customers 258,977 223,159Gross Profit 98,448 80,751Total Assets 64,813 45,243Total Liabilities 46,928 30,830Capital Expenditure 981 611
Rest of the World 27 November 28 November 2011 2010 £’000 £’000
Revenue from external customers 40,806 23,420Gross Profit 25,734 17,335Total Assets 16,906 13,217Total Liabilities 4,681 1,620Capital Expenditure 865 396
Group 27 November 28 November 2011 2010 £’000 £’000
Revenue from external customers 542,450 474,451Gross Profit 195,530 166,368Total Assets 186,904 177,431Total Liabilities 104,437 95,513Capital Expenditure 5,829 5,758
* In 2010, Ireland was included within Continental Europe. In 2011 the results reviewed by the chief operating decision maker now show Ireland with the UK. The 2010 comparative figures have been restated on the same basis.
2 Segmental analysis (continued)

SThree plc70 Report & financial statements 2011
Notes to the FiNaNcial statemeNts
2 Segmental analysis (continued)
The following segmental analyses by brand, recruitment classification and discipline (being the profession of candidates placed) have been included as additional disclosure to the requirements of IFRS 8 ‘Operating Segments’.
Revenue Gross profit Restated1 Restated1
27 November 28 November 27 November 28 November 2011 2010 2011 2010 £’000 £’000 £’000 £’000
BrandProgressive 158,114 133,780 55,241 45,416Huxley Associates 146,376 125,843 54,551 44,892Computer Futures Solutions 145,879 125,331 52,912 44,613Real Staffing Group 92,081 89,497 32,826 31,447
542,450 474,451 195,530 166,368
Recruitment classificationContract 441,456 393,037 94,536 84,954Permanent 100,994 81,414 100,994 81,414
542,450 474,451 195,530 166,368
DisciplineInformation and communication technology 373,745 341,484 116,619 102,610Others2 168,705 132,967 78,911 63,758
542,450 474,451 195,530 166,368
1 Real Staffing Group has been restated to include IT Jobboard and JP Gray International. Computer Futures Solutions has been restated to exclude JP Gray International.
2 Including engineering and energy, banking, accountancy and finance, pharmaceuticals, and jobboard sectors.
3 Administrative expenses
Operating profit is stated after charging/(crediting): 27 November 28 November 2011 2010Analysis of costs by nature £’000 £’000
Net trade receivables provision charge (note 12) 223 211Depreciation (note 9) 3,148 2,925Amortisation of intangible assets (note 10)
— Software and systems development costs 3,770 3,000— Trademarks 1 3— Computer software 740 385
Foreign exchange gains (515) (1,016)Staff costs (note 4) 121,392 106,617Loss on disposal of property, plant and equipment 67 110Loss on disposal of intangible assets 11 1Operating lease charges
— Motor vehicles 1,223 1,449— Land and buildings 9,912 9,050

71SThree plc Report & financial statements 2011
Notes to the FiNaNcial statemeNts
During the year the Group (including its overseas subsidiaries) obtained the following services from the Group’s auditors at the costs detailed below: 27 November 28 November 2011 2010Amounts payable to PricewaterhouseCoopers LLP £’000 £’000
Fees payable to the Company’s auditor for the audit of parentand consolidated financial statements 90 120Fees payable to the Company’s auditor and its associates for other services:
— The audit of the Company’s subsidiaries pursuant to legislation 330 377— Other services pursuant to legislation 40 40— Other assurance services 10 10— Taxation advice 154 165— Other services 126 383
Costs charged to operating profit 750 1,095
4 Directors and employees
Staff costs and employee numbers consist of: 27 November 28 November 2011 2010 £’000 £’000
Wages and salaries (including bonuses) 102,446 90,356Social security costs 15,268 13,475Pension costs 791 699Temporary staff costs 461 431Cost of employee share options and awards 2,426 1,656
121,392 106,617
The average number of employees (including Executive Directors) during the year was: 27 November 28 November 2011 2010 Number Number
Geographic analysisUnited Kingdom
— Sales 570 527— Non-sales 447 427
1,017 954
Europe and Rest of World— Sales 924 742— Non-sales 101 76
1,025 818
2,042 1,772
Included in the headcount numbers above is a total of 31 (2010: 80) temporary short-term full time employees.
Information on Directors’ emoluments and interests, which forms part of these audited financial statements, is given in the Directors’ Remuneration Report.
The Company had an average of 3 (2010: 3) employees in the year ended 27 November 2011.
3 Administrative expenses (continued)

SThree plc72 Report & financial statements 2011
Notes to the FiNaNcial statemeNts
5 Finance income and cost
27 November 28 November 2011 2010 £’000 £’000
Finance incomeBank interest receivable 361 451
361 451
Finance costBank overdrafts (25) (18)
(25) (18)
Net finance income 336 433
6 Taxation
(a) Analysis of tax charge for the year
27 November 28 November 2011 2010 £’000 £’000
Current taxationUKCorporation tax charged at 27% (2010: 28%) onprofits for the year 6,278 9,195Adjustments in respect of prior periods 133 583OverseasCorporation tax charged on profits for the year 3,252 1,274Adjustments in respect of prior periods (1,073) (768)
Total current tax charge 8,590 10,284
Deferred taxationOrigination and reversal of temporary differences (13) (3,862)Adjustments in respect of prior periods 1,270 992Schedule 23 deferred tax charge/(credit) in respect ofunexercised employee share awards and options 187 (48)
Total deferred tax charge/(credit) 1,444 (2,918)
Total income tax charge in the income statement 10,034 7,366

73SThree plc Report & financial statements 2011
Notes to the FiNaNcial statemeNts
6 Taxation (continued)
(b) Reconciliation of the effective tax rate
The Group‘s tax charge for the year ended 27 November 2011 exceeds the UK statutory rate and can be reconciled as follows:
27 November 28 November 2011 2010 £’000 % £’000 %
Profit before taxation 30,299 21,649
Profit before tax multiplied by standard rate of 8,081 27% 6,062 28%corporation tax in the UK
Effects of:Disallowable items 626 2% 80 –Differing tax rates on overseas earnings 585 2% 376 2%Adjustments to tax in respect of previous periods 330 1% 807 4%Adjustment due to UK tax rate change 58 – 41 –Tax losses for which no deferred tax was recognised 354 1% – –
Tax expense and effective tax rate 10,034 33% 7,366 34%
(c) Current and deferred tax movement recognised directly in equity 27 November 28 November 2011 2010 £’000 £’000
Current taxEquity settled employee share options (1,776) (155)Deferred taxEquity settled employee share options 928 (258)
(848) (413)
The Group expects to receive additional tax deductions in respect of the share awards and share options currently unexercised. Under IFRS the Group is required to provide for deferred tax on all unexercised share awards and options. Where the amount of the tax deduction (or estimated future tax deduction) exceeds the amount of the related cumulative remuneration expense, this indicates that the tax deduction relates not only to remuneration expense but also to an equity item. In this situation, the excess of the current or deferred tax should be recognised in equity. At 27 November 2011 a deferred tax asset of £1.0m (2010: £2.1m) has been recognised in respect of these options (note 18).

SThree plc74 Report & financial statements 2011
Notes to the FiNaNcial statemeNts
7 Dividends
27 November 28 November 2011 2010 £’000 £’000
Amounts recognised and distributed to shareholders in the yearEquityInterim dividend of 4.0p (2010: 4.0p) per ordinary sharei) 4,694 4,782Second interim dividend of nil (2010: 8.0p) per ordinary share – 9,587Final dividend of 8.0p (2010: nil) per ordinary shareii) 9,824 –
14,518 14,369
Amounts proposed as distributions to shareholdersInterim dividend of 4.7p (2010: 4.0p) and special dividend of 11.0p (2010: nil)per ordinary share for the period ended 29 May 2011iii) 18,786 4,797Final dividend of 9.3p (2010: 8.0p) per ordinary share for the year ended 27 November 2011iv) 11,128 9,594
i) An interim dividend of 4.0 pence (2010: 4.0 pence) per ordinary share for the six months ended 30 May 2010 was paid on 3 December 2010 to shareholders on record at 5 November 2010.
ii) A final dividend of 8.0 pence (2009: nil) per ordinary share for the year ended 28 November 2010 was paid on 6 June 2011 to shareholders on record at 6 May 2011.
iii) An interim dividend of 4.7 pence (2010: 4.0 pence) per ordinary share and a special dividend of 11.0 pence (2010: nil) per ordinary share for the six months ended 29 May 2011 were paid on 2 December 2011 to shareholders on record at 4 November 2011.
iv) The Board propose a final dividend of 9.3 pence per ordinary share for the year ended 27 November 2011 (2010: 8.0 pence), to be paid on 6 June 2012 to shareholders on record at 4 May 2012. This proposed final dividend had not been approved by shareholders at 27 November 2011.

75SThree plc Report & financial statements 2011
Notes to the FiNaNcial statemeNts
8 Earnings per share
The calculation of the basic and diluted earnings per share (‘EPS’) is based on the following data.
Basic earnings per share is calculated by dividing the earnings attributable to shareholders by the weighted average number of shares in issue during the year, excluding those held in the EBT which are treated as cancelled.
For diluted earnings per share, the weighted average number of shares in issue is adjusted to assume conversion of dilutive potential shares.
27 November 28 November 2011 2010 £’000 £’000
EarningsProfit after taxation 20,265 14,283Non controlling interest – (67)
Profit after taxation attributable to equity holders of the Company 20,265 14,216
millions millions
Number of sharesWeighted average number of shares used for basic EPS 120.6 119.9Dilutive effect of share plans 3.3 3.9
Diluted weighted average number of shares used for diluted EPS 123.9 123.8
pence pence
Basic
Basic earnings per share 16.8 11.9
Diluted
Diluted earnings per share 16.4 11.5

SThree plc76 Report & financial statements 2011
Notes to the FiNaNcial statemeNts
9 Property, plant and equipment
Computer Leasehold Fixtures and Motor equipment improvements fittings vehicles Total £’000 £’000 £’000 £’000 £’000
CostAt 29 November 2009 11,205 4,347 3,069 278 18,899
Additions 1,818 589 337 92 2,836Disposals (2,125) (45) (134) (211) (2,515)Reclassification (note 10) 51 156 64 271Exchange difference (107) (18) (74) – (199)
At 28 November 2010 10,842 5,029 3,262 159 19,292
Additions 1,591 1,032 363 41 3,027Disposals (964) (201) (461) (68) (1,694)Reclassification (note 10) (5) – 11 – 6Exchange difference 25 27 17 (1) 68
At 27 November 2011 11,489 5,887 3,192 131 20,699
Accumulated DepreciationAt 29 November 2009 9,370 2,101 1,890 140 13,501
Charge for the year 1,451 878 470 126 2,925Disposals (2,080) (38) (117) (169) (2,404)Exchange difference (91) (41) (45) – (177)
At 28 November 2010 8,650 2,900 2,198 97 13,845
Charge for the year 1,513 1,070 523 42 3,148Disposals (921) (178) (444) (69) (1,612)Exchange difference 12 34 9 – 55
At 27 November 2011 9,254 3,826 2,286 70 15,436
Net book value
At 27 November 2011 2,235 2,061 906 61 5,263
At 28 November 2010 2,192 2,129 1,064 62 5,447
Depreciation charge is included in ‘Administrative Expenses’ in the Consolidated income statement.

77SThree plc Report & financial statements 2011
Notes to the FiNaNcial statemeNts
10 Intangible assets
Software and Intangible system assets under Computer development Goodwill construction software costs Trademarks Total £’000 £’000 £’000 £’000 £’000 £’000
CostAt 29 November 2009 206,935 1,328 2,766 13,750 71 224,850
Additions – 2,270 652 – – 2,922Disposals – – (1) – – (1)Reclassification (note 9) – (1,885) – 1,614 – (271)
At 28 November 2010 206,935 1,713 3,417 15,364 71 227,500
Additions – 1,872 914 87 – 2,873Disposals – – (99) – – (99)Reclassification (note 9) – (2,500) (6) 2,500 – (6)Exchange difference – – (8) 27 – 19
At 27 November 2011 206,935 1,085 4,218 17,978 71 230,287
Accumulated Amortisation and ImpairmentAt 29 November 2009 205,687 – 2,327 5,876 61 213,951
Charge for the year – – 385 3,000 3 3,388
At 28 November 2010 205,687 – 2,712 8,876 64 217,339
Charge for the year – – 740 3,770 1 4,511Disposals – – (88) – – (88)Exchange Difference – – (47) 24 – (23)
At 27 November 2011 205,687 – 3,317 12,670 65 221,739
Net book value
At 27 November 2011 1,248 1,085 901 5,308 6 8,548
At 28 November 2010 1,248 1,713 705 6,488 7 10,161
Amortisation charge is included in ‘Administrative Expenses’ in the Consolidated income statement.
GoodwillThe net book values at 27 November 2011 and 28 November 2010 are as follows:
Net book value Group’s 2011 2010Investment in shareholding £000 £000
SThree Staffing UK Limited 100% 833 833Jobboard Enterprises Limited 80% 415 415
1,248 1,248

SThree plc78 Report & financial statements 2011
Notes to the FiNaNcial statemeNts
Impairment of goodwillGoodwill has been tested for impairment by comparing the carrying amount of each cash-generating unit, including goodwill, with the recoverable amount of that cash-generating unit based on value in use. A cash-generating unit is the smallest identifiable group of assets that generates cash inflows that are largely independent of the cash inflows from other assets or groups of assets.
In assessing the value in use, the estimated future cash flows are calculated by preparing cash flow forecasts derived from the most recent financial budgets and an average annual growth rate of 5% over the next five years. A terminal value of the cash flow is then calculated by assuming growth of 3%, which does not exceed the long-term average growth rate of the relevant markets discounted using the Group’s weighted average cost of capital. If the recoverable amount of the cash generating-unit is less than the carrying value, then an impairment loss is recognised in the income statement.
Software and system development costIn 2008, the Group began a phased rollout of a Customer Relationship Management (‘CRM’) system to complement the front-office system. Further costs directly attributable to the development of the new systems have been capitalised during the year.
During the year the Group introduced a new flexible and scaleable consolidation, budgeting and forecasting system. As the company grows internationally, this new system addresses the need to be able to consolidate, budget and produce rolling forecasts for legal entities across an increasing number of jurisdictions which places even greater importance on the use of a flexible tool that can accommodate change and deliver speed of reporting. A further addition is the development of an enterprise datawarehouse system in conjunction with the introduction of an advanced set of interrogation, reporting and analytical tools to create a common and improved reporting environment.
Recoverable amountsThe recoverable amounts used for impairment testing of intangible fixed assets is based on value-in-use calculations using a pre-tax discount rate based on the Group‘s weighted average cost of capital of 10.2% (2010: 9.5%). The Group has used the same discount rate for each cash generating unit as they are all considered to have the same risk profile. The future cash flow projections are based on approved financial budgets. Average growth rates used to estimate cash flows for the first five years are in line with Board approved forecasts, with the growth rate assumption thereafter limited to the expected growth rate of the local economy.
11 Investments in subsidiaries
Shares in subsidiariesCompany £’000
CostAt 29 November 2009 248,141Capital contribution relating to share based payments (IFRS 2) 1,316Additions— Increase in investments 6,089— Repurchase of non-controlling interest 135— Disposal of investments (374)— Group Reorganisation (1,397)
At 28 November 2010 253,910Capital contribution relating to share based payments (IFRS 2) 1,434Additions— Repurchase of tracker sharesi) 232— Disposal of tracker sharesi) (213)— Group reorganisationii) (103)
At 27 November 2011 255,260
10 Intangible assets (continued)

79SThree plc Report & financial statements 2011
Notes to the FiNaNcial statemeNts
Provision for impairmentAt 27 November 2011 and 28 November 2010 8,258
Net carrying valueAt 27 November 2011 247,002
At 28 November 2010 245,652
i) The repurchase and disposal of tracker share holdings related to the tracker share scheme within SThree UK Holdings Limited and SThree Overseas Holdings Limited as detailed in note 19 (c).
ii) During the year ended 28 November 2010, the Group further rationalised its structure by undertaking mergers and other legal restructuring steps, some of which did not formally take effect until 2011.
In accordance with IAS 36 ‘Impairment of assets’ the carrying values of the Company’s investments in subsidiaries have been allocated to their cash-generating units to assess their value in use. In assessing the value in use, the estimated future cash flows are calculated by preparing cash flow forecasts derived from the most recent financial budget and an average annual growth rate of 5% (2010: 5%). A terminal value of cash flow is then calculated by assuming growth of 3%, discounted using the Group’s weighted average cost of capital. If the recoverable amount of the cash generating-unit is less than the carrying value, then an impairment loss is recognised in the income statement. The pre-tax discount rate applied to projected future net cash flows to arrive at the valuation was 10.2% (2010: 9.5%).
IFRS 2 requires that any options or awards granted to employees of a subsidiary company for which no recharge is made will increase the carrying value of the investment held. In 2011, the Group has recognised an increase in the investments in its subsidiaries of £1.4m (2010: £1.3m) relating to these share options and awards.
Group ReorganisationAs part of the reorganisation during the year ended 28 November 2010, the Group undertook a share for share exchange for most of the non-controlling interests held. There was no material effect from the share transfers and no effect on the Group cashflow position. These subsidiaries were subsequently transferred by way of a share exchange to either SThree UK Holdings Limited or SThree Overseas Holdings Limited. During the current year there were further movements in the remaining non-controlling interests.
In 2011, the movements in the investment relates to the following: Group’s shareholding After Before acquisition/Repurchase and disposals of non-controlling interest acquisition disposal
Jobboard Enterprises Limited 85% 80%Orgtel Contract Limited 79.5% 100%Orgtel Limited 80% 93%
11 Investments in subsidiaries (continued)

SThree plc80 Report & financial statements 2011
Notes to the FiNaNcial statemeNts
Investments comprise the following principal subsidiary trading companies: Shareholding Country of 2011 2010 incorporation Principal Activity
SThree Australia Pty Limited 100% 100% Australia RecruitmentComputer Futures Solutions NV 100% 100% Belgium RecruitmentHuxley Associates Belgium NV 100% 100% Belgium RecruitmentSThree Services NV 100% 100% Belgium RecruitmentSThree Belgium NV 100% 100% Belgium RecruitmentSpecialist Staffing Solutions Recrutamento Ltda 100% 0% Brazil RecruitmentSThree SAS 100% 100% France RecruitmentJobboard Enterprises GmbH 100% 100% Germany RecruitmentSThree GmbH 100% 100% Germany RecruitmentSThree Limited 100% 100% Hong Kong RecruitmentSThree India Private Limited 100% 100% India RecruitmentSThree Staffing Ireland Limited 100% 100% Ireland RecruitmentSThree S.a.r.l. 100% 0% Luxembourg RecruitmentJobboard Enterprises BV 100% 100% Netherlands RecruitmentSThree Holdings BV 100% 100% Netherlands RecruitmentSThree Qatar LLC 100% 0% Qatar RecruitmentSThree Pte. Ltd. 100% 100% Singapore RecruitmentSThree Switzerland GmbH 100% 0% Switzerland RecruitmentHuxley Associates Banking & Finance Limited 100% 100% UK RecruitmentHuxley Associates Global Limited 100% 100% UK RecruitmentHuxley Associates Limited 100% 100% UK RecruitmentJobboard Enterprises Limited 80% 85% UK RecruitmentOrgtel Contract Limited 100% 79.5% UK RecruitmentOrgtel Limited 93% 80% UK RecruitmentReal Staffing Group Limited 100% 100% UK RecruitmentSThree Finance Limited 100% 100% UK RecruitmentSThree IP Limited 100% 100% UK Holding CompanySThree Management Services Limited 100% 100% UK Management ServicesSThree Overseas Holdings Limited* 100% 100% UK Holding CompanySThree Staffing UK Limited 100% 100% UK RecruitmentSThree UK Holdings Limited* 100% 100% UK Holding CompanySThree Staffing Belgium Limited 100% 100% UK RecruitmentSThree Staffing France Limited 100% 100% UK RecruitmentSThree Staffing Germany Limited 100% 100% UK RecruitmentSThree Staffing Nederland Limited 100% 100% UK RecruitmentSpecialist Staffing Solutions, Inc 100% 100% USA Recruitment* Directly held subsidiaries. All other subsidiaries are indirectly held.
Non-controlling interests remain in respect of two (2010: three) companies at the year end. The aggregate profit and net assets attributable to these non-controlling interest holders has not been separately recognised in the financial statements on the basis of materiality.
Non-controlling interest rightsIn the event of a return of capital in a winding up or capital reduction the non-controlling interest holding reverts to the ‘right to dividend’ percentage in any distribution.
11 Investments in subsidiaries (continued)

81SThree plc Report & financial statements 2011
Notes to the FiNaNcial statemeNts
12 Trade and other receivables
Group Company 27 November 28 November 27 November 28 November 2011 2010 2011 2010 £’000 £’000 £’000 £’000
CurrentTrade receivables 71,945 64,862 – 3Less: Provision for impairment of trade receivables (1,487) (1,767) – –
Net trade receivables 70,458 63,095 – 3
Other receivables 6,670 3,806 1,021 154Amounts due from Group Companies – – 7,325 –Prepayments and accrued income 33,965 31,034 – –
111,093 97,935 8,346 157
Trade receivables do not carry interest. The Group makes judgements on an entity by entity basis as to its ability to collect outstanding receivables and provides an allowance for doubtful accounts based on a specific review of significant outstanding invoices. For those invoices not specifically reviewed, provisions are provided at differing percentages based on the age of the receivable. In determining these percentages, the Group analyses its historical collection experience and current economic trends. Trade receivable balances are written off when the Group determines that it is unlikely that future remittances will be received. Management considers the carrying values of trade and other receivables are equal to the fair value and are deemed to be current assets.
Trade receivables and cash and cash equivalents are deemed to be all current loan and receivables for disclosure under IFRS 7 ‘Financial Instruments’ – Disclosures (note 25). Group 27 November 28 November 2011 2010 £’000 £’000
The following table shows the movement of allowances on receivables:
Allowances at start of financial year 1,767 2,473Charge for the year 628 686Amounts written off during the year (503) (917)Amounts recovered during the year (405) (475)
Allowances at end of financial year 1,487 1,767
13 Assets classified as held-to-maturity
Group 27 November 28 November 2011 2010 £’000 £’000
Fixed rate Sterling Deposit – 3,500
At 28 November 2010 the Group had invested in a fixed rate Sterling deposit which matured on 23 May 2011. The Group has not reinvested in a fixed rate bond at 27 November 2011.
14 Current tax assets/liabilities
The current tax liability of £2.3m (2010: tax liability of £3.8m) for the Group and the current tax liability of nil (2010: nil) for the Company represent current tax payable relating to current and prior periods respectively.

SThree plc82 Report & financial statements 2011
Notes to the FiNaNcial statemeNts
15 Trade and other payables
Group Company 27 November 28 November 27 November 28 November 2011 2010 2011 2010 £’000 £’000 £’000 £’000
Trade payables 33,294 29,961 26 25Amounts due to Group companies – – 1,076 65,634Other taxes and social security 10,082 8,655 208 –Other payables 5,471 2,039 367 449Accruals 46,714 45,495 206 895
95,561 86,150 1,883 67,003
All amounts detailed above are payable within one year. The fair values of trade and other payables are not materially different from those disclosed above.
Trade and other payables are predominantly interest free.
Amounts due to Group companies are charged interest at an average rate of 2.3% (2010: 1.5%) for Sterling denominated balances and at 1.75% above the local base rate for other currencies.
16 Financial liabilities
Group Company 27 November 28 November 27 November 28 November 2011 2010 2011 2010 £’000 £’000 £’000 £’000
Bank overdraft – – 23,750 445
A flexible invoice financing arrangement is in place with the Royal Bank of Scotland Group (RBS) until April 2012. Under this arrangement the Group is able to borrow up to £20m. Funds borrowed under this facility bear interest at the rate of 1.75% above the RBS base rate. The Group has not drawn down any amount on this facility. On 19 January 2012, the Company signed a committed revolving credit facility of £20m with Royal Bank of Scotland which expires in January 2017.
(i) Maturity profile of bank overdrafts Group Company 27 November 28 November 27 November 28 November 2011 2010 2011 2010 £’000 £’000 £’000 £’000
Within 1 year, or on demand – – 23,750 445
(ii) Interest rate risk profile of bank overdrafts
The interest rate risk profile of bank overdrafts is as follows: Group Company 27 November 28 November 27 November 28 November 2011 2010 2011 2010 £’000 £’000 £’000 £’000
Floating rate – overdraft – – 23,750 445
The Group has a cash pooling arrangement which allows netting off the overdraft balances to mitigate finance costs.

83SThree plc Report & financial statements 2011
Notes to the FiNaNcial statemeNts
17 Provisions for liabilities and charges
Tracker Property shares Legal Total £’000 £’000 £’000 £’000
At 28 November 2010 1,764 3,382 445 5,591Utilised during the year (28) (336) – (364)Charged/(released) to the income statement 95 – (264) (169)Tracker share consideration – 1,514 – 1,514
At 27 November 2011 1,831 4,560 181 6,572
27 November 28 November 2011 2010Current/non-current analysis: £’000 £’000
Current liabilities 4,894 4,237Non-current liabilities 1,678 1,354
6,572 5,591
Provisions are not discounted as the Group believes that the effect of the time value of money is immaterial and the amount of provisions measured at cost approximate to the present value of the expenditure required to settle the obligation.
PropertyDilapidations — the Group is obliged to pay for dilapidations at the end of its tenancy of various properties. Provision has been made based on independent professional estimates and historical experience of the likely costs based on current conditions and these have been spread over the relevant lease term. The liability is expected to crystallise as follows:
27 November 28 November 2011 2010 £’000 £’000
Within one year 153 410One to five years 1,178 903After five years 500 451
1,831 1,764
Tracker sharesThis provision relates to the obligation to repay amounts received or receivable in relation to the subscription of tracker shares offered to certain employees under the terms of the tracker share arrangements (see note 19 on page 84). The timing of economic outflows is subject to factors relating to each tracker holder.
LegalThe provision relates to ongoing legal matters and the timing of economic outflows is subject to the factors governing each legal case.
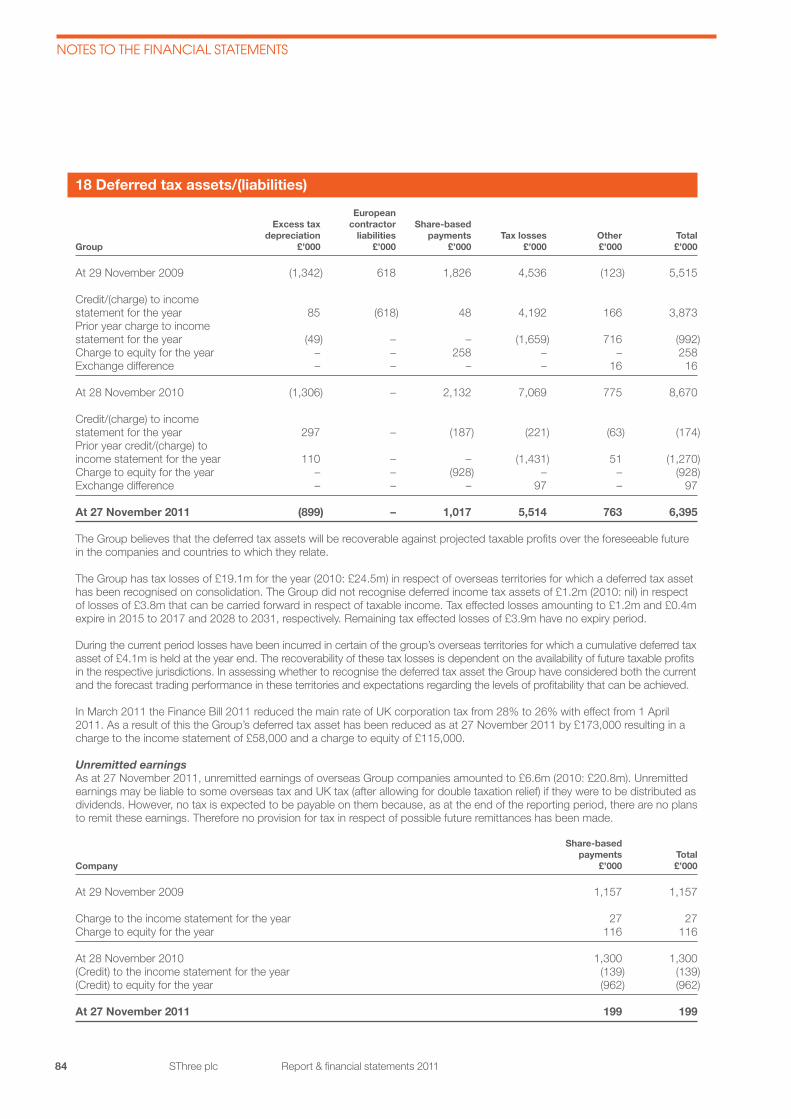
SThree plc84 Report & financial statements 2011
Notes to the FiNaNcial statemeNts
18 Deferred tax assets/(liabilities)
European Excess tax contractor Share-based depreciation liabilities payments Tax losses Other TotalGroup £’000 £’000 £’000 £’000 £’000 £’000
At 29 November 2009 (1,342) 618 1,826 4,536 (123) 5,515
Credit/(charge) to incomestatement for the year 85 (618) 48 4,192 166 3,873Prior year charge to incomestatement for the year (49) – – (1,659) 716 (992)Charge to equity for the year – – 258 – – 258Exchange difference – – – – 16 16
At 28 November 2010 (1,306) – 2,132 7,069 775 8,670
Credit/(charge) to incomestatement for the year 297 – (187) (221) (63) (174)Prior year credit/(charge) toincome statement for the year 110 – – (1,431) 51 (1,270)Charge to equity for the year – – (928) – – (928)Exchange difference – – – 97 – 97
At 27 November 2011 (899) – 1,017 5,514 763 6,395
The Group believes that the deferred tax assets will be recoverable against projected taxable profits over the foreseeable future in the companies and countries to which they relate.
The Group has tax losses of £19.1m for the year (2010: £24.5m) in respect of overseas territories for which a deferred tax asset has been recognised on consolidation. The Group did not recognise deferred income tax assets of £1.2m (2010: nil) in respect of losses of £3.8m that can be carried forward in respect of taxable income. Tax effected losses amounting to £1.2m and £0.4m expire in 2015 to 2017 and 2028 to 2031, respectively. Remaining tax effected losses of £3.9m have no expiry period.
During the current period losses have been incurred in certain of the group’s overseas territories for which a cumulative deferred tax asset of £4.1m is held at the year end. The recoverability of these tax losses is dependent on the availability of future taxable profits in the respective jurisdictions. In assessing whether to recognise the deferred tax asset the Group have considered both the current and the forecast trading performance in these territories and expectations regarding the levels of profitability that can be achieved.
In March 2011 the Finance Bill 2011 reduced the main rate of UK corporation tax from 28% to 26% with effect from 1 April 2011. As a result of this the Group’s deferred tax asset has been reduced as at 27 November 2011 by £173,000 resulting in a charge to the income statement of £58,000 and a charge to equity of £115,000.
Unremitted earningsAs at 27 November 2011, unremitted earnings of overseas Group companies amounted to £6.6m (2010: £20.8m). Unremitted earnings may be liable to some overseas tax and UK tax (after allowing for double taxation relief) if they were to be distributed as dividends. However, no tax is expected to be payable on them because, as at the end of the reporting period, there are no plans to remit these earnings. Therefore no provision for tax in respect of possible future remittances has been made.
Share-based payments TotalCompany £’000 £’000
At 29 November 2009 1,157 1,157
Charge to the income statement for the year 27 27Charge to equity for the year 116 116
At 28 November 2010 1,300 1,300(Credit) to the income statement for the year (139) (139)(Credit) to equity for the year (962) (962)
At 27 November 2011 199 199

85SThree plc Report & financial statements 2011
Notes to the FiNaNcial statemeNts
19 Share Capital and reserves
(a) Share Capital and reserves 27 November 28 November 2011 2010 Number of Number ofAuthorised shares £’000 shares £’000
Ordinary shares of 1p each 300,000,000 3,000 300,000,000 3,000
Capital redemption Capital Treasury Ordinary reserve reserve reserve TotalAllotted and fully paid Number shares £’000 £’000 £’000 £’000
At 28 November 2010 121,759,579 1,218 168 878 – 2,264Issue of share capital 1,248,000 12 – – – 12Repurchase of own shares (3,183,897) – – – (7,908) (7,908)
At 27 November 2011 119,823,682 1,230 168 878 (7,908) (5,632)
Share issueDuring the year 1,248,000 (2010: 3,303) ordinary shares were issued to satisfy share option obligations.
Treasury reserveDuring the year, as part of the share buy-back programme, SThree plc purchased 3,183,897 of its own shares to be held as Treasury Shares. The average price paid per share was 248.39p and the total consideration was £7,908,000. An amount of £351,000 is under an irrevocable purchase agreement and is included in accruals at the year end.
(b) Share optionsCertain employees hold options to subscribe for ordinary shares in the Company under the share option schemes. The number of shares subject to options, the period in which they were granted and the period in which they may be exercised are given below. During this financial year 1,067,032 (2010: 337,127) of these options were exercised.
Number Number of options of options outstanding outstanding Exercise 28 November Granted Exercised Lapsed 27 November price ExerciseYear of grant Note 2010 in year in year in year 2011 per share period
2008 a 951,516 – 924,912 14,104 12,500 – 2011-20182008 Dividends b – 142,120 142,120 – – –2009 c 1,504,929 – – 114,114 1,390,815 – 2012-2019 £1 & 272.2p &2010 d 1,262,900 – – 221,123 1,041,777 299.4p* 2013-20202011 e – 1,020,264 – 33,766 986,498 371.3p** 2014-2021
* The exercise price relates to approved options (276,979 options at 299.4p per share; 11,021 options at 272.2p per share) and funding shares (288,000 options at £1) and the remainder at nil per share under the relevant scheme.
** The exercise price relates to approved options (126,054 options at 371.3p per share), unapproved options (768,156 at nil per share) and funding shares (126,054 at £1 per share) under the relevant scheme.
NotesLong-term incentive plan (LTIP)In November 2006, shareholders approved a share-based LTIP. In February 2010, awards for all LTIP participants were structured to include tax approved options, with funding awards also being granted at an option price of £1 in respect of the total award. On 19 October 2010, the company introduced a Joint Ownership Plan (‘JOP’) in respect of the unapproved LTIP awards made in February 2010. JOP options over existing LTIP awards were granted to participants at 60p per share. The main features of the LTIP are detailed within the Director’s Remuneration Report.
a) The weighted average fair value of the equity-settled share awards granted in 2008 amounted to 117.42p per award. The average share price on the date of grant was 196.75p, the vesting period in which performance of the TSR is assessed is 3 years.

SThree plc86 Report & financial statements 2011
Notes to the FiNaNcial statemeNts
b) Participants in the LTIP schemes are entitled to the value of dividends that are paid during the vesting period on the number of shares that ultimately vest in the form of additional shares transferred at the end of the vesting period. In 2011, 142,120 share awards were granted as dividends on the 2008 share option scheme. These were exercisable im-mediately with all of them being exercised during the year. The fair value of these equity-settled share awards amounted to 402.5p per award, equal to the average share price on the grant date.
c) The weighted average fair value of the equity-settled share awards granted during 2009 amounted to 110.99p per award. The average share price on the date of grant was 170.0p, the vesting period in which performance of the TSR is assessed is 3 years.
d) The weighted average fair value of the equity-settled share awards granted during 2010 amounted to 261.50p per award. The average share price on the date of grant was 310.0p, the vesting period in which performance of the TSR and EPS are assessed is 3 years.
e) The weighted average fair value of the equity-settled share awards granted during the year amounted to 324.50p per award. The Monte Carlo option pricing model has been used to fair value these awards. The average share price on the date of grant was 383.0p, the vesting period in which performance of the TSR and EPS are assessed is 3 years.
During the year the Group recognised a cost of £1.9m (2010: £1.5m) in relation to the LTIP.
Other employees share option schemes SAYE SIP Total £’000 £’000 £’000
At 28 November 2010 96 204 300Granted 213 325 538Lapsed – (21) (21)
At 27 November 2011 309 508 817
Save as you Earn (SAYE)The SAYE share option scheme was approved by the shareholders on 24 April 2009. All UK employees and Executive Directors who have continuous service of more than six months, ending on the date of grant, or such shorter period as the Board may decide, with the Company, or any subsidiary in the Group nominated to join in the SAYE, are eligible to participate in the scheme. The Board has discretion to reduce the period of qualifying service and to invite other employees of the Group to participate. Under the SAYE, employees can save up to £250 per month for three years and receive options to purchase the Company’s shares at a discount of up to 20% on the market value. During 2011, 187 employees (2010: 129 employees) applied to participate in the SAYE. Options awarded under the SAYE scheme are not subject to any performance conditions.
For the purpose of valuing options to arrive at the share-based payment charge, the Binomial option pricing model has been used for schemes with total shareholder return performance targets. The assumptions used in the model for the 2011 year are as follows:
Weighted average fair value (£) 56.91pKey assumptions used:Weighted average share price 245.00pExercise prices (£) 196.00pRange of expected volatility 31%Risk-free interest rate 3.75%Range of expected option term 3 yearsDividend yield 4.90%
During the year, the Group recognised a cost of £0.2m (2010: nil) in relation to the SAYE scheme.
Share Incentive Plan (SIP)The SIP was approved by shareholders on 24 April 2009. Under the SIP employees are invited to make contributions to buy Partnership Shares. If an employee agrees to buy Partnership Shares the company currently matches the number of Partnership Shares bought with an award of shares (Matching Shares), on a one-for-one basis.
Assumptions on expected volatility and expected option term have been made on the basis of historical data, wherever available, for the period corresponding with the vesting period of the option. Best estimates have been used where historical data is not available in this respect.
19 Share Capital and reserves (continued)
(b) Share options (continued)

87SThree plc Report & financial statements 2011
Notes to the FiNaNcial statemeNts
During the year, the Group recognised a cost of £0.3m (2010: £0.2m), in relation to the SIP. The weighted average price paid for plan shares during the year was 346.0p (2010: 302.85p).Employee benefit trust (EBT)In addition to the share options set out above the Company has issued further share options and awards which will be satisfied by shares held by the Group’s EBT. The shares held by the EBT are shown as a deduction from shareholders’ funds.
The EBT waive their rights to receive a dividend under the terms of the trust. No other shareholder waives their rights to dividends.
Ordinary shares Number
28 November 2010 1,862,127
Movement in the year New shares issued 1,248,000 LTIP options exercised (1,067,032) Options/awards exercised (826,550) Other (36,920)
27 November 2011 1,179,625
The shares held in trust include shares newly issued to satisfy awards under the share option schemes and LTIP.
Options granted and awards to be settled by shares held in the EBT are as follows:
Number of Number of options/awards options/awards outstanding Granted/ outstanding Exercise Year of 28 November awards Exercised Lapsed 27 November price Exercisegrant/award Note 2010 in year in year in year 2011 per share period
2004 a 1,051,400 – 826,550 224,850 – 1p 2004-2014*
2005 b 1,700 – – – 1,700 £1 total 2005-2015*
* Providing certain conditions have been met at the time of exercise
The weighted average market share price for shares exercised during the year was 346p (2010: 295p).
Approved executive share option schemeOptions over 5.25 million ordinary shares were granted by the Board to certain employees on 3 December 2004. These were exercisable within 10 years from the date of grant. These options were subject to a performance condition requiring that over a five year period a certain level of profits has to be achieved.
Unapproved share option schemeAt IPO (16 November 2005), the Board awarded 433,749 Ordinary Shares and issued 505,710 share options to certain current and former employees who were considered to have contributed to the Group’s continued success. The share options are exercisable immediately upon grant and expire 10 years from the date of grant. The Group recognised a charge in the income statement for the year ended 30 November 2005, in accordance with IFRS 2, amounting to £1,878,918 representing the fair value of the options awarded at the date of grant.
(c) Share awards in subsidiary companies (previously ‘Non-controlling interest’)
As described in the Directors’ report the Group makes awards of shares in subsidiary businesses to certain entrepreneurial employees who will participate in the development of those businesses.
19 Share Capital and reserves (continued)
(b) Share options (continued)

SThree plc88 Report & financial statements 2011
Notes to the FiNaNcial statemeNts
These awards generally have the following characteristics:– an employee receives an award of a “tracker share’’ in a subsidiary business. This share gives the employee certain rights to
income and capital growth of a “tracked’’ business;
– the employee must subscribe for his/her award of tracker shares at fair value, as determined by an independent third party share valuer and taking into account the particular rights attached to the shares described in the relevant businesses’ Articles of Association. The value takes into consideration factors such as the size and trading record of the underlying business, budget projections, expected distribution rates, as well as the external market, sector and country data. The external valuer is supplied with detailed analysis down to Profit Before Tax. Using this information an independent calculation of the initial Equity Value (EV) is completed based on ratio analysis and modelling of financial information extracted from a sample of comparable quoted stocks. This EV is then discounted down to take account of small scale risk, minority status, share liquidity and the absence of voting rights to arrive at a valuation. A number of awards were granted in the year and, although the methodology for calculating the EVs was applied consistently, the data used varied depending on the business and timing of the grant date;
– if the employee remains in employment with the Group for a pre-agreed period, not less than three years, he/she may then offer his/her tracker shares for sale to SThree plc. Should SThree plc decide to buy back the tracker shares, it will do so at a price based on a multiple of the tracker shares’ fair value at that date and SThree plc may settle this transaction in cash or in SThree plc shares, as it chooses. The current policy is to settle in shares. During the period of tracker share ownership, the employee may be entitled to a cash distribution at the discretion of the Group;
– if the employee leaves the Group before the pre-agreed period, being not less than three years depending on the life of the tracker, he/she is entitled to receive the lower of the initial subscription amount he/she contributed or the fair value on the date of his/her departure as set out under the relevant businesses’ Articles of Association. A provision relating to the obligation to repay amounts received or receivable in relation to tracker shares is recognised;
– employees may receive loans from the Group to pay for their tracker shares, on which interest is accrued. These loans are included within other receivables.
Tracker share arrangements:
Number of Number of Number of Number of awards awards awards bought awards outstanding created back/redeemed outstanding 30 November during the during the 28 November 2009 year year 2010
Tracker share awards made – 2010 1,466 22,313 (105) 23,674
Number of Number of Number of Number of awards awards awards bought awards outstanding created back/redeemed outstanding 28 November during the during the 27 November 2010 year year 2011
Tracker share awards made – 2011 23,674 2,742 (492) 25,924
As employees must subscribe for the awards at fair value there is no IFRS 2 charge. The total net subscription consideration received for 2011 tracker share awards was £135,000 (2010: £435,000), with proceeds in respect of individual awards ranging from £479 to £87,589 (2010: £283 to £48,850). The Group also bought back 289 (2010: 105) tracker shares during the year for a total consideration of £231,254 (2010: £33,719).
20 Results of holding company
A profit of £70.5m (2010: £8.1m) was recorded for the year ended 27 November 2011. The Directors have taken advantage of the exemption available under Section 408 of the Companies Act 2006 and do not present an income statement or a statement of comprehensive income for the Company alone.
19 Share Capital and reserves (continued)
(c) Share awards in subsidiary companies (previously ‘Non-controlling interest’) (continued)
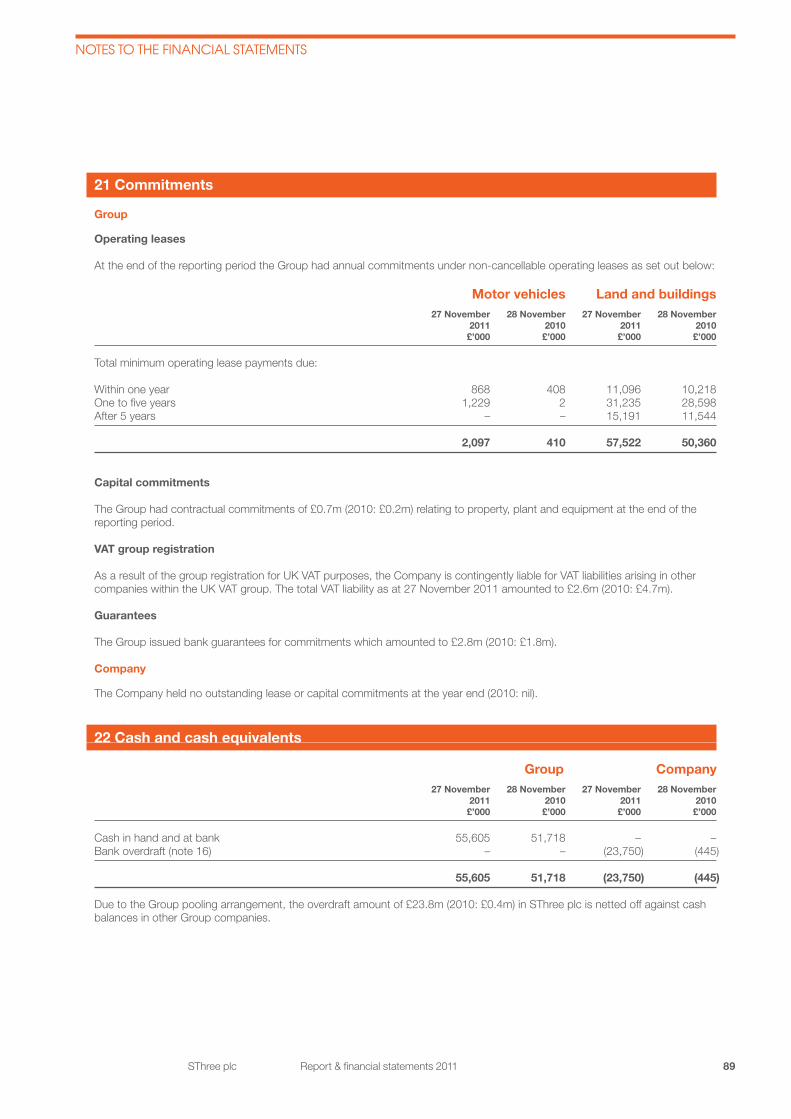
89SThree plc Report & financial statements 2011
Notes to the FiNaNcial statemeNts
21 Commitments
Group
Operating leases
At the end of the reporting period the Group had annual commitments under non-cancellable operating leases as set out below:
Motor vehicles Land and buildings 27 November 28 November 27 November 28 November 2011 2010 2011 2010 £’000 £’000 £’000 £’000
Total minimum operating lease payments due:
Within one year 868 408 11,096 10,218One to five years 1,229 2 31,235 28,598After 5 years – – 15,191 11,544
2,097 410 57,522 50,360
Capital commitments
The Group had contractual commitments of £0.7m (2010: £0.2m) relating to property, plant and equipment at the end of the reporting period.
VAT group registration
As a result of the group registration for UK VAT purposes, the Company is contingently liable for VAT liabilities arising in other companies within the UK VAT group. The total VAT liability as at 27 November 2011 amounted to £2.6m (2010: £4.7m).
Guarantees
The Group issued bank guarantees for commitments which amounted to £2.8m (2010: £1.8m).
Company
The Company held no outstanding lease or capital commitments at the year end (2010: nil).
22 Cash and cash equivalents
Group Company 27 November 28 November 27 November 28 November 2011 2010 2011 2010 £’000 £’000 £’000 £’000
Cash in hand and at bank 55,605 51,718 – –Bank overdraft (note 16) – – (23,750) (445)
55,605 51,718 (23,750) (445)
Due to the Group pooling arrangement, the overdraft amount of £23.8m (2010: £0.4m) in SThree plc is netted off against cash balances in other Group companies.

SThree plc90 Report & financial statements 2011
Notes to the FiNaNcial statemeNts
23 Related party transactions
Group
The Group has related party relationships with its subsidiaries (note 11), with its Directors and with members of the Executive Board. Details of transactions between the Group and other related parties are disclosed below.
Key management personnel
The key management under IAS 24 ‘Related party disclosure’ is defined as those persons who have authority and responsibility for planning, directing and controlling the entity’s activities, directly or indirectly. The Group’s key management comprises of the Executive Directors, Non-Executive Directors, Executive Committee and other key managers who are deemed to influence the day to day activities. Details of Directors’ remuneration, which are determined by the SThree plc Remuneration Committee in accordance with its stated policy, are given in the Directors’ Remuneration Report. Total remuneration for members of key management is detailed below.
27 November 28 November 2011 2010 £’000 £’000
Salaries and other short-term benefits 4,108 4,124Fair value of share awards granted 1,698 1,271Post-employment benefits 143 196Termination benefits 322 –
6,271 5,591
Company
The Company has related party relationships with its subsidiaries (note 11) and with members of the Executive Board. The Directors receive remuneration from the Company which is disclosed in the Directors’ Remuneration Report. The Company did not have any transactions with the Directors during the financial year other than those disclosed in the Remuneration Report. Details of transactions between the Company and other related parties are disclosed below.
27 November 28 November 2011 2010 £’000 £’000
Loans and advances given to and dividends received from subsidiaries
Loans and advances given to subsidiaries 64,558 –Loans and advances given to directors 470 305Interest income received in respect of interest bearing loans and advances 56 70Dividend income received 60,000 13,201
Loans and advances received from subsidiaries
Loans and advances received from subsidiaries – (13,183)Interest expense paid in respect of interest bearing loans and advances (1,203) (976)
Year end balances arising from transactions with subsidiaries
27 November 28 November 2011 2010 £’000 £’000
Amounts payable to subsidiary companies (1,076) (65,634)Amounts due from subsidiary companies 7,325 –

91SThree plc Report & financial statements 2011
Notes to the FiNaNcial statemeNts
24 Subsequent events
On 19 January 2012, the Company signed a committed revolving credit facility with Royal Bank of Scotland which expires in January 2017. The Group does not have any other events after the end of the reporting period that require disclosure as at 27 January 2012.
25 Financial instruments and financial risk factors
Financial risk factors
The Group reports in Sterling and pays dividends out of Sterling profits. The role of Corporate Treasury is to manage and monitor external and internal funding requirements and financial risks in support of corporate objectives. Treasury activities are governed by policies and procedures approved by the Board of Directors. Treasury management, chaired by our Chief Financial Officer, meets on a monthly basis to review treasury activities. Its members receive management information relating to treasury activities. Our internal auditors regularly review the Treasury internal control environment.
In previous years, Group treasury entered into a small amount of derivative transactions, principally currency swaps and forward currency contracts with the purpose of managing the currency risks arising from operations and financing. The Board undertook a review of its currency hedging strategy to ensure it is appropriate and currently does not actively manage its exposure to foreign exchange risk by the use of financial instruments. The Group does not hold or issue derivative financial instruments for speculative purposes and our Treasury policies specifically prohibit such activity. All transactions in financial instruments are undertaken to manage the risks arising from underlying business activities, not for speculation.
The treasury function is managed as a cost centre and thus not engaged in speculative trading.
The Group is exposed to a number of different financial risks including foreign currency exchange rates, liquidity, interest rates, and credit risk. The Group’s objective and strategy in responding to these risks is set out below.
(a) Capital risk management The Group’s objectives when managing capital are to safeguard the group’s ability to continue as a going concern in order
to provide returns for shareholders and benefits for other stakeholders and to maintain an optimal capital structure to reduce the cost of capital.
In order to maintain or adjust the capital structure, the group may adjust the amount of dividends paid to shareholders, return capital to shareholders, issue new shares or sell assets to reduce debt.
The Group has net cash of £55.6m (2010: £55.2m) and holds no debt. On 19 January 2012, the Company signed a committed revolving credit facility of £20m with Royal Bank of Scotland which expires in January 2017. Total capital at 27 November 2011 was:
27 November 28 November 2011 2010 £’000 £’000
Cash 55,605 51,718Fixed rate sterling deposit – 3,500Total equity 82,467 81,918
Total capital 138,072 137,136
(b) Foreign currency exchange risk The Group publishes its consolidated financial statements in Sterling and conducts business in a number of other
currencies, principally the Euro. Consequently the Group is exposed to foreign exchange risk due to exchange rate movements which affect the Group‘s transactional revenues, cost of sales, the translation of the earnings and net assets of its overseas operations.
The Group is also exposed to foreign currency exchange risk from the value of net investments outside the United Kingdom. The settlement of intercompany balances held with foreign operations is neither planned nor likely to occur in the foreseeable future. Therefore, exchange differences arising from the translation of the net investments are taken into equity.

SThree plc92 Report & financial statements 2011
Notes to the FiNaNcial statemeNts
The Group’s businesses generally raise invoices and incur expenses in their local currencies. Local currency cash generated is remitted via intercompany transfers to the United Kingdom. The Group generally converts foreign currency balances into Sterling to manage its cash flows.
The anticipated impact on the Group‘s results if the Euro strengthened against Sterling by a movement of more than 10% in terms of translational exposure amounts to an increase in profit before tax by £3.5m (2010: £2.8m). If the Euro weakened against Sterling by more than 10% this would result in a decrease in profit before tax of £3.5m (2010: £2.8m). 10% was used on the assumption that rates are not likely to move by more/less than this percentage given the history during the year.
The table below provides exchange rates used by the Group for translation of the earnings and net assets of its overseas operations.
Weighted average rate Closing rate 2011 2010 2011 2010 £ £ £ £
Euro 0.8698 0.8691 0.8577 0.8499US dollar 0.6247 0.6458 0.6479 0.6417Hong Kong dollar 0.0803 0.0832 0.0831 0.0827Australian dollar 0.6431 0.5852 0.6295 0.6193Singapore dollar 0.4959 0.4695 0.4935 0.4865
(c) Liquidity risk
The Group actively maintains committed facilities to enable it to finance its day-to-day operations, based on cash flow projections. The Group invests surplus cash in interest-earning deposit accounts or bonds with UK and European banks (note 13), and complied with all its covenants in the year.
The Group’s treasury function centrally co-ordinates relationships with banks, borrowing requirements, foreign exchange requirements and cash management. The Group believes it has access to sufficient funding through an invoice financing arrangement that provides a committed borrowing facility of £20m and expires in April 2012. On 19 January 2012, the Company signed a committed revolving credit facility of £20m with Royal Bank of Scotland which expires in January 2017.
The table below shows the maturity profile of the Group’s financial liabilities based on the contractual amounts payable on the date of repayment:
Trade and other payables Bank overdraft
Group Company Group Company
At 27 November 2011 £’000 £’000 £’000 £’000
Within one year 85,479 1,675 – 23,750
At 28 November 2010
Within one year 77,495 67,003 – 445
(d) Interest rate risk
The Group is also exposed to interest rate risk from the possibility that changes in interest rates will affect future cash flows or the fair values of its financial instruments, principally financial liabilities. The Group finances its operations through a mixture of retained profit, the invoice discounting facility and, when required, bank overdrafts.
The Group does not hedge the exposure to variations in interest rates presented by the above instruments.
Taking into consideration all variable rate borrowings and cash in place as at 27 November 2011, if the interest rate payable or receivable moved by 100 basis points in either direction then the effect to the Group would be minimal.
25 Financial instruments and financial risk factors (continued)
(b) Foreign currency exchange risk (continued)

93SThree plc Report & financial statements 2011
Notes to the FiNaNcial statemeNts
(e) Credit Risk
In the normal course of business, the Group participates in cash pooling arrangements with its counterparty bank. The maximum exposure with a single bank for deposits is £38m (2010: £30m). The Group will not accept any counterparty bank unless it has been awarded a minimum recognised credit rating of A3/ Prime-2 (Moody’s). The Group will permit exposures with individual counterparty banks and exposure types up to pre-defined limits as part of the Group treasury policy. Exposures to all transaction limits are monitored daily.
Trade and other receivables of the Group are analysed in the table below. With respect to the trade and other receivables that are neither impaired nor past due, there are no indications as of the reporting date that the debtors will not meet their payment obligations.
The Group mitigates its credit risk by using a credit rating agency to assess new clients and payment history to assess further credit extensions to existing clients. In addition, the spread of SME client base (circa 7,000 clients) helps to mitigate the risk of individual client failure having a material impact on the Group.
The Group does not typically renegotiate the terms of trade receivables, hence the outstanding balance is included in the analysis based on the original payment terms. There were no significant renegotiated balances outstanding at year end.
As of 27 November 2011, trade receivables of £23.9m (2010: £24.9m) were past due but not impaired. These relate to a number of independent customers for whom there is no recent history of default.
As of 27 November 2011, trade receivables of £3.0m (2010: £3.1m) were impaired.
The ageing analysis of these trade receivables is as follows:
2011 2010Trade receivables £’000 £’000
Neither impaired nor past due 45,044 36,868Not impaired and past due in the following periodswithin 30 days 18,950 19,85931 to 60 days 3,686 4,21161 to 90 days 1,284 821Impairedwithin 90 days 64 105over 90 days 2,917 2,998Provision (1,487) (1,767)
Total 70,458 63,095
25 Financial instruments and financial risk factors (continued)

SThree plc94 Report & financial statements 2011
Notes to the FiNaNcial statemeNts
(f) Interest rate profile of financial assets/(liabilities)
The following tables set out the exposure of financial assets and liabilities to either fixed interest rates, floating interest rates or no interest rates. The maturity profile of financial assets and liabilities exposed to interest rate risk in the table below indicates the contractual repricing and maturity dates of these interest rates.
Financial assets/(liabilities) Group Company Cash Held-to- and cash maturity Financial equivalents investments liabilitiesAt 27 November 2011 £’000 £’000 £’000
Less than one year 55,605 – (23,750)
Total interest-bearing 55,605 – (23,750)
Analysed as:Floating rate 55,605 – (23,750)Fixed rate – – –
Total interest-bearing 55,605 – (23,750)Non-interest-bearing – – –
Total 55,605 – (23,750)
At 28 November 2010 £’000 £’000 £’000
Less than one year 51,718 3,500 (445)
Total interest-bearing 51,718 3,500 (445)
Analysed as:Floating rate 51,718 – (445)Fixed rate – 3,500 –
Total interest-bearing 51,718 3,500 (445)Non-interest-bearing – – –
Total 51,718 3,500 (445)
As part of the presentation of market risks, IFRS 7 requires disclosure on how hypothetical changes in risk variables affect the price of financial instruments. Important risk variables are stock exchange prices or indices. As of 27 November 2011, the entity did not hold any material investments to be classified as ‘available for sale’ or as ‘held for trading’. Therefore there are no financial instruments which would be materially impacted by risk variables affecting the price of financial instruments.
(g) Currency profile of financial assets/(liabilities)
Functional currency of Group operations: Net foreign currency monetary assets Other Euro US Dollars Currencies TotalAt 27 November 2011 £’000 £’000 £’000 £’000
Sterling 203 66 734 1,003Other – 267 – 267
Total 203 333 734 1,270
25 Financial instruments and financial risk factors (continued)
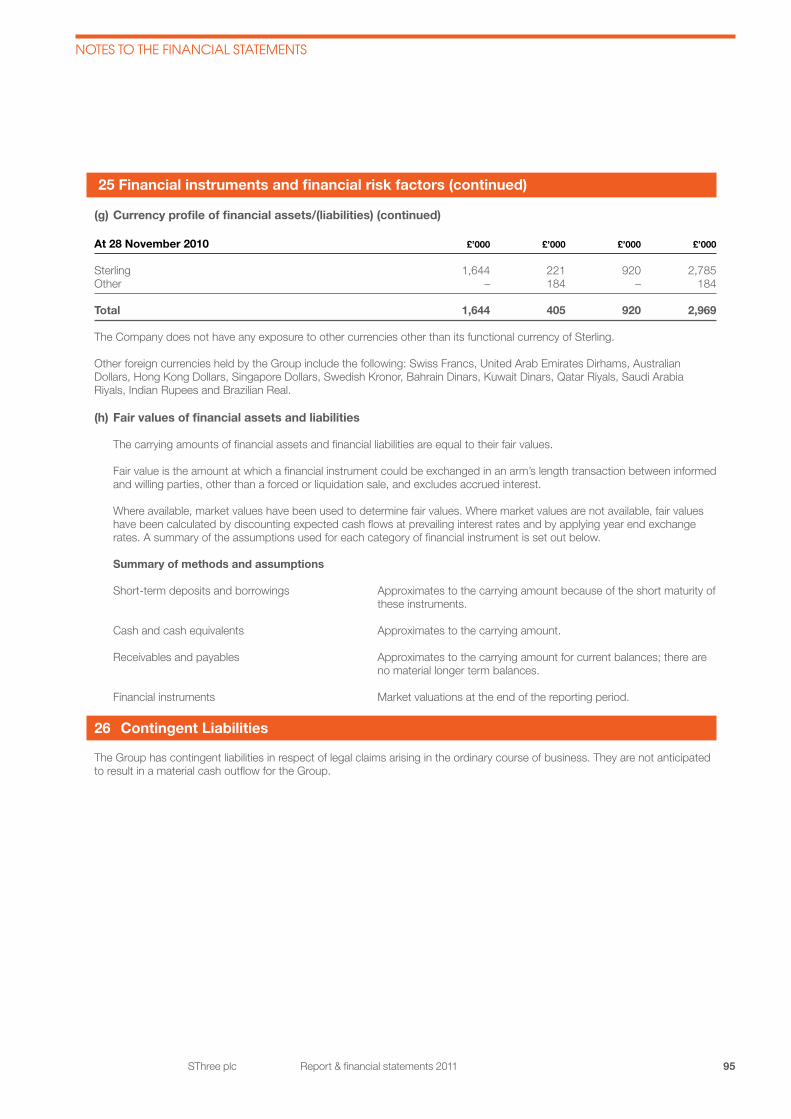
95SThree plc Report & financial statements 2011
Notes to the FiNaNcial statemeNts
At 28 November 2010 £’000 £’000 £’000 £’000
Sterling 1,644 221 920 2,785Other – 184 – 184
Total 1,644 405 920 2,969
The Company does not have any exposure to other currencies other than its functional currency of Sterling.
Other foreign currencies held by the Group include the following: Swiss Francs, United Arab Emirates Dirhams, Australian Dollars, Hong Kong Dollars, Singapore Dollars, Swedish Kronor, Bahrain Dinars, Kuwait Dinars, Qatar Riyals, Saudi Arabia Riyals, Indian Rupees and Brazilian Real.
(h) Fair values of financial assets and liabilities
The carrying amounts of financial assets and financial liabilities are equal to their fair values.
Fair value is the amount at which a financial instrument could be exchanged in an arm’s length transaction between informed and willing parties, other than a forced or liquidation sale, and excludes accrued interest.
Where available, market values have been used to determine fair values. Where market values are not available, fair values have been calculated by discounting expected cash flows at prevailing interest rates and by applying year end exchange rates. A summary of the assumptions used for each category of financial instrument is set out below.
Summary of methods and assumptions
Short-term deposits and borrowings Approximates to the carrying amount because of the short maturity of these instruments.
Cash and cash equivalents Approximates to the carrying amount.
Receivables and payables Approximates to the carrying amount for current balances; there are no material longer term balances.
Financial instruments Market valuations at the end of the reporting period.
26 Contingent Liabilities
The Group has contingent liabilities in respect of legal claims arising in the ordinary course of business. They are not anticipated to result in a material cash outflow for the Group.
25 Financial instruments and financial risk factors (continued)
(g) Currency profile of financial assets/(liabilities) (continued)

SThree plc96 Report & financial statements 2011
*Restated *Restated *Restated *Restated 27 November 28 November 29 November 30 November 2 December 2011 2010 2009 2008 2007 £m £m £m £m £m
Turnover
Geographic analysis– by location of clientUnited Kingdom and Ireland 242.7 227.9 274.8 390.8 375.4Europe and Rest of World 299.8 246.6 244.6 240.7 147.3
542.5 474.5 519.4 631.5 522.7
Gross profit
Geographic analysis– by location of clientUnited Kingdom and Ireland 71.3 68.3 78.1 123.0 125.7Europe and Rest of World 124.2 98.1 93.1 95.9 57.0
195.5 166.4 171.2 218.9 182.7
Operating profit before exceptional items 30.0 21.2 18.0 56.8 52.3
pence pence pence pence pence
Basic earnings per share before exceptional items 16.8 11.9 9.5 29.9 25.2
Dividends per share – ordinary 14.0 12.0 12.0 12.0 9.3 – special 11.0 – – – –
Other key performance indicators numbers numbers numbers numbers numbers
Average headcount 2,042 1,772 1,841 2,157 1,786Permanent placements in financial year 7,434 6,551 6,060 10,236 9,568Active contractors at year end 4,692 4,359 4,157 5,745 5,662
£ £ £ £ £
Average placement fee — permanent 13,061 12,123 11,930 10,355 9,780Average gross profit per day — contractors 86.70 84.24 84.69 78.30 71.42
* In the years 2007 to 2010, Ireland was included within Europe and Rest of World. In 2011, the results reviewed by the chief operating decision maker show Ireland with the UK. The comparatives for the years 2007 to 2010 have been restated on the same basis.
fivE yEAr fiNANCiAl suMMAry

sHArEHoldEr iNforMAtioN
Shareholder Enquiries and ElectronicCommunications – www.capitashareportal.comShareholders with enquiries relating to their shareholding should contact Capita Registrars. Alternatively, you may access your account via www.capitashareportal.com, but will need to have your shareholder reference available when you first log in, which may be found on your dividend voucher, share certificate or form of proxy. The online facility also allows shareholders to view their holding details, find out how to register a change of name or what to do if a share certificate is lost, as well as download forms in respect of changes of address, dividend mandates and share transfers. Shareholders who would prefer to view documentation electronically can elect to receive automatic notification by e-mail each time the Company distributes documents, instead of receiving a paper version of such documents, by registering a request via the registrar by calling 0871 664 0391 (from UK – calls cost 10p per min plus network extras; lines are open 8.30am – 5.30pm Mon to Fri) or + 44 208 639 3367 (Non UK) or register online at:
www.capitashareportal. There is no fee for using this service and you will automatically receive confirmation that a request has been registered. Should you wish to change your mind or request a paper version of any document in the future, you may do so by contacting the registrar.
Potential targeting of shareholdersCompanies have become aware that their shareholders have received unsolicited phone calls or correspondence concerning investment matters. These are typically from overseas based brokers’ who target UK shareholders offering to sell them what often turn out to be worthless or high risk shares in US or UK investments. They can be very persistent and extremely persuasive and a 2006 survey by the Financial Services Authority (FSA) has reported that the average amount lost by investors is around £20,000. It is not just the novice investor that has been duped in this way; many of the victims had been successfully investing for several years. Shareholders are advised to be very wary of any unsolicited advice, offers to buy shares at a discount or offers of free company reports.
If you receive any unsolicited investment advice:
• Make sure you get the correct name of the person and organisation.
• Check that they are properly authorised by the FSA before getting involved. You can check at www.fsa.gov.uk/register
• The FSA also maintains on its website a list of unauthorised overseas firms who are targeting, or
• have targeted, UK investors and any approach from such organisations should be reported to the FSA so that this list can be kept up to date and any other appropriate action can be considered. If you deal with an unauthorised firm, you would not be eligible to receive payment under the Financial Services Compensation Scheme. The FSA can be contacted by completing an online form at www.fsa.gov.uk/pages/doing/regulated/law/alerts overseas.shtml
• Inform the Registrar as shown above.
Details of share dealing facilities that the Company endorses will only be included in publications issued by the Company. More detailed information on this or similar activity can be found on the FSA website www.fsa.gov.uk/consumer/
ADR informationFor US investors, the Company has set up a Level One ADR facility, under the ticker symbol ‘SERTY’. BNY Mellon acts as both ADR depositary bank & registrar for this facility. For further information, please visit the website: www.adrbnymellon.com and search for the SThree profile page. Holders can also access information by the following:
The Bank of New York Mellon PO Box 358016 Pittsburgh, PA 15252-8016 Customer service: Tel: 1 800 522-6645 (from outside the US Tel: 001 201 680-6578) Email: [email protected] For the issuance of ADRs please contact: Michael Ludwig Tel: +1 212 815 2213 Fax: +1 212 571 3050 E-mail: [email protected] Website: http://www.adrbnymellon.com
Share price informationInformation on the Company’s share price can be found via: www.sthree.com, or via the FT Cityline Service, tel: 0906 003 0000 (code 3912). Calls cost 60p per minute from a BT landline and charges from other telephone networks may vary.
Share dealing serviceCapita Share Dealing Services provide a telephone and online share dealing service for UK and EEA resident shareholders. To use this service, shareholders should contact Capita, tel: 0871 664 0454 – lines are open Mon to Fri 8.00am – 4.30pm UK time (calls cost 10p per min plus network extras). Alternatively log on to www.capitadeal.com.
(Capita Share Dealing Services is a trading name of Capita IRG Trustees Limited which is authorised and regulated by the FSA)
Dividend Re-investment Plan (DRIP) (non sponsored)For any shareholders who wish to re-invest dividend payments in additional shares of the Company, a facility is provided by Capita IRG Trustees Ltd in conjunction with Capita Registrars. Under this facility, accrued dividends are used to purchase additional shares. Any shareholder requiring further information should contact Capita on (UK) 0871 664 0381* or (Non-UK) +44 208 639 3402 or e-mail: [email protected].
*Calls cost 10p per minute plus network extras; lines are open 8.30am – 5.30pm Mon to Fri
ShareGiftShareGift (reg charity no. 1052686) operates a charity share donation scheme for shareholders with small parcels of shares whose value may make it uneconomic to sell. Details of the scheme are available from:
Website: www.sharegift.org;
Tel: 0207 930 3737
Financial Calendar 2011/12Financial year end – 27 November 2011 Results announced – 30 January 2012 Annual General Meeting – 19 April 2012 Ex-div date for final dividend – 2 May 2012 Record date for final dividend – 4 May 2012 Dividend Reinvestment latest – 12 May 2012 Half Year period end – 27 May 2012 Final dividend payable – 6 June 2012 Interim results announced – 16 July 2012 Interim dividend payable – early December 2012

SThre
e p
lc
REP
OR
T & FIN
AN
CIA
L STATEM
ENTS 2
011