a model for the sustainability of local suppliers in …
TRANSCRIPT
A MODEL FOR THE SUSTAINABILITY
OF LOCAL SUPPLIERS
IN THE SOUTH AFRICAN AUTOMOTIVE VALUE CHAIN
Christian Nitschke
Dissertation presented for the degree of Doctor of Philosophy (PhD) (Business Management and Administration)
at the
University of Stellenbosch Business School Faculty of Economic and Management Sciences
Stellenbosch University
Promoter Dr. Jan Havenga
December 2011

ii
ABSTRACT
What factors influence the economic sustainability of local suppliers in emerging markets in the
automotive value chain? The answer to this question is not only influenced by the direct and
indirect customers of the automotive component suppliers, but it is also influenced by factors on
the macro-, meso- and micro-levels of the supplier‟s environment. In order to investigate the
research objective, the South African automotive industry is chosen as a case study in the global
automotive value chain.
The literature review indicates that variables that influence the economic sustainability of suppliers
can be found on the global and regional levels of the automotive industry, as well as on the
industry and corporate value chain levels. As the theory does not offer a holistic approach for a
problem solution, the identified factors are assembled in a conceptual model that measures the
economic sustainability of automotive component suppliers with respect to financial dimensions.
The conceptual model is structured according to the macro-, meso- and micro-level influences, and
also recognises the impact of governance structures on the government, market, industry and
corporate levels.
The suggested conceptual model is subsequently tested for totality and alignment with industry
features using qualitative methods and is furthermore validated by using quantitative modelling
data from primary research in the supplier component industry. The analysis of the quantitative
data shows that the majority of factors influencing the economic sustainability of local component
suppliers can be found on the micro- and meso-levels (corporate value chain and industry value
chain), whereas the qualitative data implies that economic sustainability is mainly influenced by
factors on the macro- and meso-levels (industrial policy and labour market). This finding shows
that there is a discrepancy between the measurable influences and the automotive component
suppliers‟ perception of the research problem. Nevertheless, it can be stated that the conceptual
model, as supported by the stakeholder group, can be used for further research.
Alongside the development of the conceptual model, the industry data is used for a discussion
about the status of the South African automotive component supplier industry in order to point out
strengths and issues as well as to identify factors that should change or improve to enable a viable
future for suppliers.
Keywords: automotive, supplier, economic sustainability, emerging markets, South Africa,
globalisation, value chain, governance, market access
Stellenbosch University http://scholar.sun.ac.za

iii
TABLE OF CONTENTS
Abstract ................................................................................................................................. ii
Table of contents ...................................................................................................................iii
List of figures ........................................................................................................................vii
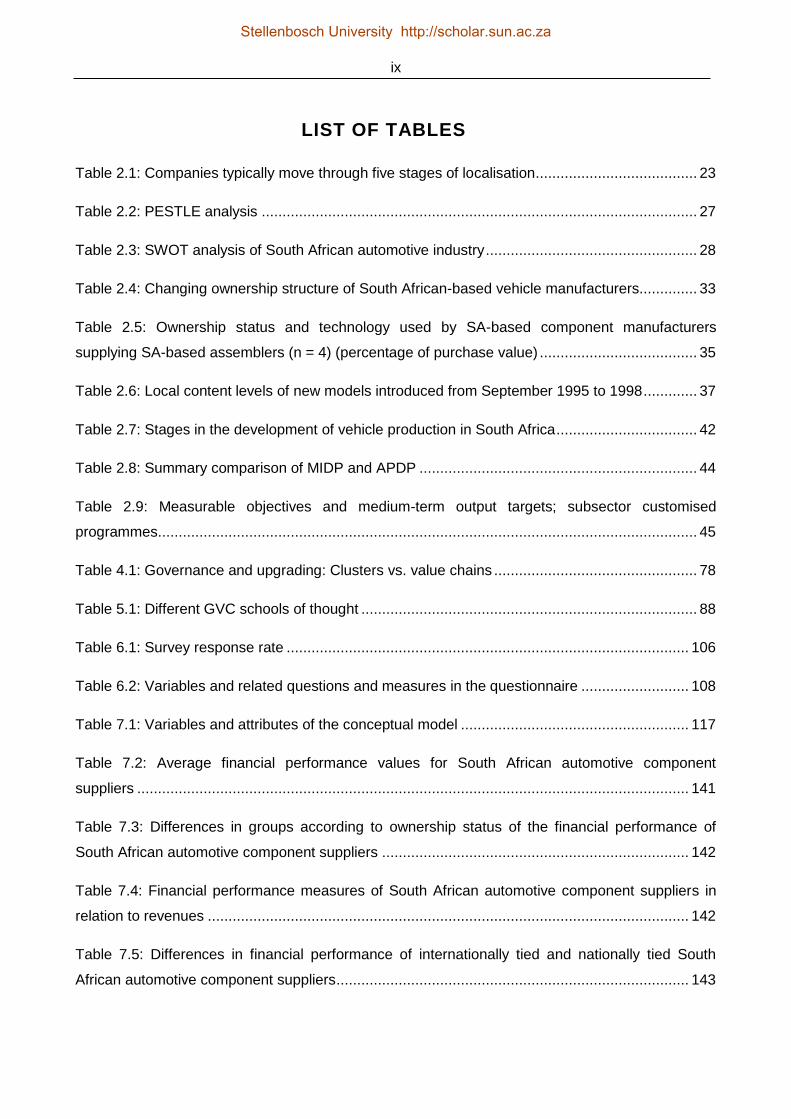
List of tables .......................................................................................................................... ix
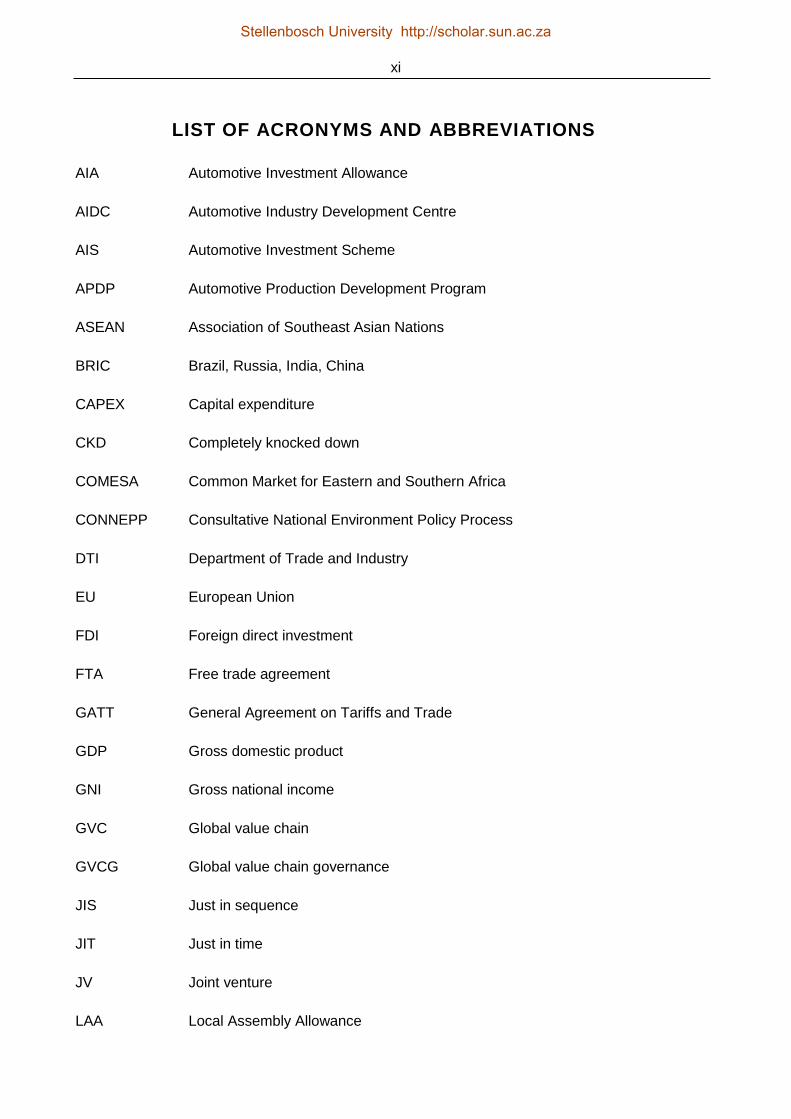
List of acronyms and abbreviations ....................................................................................... xi
Declaration........................................................................................................................... xiii
Acknowledgements .............................................................................................................. xiv
Chapter 1 Orientation ........................................................................................................ 1
1.1 Introduction .............................................................................................................. 1
1.2 Problem statement ................................................................................................... 3
1.3 Research question ................................................................................................... 4
1.4 Research objectives................................................................................................. 4
1.5 Research design and methodology .......................................................................... 5
1.6 Boundaries and limitations of the research .............................................................. 6
1.7 Chapter outline ........................................................................................................ 9
Chapter 2 Literature review: globalization in the automotive industry and the statu
of the South African automotive industry ........................................................... 13
2.1 Introduction ............................................................................................................ 13
2.2 Globalisation trends in the automotive industry ...................................................... 13
2.2.1 Trends in the automotive industry ................................................................... 13
2.2.2 Distinctive aspects of globalisation.................................................................. 20
2.2.3 The location of production ............................................................................... 22
2.3 The South African automotive environment ........................................................... 24
2.3.1 The current status of the South African automotive industry ........................... 24
2.3.2 An industry analysis of South Africa‟s automotive sector ................................ 26
2.3.3 The history of the South African automotive industry ...................................... 29
2.3.3.1 The beginnings and the period before 1995 ............................................. 29
2.3.3.2 The Motor Industry Development Programme ......................................... 32
2.3.4 Future challenges for South Africa‟s automotive industry ................................ 38
2.3.4.1 South Africa‟s automotive industry in an advanced emerging market ....... 38
2.3.4.2 The Automotive Production Development Plan (APDP) ........................... 42
2.3.4.3 Structural issues in South Africa‟s automotive value chain ....................... 45
2.4 Synthesis ............................................................................................................... 48
Stellenbosch University http://scholar.sun.ac.za
iv
Chapter 3 Literature review: automotive value chains and global value chai
governance ....................................................................................................... 50
3.1 Introduction ............................................................................................................ 50
3.2 Automotive value chain and supply chain .............................................................. 50
3.2.1 Value chains and networks ............................................................................. 50
3.2.2 Fragmentation and economic geography ........................................................ 53
3.2.3 The automotive upstream value chain ............................................................ 55
3.3 Global value chain governance .............................................................................. 61
3.4 Synthesis ............................................................................................................... 68
Chapter 4 Literature review: market access in emerging markets.................................... 70
4.1 Introduction ............................................................................................................ 70
4.2 Perspectives of local automotive suppliers in emerging markets ............................ 70
4.3 South Africa as an emerging market in the global automotive value chain ............. 74
4.4 Upgrading and positioning of local automotive suppliers in the value chain ........... 76
4.5 Synthesis ............................................................................................................... 82
Chapter 5 Development of the conceptual model ............................................................ 83
5.1 Introduction ............................................................................................................ 83
5.2 Conclusions of the literature research .................................................................... 83
5.3 The conceptual model ............................................................................................ 88
5.3.1 System and governance levels ....................................................................... 88
5.3.2 Variables......................................................................................................... 90
5.3.3 Model .............................................................................................................. 94
5.3.4 Research questions ........................................................................................ 96
5.4 Synthesis ............................................................................................................... 97
Chapter 6 Research design and methodology ................................................................. 98
6.1 Introduction ............................................................................................................ 98
6.2 Research design .................................................................................................... 98
6.3 Research methodology ........................................................................................ 100
6.3.1 Literature review ........................................................................................... 100
6.3.2 Qualitative research ...................................................................................... 100
6.3.2.1 Validation discussions ........................................................................... 100
6.3.2.2 Focus group and interviews ................................................................... 101
6.3.3 Quantitative research .................................................................................... 104
6.3.3.1 Introduction ............................................................................................ 104
Stellenbosch University http://scholar.sun.ac.za
v
6.3.3.2 Survey ................................................................................................... 104
6.3.3.3 Set-up .................................................................................................... 105
6.3.3.4 Sampling ............................................................................................... 105
6.3.3.5 Response rate ....................................................................................... 106
6.3.3.6 Questionnaire ........................................................................................ 107
6.3.3.7 Data collection ....................................................................................... 113
6.3.3.8 Data analysis ......................................................................................... 114
6.4 Synthesis ............................................................................................................. 115
Chapter 7 Findings ........................................................................................................ 116
7.1 Introduction .......................................................................................................... 116
7.2 Focus group ......................................................................................................... 118
7.2.1 Introduction ................................................................................................... 118
7.2.2 Conceptual model ......................................................................................... 118
7.2.3 Issues ........................................................................................................... 120
7.2.4 Synthesis ...................................................................................................... 121
7.3 Semi-structured interviews ................................................................................... 123
7.3.1 Introduction ................................................................................................... 123
7.3.2 Conceptual model ......................................................................................... 123
7.3.3 Issues ........................................................................................................... 123
7.3.4 Synthesis ...................................................................................................... 124
7.4 Survey ................................................................................................................. 126
7.4.1 Introduction ................................................................................................... 126
7.4.2 Descriptive Statistics ..................................................................................... 126
7.4.2.1 Introduction ............................................................................................ 126
7.4.2.2 Profile of South African Automotive component suppliers ...................... 127
7.4.2.3 Government influences .......................................................................... 131
7.4.2.4 Market influences ................................................................................... 134
7.4.2.5 Industry influences ................................................................................. 136
7.4.2.6 Corporate influences .............................................................................. 140
7.4.2.7 Synthesis ............................................................................................... 144
7.4.3 Correlations .................................................................................................. 147
7.4.3.1 Introduction ............................................................................................ 147
7.4.3.2 Macro-level ............................................................................................ 147
7.4.3.3 Meso-level ............................................................................................. 150
Stellenbosch University http://scholar.sun.ac.za

vi
7.4.3.4 Micro-level ............................................................................................. 154
7.4.3.5 Synthesis ............................................................................................... 159
7.4.4 Qualitative Comments................................................................................... 164
7.4.4.1 Introduction ............................................................................................ 164
7.4.4.2 Factors .................................................................................................. 164
7.4.4.3 Strengths ............................................................................................... 165
7.4.4.4 Issues .................................................................................................... 166
7.4.4.5 Synthesis ............................................................................................... 167
Chapter 8 Conclusion .................................................................................................... 168
8.1 Introduction .......................................................................................................... 168
8.2 The evaluation of the model ................................................................................. 169
8.3 Implications for theory .......................................................................................... 171
8.4 Implications for practice ....................................................................................... 172
8.5 Limitations and implications for further research .................................................. 174
Appendix and Attachments ................................................................................................ 175
Bibliography ....................................................................................................................... 193
Stellenbosch University http://scholar.sun.ac.za

vii
LIST OF FIGURES
Figure 1.1: The automotive power play ........................................................................................... 1
Figure 2.1: NAFTA light vehicle assembly capacity utilisation (Feb 2008 vs. Feb 2009)................ 15
Figure 2.2: European Union light vehicle assembly capacity utilisation (2007 vs. 2009) ................ 15
Figure 2.3: Supplier EBIT profitability by region 2009 vs. 2007 ..................................................... 16
Figure 2.4: How profitable do you think the global automotive manufacturing, supplier and dealer
industries will be over the next five years? .................................................................................... 17
Figure 2.5: How important are the following issues to the global auto industry today? .................. 18
Figure 2.6: Do you expect suppliers to increase their investment over the next two years? .......... 18
Figure 2.7: Increase in global platform volumes ............................................................................ 19
Figure 2.8: The BRIC automotive markets will grow strongly through 2014 ................................... 20
Figure 2.9: What are the cost-saving opportunities for auto manufacturers and suppliers? ........... 24
Figure 2.10: Static uni-directional MIDP incentive model............................................................... 32
Figure 2.11: Changing strategic perspectives on the ownership of component suppliers .............. 34
Figure 2.12: Impact of liberalisation and alignment on suppliers of Toyota SA .............................. 36
Figure 2.13: Independent variables identified in the literature review ............................................ 49
Figure 3.1: Porter‟s value chain ..................................................................................................... 51
Figure 3.2: The traditional automotive value chain ........................................................................ 52
Figure 3.3: Functional vs. process organisation in the automotive value chain .............................. 53
Figure 3.4: The co-location grid ..................................................................................................... 54
Figure 3.5: The nested geographic and organisational structure of the automotive industry .......... 55
Figure 3.6: The vehicle and components value chain .................................................................... 56
Figure 3.7: Company positioning in the supply chain .................................................................... 57
Figure 3.8: Value transfer activity (modular supply chain) ............................................................. 58
Stellenbosch University http://scholar.sun.ac.za
viii
Figure 3.9: Characteristics of different levels of modularisation ..................................................... 59
Figure 3.10: Primary drivers of supply chain strategy for automotive and industrial manufacturers 60
Figure 3.11: Automotive supply chain objectives ........................................................................... 61
Figure 4.1: Changing assembler-supplier relations ....................................................................... 73
Figure 4.2: Global sourcing from developing-country partners ...................................................... 74
Figure 4.3: A typology of upgrading strategies .............................................................................. 79
Figure 4.4: Summary of innovation processes and the interrelation of concepts, actors and their
interactions ................................................................................................................................... 80
Figure 4.5: Positioning of emerging-market companies ................................................................. 81
Figure 4.6: Independent variables identified in the literature review .............................................. 82
Figure 5.1: Migration towards supply chain focus .......................................................................... 89
Figure 5.2: Conceptual model layers ............................................................................................. 90
Figure 5.3: General overview of the structure of the variables used in the conceptual model ........ 91
Figure 5.4: Conceptual model with independent variables and layers ........................................... 92
Figure 5.5: The measures for economic sustainability ................................................................... 94
Figure 5.6: Conceptual model without independent variables ....................................................... 95
Figure 5.7: Conceptual model including independent variables ..................................................... 96
Figure 7.1: Patterns of the conceptual model .............................................................................. 117
Figure 7.2: Qualitative comments of focus group participants with regard to issues of the South
African automotive industry ......................................................................................................... 122
Figure 7.3: Qualitative comments of interview participants with regard to issues of the South
African automotive industry ......................................................................................................... 125
Figure 7.4: Profile of the survey respondents .............................................................................. 127
Figure 8.1: The model for the sustainability of local suppliers in the South African automotive value
chain ........................................................................................................................................... 170
Stellenbosch University http://scholar.sun.ac.za
ix
LIST OF TABLES
Table 2.1: Companies typically move through five stages of localisation ....................................... 23
Table 2.2: PESTLE analysis ......................................................................................................... 27
Table 2.3: SWOT analysis of South African automotive industry ................................................... 28
Table 2.4: Changing ownership structure of South African-based vehicle manufacturers.............. 33
Table 2.5: Ownership status and technology used by SA-based component manufacturers
supplying SA-based assemblers (n = 4) (percentage of purchase value) ...................................... 35
Table 2.6: Local content levels of new models introduced from September 1995 to 1998 ............. 37
Table 2.7: Stages in the development of vehicle production in South Africa .................................. 42
Table 2.8: Summary comparison of MIDP and APDP ................................................................... 44
Table 2.9: Measurable objectives and medium-term output targets; subsector customised
programmes .................................................................................................................................. 45
Table 4.1: Governance and upgrading: Clusters vs. value chains ................................................. 78
Table 5.1: Different GVC schools of thought ................................................................................. 88
Table 6.1: Survey response rate ................................................................................................. 106
Table 6.2: Variables and related questions and measures in the questionnaire .......................... 108
Table 7.1: Variables and attributes of the conceptual model ....................................................... 117
Table 7.2: Average financial performance values for South African automotive component
suppliers ..................................................................................................................................... 141
Table 7.3: Differences in groups according to ownership status of the financial performance of
South African automotive component suppliers .......................................................................... 142
Table 7.4: Financial performance measures of South African automotive component suppliers in
relation to revenues .................................................................................................................... 142
Table 7.5: Differences in financial performance of internationally tied and nationally tied South
African automotive component suppliers ..................................................................................... 143
Stellenbosch University http://scholar.sun.ac.za

x
Table 7.6: Differences in financial performance of South African automotive component suppliers
according to main customers ...................................................................................................... 143
Table 7.7: Differences in financial performance of South African automotive component suppliers
according to product categories .................................................................................................. 144
Stellenbosch University http://scholar.sun.ac.za
xi
LIST OF ACRONYMS AND ABBREVIATIONS
AIA Automotive Investment Allowance
AIDC Automotive Industry Development Centre
AIS Automotive Investment Scheme
APDP Automotive Production Development Program
ASEAN Association of Southeast Asian Nations
BRIC Brazil, Russia, India, China
CAPEX Capital expenditure
CKD Completely knocked down
COMESA Common Market for Eastern and Southern Africa
CONNEPP Consultative National Environment Policy Process
DTI Department of Trade and Industry
EU European Union
FDI Foreign direct investment
FTA Free trade agreement
GATT General Agreement on Tariffs and Trade
GDP Gross domestic product
GNI Gross national income
GVC Global value chain
GVCG Global value chain governance
JIS Just in sequence
JIT Just in time
JV Joint venture
LAA Local Assembly Allowance
Stellenbosch University http://scholar.sun.ac.za

xii
LDC Least developed country
MERCOSUR Mercado Común del Sur (Southern Common Market)
MIDP Motor Industry Development Program
MNC Multinational corporation
NAACAM National Association of Automotive Component and Allied Manufacturers
NAAMSA National Association of Automobile Manufacturers of South Africa
NAFTA North American Free Trade Agreement
NEPAD New Partnership for Africa‟s Development
OEM Original equipment manufacturer
OES Original equipment supplier
ppm Parts per million
PAA Productive asset allowance
ROI Return on investment
SADC Southern African Development Community
SME Small and medium-sized enterprises
TNC Transnational Corporation
USB University of Stellenbosch Business School
WIP Work in progress/work in process
WTO World Trade Organization
Stellenbosch University http://scholar.sun.ac.za

xiii
DECLARATION
By submitting this research report electronically, I, Christian Nitschke, declare that the entirety of
the work contained therein is my own, original work, that I am the owner of the copyright thereof
(unless to the extent explicitly otherwise stated) and that I have not previously in its entirety or in
part submitted it for obtaining any qualification.
Christian Nitschke December 2011 Copyright 2011 Stellenbosch UniversityAll rights reserved
Stellenbosch University http://scholar.sun.ac.za

xiv
ACKNOWLEDGEMENTS
I would like to take this opportunity to thank everyone who has supported and encouraged me
throughout my PhD studies.
I would like to thank my parents for their support throughout my studies and my paths up until
today. Their guidance and encouragement helped me to find my way. In addition, I would like to
thank Tanja for always supporting me emotionally, and for her help in terms of proofreading my
dissertation.
Furthermore, I would like to thank Patrick Lavery and Roger Pitot from the National Association of
Automotive Component and Allied Manufacturers (NAACAM) and Lance Schultz and Grant Minnie
from the Automotive Industry Development Centre (AIDC), who were all very supportive in terms of
aligning the research strategy and providing access to the South African automotive industry.
The people of the University of Stellenbosch have helped me to gain new insights. My fellow PhD
students always had an open mind and Dr John Morrison as well as Professor Herbst guided me to
a purposeful dissertation. I would like to thank Professor Kidd for his help in the statistical analysis
of my data. Dr Jan Havenga, my supervisor for the PhD studies, has always offered help and
supported me during the development of the dissertation. I would like to express my thanks for
supporting me.
Stellenbosch University http://scholar.sun.ac.za

1
CHAPTER 1
ORIENTATION
1.1 INTRODUCTION
Viewing changes in the upstream automotive value chain from a global perspective, research
identifies suppliers to be in a „sandwich‟ position. Suppliers are sandwiched on one side by direct
and indirect customers (i.e. OEMs and consumers) and on the other by financial and raw-material
markets (Roland Berger & Rothschild, 2008: 3; 2009: 20). Figure 1.1 shows how suppliers are
sandwiched in this position.
Figure 1.1: The automotive power play
Source: Roland Berger & Rothschild, 2008: 3
Horváth & Partner (February 2010: 1) extend this two-dimensional depiction by adding
technological development, consolidation in the industry structure and socio-economic and policy
changes to this discussion. These further dimensions are illustrated in Figure 1.2.
Stellenbosch University http://scholar.sun.ac.za

2
Figure 1.2: Framework of the automotive supplier industry
Source: Researcher‟s own illustration based on Horváth & Partner, February 2010: 1
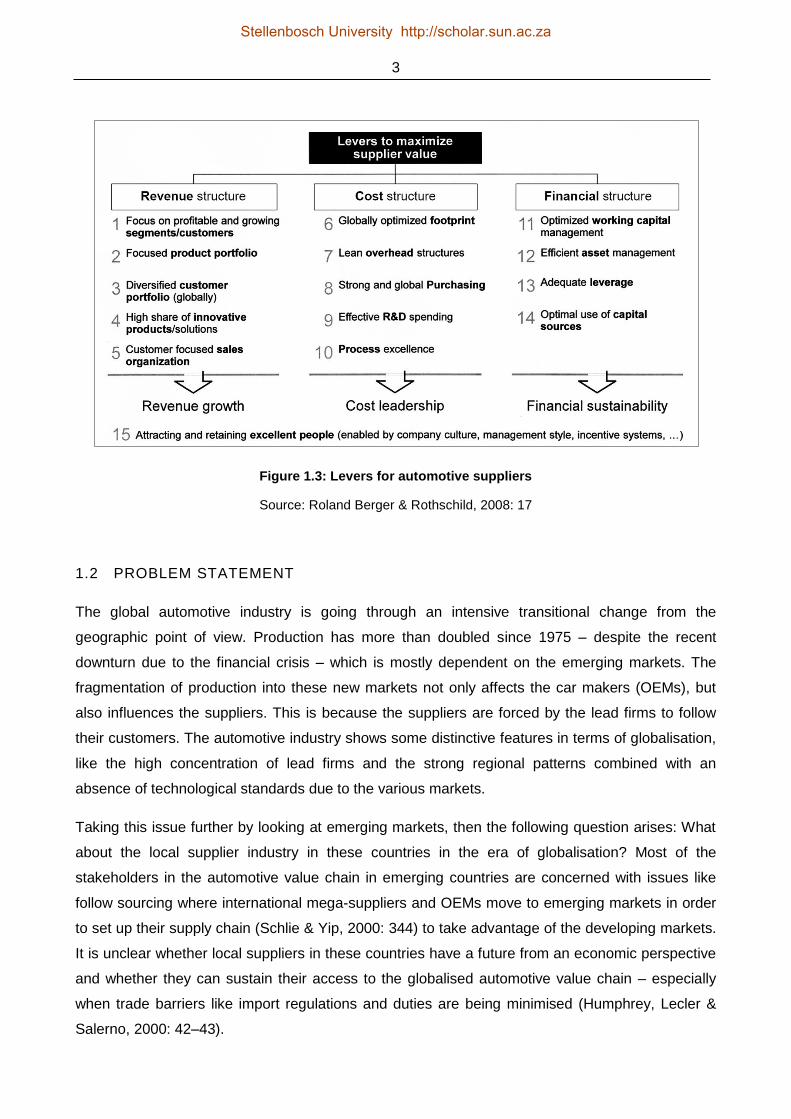
The „automotive power play‟ leads to the matter of how automotive suppliers will sustain their
profitable role in the upstream value chain. The Global Automotive Supplier Study 2008 by Roland
Berger and Rothschild (2008) identifies 15 levers relating to financial, cost and revenue structures
that suppliers can use to face current and future challenges. These are illustrated in Figure 1.3.
Based on these arguments for economic supplier sustainability, which focus on the firm-level
perspective, the question is which additional factors at the meso- and macro-levels may influence
the economic sustainability of suppliers in the automotive value chain? (Horváth & Partner,
February 2010: 1, 5).
One of these meso- or macro-level factors may be the influences of global fragmentation of
production and sales for suppliers. As original equipment manufacturers (OEMs) move to regional
business models in their new locations they need to examine their existing supplier strategies and
work with a choice of three strategies (KPMG, 2009a: 10):
1) Moving existing suppliers along with the OEM to low-cost regions
2) Encouraging established suppliers to invest in local JVs or partner with local companies to
benefit from low-cost manufacturing
3) Identifying local suppliers in low-cost regions that are capable of replacing existing suppliers
(Deloitte, 2009).
Stellenbosch University http://scholar.sun.ac.za
3
Figure 1.3: Levers for automotive suppliers
Source: Roland Berger & Rothschild, 2008: 17
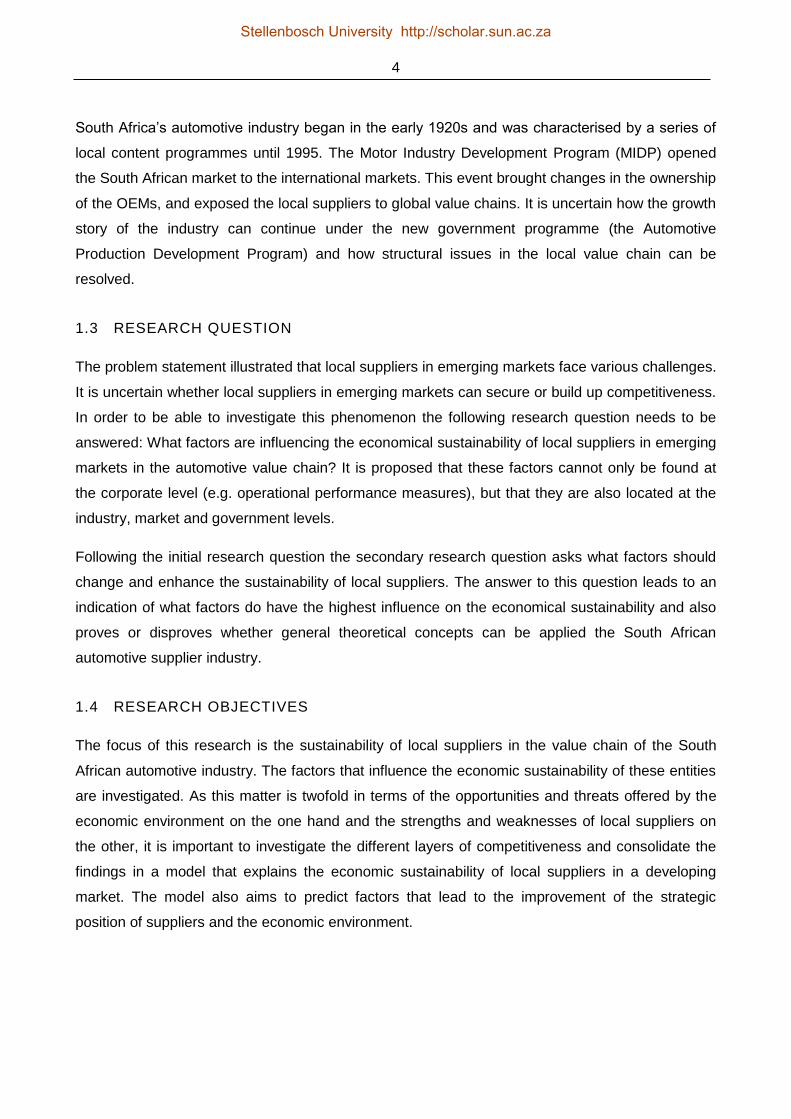
1.2 PROBLEM STATEMENT
The global automotive industry is going through an intensive transitional change from the
geographic point of view. Production has more than doubled since 1975 – despite the recent
downturn due to the financial crisis – which is mostly dependent on the emerging markets. The
fragmentation of production into these new markets not only affects the car makers (OEMs), but
also influences the suppliers. This is because the suppliers are forced by the lead firms to follow
their customers. The automotive industry shows some distinctive features in terms of globalisation,
like the high concentration of lead firms and the strong regional patterns combined with an
absence of technological standards due to the various markets.
Taking this issue further by looking at emerging markets, then the following question arises: What
about the local supplier industry in these countries in the era of globalisation? Most of the
stakeholders in the automotive value chain in emerging countries are concerned with issues like
follow sourcing where international mega-suppliers and OEMs move to emerging markets in order
to set up their supply chain (Schlie & Yip, 2000: 344) to take advantage of the developing markets.
It is unclear whether local suppliers in these countries have a future from an economic perspective
and whether they can sustain their access to the globalised automotive value chain – especially
when trade barriers like import regulations and duties are being minimised (Humphrey, Lecler &
Salerno, 2000: 42–43).
Stellenbosch University http://scholar.sun.ac.za
4
South Africa‟s automotive industry began in the early 1920s and was characterised by a series of
local content programmes until 1995. The Motor Industry Development Program (MIDP) opened
the South African market to the international markets. This event brought changes in the ownership
of the OEMs, and exposed the local suppliers to global value chains. It is uncertain how the growth
story of the industry can continue under the new government programme (the Automotive
Production Development Program) and how structural issues in the local value chain can be
resolved.
1.3 RESEARCH QUESTION
The problem statement illustrated that local suppliers in emerging markets face various challenges.
It is uncertain whether local suppliers in emerging markets can secure or build up competitiveness.
In order to be able to investigate this phenomenon the following research question needs to be
answered: What factors are influencing the economical sustainability of local suppliers in emerging
markets in the automotive value chain? It is proposed that these factors cannot only be found at
the corporate level (e.g. operational performance measures), but that they are also located at the
industry, market and government levels.
Following the initial research question the secondary research question asks what factors should
change and enhance the sustainability of local suppliers. The answer to this question leads to an
indication of what factors do have the highest influence on the economical sustainability and also
proves or disproves whether general theoretical concepts can be applied the South African
automotive supplier industry.
1.4 RESEARCH OBJECTIVES
The focus of this research is the sustainability of local suppliers in the value chain of the South
African automotive industry. The factors that influence the economic sustainability of these entities
are investigated. As this matter is twofold in terms of the opportunities and threats offered by the
economic environment on the one hand and the strengths and weaknesses of local suppliers on
the other, it is important to investigate the different layers of competitiveness and consolidate the
findings in a model that explains the economic sustainability of local suppliers in a developing
market. The model also aims to predict factors that lead to the improvement of the strategic
position of suppliers and the economic environment.
Stellenbosch University http://scholar.sun.ac.za
5
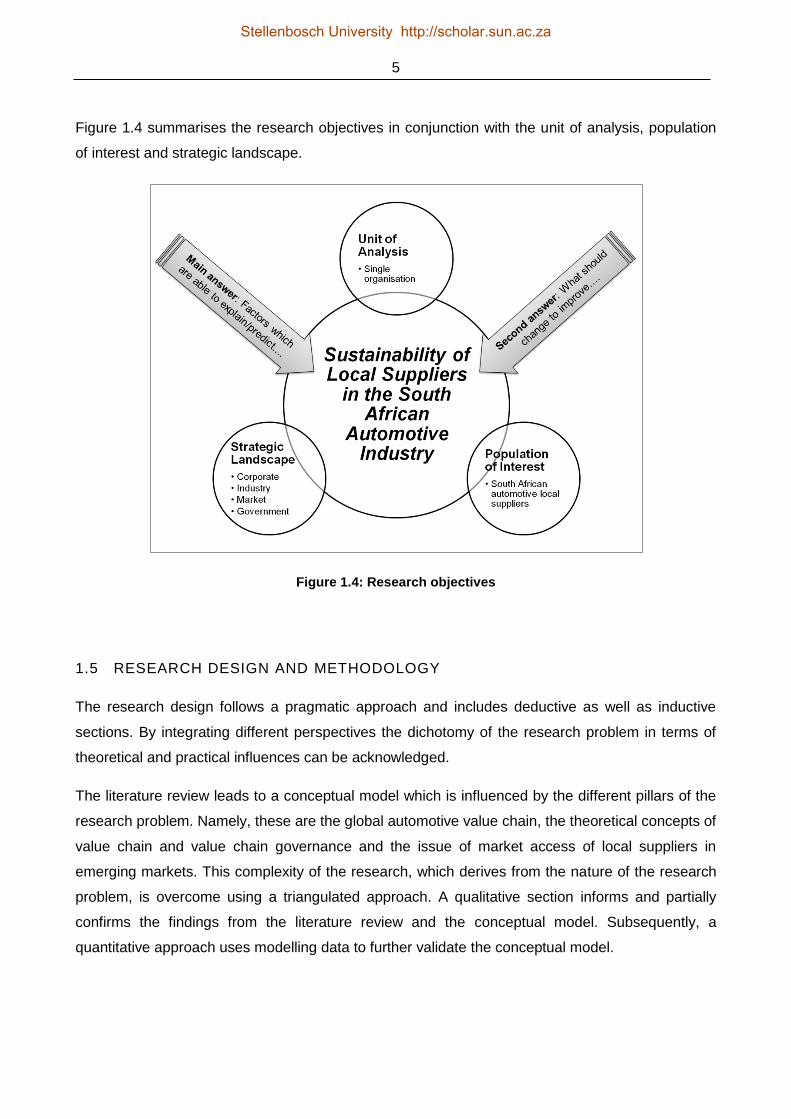
Figure 1.4 summarises the research objectives in conjunction with the unit of analysis, population
of interest and strategic landscape.
Figure 1.4: Research objectives
1.5 RESEARCH DESIGN AND METHODOLOGY
The research design follows a pragmatic approach and includes deductive as well as inductive
sections. By integrating different perspectives the dichotomy of the research problem in terms of
theoretical and practical influences can be acknowledged.
The literature review leads to a conceptual model which is influenced by the different pillars of the
research problem. Namely, these are the global automotive value chain, the theoretical concepts of
value chain and value chain governance and the issue of market access of local suppliers in
emerging markets. This complexity of the research, which derives from the nature of the research
problem, is overcome using a triangulated approach. A qualitative section informs and partially
confirms the findings from the literature review and the conceptual model. Subsequently, a
quantitative approach uses modelling data to further validate the conceptual model.
Stellenbosch University http://scholar.sun.ac.za

6
The qualitative section consists of semi-structured interviews and a focus group. The data that is
generated through these methods is used to align theory and practice and to consider special
circumstances in the industry and in the research environment.
The quantitative section is accomplished through primary research. A survey is carried out among
the units of analysis in order to gather the modelling data. The quantitative data is then analysed
by using descriptive statistics and inferential statistics to investigate the factors that correlate to the
measures of economic sustainability.
The described research design and methodology will be discussed in detail in section 6. This
section is also more empirically focussed as the results of the literature review and the
development of the conceptual model will bring more clarity to the nature of the research.
1.6 BOUNDARIES AND LIMITATIONS OF THE RESEARCH
The following paragraphs point out some specifics of the research strategy and give some
implications about the boundaries and limitations of the research.
It seems unfeasible to research this question in highly dynamic markets because of their on-going
development and need for consolidation; therefore, it is more appropriate to investigate the issue of
local supplier sustainability in an environment that has exceeded the first boom phase and where
development and consolidation have already taken place (KPMG, 2009b: 3). Another factor
influencing the validity of the research is that the big emerging markets like China and India
operate in a heavily protected environment with high duty tariffs and strict local content
requirements – which do not always comply with current World Trade Organization regulations
(Sturgeon & van Biesebroeck, 2009: 22). These measures blur an objective picture of the
development of the automotive value chain, as strong governmental regulations influence the
decisions of lead firms. It can, therefore, be argued that once a settlement of the automotive
industry has been recognised the pressures of trade liberalisation will cause political decision
makers to decrease the protection.
So why is South Africa used as a „case study‟ for this research? The relevance of South Africa
derives from the fact that the automotive industry was (re-)introduced to the global automotive
value chain in 1995 with the start of the Motor Industry Development Program and the abolition of
local content requirements (Black, 2009: 484). The Motor Industry Development Program also
included an import-export complementary scheme that allowed the OEMs to earn duty rebates for
imports in exchange for exported vehicles. The result was a structural change in the industry, as
the ownership of all OEMs that were located in South Africa was taken over by their parent
companies (Black, 2001: 791). The relevance of South Africa for the field of research also derives
Stellenbosch University http://scholar.sun.ac.za
7
from the fact that the industry in South Africa is in a transitional phase. This means that the car
manufacturers are fairly to fully integrated into the global operations of their parent companies, but
local content remains moderate due to cost factors and overall production costs are in the medium
range due to the country‟s high logistics costs (Black, 2001: 792).
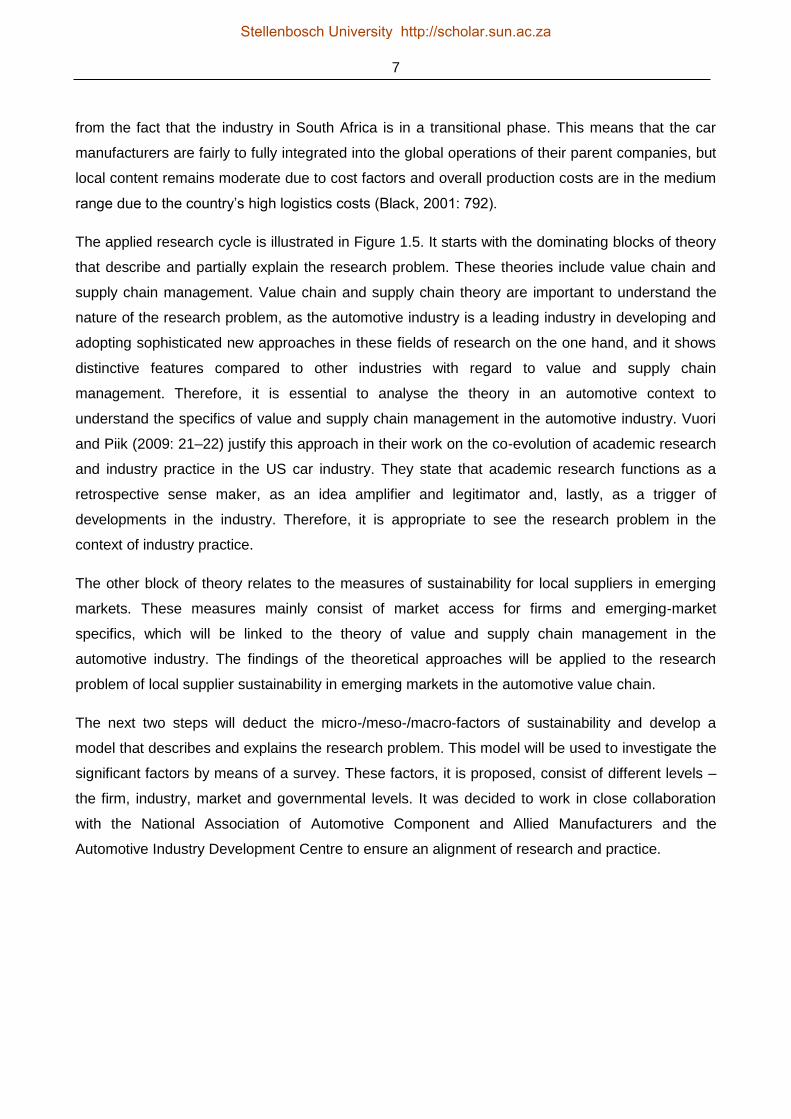
The applied research cycle is illustrated in Figure 1.5. It starts with the dominating blocks of theory
that describe and partially explain the research problem. These theories include value chain and
supply chain management. Value chain and supply chain theory are important to understand the
nature of the research problem, as the automotive industry is a leading industry in developing and
adopting sophisticated new approaches in these fields of research on the one hand, and it shows
distinctive features compared to other industries with regard to value and supply chain
management. Therefore, it is essential to analyse the theory in an automotive context to
understand the specifics of value and supply chain management in the automotive industry. Vuori
and Piik (2009: 21–22) justify this approach in their work on the co-evolution of academic research
and industry practice in the US car industry. They state that academic research functions as a
retrospective sense maker, as an idea amplifier and legitimator and, lastly, as a trigger of
developments in the industry. Therefore, it is appropriate to see the research problem in the
context of industry practice.
The other block of theory relates to the measures of sustainability for local suppliers in emerging
markets. These measures mainly consist of market access for firms and emerging-market
specifics, which will be linked to the theory of value and supply chain management in the
automotive industry. The findings of the theoretical approaches will be applied to the research
problem of local supplier sustainability in emerging markets in the automotive value chain.
The next two steps will deduct the micro-/meso-/macro-factors of sustainability and develop a
model that describes and explains the research problem. This model will be used to investigate the
significant factors by means of a survey. These factors, it is proposed, consist of different levels –
the firm, industry, market and governmental levels. It was decided to work in close collaboration
with the National Association of Automotive Component and Allied Manufacturers and the
Automotive Industry Development Centre to ensure an alignment of research and practice.
Stellenbosch University http://scholar.sun.ac.za
8
Figure 1.5: Applied research cycle
The following items define boundaries of the research in terms of practicability:
- Immediate practical application of the research problem is needed to reduce the complexity
of the research environment. In this case, the research environment – which is the entire
automotive industry – is characterised by high levels of uncertainty, rapid change and high
numbers of interactions, which lead to a high level of complexity (Mulenburg, February
2008). Therefore, theory will be seen in an automotive context during the course of the
research and references to general theory will be identified from the problem solution and
the practical application.
- Another boundary of the research is the focus on the vehicle assembly and parts sector.
This emphasis can be justified, as these segments of the automotive value chain can be
easily separated from end markets, unlike retail sales, after sales and services. Another
argument for narrowing down the research problem besides the complexity issues is the
fact that automotive value chains are producer-driven and dominated by the OEMs, which
function as lead firms (Sturgeon, Memedovic, van Biesebroeck & Gereffi, 2009: 18).
Value and Supply Chain Management
...in an Automotive /
Emerging Market context
Sustainability of Local
Suppliers in South Africa's automotive value chain
Micro-/Meso-/Macro-Factors
influencing the problem
statement
Development of a model for Sustainability
Firm-/Industry-/Market-
/Government-Factors
influencing Local Supplier
Sustainability
(Cooperation USB/AIDC)
Stellenbosch University http://scholar.sun.ac.za

9
- As the automotive industry in South Africa is of major public interest due to the high
contribution of economic well-being (see Section 2.3) it is also important to take into
account the relationship between academic research and practical industry consulting. This
form of public relationship is needed to ensure an alignment between the purposes of the
research and the need for solutions in the industry. However, this alignment does not
influence the validity of the academic approach – the intention to achieve both goals does
not sacrifice the academic objectivity and validity of the research.
1.7 CHAPTER OUTLINE
This section gives an overview of the research strategy framework and points out the structure of
the research. Each chapter is explained with regard to its content and relevance. In addition to this
introduction every chapter opens with a classification for the course of research and concludes with
the research findings.
After having introduced the research problem, the objectives and the framework in the orientation
chapter the next three chapters review the existing literature. The literature review is divided into
three chapters because of the complexity of the research problem. These three chapters are
subsumed in Chapter 5 – a conclusion of the literature research regarding the research problem
and the development of the conceptual model.
The first chapter of the literature review (Chapter 2) elaborates on the automotive industry in terms
of globalisation trends and the supplier industry. This is important, as globalisation not only
influences the location of production of the OEMs, but it also it has significant influences on the
supplier industry. Therefore, distinctive aspects of globalisation in the automotive value chain are
discussed. Furthermore, the impacts of the location of production and the competitive pressures
facing automotive suppliers are assessed. After providing a global view of the automotive industry
in the introduction and having pointed important trends with regard to the research problem, the
environment of the chosen case study is discussed. The South African automotive environment is
analysed with respect to the development and current status of the industry landscape. As
regulation is a significant feature of the industry, the history and future of governmental influences
are discussed. Additionally, structural issues in the South African automotive value chain are
examined in order to qualify the case for further analysis.
The next chapter of the literature review (Chapter 3) discusses value and supply chains because
the research subject is embedded in the domain of the automotive value chain and the supply
chain. As the automotive industry is distinct from most other industries, important concepts like
fragmentation, modularisation and risk management are examined in this context. In addition,
Stellenbosch University http://scholar.sun.ac.za

10
general theory about value and supply chains is reviewed. The concept of global value chain
governance forms the third part of this chapter. The chapter ends with a discussion of the validity
of the global value-chain-governance approach for the research problem.
Chapter 4 summarises the third objective of the literature review and discusses local supplier
sustainability from two different angles. The first point of view examines emerging market specifics
with respect to entry barriers and upgrading opportunities of a local supplier industry to a global
value chain like the automotive industry. The second discussion looks at the issue of market
access, which is seen as a crucial factor for long-term sustainability. The prerequisites for
participation in global production networks are examined and how these capabilities and
requirements can be accomplished from a strategic point of view.
The development of the conceptual model in Chapter 5 wraps up the literature review on the one
hand and discusses the issue of the relevant theoretical approaches for the conceptual model on
the other. Thus, the overarching theoretical concepts are analysed in a systematic approach in
order to identify gaps in the existing literature. This is done in preparation for the development of
the conceptual model. Additionally, the variables for the conceptual model are pointed out in this
chapter. The chapter concludes with the conceptual model, which will serve as a basis for the
further course of research. The postulation is a model that indicates the macro-, meso- and
microeconomic factors for competitiveness of local suppliers in developing markets. In order to
develop the model, variables and attributes for the research problem are described and analysed.
These variables and attributes are then translated into a model that describes and explains the
sustainability of local suppliers in the South African automotive value chain from a corporate point
of view.
In Chapter 6 the research design and methodology are described and explained. The research
design comprises semi-structured interviews and focus groups in preparation for the testing of the
conceptual model and in aiding the design of the survey. The testing of the conceptual model is
accomplished through a survey carried out in the South African automotive industry. This task is
described in the second part of Chapter 6 as part of the discussion of the research methodology.
The survey is conducted using a web-based questionnaire sampling the entire South African
automotive supplier industry. This section also describes how the data collection and analysis were
conducted and how the qualitative and quantitative data was gathered via interviews, focus groups
and a web-based survey.
The findings section (Chapter 7) discusses the data from the quantitative and qualitative research
in order to refine and validate the conceptual model. Additionally, the data captured in the survey is
Stellenbosch University http://scholar.sun.ac.za

11
used to investigate the relevant factors for the economic sustainability of automotive component
suppliers. Therefore, the quantitative data is analysed using descriptive and inferential statistics.
The conclusion in Chapter 8 is given in two parts. Firstly, the conceptual model is evaluated with
the results and data of the survey and if necessary the model is modified to take the findings into
account. Secondly, the findings and the model are used to give implications for theory and practice
with regard to the changing global automotive value chain and the key success factors of local
suppliers in emerging markets. Finally, implications/opportunities for further research are pointed
out.
Stellenbosch University http://scholar.sun.ac.za
12
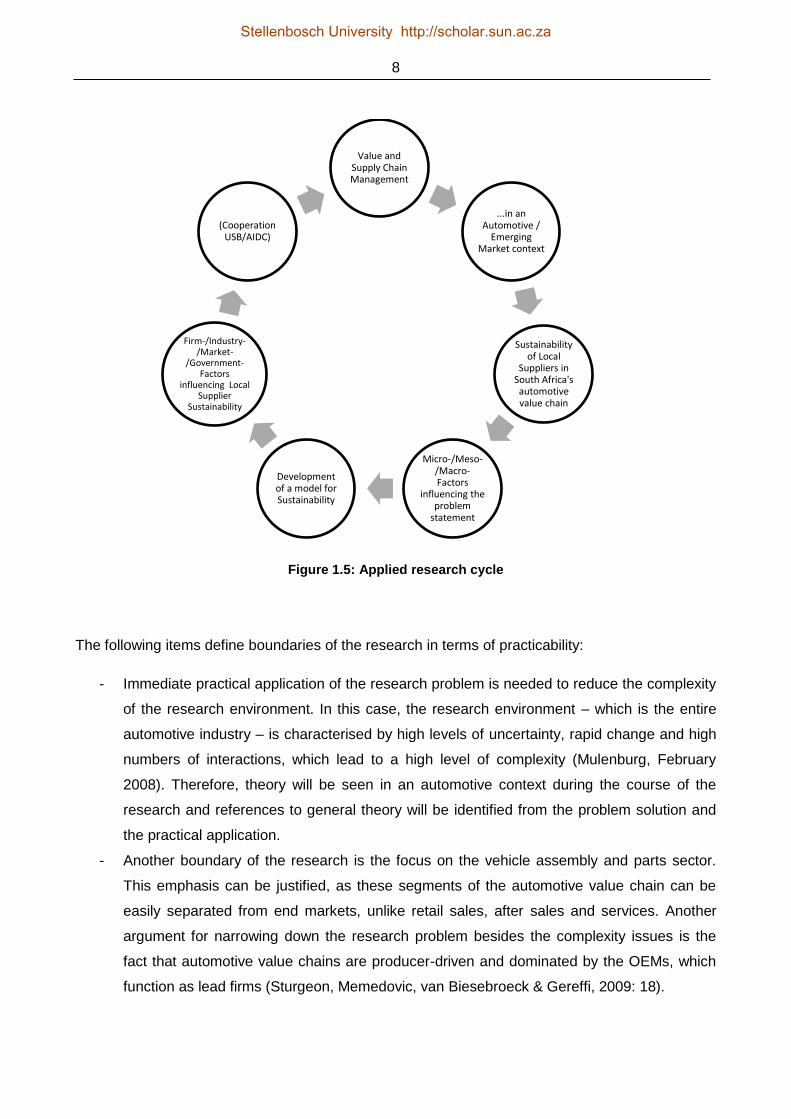
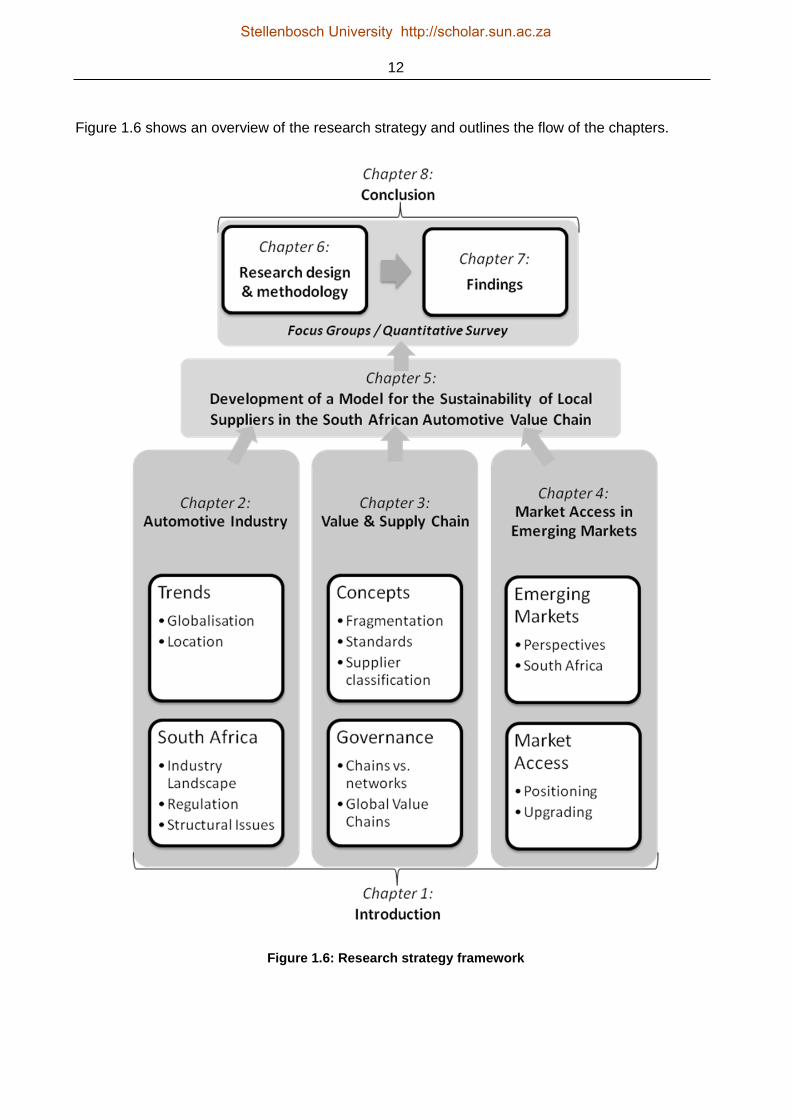
Figure 1.6 shows an overview of the research strategy and outlines the flow of the chapters.
Figure 1.6: Research strategy framework
Stellenbosch University http://scholar.sun.ac.za
13
CHAPTER 2
LITERATURE REVIEW: GLOBALIZATION IN THE
AUTOMOTIVE INDUSTRY AND THE STATUS OF THE SOUTH
AFRICAN AUTOMOTIVE INDUSTRY
2.1 INTRODUCTION
This chapter discusses two important topics in the research problem on the macro-level. Firstly, it
elaborates on the automotive industry with respect to trends in globalisation and the influences on
the supplier industry. This is important, as globalisation not only influences the location of
production of the OEMs, but also has significant influences on the supplier industry. Therefore,
distinctive aspects of globalisation in the automotive value chain will be discussed. Furthermore,
the impacts of the location of production and the competitive pressures for automotive suppliers
will be assessed.
After providing a global view of the automotive industry in the introduction and pointing out
important trends with regard to the research problem, the environment of the chosen case study
will be discussed. Concerning this, the South African automotive environment is analysed with
respect to the development and current status of the industry. As regulation is a significant feature
of the industry, the history and future of governmental influences will be discussed. Additionally,
structural issues in the South African automotive value chain will be examined in order to qualify
the case for further analysis.
2.2 GLOBALISATION TRENDS IN THE AUTOMOTIVE INDUSTRY
2.2.1 TRENDS IN THE AUTOMOTIVE INDUSTRY
Global vehicle production has more than doubled since 1975. Due to the emerging markets –
especially China and India – annual average growth rates of 3 per cent in the period 1990 to 2005
have been measured (Sturgeon et al., 2009: 11). An interesting fact is that seven countries
accounted for 80 per cent of world production in 1975, whereas 11 countries accounted for the
same share in 2005 (Sturgeon et al., 2009: 11). China‟s share of production rose especially, from 3
per cent in 1997 to 22 per cent in 2009 (Bailey et al., 2010: 311). This shows that production is
spreading into new markets for two main reasons:
- Companies want to take advantage of new sales opportunities.
- Companies want to profit from lower production costs in the new markets.
Stellenbosch University http://scholar.sun.ac.za

14
Veloso, Henry, Roth & Clark (2000: 37) support this by arguing that the spread in production
derives from new investment opportunities in Eastern Europe and Asia – again, especially China
and India. He furthermore comments on the global challenge for assembly productivity, which is
caused by increasing efficiencies of the world leaders in automotive production (e.g. Toyota).
The geographic transition of the automotive industry is also caused by market differences.
Emerging markets require car makers to alter their design and technological features to meet
demand and regulations in the specific areas (Bailey et al., 2010: 313). Therefore, they also have
to invest in affiliated design centres that help them to tailor vehicles to the national and regional
markets (Sturgeon et al., 2009). However, the home market still remains important for many
companies. As all of the leading OEMs have extended their markets by producing and selling
vehicles in a growing number of countries, the concentration of production and sales still remains
in the home locations, which is only changing gradually. Only the Japanese car makers are an
exception to this pattern, as they successfully penetrated the European (Nissan) and the North
American (Toyota, Nissan and Honda) markets (Sturgeon et al., 2009).
As stated above, it is interesting to view the globalisation trends on the one hand and the
importance of regional integration of production on the other hand. The substance of regional
production derives from political and strategic dimensions as well as from cultural, technical and
economic factors. As powerful local lead firms and industry associations combined with large-scale
employment and high rates of unionisation possess quite a strong political influence in their home
countries, most of the OEMs have chosen to restrict exports „voluntarily‟ and set up local
production to forestall political backlash (Sturgeon et al., 2009: 15). This argument is supported by
Veloso et al. (2000: 37), who state that a local supplier base is of advantage for the automotive
OEMs, because of increased buying power in respective countries. Hence, a local supplier base –
often forced by local content requirements – can only be installed by setting up production in the
new, emerging markets. Other factors, more technical and economic in nature, include the fact that
there are certain bulky vehicle parts (e.g. seats, transmission, etc.) which on the one hand are
costly to transport over long distances and on the other hand need to be delivered in the just in
sequence/just in time (JIS/JIT) systems of the OEMs. The latter issue can be countered by reliable
infrastructure and developed logistics capabilities. However, the transport of heavy and voluminous
goods via sea freight still remains costly and unpredictable. Coming back to the regional integration
and intensifying globalisation in the automotive industry, there are also still some national and local
elements that are defining factors, such as consumer tastes, purchasing power and public policy.
These factors include environmental regulations as well as the need to adapt vehicles to poorer
quality of fuel in developed countries (Sturgeon et al., 2009: 17).
Stellenbosch University http://scholar.sun.ac.za

15
Despite the long-term structural adoptions, the development of the automotive industry for the
years 2008/2009 shows a quite marked picture. Coming from an all-time high in production in the
years 2006/2007, the year 2008 brought serious disruption to the success story of rising production
and sales. The capacity utilisation figures for light vehicles in the North American Free Trade
Agreement area (NAFTA) and Europe illustrate this matter clearly by the comparison of data
before and during the crisis (see Figures 2.1 and 2.2).
Figure 2.1: NAFTA light vehicle assembly capacity utilisation (Feb 2008 vs. Feb 2009)
Source: Ward‟s Auto, 2009
Figure 2.2: European Union light vehicle assembly capacity utilisation (2007 vs. 2009)
Source: Ward‟s Auto, 2009
Stellenbosch University http://scholar.sun.ac.za

16
The figures show evidence that capacity utilisation shrank to levels where profitable operations are
marginal. This not only had impact on the OEMs, but also influenced the supplier business. The
study of Roland Berger & Lazard (2010: 8) shows the impact of the overcapacity on the EBIT
(Earnings before interest and taxes) margin of automotive suppliers in three of the big automotive
markets (see Figure 2.3). These shrinking supplier margins led to a number of bankruptcies as
equity ratios went down. And resorting to stronger suppliers by the OEMs to secure delivery and
limit the exposure to high-risk suppliers increased pressure in the supplier environment.
Figure 2.3: Supplier EBIT profitability by region 2009 vs. 2007
Source: Roland Berger & Lazard, 2010: 8
The turnaround of the automotive industry in 2010 in terms of global car production put the
revenues of the automotive suppliers quickly back to pre-crisis levels. In line with revenues, the
profit margins of the suppliers reached former heights, and even above (Roland Berger & Lazard,
September 2010: 2). Though revenues and profits are back „on track‟, structural issues like the
increase in factor costs and price pressures from the OEMs can be recognised in the industry.
Therefore, it is expected that margins will be under threat in 2011 and beyond, and structural
underperformers in the supplier industry will fail when volumes decline again (Roland Berger &
Lazard, September 2010: 2). This matter is supported by a KPMG (2010) study which points out
that especially upper value chain profitability is expected to decrease and tier-3 suppliers will be
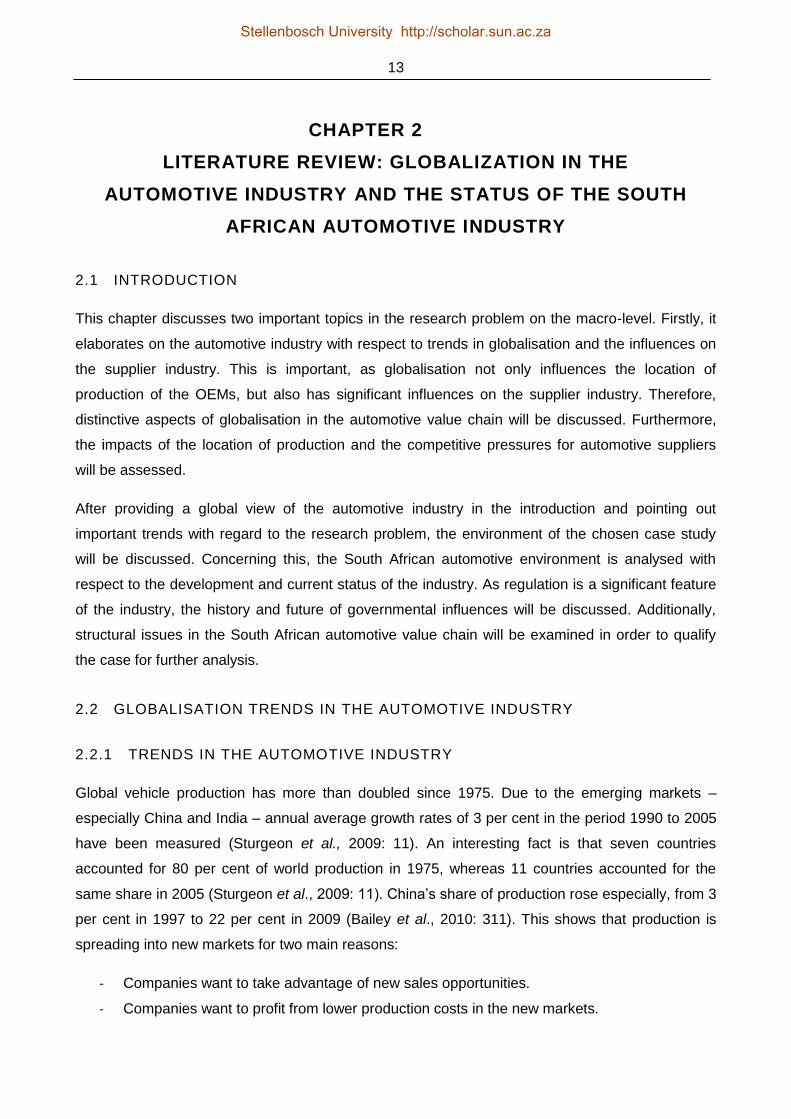
under threat from a profitability point of view (see Figure 2.4).
Stellenbosch University http://scholar.sun.ac.za
17
Figure 2.4: How profitable do you think the global automotive manufacturing, supplier and dealer industries will be over the next five years?
Source: KPMG, 2010: 12
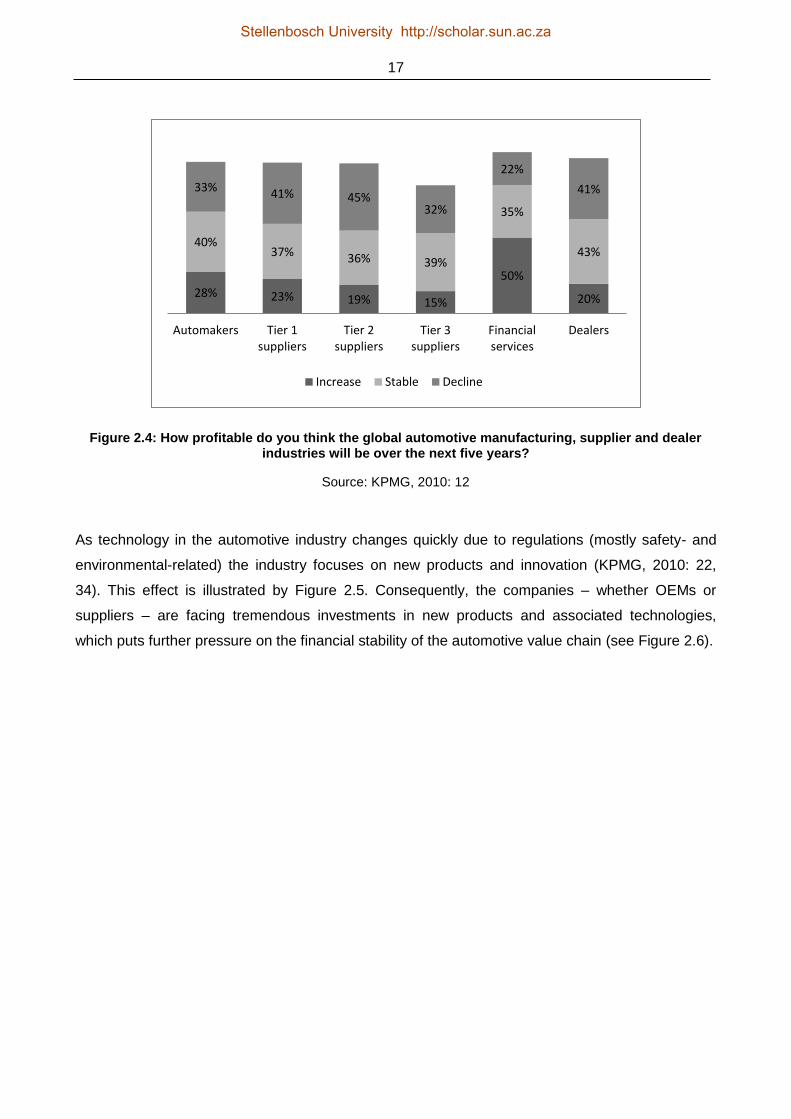
As technology in the automotive industry changes quickly due to regulations (mostly safety- and
environmental-related) the industry focuses on new products and innovation (KPMG, 2010: 22,
34). This effect is illustrated by Figure 2.5. Consequently, the companies – whether OEMs or
suppliers – are facing tremendous investments in new products and associated technologies,
which puts further pressure on the financial stability of the automotive value chain (see Figure 2.6).
28% 23% 19% 15%
50%
20%
40% 37% 36% 39%
35%
43%
33% 41% 45% 32%
22%
41%
Automakers Tier 1suppliers
Tier 2suppliers
Tier 3suppliers
Financialservices
Dealers
Increase Stable Decline
Stellenbosch University http://scholar.sun.ac.za
18
Figure 2.5: How important are the following issues to the global auto industry today?
Source: KPMG, 2010: 22
Figure 2.6: Do you expect suppliers to increase their investment over the next two years?
Source: KPMG, 2010: 32
85%
85%
81%
75%
64%
62%
64%
50%
81%
82%
85%
89%
72%
90%
72%
50%
79%
83%
86%
63%
65%
96%
59%
Developing new products
Developing new technologies
Reducing costs
Meeting environmental demands
Pricing and sales incentives
Improving product quality
Improving total affordability
Managing labour relations
2007 2008 2009
26%
86% 94%
56%
44% 45%
93% 93%
49% 53%
New plants New models /products
New technologies Marketing andadvertising
Logistics / distribution
2009 2008
Stellenbosch University http://scholar.sun.ac.za
19
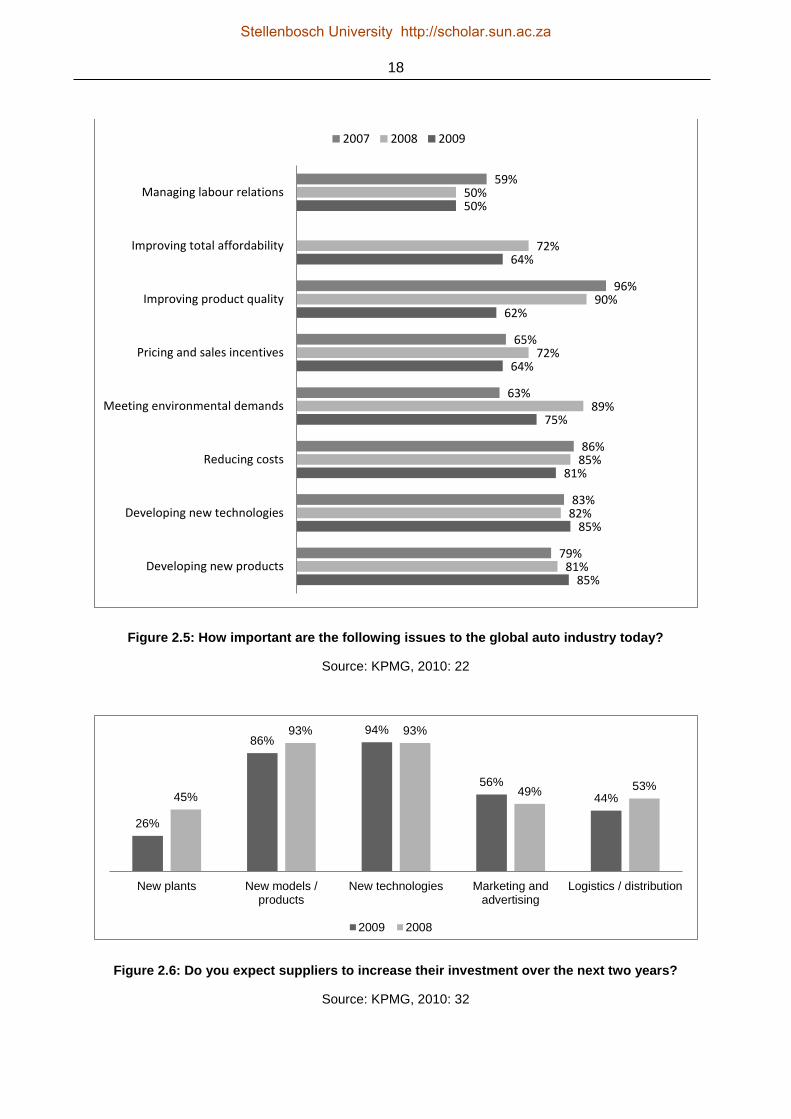
Another global trend which is worth depicting in the context of the research problem is that OEMs
are trying to bundle their production on platforms. This is because they are looking for economies
of scale due to the crucial constraint of cost competitiveness (Sturgeon & Florida, November 2000:
53). For instance, Honda is producing three dimensionally distinct versions of the Accord on their
flexible common platform. This leads to unique market versions whereby 60 per cent of parts are
common (Deloitte, 2009). The trend is expected to continue over the years, as Figure 2.7 shows.
Figure 2.7: Increase in global platform volumes
Source: CSM Worldwide, 2009
Despite the crisis in 2008/2009 and the recovery in 2010, the automotive industry is looking at
some challenging issues, mainly derived from globalisation and emerging markets. For at least a
decade, automotive OEMs have been widening their operations directly or indirectly to the
booming markets in Asia and the other BRIC (refers to the countries Brazil, Russia, India and
China) countries while trying to participate in the growth opportunities as well as in the prospect to
operate at lower production costs (see Figure 2.8). The move to lower-cost regions is driven by two
factors, as stated above: cost and demand. This fact can be understood by the term „global
footprint‟. A global footprint means that OEMs aim to link their production and sales in markets with
high growth rates. The emerging markets are characterised not only by an expanding population
and market growth rates high in the two digits, but these markets also continue to be attractive as
labour cost remains a fraction of that in the developed world – but this is only important as long it
works with productive capital (Veloso et al., 2000: 17).
Stellenbosch University http://scholar.sun.ac.za

20
Figure 2.8: The BRIC automotive markets will grow strongly through 2014
Source: Boston Consulting Group, January 2010: 7
Influences on the structure of the automotive industry are also recognised by trading blocs (e.g.
North American Free Trade Agreement (NAFTA), European Union (EU), Association of Southeast
Asian Nations (ASEAN) and the Mercado Común del Sur (MERCOSUR, the Southern Common
Market)), which will drive continued development of regional production systems as the risk of
exchange rate exposure and rising transportation cost pose a threat (Veloso et al., 2000: 37).
Within these blocs the migration to lower-cost locations will continue (e.g. Europe and Eastern
Europe). This strategy will also be used by OEMs to leverage their operations and sales in the
trading blocs as they build up plants in the low-cost regions to produce and market their goods
under a foreign label.
Additionally, the feature of consolidation will be ongoing as new markets evolve to mature states,
and the emerging markets (especially China and India) will continue to build up their own
resources to play a role in the world market. Further consolidation will increase scale, streamline
distribution, boost asset efficiency and give access to limited markets (Deloitte, 2009).
2.2.2 DISTINCTIVE ASPECTS OF GLOBALISATION
The automotive industry shares some features of globalisation with other globalised industries and
some other features are distinctive to the car business.
Stellenbosch University http://scholar.sun.ac.za

21
The automotive industry has several similarities with industries like electronics, apparel and
consumer goods. General similarities between these industries concern foreign direct investment,
global production and cross-border trade. Foreign direct investment is given to engage local
markets and to export back to the developed markets. A second common feature is that suppliers
from developed countries emerged to multinational companies that installed their operations in
emerging markets. This includes foreign direct investment as well as trade with those markets to
benefit from the low-cost environment, but also to serve the OEMs with products and services
(Sturgeon et al., 2009).
The automotive industry is distinctive because of its high degree of lead-firm concentration.
Though the firm structure is not as extreme as in the commercial aircraft industry, the level of
dominance by lead firms is high compared to other industries. One of the problems originating from
this concentrated firm structure is that industry standards are still underdeveloped, as 11 firms from
three countries dominate production in the main markets (Barnes & Morris, 2008; Kaplinsky, 2010;
Nadvi, 2008; Ponte & Gibbon, 2005). A second distinctive feature is that final assembly has been
kept closely to the end markets as a result of political sensitivities. Saturated home markets and
the imperative of „build where they sell‟ also influenced broadening production and the global
footprint of the OEMs (Sturgeon et al., 2009; Sturgeon, Van Biesebroeck & Gereffi, 2008). A third
attribute exclusive to the automotive industry is the strong regional structure. This only affects the
OEM landscape, but also the suppliers, which are orientating their facilities along with the large
manufacturers to ensure proximity and the ability to react fast. In contrast to this regional pattern of
integration are some other high-volume industries, such as electronics and apparel, which have
installed global-scale patterns of integration in their industries (Sturgeon et al., 2008). A fourth
unique characteristic of the car industry is that there are a few generic parts or subsystems that
can be used in a variety of end products. This is mainly due to the absence of standards across the
lead firms. The outcome is that most of the parts have to be customised for the different makes,
which, therefore, necessitates extensive investment in design and production by the suppliers
(Hsuan, 1999; Sturgeon et al., 2008). This also implies the need for close collaboration, as the
opportunities for modularisation of the value chain are limited due to factors such as engineering
and coordination concerns (Fourcade & Midler, 2004: 243–244).
In summary, the automotive industry is divided into regional, national and local value chains
incorporated into the global organisational structures and business relationships of the largest firms
(Sturgeon et al., 2009).
Stellenbosch University http://scholar.sun.ac.za

22
2.2.3 THE LOCATION OF PRODUCTION
The following discussion picks up the issue of the global fragmentation of automotive production
and points out the location drivers for suppliers.
The KPMG (2009a) report about the global location strategy of automotive suppliers points out four
key indicators. The first driver is growth. The growth differential is a powerful incentive, as
decreasing sales growth and shrinking margins in the mature markets make it an imperative to
capture revenue opportunities in the emerging markets. The move of the automotive OEMs to
these regions also influences the location strategy of first-tier suppliers, as their customers (the
automotive OEMs) ask for close proximity and to manufacture in low-cost countries. In particular,
suppliers of products who have to deliver just in sequence do not have a „real‟ choice with their
location strategy when they want to retain the customer. Another factor for growth is the search for
new customers. While following existing customers to new regions is one major reason for setting
up new production facilities in the emerging markets, another is to win new customers – either in
the region or by having another competitive advantage through the new location (KPMG, 2009a:
11). These two motives are often seen in close conjunction, as there is a risk of expanding the
business with dependency on a single customer (Maile, 2009).
The second location driver is cost. Automotive customers expect to reduce cost on a yearly basis –
a truism in the automotive industry. But the obstacles are not one-sided: before relocating the
business, the first option is to optimise production in order to cut costs. The most important cost
opportunities for suppliers in new markets are material cost, personnel cost and cost of capital,
whereas a threat is posed by the automatically increasing logistics cost (KPMG, 2009a: 14).
A third reason for location decisions is innovation. This is significant not merely for fundamental
research, but also for application engineering and process optimisation, which should be located
as close as possible to final production. When comparing suppliers from the mature markets to
suppliers from the emerging markets it becomes obvious that they have diametrically opposed
views of the location of Research and Development (R&D). Emerging-market suppliers intent to
spread their innovation work around the globe to capture important trends and technologies,
whereas suppliers from the traditional markets tend to stay domestic and only consider the biggest
emerging areas as worthwhile to set up Research and Development (KPMG, 2009a: 17).
The fourth location driver is risk. Risk is one of the cost factors considered when making decisions
about new locations by automotive suppliers (Maile, 2009). But the risk-calculation is only in a
premature state when it comes to detailed evaluation by the suppliers. Whereas political risk is only
considered in a risk-adjusted investment strategy, resources and currencies are actively managed
by hedging (KPMG, 2009a: 18).
Stellenbosch University http://scholar.sun.ac.za
23
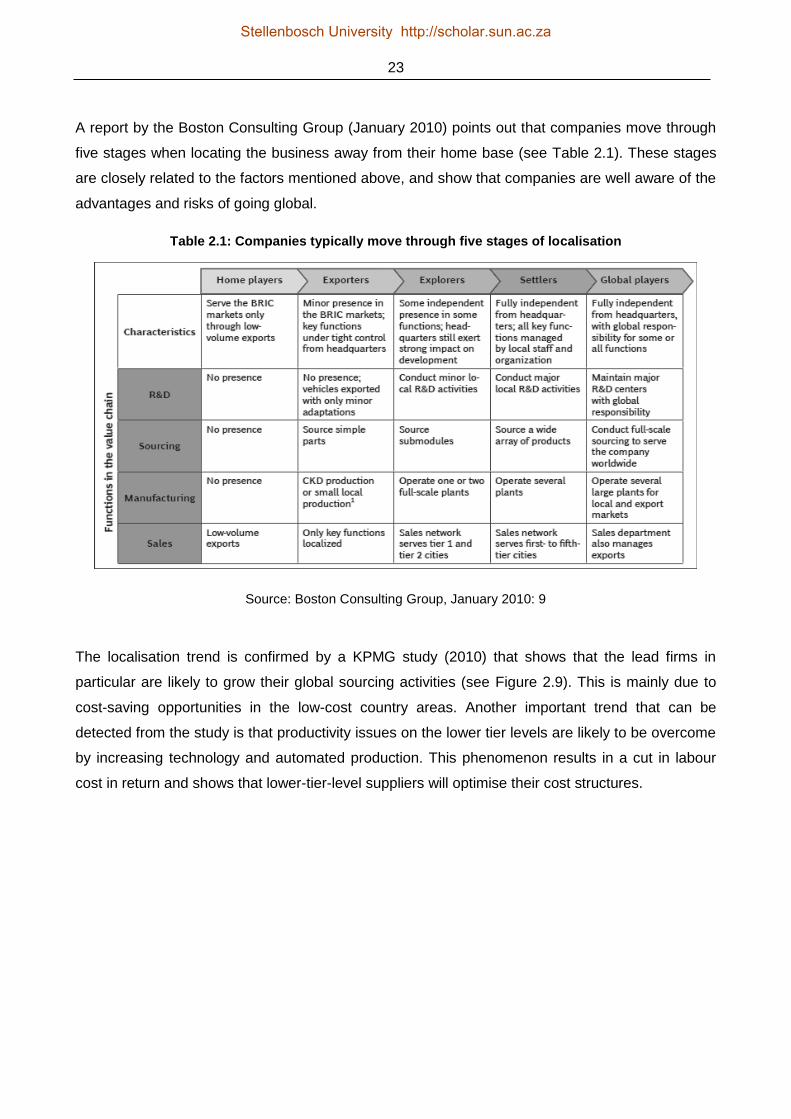
A report by the Boston Consulting Group (January 2010) points out that companies move through
five stages when locating the business away from their home base (see Table 2.1). These stages
are closely related to the factors mentioned above, and show that companies are well aware of the
advantages and risks of going global.
Table 2.1: Companies typically move through five stages of localisation
Source: Boston Consulting Group, January 2010: 9
The localisation trend is confirmed by a KPMG study (2010) that shows that the lead firms in
particular are likely to grow their global sourcing activities (see Figure 2.9). This is mainly due to
cost-saving opportunities in the low-cost country areas. Another important trend that can be
detected from the study is that productivity issues on the lower tier levels are likely to be overcome
by increasing technology and automated production. This phenomenon results in a cut in labour
cost in return and shows that lower-tier-level suppliers will optimise their cost structures.
Stellenbosch University http://scholar.sun.ac.za

24
Figure 2.9: What are the cost-saving opportunities for auto manufacturers and suppliers?
Source: KPMG, 2010: 16
2.3 THE SOUTH AFRICAN AUTOMOTIVE ENVIRONMENT
2.3.1 THE CURRENT STATUS OF THE SOUTH AFRICAN AUTOMOTIVE
INDUSTRY
The relative importance of the automotive industry as a business sector in South Africa becomes
obvious when one reviews some figures. The sector accounts for about 14 per cent of South
Africa's manufacturing exports. Seen locally, the automotive sector is a giant contributing about 6.2
per cent to the country's gross domestic product (GDP) in 2010 (the peak had been recognised in
2006, with 7.4 per cent of the country‟s GDP). The industry employs around 28,000 people directly
and another 64,000 in the components industry (NAACAM, 2010; NAAMSA, 2011b). Nevertheless,
South Africa can be regarded only as a minor contributor to global vehicle production, as total
52%
22%
31%
25%
69%
43%
66%
48%
62%
18%
47%
26%
29%
25%
54%
33%
60%
45%
51%
23%
39%
17%
35%
43%
65%
43%
57%
52%
48%
7%
Supply chain management
Tax efficiency
Salary costs
Wage costs / direct labour
Low cost country sourcing
Marketing and sales
Product materials innovations
Overhead cost reductions
Computer modelling
Healthcare
Tier 2 Suppliers Tier 1 suppliers OEMs
Stellenbosch University http://scholar.sun.ac.za

25
vehicle production add was nearly 77 million units worldwide in 2010 and South Africa contributed
less than 1 per cent to this figure (NAAMSA, 2011b).
South Africa was one of the best-performing car markets in the world before the financial crisis.
New vehicle sales figures soared to record-breaking levels for three years in succession, from
2004 to 2006. In 2006, sales increased by 14.4 per cent to just under 650,000 units (SAinfo,
September 2008). The total domestic production of vehicles in 2006 was registered at 588,000
units (NAAMSA, 2011b). Sales and local production started to fall in 2007 and continued to fall in
2008 and 2009 due to the financial crisis. Recent figures from 2010 show an upswing of sales to
492,000 units (+25 per cent compared to 2009) and an increase of local production to 472,000
vehicles (+26 per cent compared to 2009) (NAAMSA, 2011b). In line with the upturn in sales and
production, the production capacity levels increased from 60 per cent in 2009 to around 77 per
cent in 2010 (NAAMSA, 2011b). It can also be noted that capital expenditure continues to increase
after the deferral of various investment projects in 2009. The increase can also be largely attributed
to the Automotive Investment Scheme (AIS) which forms part of the Automotive Production
Development Program (APDP). Recent figures show that total planned investments are ZAR9
billion in the automotive assembler side and another ZAR4 billion on the component supplier side
(NAAMSA, 2011b).
South Africa exports vehicles to over 70 countries, mainly the United States of America (USA), the
United Kingdom (UK), Japan, Australia and the European Union. African export destinations
include Algeria, Zimbabwe and Nigeria (SAinfo, September 2008). Export figures of domestic
production average at 50 per cent in recent years (KPMG, March 2011).
It is expected that the increase in production and sales will continue in 2011 to above 550,000 units
(NAAMSA, 2011b). An interesting phenomenon can be observed when looking at the relationship
between local production, imports and exports of vehicles. Forecasts state that 65 per cent of the
local market is captured by imported vehicles, whereas 52 per cent of the local production is
exported (KPMG, March 2011). This trend is expected to continue in 2012 and turn around with the
start of the Automotive Production Development Program and the increase in local production and
suitable vehicles for the local market. By 2013 a proportion of 50 per cent locally produced vehicles
vs. imported vehicles will be achieved (KPMG, March 2011).
The South African government has identified the automotive industry as a key growth sector, with
the aim of increasing vehicle production to 1.2 million units by 2020, while significantly increasing
local content at the same time. Therefore, the successor of the Motor Industry Development
Program was announced in September 2008. Speaking at a briefing at the Union Buildings, Trade
and Industry Minister Mandisi Mpahlwa (Makapela, September 2008) said that the new Automotive
Stellenbosch University http://scholar.sun.ac.za
26
Production Development Program, which would run from 2013 to 2020, was designed to sustain
and expand the automotive industry‟s contribution to the South African economy, as well as to
deepen its local manufacturing impact. He said the Department of Trade and Industry had been
working on the successor scheme since 2005 in a bid to align the incentive to South Africa‟s World
Trade Organization (WTO) commitments, as well as to government‟s National Industrial Policy
Framework.
Looking at the South African automotive market and industry, the Motor Industry Development
Program has not only changed the focus of the industry from being inwardly to outwardly
orientated, it has also changed the nature of the political relationship between OEMs and domestic
automotive component firms. Due to changes in the ownership structure of domestic car
manufacturers from being owned locally to being controlled by multinational companies, the
industry is now faced with the international environment and global changes in the value chain
(Barnes, 2000a; Barnes, 2000b). The fact that South Africa‟s automotive industry sees itself linked
into the global automotive value chain exposes it directly to global competition. On the one hand,
this competitive force is responsible for substantial performance upgrades in the South African
automotive industry, and on the other hand it limits the opportunities for increases in value addition
and output. The benefits to the South African automotive industry of engaging in global value
chains are clear, but the long-term sustainability and development of the industry remains in
question (Barnes & Morris, 2008: 31).
2.3.2 AN INDUSTRY ANALYSIS OF SOUTH AFRICA‟S AUTOMOTIVE SECTOR
After having outlined the current status of the South African automotive industry it is important to
discuss the obstacles of the environment of the research problem. To pursue this discussion a
PESTLE analysis (stands for a Political, Economical, Social, Technological, Legal and
Environmental analysis of macro factors) of the South African environment and a SWOT analysis
(is a strategic planning method where the Strengths and Weaknesses on the one hand and the
Opportunities and Threats on the other hand are discussed) of South Africa‟s automotive industry
will point out the characteristics. Out of this discussion indications for the research problem will be
drawn. The discussion will be done on the macro-level using the PESTLE study and on the meso-
level using an industry SWOT analysis:
- A PESTLE study is used to characterise the environment in which the industry operates
- A SWOT analysis is used to assess the potentials and challenges of the industry
Table 2.2 summarises the PESTLE analysis for the South African automotive industry and
highlights the main implications for automotive suppliers.
Stellenbosch University http://scholar.sun.ac.za
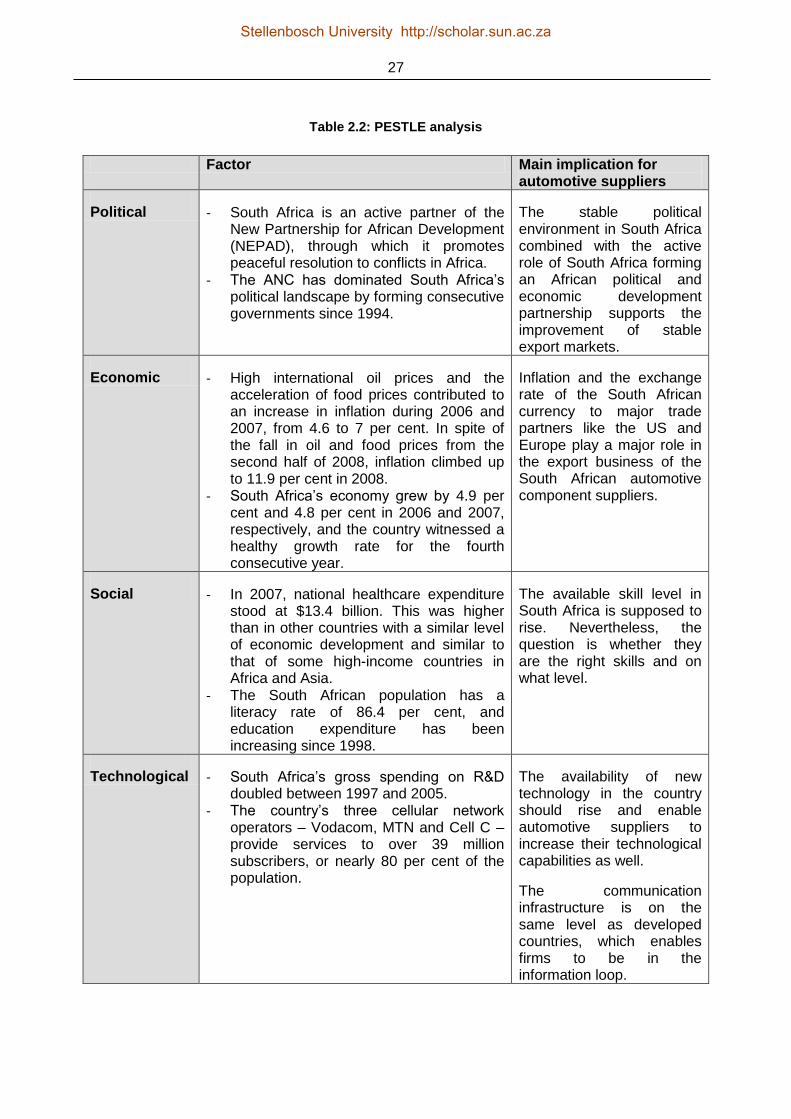
27
Table 2.2: PESTLE analysis
Factor Main implication for automotive suppliers
Political - South Africa is an active partner of the New Partnership for African Development (NEPAD), through which it promotes peaceful resolution to conflicts in Africa.
- The ANC has dominated South Africa‟s political landscape by forming consecutive governments since 1994.
The stable political environment in South Africa combined with the active role of South Africa forming an African political and economic development partnership supports the improvement of stable export markets.
Economic - High international oil prices and the acceleration of food prices contributed to an increase in inflation during 2006 and 2007, from 4.6 to 7 per cent. In spite of the fall in oil and food prices from the second half of 2008, inflation climbed up to 11.9 per cent in 2008.
- South Africa‟s economy grew by 4.9 per cent and 4.8 per cent in 2006 and 2007, respectively, and the country witnessed a healthy growth rate for the fourth consecutive year.
Inflation and the exchange rate of the South African currency to major trade partners like the US and Europe play a major role in the export business of the South African automotive component suppliers.
Social - In 2007, national healthcare expenditure stood at $13.4 billion. This was higher than in other countries with a similar level of economic development and similar to that of some high-income countries in Africa and Asia.
- The South African population has a literacy rate of 86.4 per cent, and education expenditure has been increasing since 1998.
The available skill level in South Africa is supposed to rise. Nevertheless, the question is whether they are the right skills and on what level.
Technological - South Africa‟s gross spending on R&D doubled between 1997 and 2005.
- The country‟s three cellular network operators – Vodacom, MTN and Cell C –provide services to over 39 million subscribers, or nearly 80 per cent of the population.
The availability of new technology in the country should rise and enable automotive suppliers to increase their technological capabilities as well.
The communication infrastructure is on the same level as developed countries, which enables firms to be in the information loop.
Stellenbosch University http://scholar.sun.ac.za
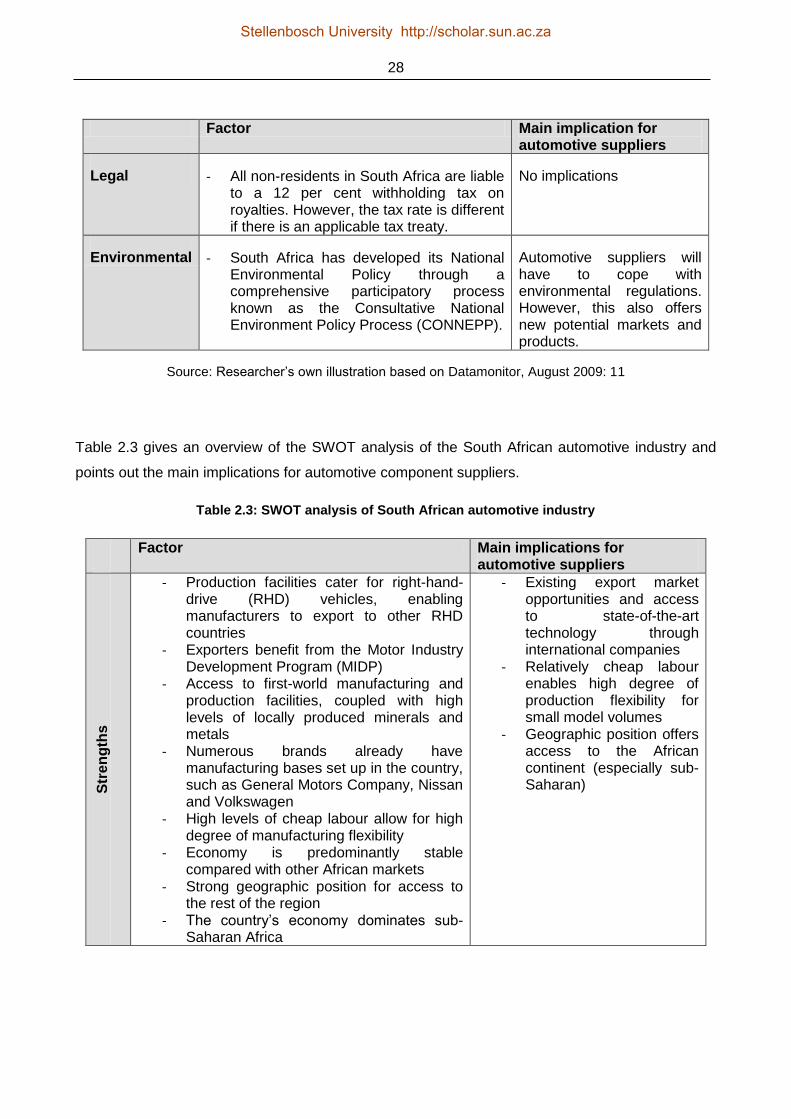
28
Factor Main implication for automotive suppliers
Legal - All non-residents in South Africa are liable to a 12 per cent withholding tax on royalties. However, the tax rate is different if there is an applicable tax treaty.
No implications
Environmental - South Africa has developed its National Environmental Policy through a comprehensive participatory process known as the Consultative National Environment Policy Process (CONNEPP).
Automotive suppliers will have to cope with environmental regulations. However, this also offers new potential markets and products.
Source: Researcher‟s own illustration based on Datamonitor, August 2009: 11
Table 2.3 gives an overview of the SWOT analysis of the South African automotive industry and
points out the main implications for automotive component suppliers.
Table 2.3: SWOT analysis of South African automotive industry
Factor Main implications for automotive suppliers
Str
en
gth
s
- Production facilities cater for right-hand-drive (RHD) vehicles, enabling manufacturers to export to other RHD countries
- Exporters benefit from the Motor Industry Development Program (MIDP)
- Access to first-world manufacturing and production facilities, coupled with high levels of locally produced minerals and metals
- Numerous brands already have manufacturing bases set up in the country, such as General Motors Company, Nissan and Volkswagen
- High levels of cheap labour allow for high degree of manufacturing flexibility
- Economy is predominantly stable compared with other African markets
- Strong geographic position for access to the rest of the region
- The country‟s economy dominates sub-Saharan Africa
- Existing export market opportunities and access to state-of-the-art technology through international companies
- Relatively cheap labour enables high degree of production flexibility for small model volumes
- Geographic position offers access to the African continent (especially sub-Saharan)
Stellenbosch University http://scholar.sun.ac.za
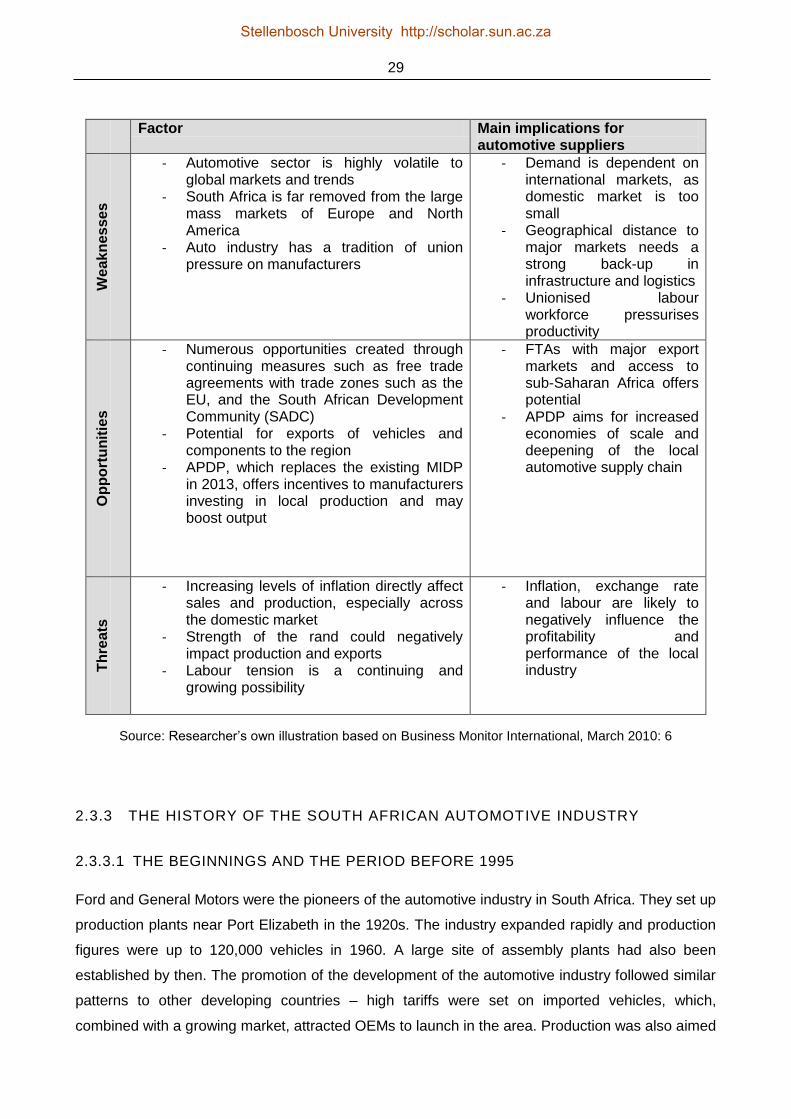
29
Factor Main implications for automotive suppliers
We
akn
es
ses
- Automotive sector is highly volatile to global markets and trends
- South Africa is far removed from the large mass markets of Europe and North America
- Auto industry has a tradition of union pressure on manufacturers
- Demand is dependent on international markets, as domestic market is too small
- Geographical distance to major markets needs a strong back-up in infrastructure and logistics
- Unionised labour workforce pressurises productivity
Op
po
rtu
nit
ies
- Numerous opportunities created through continuing measures such as free trade agreements with trade zones such as the EU, and the South African Development Community (SADC)
- Potential for exports of vehicles and components to the region
- APDP, which replaces the existing MIDP in 2013, offers incentives to manufacturers investing in local production and may boost output
- FTAs with major export markets and access to sub-Saharan Africa offers potential
- APDP aims for increased economies of scale and deepening of the local automotive supply chain
Th
rea
ts
- Increasing levels of inflation directly affect sales and production, especially across the domestic market
- Strength of the rand could negatively impact production and exports
- Labour tension is a continuing and growing possibility
- Inflation, exchange rate and labour are likely to negatively influence the profitability and performance of the local industry
Source: Researcher‟s own illustration based on Business Monitor International, March 2010: 6
2.3.3 THE HISTORY OF THE SOUTH AFRICAN AUTOMOTIVE INDUSTRY
2.3.3.1 THE BEGINNINGS AND THE PERIOD BEFORE 1995
Ford and General Motors were the pioneers of the automotive industry in South Africa. They set up
production plants near Port Elizabeth in the 1920s. The industry expanded rapidly and production
figures were up to 120,000 vehicles in 1960. A large site of assembly plants had also been
established by then. The promotion of the development of the automotive industry followed similar
patterns to other developing countries – high tariffs were set on imported vehicles, which,
combined with a growing market, attracted OEMs to launch in the area. Production was also aimed
Stellenbosch University http://scholar.sun.ac.za
30
solely at the domestic market, which kept the South African assembly plants isolated from their
parents‟ global production networks. However, the operations of the foreign car makers were highly
profitable (Black, 2001; Barnes, 2000a).
Despite the cost advantages for the OEMs, the level of local content was quite low at this stage,
averaging about 20 per cent. This also led to negative balance of payments, as most of the
components for vehicles were imported. From 1961 the first of a series of local content
programmes was introduced. Domestic sourcing of 11 peripheral items was required (e.g. tyres,
batteries, etc.) and higher local content levels were incentivised with import permits. Local content
by weight rose to just above 50 per cent in the following decade. Due to local content being
measured on a mass basis, a component industry for the heavier parts of vehicles, such as body
pressings, developed. Under the next phases of the government regulations, which had similar
requirements to the former ones, local content reached 66 per cent by 1977 and consolidation
shaped the industry‟s development up to 1989 (Black, 2001; Black & Bhanisi, 2006).
The problems with the mass-based approach of local content became obvious as more highly
sophisticated components were introduced into vehicle production. These components were all
imported while still meeting the regulations in terms of local content by weight. In the end, the
automotive industry was producing 20 different model variants for a market of 172,000 passenger
cars in the mid-1980s (Black & Bhanisi, 2006: 6).
The result of the first series of local content programmes was a low-volume, high-cost production
structure that locked domestic suppliers into the production of low technology in uneconomical
volumes. Additionally, the 1980s were marked by a stagnating market caused by political instability
and growing international isolation.
The phase VI programme brought significant changes to the government regulations in the
automotive industry when introduced in 1989. It measured local content by value instead of weight.
The local content was calculated on a net foreign exchange basis. This meant that exports by an
assembler counted as local content and, therefore, increased the local content of domestically
produced vehicles. A minimum prescription of 50 per cent local content was required while the
targeted local content was 75 per cent. This means that a maximum of 25 per cent of „local
content‟ could be made up of exports. The system operated with an excise duty of 37.5 per cent on
all locally assembled vehicles with an allowance of 50 per cent on the local content. As a result, if
local-content requirements had been achieved, no duty would have been payable (Black & Bhanisi,
2006: 7). Additionally, some subsectors, like completely built-up vehicles, spare parts and
accessories, received tariff protection and as a result imports were minimal. Also, exports were
subsidised in the form of a rebate on excise duty of 50 per cent. All the exports were channelled
Stellenbosch University http://scholar.sun.ac.za

31
through vehicle assemblers, and component suppliers had to negotiate their receivables of the
subsidy, which averaged at 30–40 per cent of the rebate (Black & Bhanisi, 2006: 7).
The impact of the phase VI of the government programmes is twofold. Firstly, exports rose
substantially and faster than expected. The OEMs mediated the process of export growth through
their international network by identifying local components where the local producers had a
competitive advantage. Simultaneously the OEMs used the export opportunities to decrease local
content in real terms, as they could compensate the lower local content value by rising exports. All
imports were in the form of completely knocked down (CKD) packages so that if a domestic
supplier were granted a part of the package the international supplier would remove the
component from the pack and subtract a „deletion allowance‟. These allowances were held below
international competitive prices and removed the former protection of domestic suppliers
completely. This brought a threat to components that were part of sub-assemblies because
importing was cheaper and restricted supply and quality issues. The impact on domestic
component suppliers was seen in other dimensions as well. As local content was then measured
by value instead of mass, specific components with high mass and low-value characteristics came
under pressure because of the high cost with regard to tooling and uneconomical production runs
(e.g. body pressings, plastic moulded components). This issue leads to the other impact of the
phase VI programme. The proliferation of models and makes in the domestic assembly industry
derives from the greater flexibility of sourcing options that allowed the OEMs to take advantage of
cheaper foreign components. As a result, low-volume models forced the domestic component
industry to operate in an uncompetitive environment as protection was being removed. An
additional influence was brought in by the political and economic uncertainty at the time the
programme was introduced, which led to a general lack of investor confidence (Black, 2001; Black
& Bhanisi, 2006).
A common feature to other developing countries, like Brazil and India, was the combination of high
tariffs and local content requirements, which were designed to encourage OEM-supplier linkages.
But a distinctive feature was imposed by the sanctions in the late 1970s, which led to the
disinvestment of assemblers (Ford and GM) in South Africa. A proposition of ownership developed
with only two international firms wholly owning their operations in South Africa (VW and BMW). All
other assemblers had local stockholders and produced under the „franchise‟ of the international
OEMs. This unique dimension was characterised by locally owned assembly firms producing
international products (Barnes, 2000: 404).
Stellenbosch University http://scholar.sun.ac.za

32
2.3.3.2 THE MOTOR INDUSTRY DEVELOPMENT PROGRAMME
To overcome the shortfalls of the series of local content programmes the Motor Industry
Development Programme (MIDP) was initiated in 1995. The programme was formed by a group
consisting of members of the automotive industry organisations, trade unions and government.
One of the major issues, the decrease of proliferation of models, was not accepted by the
assembler organisation, the National Association of Automobile Manufacturers of South Africa.
Therefore, the Motor Industry Development Program followed the direction of the phase VI
programme with the difference that tariffs had to be downgraded by General Agreement on Tariffs
and Trade (GATT) obligations, and local content requirements were fully abolished. The major
difference from the local content programmes was an import-export complementation scheme that
could be used to offset import duties by exporting vehicles and components. Import duties were
phased down to 40 per cent for light vehicles and 30 per cent for components in 2003 and
additionally light vehicle imports were entitled to a duty-free allowance of 27 per cent of the
wholesale price (Black & Bhanisi, 2006: 10). In addition to the duty allowances mentioned above,
vehicle manufacturers who invested in major export programmes were entitled to a Productive
Asset Allowance (PAA) starting in 2003. The qualifying investment would be spread over five years
and could be translated into duty credits worth 20 per cent of the respective investment (Black &
Bhanisi, 2006: 12). Kaggwa et al. (2009: 3080) summarise the intentions of the Motor Industry
Development Program in a static uni-directional model (see Figure 2.10).
Figure 2.10: Static uni-directional MIDP incentive model
Source: Kaggwa et al., 2009: 3080
The specific aim of the Motor Industry Development Program with respect to international
competitiveness of OEMs and suppliers was the increase of scale of production in the automotive
industry. As a result of the series of local content programmes, the industry was fairly scattered
with low production volume per model and, therefore, offered an uncompetitive environment for
Stellenbosch University http://scholar.sun.ac.za
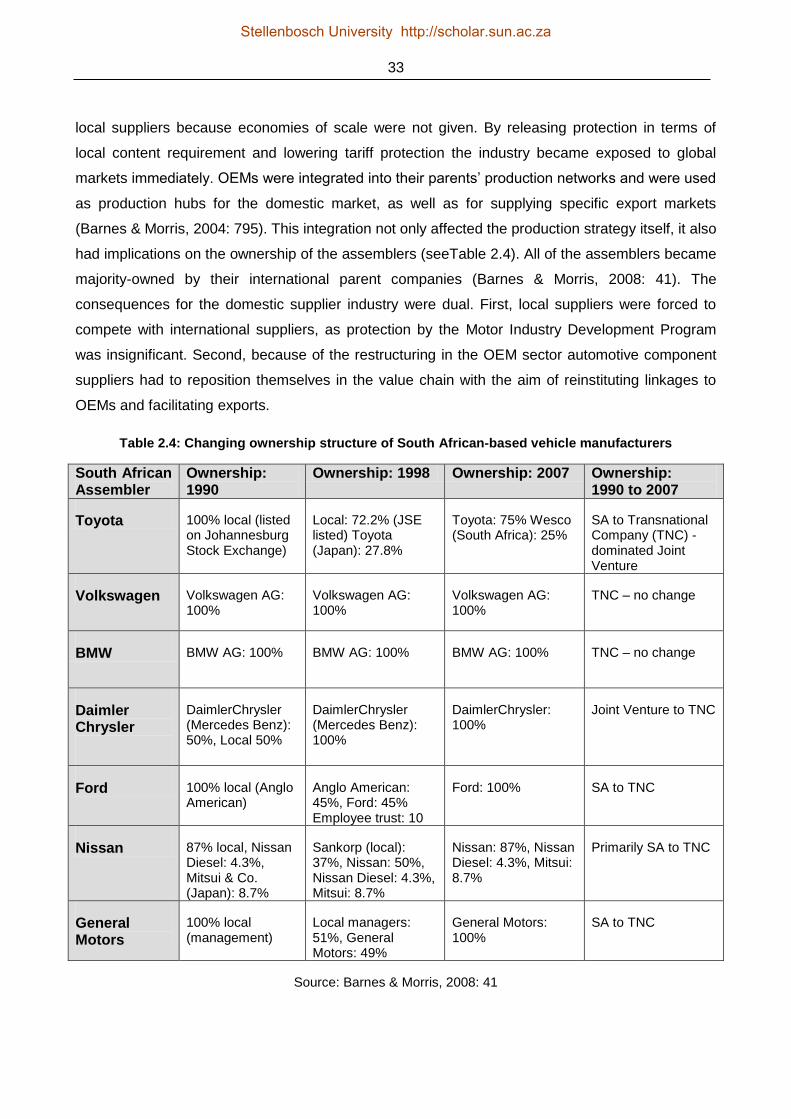
33
local suppliers because economies of scale were not given. By releasing protection in terms of
local content requirement and lowering tariff protection the industry became exposed to global
markets immediately. OEMs were integrated into their parents‟ production networks and were used
as production hubs for the domestic market, as well as for supplying specific export markets
(Barnes & Morris, 2004: 795). This integration not only affected the production strategy itself, it also
had implications on the ownership of the assemblers (seeTable 2.4). All of the assemblers became
majority-owned by their international parent companies (Barnes & Morris, 2008: 41). The
consequences for the domestic supplier industry were dual. First, local suppliers were forced to
compete with international suppliers, as protection by the Motor Industry Development Program
was insignificant. Second, because of the restructuring in the OEM sector automotive component
suppliers had to reposition themselves in the value chain with the aim of reinstituting linkages to
OEMs and facilitating exports.
Table 2.4: Changing ownership structure of South African-based vehicle manufacturers
South African Assembler
Ownership: 1990
Ownership: 1998 Ownership: 2007 Ownership: 1990 to 2007
Toyota 100% local (listed on Johannesburg Stock Exchange)
Local: 72.2% (JSE listed) Toyota (Japan): 27.8%
Toyota: 75% Wesco (South Africa): 25%
SA to Transnational Company (TNC) -dominated Joint Venture
Volkswagen Volkswagen AG: 100%
Volkswagen AG: 100%
Volkswagen AG: 100%
TNC – no change
BMW BMW AG: 100% BMW AG: 100% BMW AG: 100% TNC – no change
Daimler Chrysler
DaimlerChrysler (Mercedes Benz): 50%, Local 50%
DaimlerChrysler (Mercedes Benz): 100%
DaimlerChrysler: 100%
Joint Venture to TNC
Ford 100% local (Anglo American)
Anglo American: 45%, Ford: 45% Employee trust: 10
Ford: 100% SA to TNC
Nissan 87% local, Nissan Diesel: 4.3%, Mitsui & Co. (Japan): 8.7%
Sankorp (local): 37%, Nissan: 50%, Nissan Diesel: 4.3%, Mitsui: 8.7%
Nissan: 87%, Nissan Diesel: 4.3%, Mitsui: 8.7%
Primarily SA to TNC
General Motors
100% local (management)
Local managers: 51%, General Motors: 49%
General Motors: 100%
SA to TNC
Source: Barnes & Morris, 2008: 41
Stellenbosch University http://scholar.sun.ac.za

34
However, the consequences in structural change were not only seen in the OEM sector. As OEMs
were conducting an international strategic pattern, with model rationalisation on the one hand and
model differentiation on the other (see platform strategy, Section 2.2.1), they also concentrated
their resources on overall vehicle design and systems integration. Hence, it became important that
global suppliers took over design responsibilities and the control of the supply chain for sub-
assemblies. To ensure worldwide alignment and to reduce complexity in the supply chain OEMs
chose to forge global relationships with their first-tier suppliers. These suppliers had to ensure the
worldwide supply chain and in order to this they set up operations near to their customers. This
concept of follow sourcing was either accomplished by building sites on a greenfield in proximity to
their customers‟ plants or by purchasing enterprises in the respective areas (Barnes & Morris,
2008: 34).
South African OEMs also wanted their domestic suppliers to be integrated globally and, therefore,
have equity relationships with international firms. In an era with local content requirements
whereby suppliers had licensing agreements with multinationals, the trend was heading
increasingly towards more integration of local suppliers in the global automotive value chain. This
trend is pictured in the following illustrations. Figure 2.11 shows schematically the trend of sourcing
strategies by OEMs in favour of wholly owned multinational subsidiaries. This trend is supported by
evidence of a sample of the supplier structure of four OEMs (see Table 2.5) and also by an
example of the changes in the supplier structure of an automotive OEM before and after the
liberalisation (see Figure 2.12).
Figure 2.11: Changing strategic perspectives on the ownership of component suppliers
Source: Barnes & Kaplinsky, 2000: 804
Stellenbosch University http://scholar.sun.ac.za
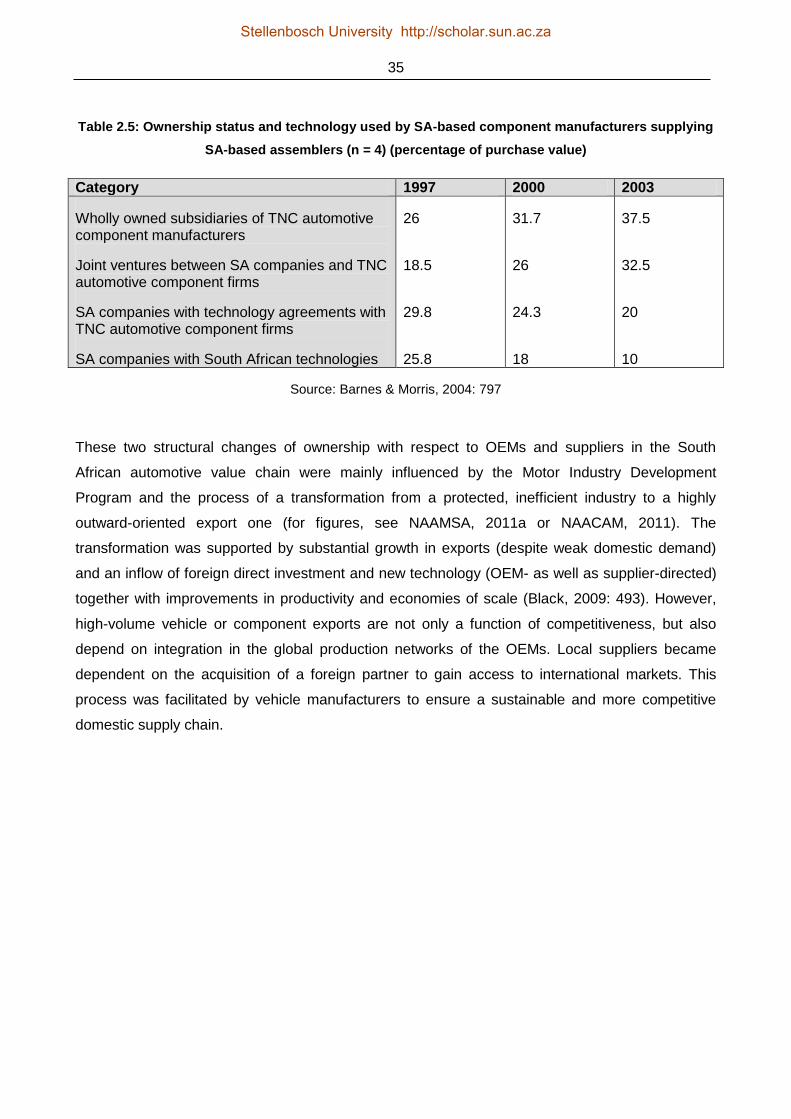
35
Table 2.5: Ownership status and technology used by SA-based component manufacturers supplying
SA-based assemblers (n = 4) (percentage of purchase value)
Category 1997 2000 2003
Wholly owned subsidiaries of TNC automotive component manufacturers
Joint ventures between SA companies and TNC automotive component firms
SA companies with technology agreements with TNC automotive component firms
SA companies with South African technologies
26
18.5
29.8
25.8
31.7
26
24.3
18
37.5
32.5
20
10
Source: Barnes & Morris, 2004: 797
These two structural changes of ownership with respect to OEMs and suppliers in the South
African automotive value chain were mainly influenced by the Motor Industry Development
Program and the process of a transformation from a protected, inefficient industry to a highly
outward-oriented export one (for figures, see NAAMSA, 2011a or NAACAM, 2011). The
transformation was supported by substantial growth in exports (despite weak domestic demand)
and an inflow of foreign direct investment and new technology (OEM- as well as supplier-directed)
together with improvements in productivity and economies of scale (Black, 2009: 493). However,
high-volume vehicle or component exports are not only a function of competitiveness, but also
depend on integration in the global production networks of the OEMs. Local suppliers became
dependent on the acquisition of a foreign partner to gain access to international markets. This
process was facilitated by vehicle manufacturers to ensure a sustainable and more competitive
domestic supply chain.
Stellenbosch University http://scholar.sun.ac.za
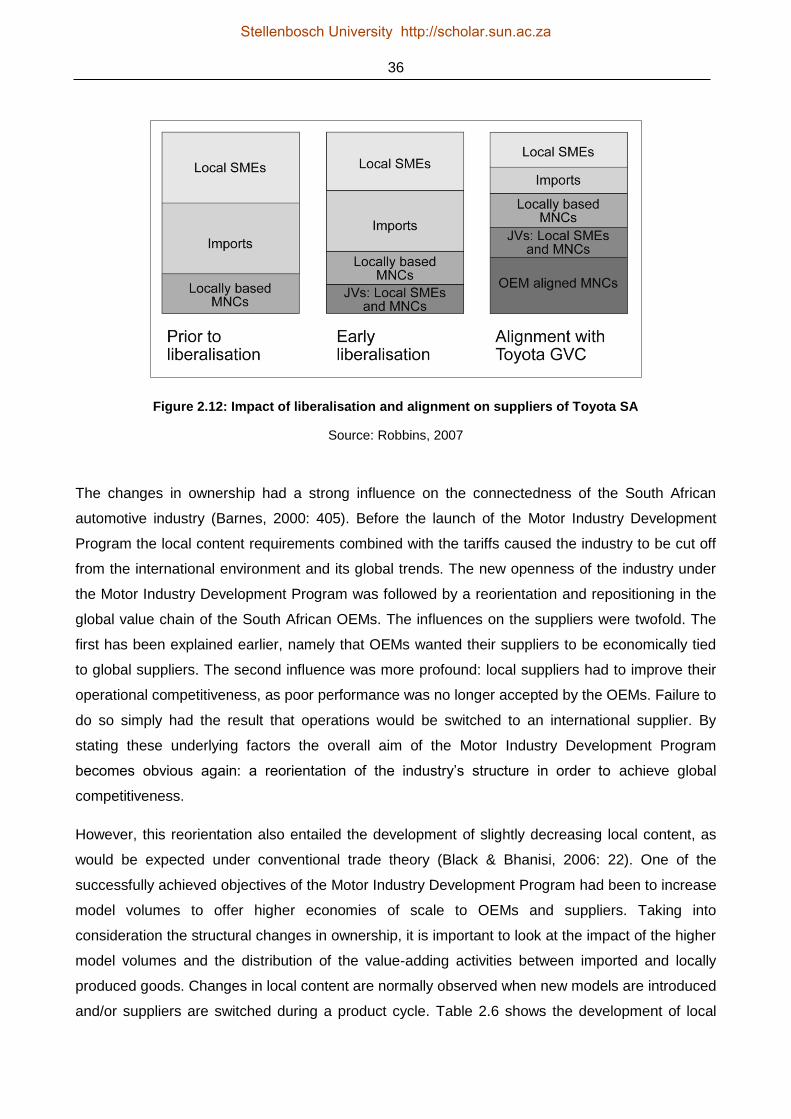
36
Figure 2.12: Impact of liberalisation and alignment on suppliers of Toyota SA
Source: Robbins, 2007
The changes in ownership had a strong influence on the connectedness of the South African
automotive industry (Barnes, 2000: 405). Before the launch of the Motor Industry Development
Program the local content requirements combined with the tariffs caused the industry to be cut off
from the international environment and its global trends. The new openness of the industry under
the Motor Industry Development Program was followed by a reorientation and repositioning in the
global value chain of the South African OEMs. The influences on the suppliers were twofold. The
first has been explained earlier, namely that OEMs wanted their suppliers to be economically tied
to global suppliers. The second influence was more profound: local suppliers had to improve their
operational competitiveness, as poor performance was no longer accepted by the OEMs. Failure to
do so simply had the result that operations would be switched to an international supplier. By
stating these underlying factors the overall aim of the Motor Industry Development Program
becomes obvious again: a reorientation of the industry‟s structure in order to achieve global
competitiveness.
However, this reorientation also entailed the development of slightly decreasing local content, as
would be expected under conventional trade theory (Black & Bhanisi, 2006: 22). One of the
successfully achieved objectives of the Motor Industry Development Program had been to increase
model volumes to offer higher economies of scale to OEMs and suppliers. Taking into
consideration the structural changes in ownership, it is important to look at the impact of the higher
model volumes and the distribution of the value-adding activities between imported and locally
produced goods. Changes in local content are normally observed when new models are introduced
and/or suppliers are switched during a product cycle. Table 2.6 shows the development of local
Stellenbosch University http://scholar.sun.ac.za
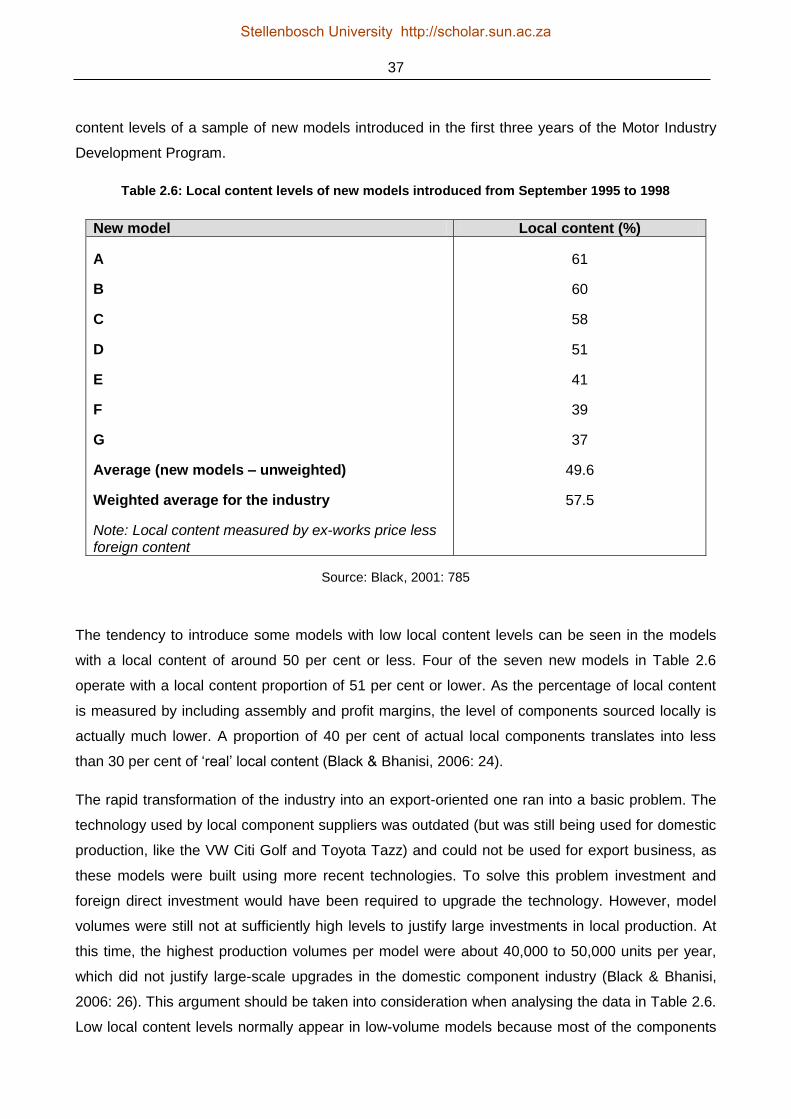
37
content levels of a sample of new models introduced in the first three years of the Motor Industry
Development Program.
Table 2.6: Local content levels of new models introduced from September 1995 to 1998
New model Local content (%)
A
B
C
D
E
F
G
Average (new models – unweighted)
Weighted average for the industry
Note: Local content measured by ex-works price less foreign content
61
60
58
51
41
39
37
49.6
57.5
Source: Black, 2001: 785
The tendency to introduce some models with low local content levels can be seen in the models
with a local content of around 50 per cent or less. Four of the seven new models in Table 2.6
operate with a local content proportion of 51 per cent or lower. As the percentage of local content
is measured by including assembly and profit margins, the level of components sourced locally is
actually much lower. A proportion of 40 per cent of actual local components translates into less
than 30 per cent of „real‟ local content (Black & Bhanisi, 2006: 24).
The rapid transformation of the industry into an export-oriented one ran into a basic problem. The
technology used by local component suppliers was outdated (but was still being used for domestic
production, like the VW Citi Golf and Toyota Tazz) and could not be used for export business, as
these models were built using more recent technologies. To solve this problem investment and
foreign direct investment would have been required to upgrade the technology. However, model
volumes were still not at sufficiently high levels to justify large investments in local production. At
this time, the highest production volumes per model were about 40,000 to 50,000 units per year,
which did not justify large-scale upgrades in the domestic component industry (Black & Bhanisi,
2006: 26). This argument should be taken into consideration when analysing the data in Table 2.6.
Low local content levels normally appear in low-volume models because most of the components
Stellenbosch University http://scholar.sun.ac.za

38
are sourced from the international supply networks of the OEMs and multinational suppliers to limit
direct investment and take advantage of economies of scale in a price-sensitive market. A
comparison between local content in components of export- and non-export-focused suppliers
supports the volume-based argument. The average proportion of local content in the period 2000–
2005 for exporters was 90 per cent, whereas for non-exporters it was below 70 per cent (Black &
Bhanisi, 2006: 27). Higher volumes enabled exporting suppliers to invest in technology in order to
supply international markets, while non-exporters still had to handle uneconomical volumes and,
therefore, relied on international supply chains for particular (sub)-components that needed high
investment.
A second factor influencing local content levels derived from foreign direct investment and the
different sourcing patterns of multinational suppliers. Because of the growing export business and
the follow-source expectations of the automotive lead firms, foreign direct investment was quite
substantial at the end of the 1990s and the beginning of the new millennium. Figure 2.11 shows
the progression in the supply chain of South African OEMs from South African component
companies with local technologies to wholly owned subsidiaries of multinational suppliers. Local
content data for the period 2000–2005 confirms a significant difference of local content in
components for multinational suppliers and South African-owned suppliers. Whereas South
African-owned suppliers focus their supply chain activities on domestic sub-products (with a
weighted local content of 90 per cent) the multinational suppliers operate on a basis of just two-
thirds locally produced sub-components (Black & Bhanisi, 2006: 26). The use of foreign inputs
mirrors the global trend of dispersed production networks in the automotive industry. But it is also
caused by the fact that production volumes for particular domestically used products are not large
enough to build up local production. In this case multinational suppliers prefer to take advantage of
their global networks in order to set up their supply chains.
2.3.4 FUTURE CHALLENGES FOR SOUTH AFRICA‟S AUTOMOTIVE INDUSTRY
2.3.4.1 SOUTH AFRICA‟S AUTOMOTIVE INDUSTRY IN AN ADVANCED EMERGING
MARKET
A ranking by the FTSE Group (a provider of stock market indices) classifies South Africa as an
advanced emerging market on the basis of its national income and its market infrastructure (FTSE
Group, 2009). Other countries in this market classification are Brazil, Hungary, Mexico, Poland and
Taiwan. Markets are assessed with criteria regarding the market and regulatory environment, the
custody and settlement, the dealing landscape and whether a developed derivative market exists
(for further information, see FTSE Group, 2009). Advanced emerging markets are classified as
such because they are upper middle gross national income (GNI) countries with advanced market
Stellenbosch University http://scholar.sun.ac.za

39
structures or high-income GNI countries with less developed markets. Other categories, as defined
by the FTSE global equity index series, are developed countries, secondary emerging countries
and frontier countries. Some other classifications also rank South Africa in the category of an
emerging market. The Morgan Stanley Capital International Barra index (MSCI Barra) simply
includes South Africa in the emerging markets section (MSCI Barra, 2009). South Africa is also a
member of BRICS, which includes South Africa among the largest developing economies together
with Brazil, Russia, India and China. And there are more terms and definitions that categorise
South Africa in the same league as other newly industrialised countries (NICs).
The general classification of South Africa in terms of its market and economic environment raises
the question of what stage does the South African automotive industry find itself in. Put another
way, Barnes (2008: 39) asks: „What then of those developing countries (such as South Africa) with
automotive industries that are important contributors to economic wealth, but appear to be caught
between the established, developed economy industries and the rapidly growing, highly
competitive Asian economies?‟ This comment refers to the matter of the dispersed automotive
industry. Lead firms (OEMs) in the developed countries (like the US, Japan and Western Europe)
are controlling the development of the worldwide automotive industry. And the ways in which
countries or regions are integrated into global value chains play a significant role. There is the
positive outcome of integration on the one hand: export growth and expanded production, foreign
direct investment, general industry upgrading – which is normally is accompanied by a decline in
local ownership and the downgrading of domestically owned firms (Black, 2009: 483–484). But on
the other hand, the result could also be that an industry is downgraded to the periphery of
automotive networks.
So what are the main trends with regard to the automotive industry in developing countries and
their respective influences on South Africa‟s automotive industry? First, the share of emerging
markets in the automotive industry with regard to both domestic sales and export production has
grown considerably. Second, global automotive value chains are better described by „regionalism‟
than by globalisation, which implies that an agglomeration in specific areas can be observed. And
third, within developing country locations there is a growing concentration in markets with high
growth rates and large market potential (Black, 2009: 485). From these main trends emerge
different types of viable automotive spaces, which can be identified by specific criteria. The first is a
national economy that offers a very large population, low vehicle ownership and dynamic economic
growth rates. The protected markets of China and India are two classic cases of these kinds of
economies. These countries offer the potential to build up large-scale integrated industries, which
are even likely to include a substantial domestic ownership. The second type of a viable
automotive space is developing countries that adjoin developed market areas. These areas have
Stellenbosch University http://scholar.sun.ac.za
40
the potential to become integrated into the neighbouring developed markets and profit from a
combination of reasonable technological capabilities combined with low wages and short distances
to the developed markets. Mexico, with its adjacent location to the US and the advantage of being
a member of the North American Free Trade Agreement, is one example, as are the Eastern
European countries (Poland, Czech Republic, Hungary and Slovakia) because of their recent
inclusion in the expanded European Union and the resultant liberalisation of trade. The third type of
viable automotive spaces is constituted by emerging regional markets which consist of countries
allied by trade agreements. Two examples are the Mercado Comùn del Sur (MERCOSUR),
integrating Brazil, Argentina, Paraguay, Uruguay and Venezuela in a regional free-trade area and
the Association of Southeast Asian Nations (ASEAN), consisting of ten countries (members include
Thailand, Malaysia, Indonesia, the Philippines, Singapore, etc.). These geopolitical and economic
organisations align efforts for economic growth, social progress and stability in the region. With
respect to the automotive industry, inefficiencies can develop in these pacts whenever more than
one country has ambitions in vehicle production. All other environments which aim to establish the
automotive industry and its integration in the global automotive value chain lack one major attribute
compared to the three types of viable automotive market environments described above: a major
(domestic) market potential in terms of current access to regional groupings and the potential to
benefit from membership of one of the large trading blocs (Black, 2009: 486).
South Africa‟s automotive industry does not fully qualify as one of these viable automotive spaces.
It neither profits from substantial growth potential nor is it integrated into a regional emerging
economic group – apart from the Southern African Development Community and some other
African trade areas, which are simply too small from an economic point of view. Its geographic
location does not favour South Africa either, as the traditional automotive markets and emerging
automotive markets are distant.
So the question remains – at what stage does South Africa‟s automotive industry find itself in if a
classification according to general types of economic grading is not possible? A description of the
industry‟s development, which is more inwardly oriented, defines three different stages (see Table
2.7) of automotive production (Black, 2009: 491). These three stages start with completely knocked
down assembly, whereby completely knocked down packs are imported and assembled. The CKD
(completely knocked down) stage is characterised by low volume and high cost, especially when a
high level of localisation is stipulated by governmental regulations. The industry is focused on the
domestic market and product design is adapted to the market. The next stage is the transition
phase where normal series production and assembly takes place. This stage is characterised by
expansion to export markets and involves the advancement to full production levels in terms of
model line-up, quality and design. As local content is moderate due to cost reasons, total cost is
Stellenbosch University http://scholar.sun.ac.za
41
medium because of insufficient economies of scale. Total production cost for the case of South
Africa is also influenced by high logistics costs. The full manufacturing stage includes full
integration in the parent company. Model volumes increase and the model line-up consists of one
to two platforms. As higher volumes attract foreign direct investment and enable local suppliers to
supply components economically, this also means that to lower production costs local content
levels have to be medium or high to avoid penalties incurred by import-related logistics costs.
Formerly protected developing countries like South Africa normally follow the steps of this
conversion. South Africa finds itself in the transition phase, with some interesting prospects to
advance to the full manufacturing stage when combined target markets (domestic and export) offer
sustainable production volumes. The reasons that South Africa has not already advanced to the
full manufacturing stage are varied. The historical context of a series of protection programmes
that were in place until 1995 led to the fact that models produced in South Africa were outdated.
Therefore, domestic assemblers and suppliers were not able to upgrade technological equipment
as well as they were capable of. A change only occurred after the Motor Industry Development
Program was introduced and export of vehicles and components was stipulated. The OEMs then
pursued strategies to integrate themselves and their supply chains into the international networks
of their parent companies. As a result, model volumes increased substantially and South Africa‟s
automotive industry profited by the upgrading process that was necessary to compete in
international markets (Black, 2009: 491).
Stellenbosch University http://scholar.sun.ac.za
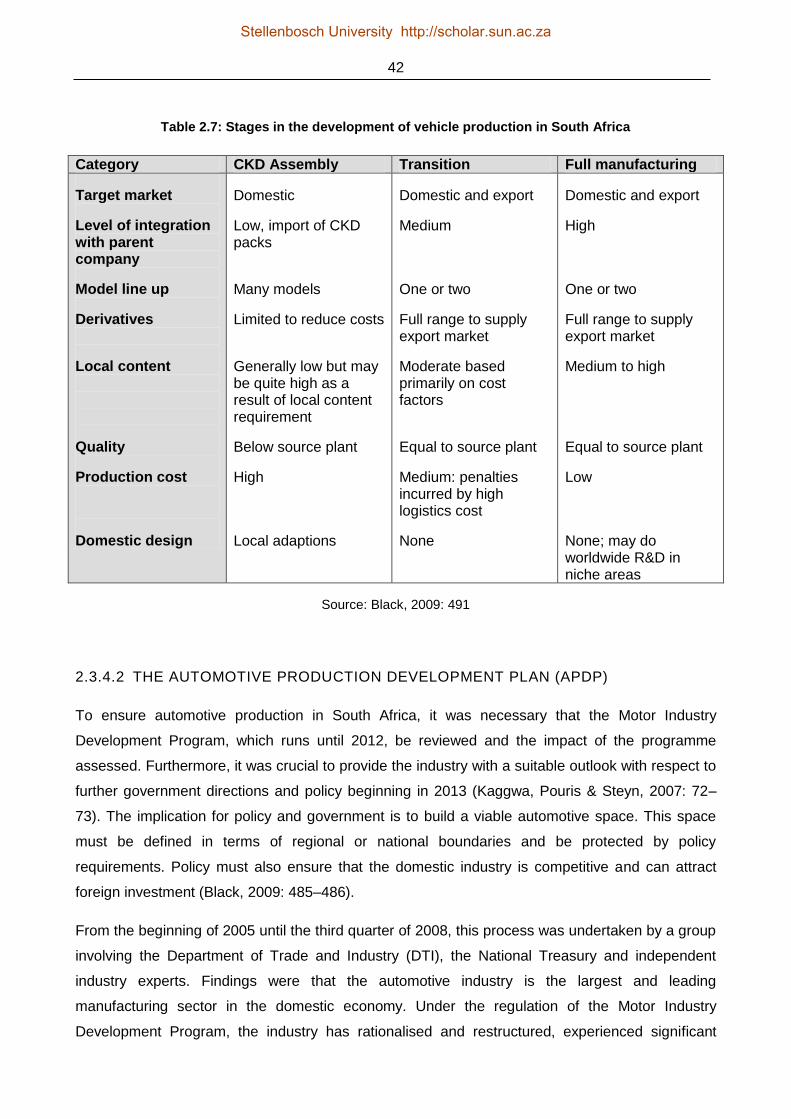
42
Table 2.7: Stages in the development of vehicle production in South Africa
Category CKD Assembly Transition Full manufacturing
Target market
Level of integration with parent company
Model line up
Derivatives
Local content
Quality
Production cost
Domestic design
Domestic
Low, import of CKD packs
Many models
Limited to reduce costs
Generally low but may be quite high as a result of local content requirement
Below source plant
High
Local adaptions
Domestic and export
Medium
One or two
Full range to supply export market
Moderate based primarily on cost factors
Equal to source plant
Medium: penalties incurred by high logistics cost
None
Domestic and export
High
One or two
Full range to supply export market
Medium to high
Equal to source plant
Low
None; may do worldwide R&D in niche areas
Source: Black, 2009: 491
2.3.4.2 THE AUTOMOTIVE PRODUCTION DEVELOPMENT PLAN (APDP)
To ensure automotive production in South Africa, it was necessary that the Motor Industry
Development Program, which runs until 2012, be reviewed and the impact of the programme
assessed. Furthermore, it was crucial to provide the industry with a suitable outlook with respect to
further government directions and policy beginning in 2013 (Kaggwa, Pouris & Steyn, 2007: 72–
73). The implication for policy and government is to build a viable automotive space. This space
must be defined in terms of regional or national boundaries and be protected by policy
requirements. Policy must also ensure that the domestic industry is competitive and can attract
foreign investment (Black, 2009: 485–486).
From the beginning of 2005 until the third quarter of 2008, this process was undertaken by a group
involving the Department of Trade and Industry (DTI), the National Treasury and independent
industry experts. Findings were that the automotive industry is the largest and leading
manufacturing sector in the domestic economy. Under the regulation of the Motor Industry
Development Program, the industry has rationalised and restructured, experienced significant
Stellenbosch University http://scholar.sun.ac.za

43
growth in production volumes, exports and investments while maintaining employment levels in a
competitive environment. The global automotive environment is also characterised by substantial
government support from the hosting countries, as emerging markets, like Eastern Europe and
Asia, continue to attract investment. For South Africa, which sells less than 1 per cent of global
automotive production and is isolated from larger markets and shipping routes, the remaining
challenges are economies of scale and the depth of domestic component manufacturing. So the
strategic direction focuses on further expanding production as well as deepening the industry. The
goal of the Automotive Production Development Program is to double production by 2020 to 1.2
million vehicles and to improve local content levels (DTI, 2008).
To achieve the goals mentioned above four key elements will constitute the Automotive Production
Development Program:
- Tariffs: Stable tariffs will remain at 25 per cent for light vehicles and 20 per cent for
components; this provides sufficient protection to justify local vehicle assembly.
- Local Assembly Allowance (LAA): Vehicle manufacturers with a production volume of at
least 50,000 units per annum will earn duty credits for 18–20 per cent of their domestically
produced vehicles; this support aims to encourage high-volume vehicle production.
- Production incentive (replaces the import-export complementation scheme): Local value
addition will be rewarded with duty credits; local value addition in the automotive value
chain is expected to increase.
- Automotive Investment Allowance (AIA): Starting in 2009, this assistance will replace the
current Productive Asset Allowance (PAA) and allow 20 per cent of the qualifying
investments to be paid over to the participants over a period of three years (DTI, 2008).
Table 2.8 provides a comparison of the key elements of the Motor Industry Development Program
and the Automotive Production Development Program. One major implication for the local supply
base is the fact that investment assistance is available to the entire value chain. This implies that
every investment which is „auto‟-related qualifies for the AIA and gives suppliers the opportunity to
upgrade their technology and increase productivity in order to compete in the automotive value
chain.
Stellenbosch University http://scholar.sun.ac.za
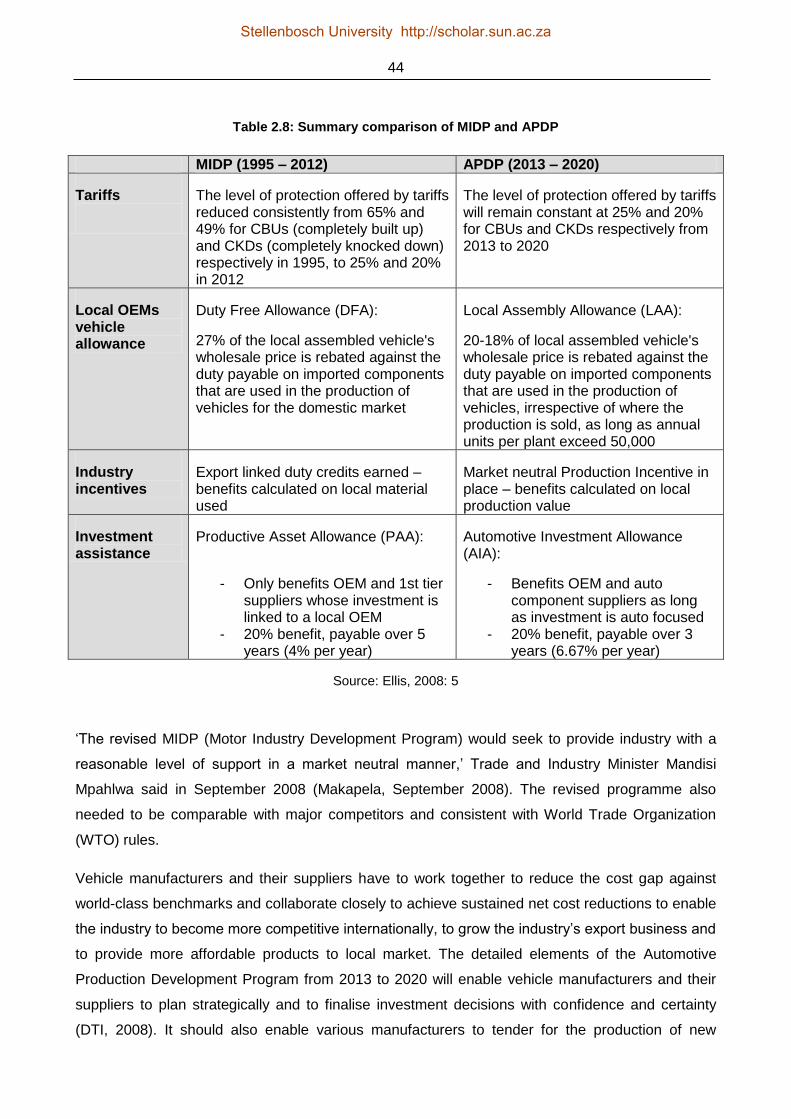
44
Table 2.8: Summary comparison of MIDP and APDP
MIDP (1995 – 2012) APDP (2013 – 2020)
Tariffs
The level of protection offered by tariffs reduced consistently from 65% and 49% for CBUs (completely built up) and CKDs (completely knocked down) respectively in 1995, to 25% and 20% in 2012
The level of protection offered by tariffs will remain constant at 25% and 20% for CBUs and CKDs respectively from 2013 to 2020
Local OEMs vehicle allowance
Duty Free Allowance (DFA):
27% of the local assembled vehicle's wholesale price is rebated against the duty payable on imported components that are used in the production of vehicles for the domestic market
Local Assembly Allowance (LAA):
20-18% of local assembled vehicle's wholesale price is rebated against the duty payable on imported components that are used in the production of vehicles, irrespective of where the production is sold, as long as annual units per plant exceed 50,000
Industry incentives
Export linked duty credits earned – benefits calculated on local material used
Market neutral Production Incentive in place – benefits calculated on local production value
Investment assistance
Productive Asset Allowance (PAA):
- Only benefits OEM and 1st tier suppliers whose investment is linked to a local OEM
- 20% benefit, payable over 5 years (4% per year)
Automotive Investment Allowance (AIA):
- Benefits OEM and auto component suppliers as long as investment is auto focused
- 20% benefit, payable over 3 years (6.67% per year)
Source: Ellis, 2008: 5
„The revised MIDP (Motor Industry Development Program) would seek to provide industry with a
reasonable level of support in a market neutral manner,‟ Trade and Industry Minister Mandisi
Mpahlwa said in September 2008 (Makapela, September 2008). The revised programme also
needed to be comparable with major competitors and consistent with World Trade Organization
(WTO) rules.
Vehicle manufacturers and their suppliers have to work together to reduce the cost gap against
world-class benchmarks and collaborate closely to achieve sustained net cost reductions to enable
the industry to become more competitive internationally, to grow the industry‟s export business and
to provide more affordable products to local market. The detailed elements of the Automotive
Production Development Program from 2013 to 2020 will enable vehicle manufacturers and their
suppliers to plan strategically and to finalise investment decisions with confidence and certainty
(DTI, 2008). It should also enable various manufacturers to tender for the production of new
Stellenbosch University http://scholar.sun.ac.za

45
models in South Africa (NAAMSA, 2007). Table 2.9 shows the specific goals of the subsector
programme for the automotive industry.
Table 2.9: Measurable objectives and medium-term output targets; subsector customised
programmes
Measurable objectives
Expected outcomes
Performance indicator/ measure
2010/2011 target
2011/2012 target
2012/2013 target
Sustainability and growth of local automotive and components manufacturing capacity
Launched Automotive Investment Scheme (AIS)
Finalisation of the Automotive Production and Development Programme (APDP) implementation guidelines
Competitiveness improvements in component manufacturing, with the intention of retaining jobs in the automotive sector
Value of investments per annum
Publication of the APDP guidelines
Number of firms participating in Supplier Development Programme
ZAR3 bn
Publish the APDP implementation guidelines
Increase participation of firms by 30 from the previous quarter
ZAR4 bn
Further 29 firms to participate from quarter 4
ZAR3 bn
Total of 75 firms assisted via the SDP
Source: DTI, 2010: 47
2.3.4.3 STRUCTURAL ISSUES IN SOUTH AFRICA‟S AUTOMOTIVE VALUE CHAIN
The developments and goals mentioned in this chapter lead to the subject of how the South
African automotive value chain will develop in the next decade. Looking at a targeted increase of
production of more than 100 per cent, the question is how will the industry strategically align the
influences of international competition and domestic production? As the progress of car
manufacturers seems to be designated by the parent companies because they are integrated into
the operations of their parent organisations (this is not entirely correct, as the subsidiaries in South
Africa have to tender for new projects), the development of the component suppliers – especially
the local organisations without equity ties to foreign multinationals – needs to be defined. This
issue does not examine the South African inbound market only. Furthermore it also looks at the
worldwide competitiveness of South African component suppliers in the global automotive supply
chain. Considering the relative importance of the automotive industry for South Africa in terms of its
Stellenbosch University http://scholar.sun.ac.za

46
contribution to the gross domestic product, employment figures and the ongoing support for the
Automotive Production Development Program by the government, it is of relevance to investigate
the structural issues in the value chain (Kaggwa et al., 2007: 72–73).
Besides the needs being addressed by the Automotive Production Development Program, the
South African automotive industry faces issues that are influenced by ongoing dynamics in the
global automotive industry. The first issue derives from the ballooning trade deficit. The export
orientation of the Motor Industry Development Program attracted foreign direct investment because
of the import-export complementation scheme, but the components that are currently exported
mainly consist of peripheral parts. These components are low value-added and have high raw-
material content. The largest part of components for export is catalytic converters, stitched leather
and tyres. Furthermore, the export business is driven by multinational suppliers who made
relatively small investments and employ low levels of integration into the domestic industry (Black,
2009: 503). These factors lead to an uneven balance of technological capabilities available in the
domestic market, as core components with high technological requirements are mostly imported.
But on the other hand, there are also notable developments in the industry whereby high-value-
added components are also manufactured domestically. These facts are supported historically as
explained in the following. By 2005 engines and engine parts accounted for 7.7 per cent of
component exports and this figure is likely to become higher (Black, 2009: 505). One of the
contributors is Ford, with its engine plant in Port Elizabeth. Its RoCam 1.3 and 1.6 litre engines are
manufactured for both the domestic and export markets. For the 1.3 litre version of the RoCam
engine the South African-based plant is the sole supplier worldwide. Besides Ford‟s large
investment, the creation of jobs in the area and some international suppliers, the effect on the local
supply chain was also of marked significance. The engines had a level of local content of 82 per
cent. Domestic supplies consisted of parts like blocks, cylinder heads, exhaust manifolds and
valves, among others, and attracted local suppliers like Murray & Roberts Foundry Group and
Atlantis Forge, which invested in new equipment (Cokayne, 2002). Despite this success story, the
trade balance is also influenced by weak domestic sales and a limited local market. International
firms do not normally want to expose themselves to large-scale exports of particular models or
components when the domestic market is restricted.
This factor leads to the question of how securely foreign direct investment is embedded in South
Africa, given the constraining domestic market and the low overall volumes, including exports.
Foreign companies hesitate to undertake investments where a critical mass of at least 100,000
units per model/component is not exceeded. But even when this critical mass is met it can be seen
that international first-tier suppliers often operate as assemblers. They source the subcomponents
overseas and use advanced assembly jigs and testing equipment to put together the product. But
Stellenbosch University http://scholar.sun.ac.za

47
there are also particular examples of sustainable establishment. The catalytic converter industry
began with low levels of investment, and initially involved the coating and canning of the imported
substrates. Due to the pace of expansion – South Africa currently produces 14 per cent of global
output – the component industry extended its value chain in South Africa to include the
manufacturing and cutting of substrates. Additionally this involved creating associated industries,
like matt manufacturing, flex connections and exhaust manifolds (Black, 2009: 505–506). A major
factor influencing the establishment of this industry is the proximity to the raw materials in South
Africa (e.g. platinum group metals) that are needed for production and lead to a high level of
working capital in the industry.
The domestic supplier landscape is also exposed to the challenges of competition in the
international automotive industry. Barnes and Kaplinsky (2000: 797) state that where local
production of components by a multinational supplier is involved, there is decreasing space for
locally owned component suppliers. Despite the increasing opportunities for domestic firms through
backward linkages (see the example of the catalytic converter industry above) with multinational
suppliers, it is to be questioned whether local suppliers will be able to attain the first-tier stage of
the supply chain or if they will have to operate lower the value chain. The term „lower‟ not only
refers to the position the supplier finds itself in the supply chain; it also gives an indication of the
value-added nature that these companies perform on the particular components (Black, 2009:
485).
To draw the big picture, it is necessary to take a close look at the South African automotive value
chain and its predicted structure over the next decade under the influence of the Motor Industry
Development Program and Automotive Production Development Program. The predicted structure
of the South African automotive value chain is mainly influenced by three events. Firstly, OEMs are
investing in the South African location, as witnessed by recent decisions by Daimler (production of
the C-class successor) and BMW (production of the 3-series successor with an investment of R2.2
billion). The fact that global lead firms are making a commitment to their operations and the
ongoing export/import-substitution under the Automotive Production Development Program makes
OEMs claim that local content must improve substantially to reach global competitiveness.
Secondly, the presence of car makers suggests that multinational suppliers will continue or even
expand their strong presence in the South African automotive industry and there could be
decreasing opportunities for local suppliers to gain access to the value chain as competition
increases. The third fact which influences the automotive value chain is technological
modularisation. As more competencies are being outsourced by the lead firms to capable
suppliers, a power shift to module suppliers is predicted. This shift could have positive implications
Stellenbosch University http://scholar.sun.ac.za
48
for local suppliers, as the dominance of the lead firms moves up the value chain and they will,
therefore, be more closely linked to firms operating high up the value chain.
There are two strategic options facing vehicle assemblers. They can either pursue a low-volume
strategy by maintaining a wide range of models or follow a rationalisation strategy that focuses on
the production of one or two models with the aim of achieving economies of scale. Although the
low-volume option with high production costs seems not to be viable because of decreasing import
tariffs in the medium to long term, this option does offer some strategic benefits. South African
operations are already used to access low-volume markets in Asia and Australia, with reduced
shipping times compared with Europe. This strategy is mainly pursued by German car makers
Daimler and BMW. South African-based assembly plants can also play a role as swing suppliers
used for increased global demand, but are likely to be the first to cut production when global sales
decline (Black, 2009: 500). The rationalisation option is in line with government directions and aims
to reduce production costs. It also enables domestic supply to act under economical circumstances
which would substantially reduce logistics costs. Logistic costs are one of South Africa‟s major
disadvantages. The cost of inbound and outbound logistics is a function of long shipping distances
and a high level of imported content (Black, 2009: 495).
Sustainability in an environment of falling protection and assistance is a function of cost
competitiveness (including factors like labour, material and logistics) and more dynamic attributes,
such as production volumes and productivity improvement over time (Black, 2009: 506). As seen in
the previous arguments about the threats to the South African automotive industry, it should also
been noted that the opportunities of a regional market are not yet fully discovered. At a NAAMSA
(National Association of Automobile Manufacturers of South Africa) African export meeting in 2010
industry representatives suggested facilitating free-trade agreements for built-up vehicles and
components with a number of African countries (Houghton, 2010). In particular, the trade
agreements of SADC (Southern African Development Community) and COMESA (Common
Market for Eastern and Southern Africa) would enable the industry to grow the export business
further and simultaneously reduce the limiting factors like logistics cost because of the geographic
location of these markets.
2.4 SYNTHESIS
This chapter highlighted globalisation trends in the automotive industry as well as the
characteristics of the South African automotive environment. Several factors and concepts
described in this chapter impact on the sustainability of local suppliers in emerging markets. Figure
2.13 lists these factors alphabetically within each subsection. These factors will be taken into
consideration in the development of a comprehensive model of sustainability of local suppliers in
Stellenbosch University http://scholar.sun.ac.za
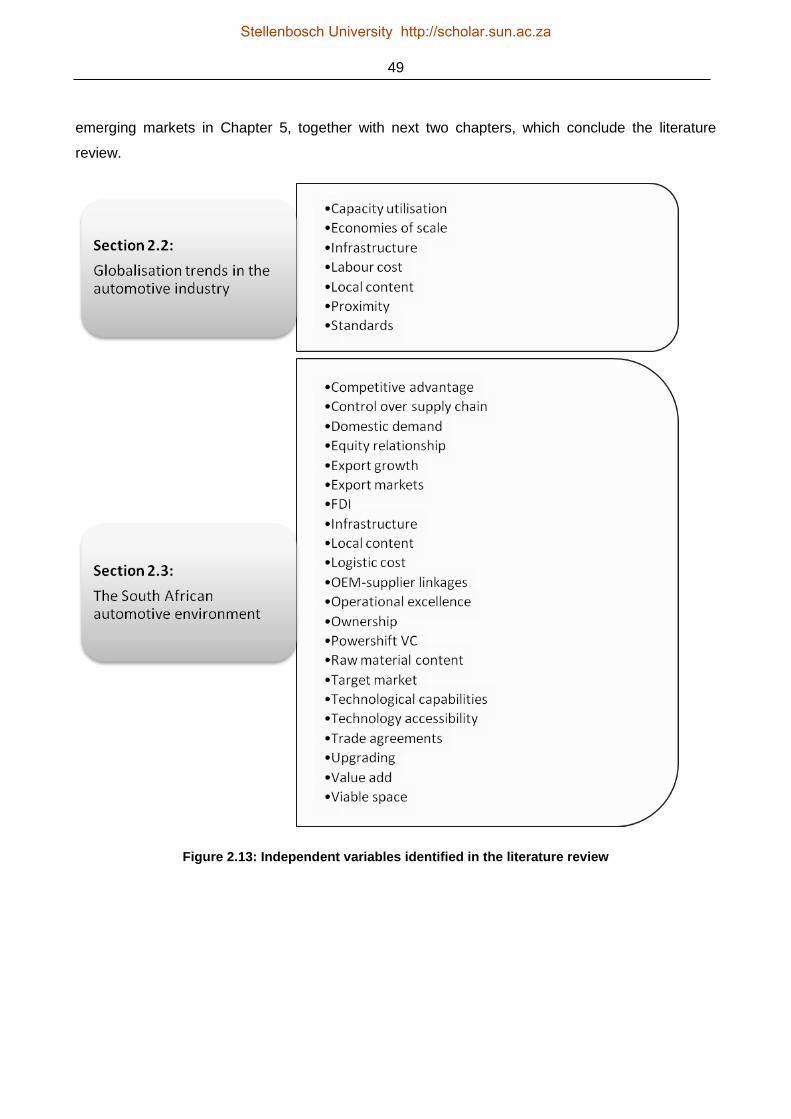
49
emerging markets in Chapter 5, together with next two chapters, which conclude the literature
review.
Figure 2.13: Independent variables identified in the literature review
Stellenbosch University http://scholar.sun.ac.za

50
CHAPTER 3
LITERATURE REVIEW: AUTOMOTIVE VALUE CHAINS AND
GLOBAL VALUE CHAIN GOVERNANCE
3.1 INTRODUCTION
As described in the first chapters, the automotive industry is spreading its operations in more
countries to gain access to emerging markets and to operate at lower costs. To further investigate
this trend, it is important to discuss the value chain in general and to deepen the theoretical
insights into global value chains (GVCs).
This chapter discusses value and supply chains with respect to the automotive industry. As the
automotive industry is distinctive from most other industries, important concepts like fragmentation,
modularisation and supplier classification are examined in this context. In addition, general theory
about value and supply chains is reviewed. The concept of global value chain governance forms
the third part of this chapter. The chapter ends with a discussion of the global value chain
governance approach in the context of the research problem.
The theory of supply chain management is used to explain concepts which are applied in the
automotive industry. These concepts are normally defined from the customer‟s point of view (e.g.
the automotive OEM). Because this research is focused on the supplier‟s point of view which is
also the unit of analysis, the term supply chain is used as a synonym for the downstream value
chain of the automotive component suppliers as well as for the upstream value chain of the
automotive customers (e.g. first tier suppliers, OEMs). Therefore, in this case, supply chain theory
is embedded in value chain theory and will be discussed on the operational supply chain
management level.
3.2 AUTOMOTIVE VALUE CHAIN AND SUPPLY CHAIN
3.2.1 VALUE CHAINS AND NETWORKS
Value chains provide a snapshot of economic activity that cuts through larger structures, while at
the same time clearly identifying smaller-scale entities and actors, such as workers, clusters, firms,
and narrowly defined industries (Sturgeon, 2001; Sturgeon et al., 2008: 304). This „meso-level‟
view of the global economy provides a sufficient base to analyse the research problem and allows
for a clear picture that is not blurred by the excessive variation and differences of other concepts
like clusters and networks. Another argument for examining the value chain concept derives from
the fact that the complexity of the research is not forced into a narrow spatial or sectoral frame.
Stellenbosch University http://scholar.sun.ac.za

51
The variety of network forms derives from the globalisation of production and trade. This means
that the vertical disintegration of transnational companies is triggering several types of chains and
networks that are used to coordinate and control the complex transactions among companies and
geographic areas. There have been several sustained efforts to systemise observed patterns in
global industries, most notably the global production-networks approach (Henderson et al., 2002)
and global value-chain approach (Sturgeon et al., 2008). As argued above, the global value chain
approach will be used for the further research because it is capable of analysing the subsets of
networks, clusters or grids without becoming lost in complexity. What is the difference between a
value chain and a production network? Sturgeon (2001: 10) defines the difference of these types of
activity agglomerations in terms of the value chain being „a sequence of productive activities
leading to and supporting end use‟, whereas a production network is „a set of inter-firm
relationships that bind a group of firms into a larger economic unit‟. Coe, Dicken and Hess (2008:
274) add the aspect of international fragmentation to the definition, as they define global production
networks as „one whose interconnected nodes and links extend spatially across national
boundaries and, in so doing, integrates parts of disparate national and sub-national territories‟.
From the perspective of a firm (see Figure 3.1), a value chain describes the primary activities and
related costs, like purchasing and inbound logistics, operations, distribution and outbound logistics,
sales and marketing, and service. These primary actions are supported by activities like research
and development, human resources and general administration (Porter, 1985: 34).
Figure 3.1: Porter’s value chain
Source: Porter, 1985: 34
Stellenbosch University http://scholar.sun.ac.za
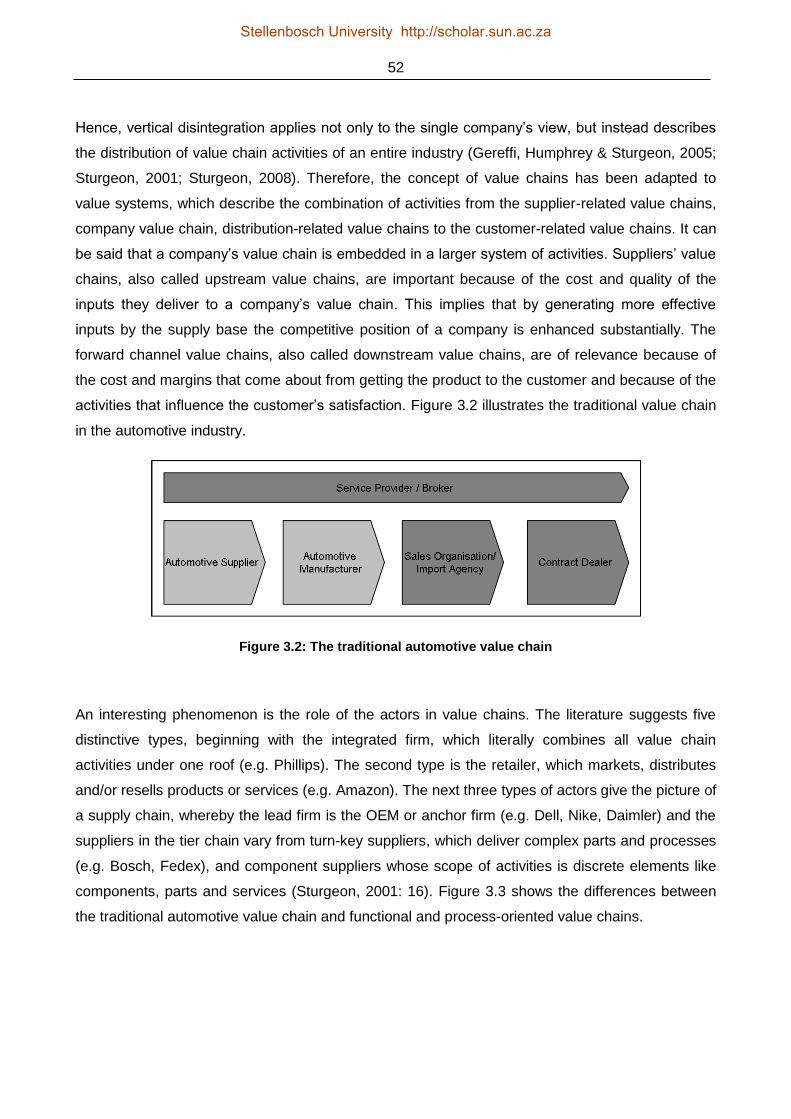
52
Hence, vertical disintegration applies not only to the single company‟s view, but instead describes
the distribution of value chain activities of an entire industry (Gereffi, Humphrey & Sturgeon, 2005;
Sturgeon, 2001; Sturgeon, 2008). Therefore, the concept of value chains has been adapted to
value systems, which describe the combination of activities from the supplier-related value chains,
company value chain, distribution-related value chains to the customer-related value chains. It can
be said that a company‟s value chain is embedded in a larger system of activities. Suppliers‟ value
chains, also called upstream value chains, are important because of the cost and quality of the
inputs they deliver to a company‟s value chain. This implies that by generating more effective
inputs by the supply base the competitive position of a company is enhanced substantially. The
forward channel value chains, also called downstream value chains, are of relevance because of
the cost and margins that come about from getting the product to the customer and because of the
activities that influence the customer‟s satisfaction. Figure 3.2 illustrates the traditional value chain
in the automotive industry.
Figure 3.2: The traditional automotive value chain
An interesting phenomenon is the role of the actors in value chains. The literature suggests five
distinctive types, beginning with the integrated firm, which literally combines all value chain
activities under one roof (e.g. Phillips). The second type is the retailer, which markets, distributes
and/or resells products or services (e.g. Amazon). The next three types of actors give the picture of
a supply chain, whereby the lead firm is the OEM or anchor firm (e.g. Dell, Nike, Daimler) and the
suppliers in the tier chain vary from turn-key suppliers, which deliver complex parts and processes
(e.g. Bosch, Fedex), and component suppliers whose scope of activities is discrete elements like
components, parts and services (Sturgeon, 2001: 16). Figure 3.3 shows the differences between
the traditional automotive value chain and functional and process-oriented value chains.
Stellenbosch University http://scholar.sun.ac.za

53
Figure 3.3: Functional vs. process organisation in the automotive value chain
3.2.2 FRAGMENTATION AND ECONOMIC GEOGRAPHY
Economic geography shows a fragmentation, as the automotive industry is located in nested
structures that show strong regional influences (Bryson, 1999; Rugman & Collinson, 2004;
Sturgeon et al., 2008; Sturgeon et al., 2009; Uallachain & Wasserman, 1999). This factor not only
results in local clusters, but also diffuses globalisation, as decisions in the automotive value chain
do not only depend on rationales with regard to microeconomic decision analysis. They also
depend on the geographic proximity of new ventures to important clusters, like existing design and
production centres. This phenomenon is supported by a study on co-located supplier parks in the
automotive industry by Reichhart and Holweg (2008), who find that transaction cost economics is
less suited to analyse co-location. Further findings concern a highly concentrated firm structure,
which creates high barriers to entry and limits the upgrading prospects for supplier firms due to
customer specification (see Figure 3.4). Co-location of suppliers seems to be required to ensure
the coordination of physical and informational flows between the business partners on the one
Stellenbosch University http://scholar.sun.ac.za

54
hand, whereas on the other hand the dependency on particular partners rises by constraining the
possibility of terminating the contract or restricting the opportunities for economies of scale (Morris,
Donnelly & Donnelly, 2004: 131). This trade-off leads to different spatial configurations (Frigant &
Lung, 2002: 752). It can be concluded that in the automotive industry production has tended to
follow markets (Cattaneo, Gereffi & Staritz, 2010: 16).
Figure 3.4: The co-location grid
Source: Reichhart & Holweg, 2008: 67
Another important factor in regional structuring is the influence of policy and large groups of
stakeholders. These groups show strong interests in the automotive industry because of the impact
on national economies and societies. On the one hand, the automotive industry accounts for a
large part of the economies‟ gross domestic product, which automatically leads to the fact that
employment in this industry is substantial. On the other hand, there is high visibility of the products
among the general public. This puts pressure on political institutions, as the public considers the
visibility of national products in daily life as highly valuable (Coe et al., 2008).
The spatial scale of value chains ranges from local clusters to global commodity chains. The local
cluster can be seen as an industrial district or a specialised industrial cluster, whereas the global
commodity chain includes activities across at least two continents or trading blocs. Between these
two extremes of spatial scale there are three other types of value chain or production networks.
After the local cluster the next spatial upgrade is the national or domestic production system. An
Stellenbosch University http://scholar.sun.ac.za
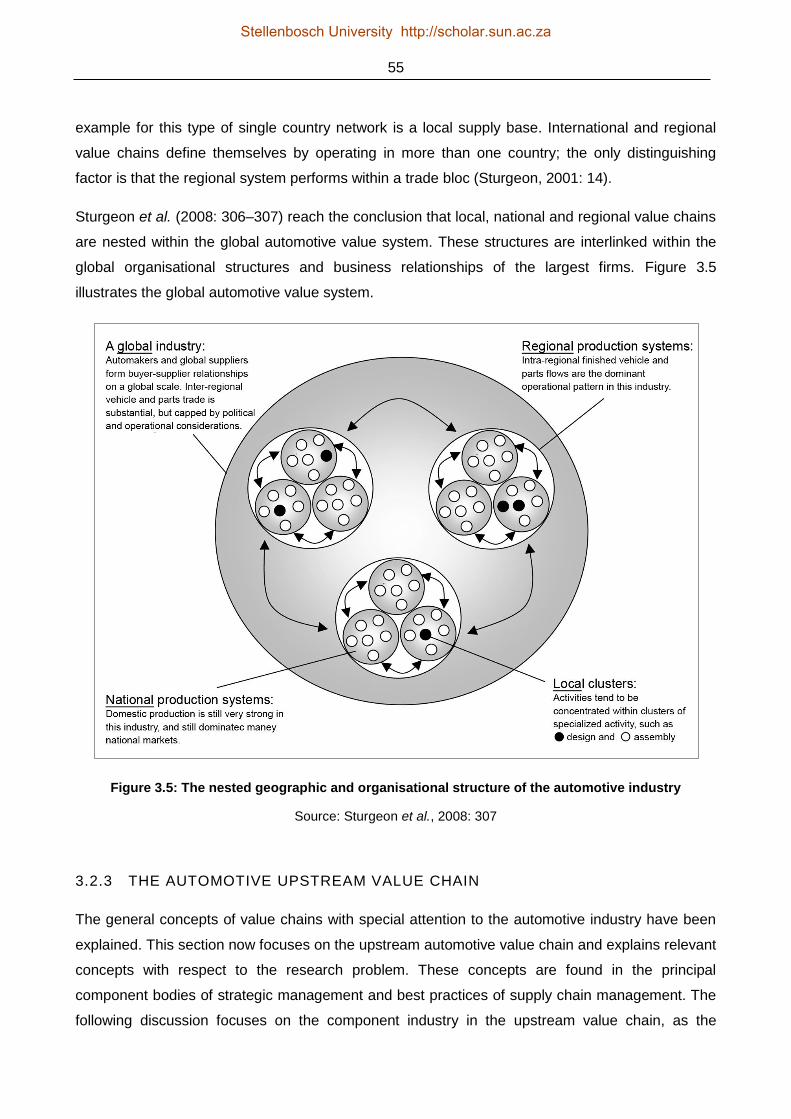
55
example for this type of single country network is a local supply base. International and regional
value chains define themselves by operating in more than one country; the only distinguishing
factor is that the regional system performs within a trade bloc (Sturgeon, 2001: 14).
Sturgeon et al. (2008: 306–307) reach the conclusion that local, national and regional value chains
are nested within the global automotive value system. These structures are interlinked within the
global organisational structures and business relationships of the largest firms. Figure 3.5
illustrates the global automotive value system.
Figure 3.5: The nested geographic and organisational structure of the automotive industry
Source: Sturgeon et al., 2008: 307
3.2.3 THE AUTOMOTIVE UPSTREAM VALUE CHAIN
The general concepts of value chains with special attention to the automotive industry have been
explained. This section now focuses on the upstream automotive value chain and explains relevant
concepts with respect to the research problem. These concepts are found in the principal
component bodies of strategic management and best practices of supply chain management. The
following discussion focuses on the component industry in the upstream value chain, as the
Stellenbosch University http://scholar.sun.ac.za

56
organisations working in this environment are the unit of analysis. An example of a component
value chain in the automotive industry is given in Figure 3.6. The following is not to be confused
with general supply chain management theory as well as supply chain reference models. The
focus of the research deals with the issue of market access and the role of component suppliers in
the automotive value chain. As the automotive supply chain is part of this question the following
shows important concepts of supply chain theory with respect to the automotive industry, but it is
not aimed to discuss supply chain management of the component industry on an operational level.
Figure 3.6: The vehicle and components value chain
Source: Barnes & Morris, 2008: 35
The role of suppliers in the automotive industry derives from their responsibilities in the supply
chain of the OEMs. The upstream automotive value chain can be classified by different
dimensions. Firstly, a general classification can be done according to the tier level of a particular
supplier. These levels start at the first tier level and extend to second and third levels – and as far
as the supply chain is organised. The first-tier supplier supplies the car manufacturers (OEMs)
directly, whereas the other members of the supply chain (e.g. second- or third-tier suppliers) supply
the next tier in their respective supply chains. This classification normally develops according to the
products that are manufactured by the suppliers. It can be seen that the supply chain is divided into
suppliers of components, modules (or sub-assemblies) or systems. Component suppliers are
responsible for commodities in the sense of build to print parts. The value add is low and the
component suppliers are to be found on the second/+ tier-level. Sub-assembly suppliers deliver
modified or customised commodities into the automotive value chain. These products are a grey-
Stellenbosch University http://scholar.sun.ac.za

57
box design whereby the customer gives indications and specifications, but the final design and
production is fully in the hands of the supplier. Value add is medium, and a supplier can be located
anywhere in the tier chain, but is usually to be found on the first or second tier level. The module or
system supplier produces fully integrated systems to the OEMs, which are normally delivered just
in time (JIT) or just in sequence (JIS) to the car maker‟s assembly lines. As these suppliers work
on a black-box design, value add is high because a lot of development and design work is
involved. These companies are normally located on the first tier level of the automotive supply
chain (Hsuan, 1999; Uallachain & Wasserman, 1999; Veloso et al., 2000). Additionally, suppliers
can be characterised by their market presence, which goes along with the tier level. Second and
lower tier levels normally operate in a regional or local environment, whereas first-tier suppliers are
globally engaged (Veloso & Kumar, 2002: 13). The positioning of companies in the supply chain is
illustrated in Figure 3.7.
Figure 3.7: Company positioning in the supply chain
Source: Veloso et al., 2000
The automotive industry is seen as a producer-driven industry (Sturgeon et al., 2009). As
explained in the first chapters, a small number of OEMs control and coordinate the production
network. It can be seen that these companies shift their design activities and the supply of
complete functions to their suppliers (see Figure 3.8). The transformation is been initiated by
OEMs in order to cut development costs and shorten design lead times.
Stellenbosch University http://scholar.sun.ac.za

58
Figure 3.8: Value transfer activity (modular supply chain)
Source: Doran, 2004: 103
With this trend an issue in the automotive industry arises, namely the need for economies of scale
among component manufacturers. As there is a paucity of standards in the industry the rise of
modularity in the automotive industry is limited (Kaplinsky, 2010: 14; Nadvi, 2008; Ponte & Gibbon,
2005: 4). This is due technical factors and structural dimensions. Technical factors include the
complex, integral system of a vehicle, which circumvents the codification of a vehicle or the design
process of a new model. The structural dimension derives from the concentration of lead firms in
the industry. Due to their power over the value chain, the lead firms are able to apply their own
standards in the industry (Sturgeon et al., 2008: 312). Another dimension is brought in by the
transaction cost theory. According to this theory, standard products that are describable and
valuable can be handled through arm‟s length market relations. This is because the required
degree of coordination and the impact of asset specificity are low. There is also a variety of
suppliers and a variety of customers. Unlike standard products, customised products involve a high
degree of coordination as well as transaction-specific investments, which makes them, according
to transaction cost theory, likely to being produced in-house. The variable of frequency adds to this
approach and leads to the fact infrequently used inputs are acquired externally (Gereffi et al., 2005:
80). In addition to the transaction cost approach, the theory of firm capabilities and learning would
suggest that the capturing of value activities also depends on the generation and retention of
competencies (Gereffi et al., 2005: 81). This argument relates to the concept of core
competencies, whereby sustainable development of distinctive competencies leads to a firm‟s
comparative advantage. The development of those distinctive qualities is also dependent on the
capabilities within the firm. To conclude on the influences of the different schools of thought on the
fragmentation of value chains, the network approach posits that trust, reputation and mutual
dependence affect inter-firm relationships, and contrary to transaction cost theory enables the
players to engage in complex connections and interdependencies. This fact derives from the
effects of repeat transactions, reputation and social norms in particular geographic areas (Gereffi
et al., 2005: 81).
Stellenbosch University http://scholar.sun.ac.za
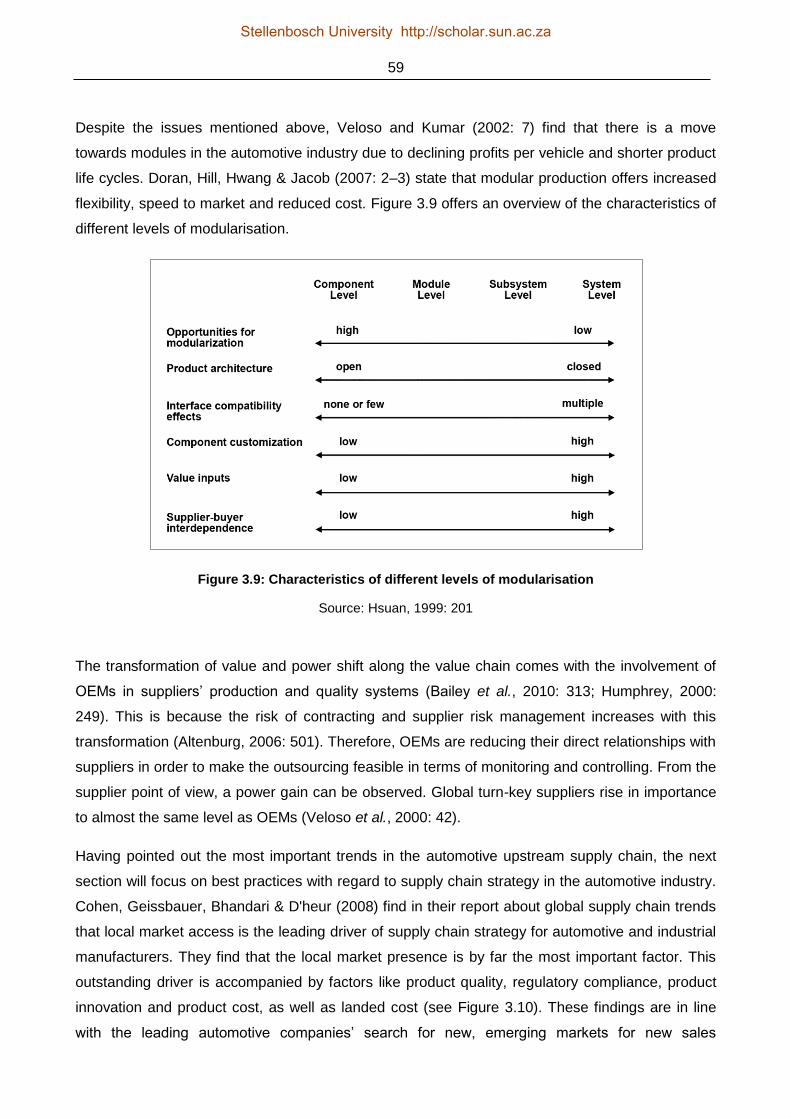
59
Despite the issues mentioned above, Veloso and Kumar (2002: 7) find that there is a move
towards modules in the automotive industry due to declining profits per vehicle and shorter product
life cycles. Doran, Hill, Hwang & Jacob (2007: 2–3) state that modular production offers increased
flexibility, speed to market and reduced cost. Figure 3.9 offers an overview of the characteristics of
different levels of modularisation.
Figure 3.9: Characteristics of different levels of modularisation
Source: Hsuan, 1999: 201
The transformation of value and power shift along the value chain comes with the involvement of
OEMs in suppliers‟ production and quality systems (Bailey et al., 2010: 313; Humphrey, 2000:
249). This is because the risk of contracting and supplier risk management increases with this
transformation (Altenburg, 2006: 501). Therefore, OEMs are reducing their direct relationships with
suppliers in order to make the outsourcing feasible in terms of monitoring and controlling. From the
supplier point of view, a power gain can be observed. Global turn-key suppliers rise in importance
to almost the same level as OEMs (Veloso et al., 2000: 42).
Having pointed out the most important trends in the automotive upstream supply chain, the next
section will focus on best practices with regard to supply chain strategy in the automotive industry.
Cohen, Geissbauer, Bhandari & D'heur (2008) find in their report about global supply chain trends
that local market access is the leading driver of supply chain strategy for automotive and industrial
manufacturers. They find that the local market presence is by far the most important factor. This
outstanding driver is accompanied by factors like product quality, regulatory compliance, product
innovation and product cost, as well as landed cost (see Figure 3.10). These findings are in line
with the leading automotive companies‟ search for new, emerging markets for new sales
Stellenbosch University http://scholar.sun.ac.za

60
opportunities and cost advantages. As outsourcing is set to remain an important factor in the
automotive industry, the report shows that automotive and industrial manufacturers, by taking
advantage of the global footprint, could save about 25 per cent in labour costs and 15 per cent in
material costs. Additionally, the growth path is supported by shifting operations through
outsourcing. Shifting operations to new markets aligns with the goal to develop customised local
products and secure sustainable market access (Cohen et al., 2008: 15).
Figure 3.10: Primary drivers of supply chain strategy for automotive and industrial manufacturers
Source: Cohen et al., 2008: 14
Focusing on the South African automotive industry, a report by Barloworld Logistics (2010) shows
that the top five short-term objectives concern cost reduction. These include reducing inventory,
lowering procurement cost, risk sharing with suppliers and optimising inbound transportation. The
drive for cost reduction stems directly from post-recessional caution. Next to these objectives only
the improvement of communication with the customer is listed in the top five objectives.
36
30
29
28
27
26
Local market presence
Product quality
Regulatory compliance
Product innovation
Total landed cost
Product cost
% of respondents (multiple answers possible)
Stellenbosch University http://scholar.sun.ac.za

61
Figure 3.11: Automotive supply chain objectives
Source: Barloworld Logistics, 2010: 5
3.3 GLOBAL VALUE CHAIN GOVERNANCE
The situation of value chains and outsourcing combined with the feature of globalisation raises the
question of the coordination of the fragmented activities. As Arndt & Kierzkowski (2001: 4) point
out, the „separability of ownership is an important determinant of the organizational structure of
cross-border production sharing. Where separation of ownership is not feasible, multinational
corporations and foreign direct investment are likely to play a dominant role. Where it is feasible,
arm‟s length relationships are possible and foreign direct investment is less important. Global value
chain governance (GVCG) analysis focuses on three features irrespective of the industry
(Sturgeon et al., 2008: 298):
- The geographic location and the linkages of value-added activities
- The power distribution among firms and other actors in the value chain
- The role of institutions on business relationships and industrial location
24
20
17
12
12
12
12
7
7
5
5
5
22
7
5
15
10
10
5
7
5
5
12
10
5
2
7
12
2
5
10
2
10
2
7
7
5
5
5
2
2
2
7
2
2
2
10
0 10 20 30 40 50 60 70 80
Reducing inventory
Lowering procurement costs
Risk sharing with suppliers
Improving communication with…
Optimise inbound transportation
Improving Inventory deployment…
Streamlining Sales & Operations…
Reducing the environmental impact of…
Improving visibility in the supply chain
Risk sharing with customers
Warehousing optimisation
Aligning the supply chain with the…
Ranked 1st
Ranked 2nd
Ranked 3rd
Ranked 4th
Ranked 5th
in %
Stellenbosch University http://scholar.sun.ac.za

62
Why is it important to understand the governance of global value chains – especially with respect
to the research objectives and the automotive industry? Humphrey & Schmitz (2001: 20–21) argue
that governance in value chains involves the following:
- Market access – How lead firms undertake the functional integration of internationally
dispersed activities
- Fast track to acquisition of production capabilities – Upgrading effects are particularly
significant for local producers new to the global market
- Distribution of gains – Developed-country producers are „governors‟ and own the high
value-adding activities (R&D, design, etc.), whereas developing-country firms are the
„producers‟ and perform the lower value-add activities
- Leverage point for policy initiatives – Government initiatives can be adjusted according to
the influence of lead firms on suppliers from developing countries
- Funnel for technical assistance – Partnership of transnational and small to medium sized
companies is fostered by providing entry points to the local supply base through the help of
agencies (e.g. the UN)
Furthermore, an understanding of value chain governance defines the critical coordination
processes within a chain. There are four key parameters that define what is to be done (Humphrey
& Schmitz, 2001: 22):
- What is to be produced? – Product design
- How is it to be produced? – Specification of processes
- How much is to be produced? – Demand issue
- When and where it is to be delivered? – Logistics issues
Gereffi et al. (2005) describe in their research the theoretical framework of global value chains and
explicitly focus on the governance of global value chains: „Global value chain research and policy
work examine the different ways in which global production and distribution systems are integrated,
and the possibilities for firms in developing countries to enhance their position in global markets‟
(Gereffi et al., 2005: 79). In theory, one can differentiate between buyer-driven global commodity
chains and producer-driven networks (Gereffi et al., 2005: 82). The distinction lies in the explicit
coordination that is executed by the powerful lead firms on the competent supply base. If there is
less capability in the supply base the production network tends to move to vertically integrated
firms. The lead firms also use this tight coordination to create a supply base that is capable of
operating without direct ownership. The supply relationships can be divided into three distinctive
types, which are dependent on the complexity of the product:
Stellenbosch University http://scholar.sun.ac.za
63
- Commodity supplier, who supplies standard products and the relationship is based on
arm‟s length markets.
- Captive supplier, who supplies non-standard products which are solely customised to the
buyer‟s needs.
- Turn-key supplier, who supplies customised products, but uses a modular production
network to serve different customers. (Sturgeon, 2002)
Combining these types of supplier relationships with the pure market relationship and the vertically
integrated firm, Gereffi (2005: 83) identifies five basic types of governance:
- Markets that exist over time with possible repeat transactions and low switching cost for
both parties.
- Modular value chains, with products being specified by the customer, and suppliers that
take full responsibility of production processes; asset specificity is limited because of the
use of generic machinery.
- Relational value chains with complex interactions between the players, which create mutual
dependence and high levels of asset specificity.
- Captive value chains which are controlled and monitored by the lead firms and involve
smaller suppliers that are dependent on the larger buyers.
- Hierarchy is characterised by vertical integration and governed by managerial control.
By adding three key variables of value chain governance patterns to the outlined types, an
analytical view of how global value chains are governed can be given:
- Complexity of transactions: The transfer of information and knowledge with respect to
product and process specifications.
- Ability to codify information: The extent to which efficient information can be transmitted.
- Capabilities in the supply base: The degree to which suppliers can meet the requirements.
(Gereffi et al., 2005: 85)
These variables take the approach of transaction cost theory into account, while acknowledging
the problem of asset specificity. Additionally, it is accepted that coordination incurs cost increases
along the chain.
By assigning the variables only two values – high and low – eight possible combinations exist, of
which five can be observed. The degree of explicit coordination and power asymmetry runs from
the lower end of the spectrum, which can be observed in market relationships, up to the other end
of the range, where hierarchical interaction is the dominant form. Table 3.1 presents an overview of
the key determinants of global value chain governance.
Stellenbosch University http://scholar.sun.ac.za
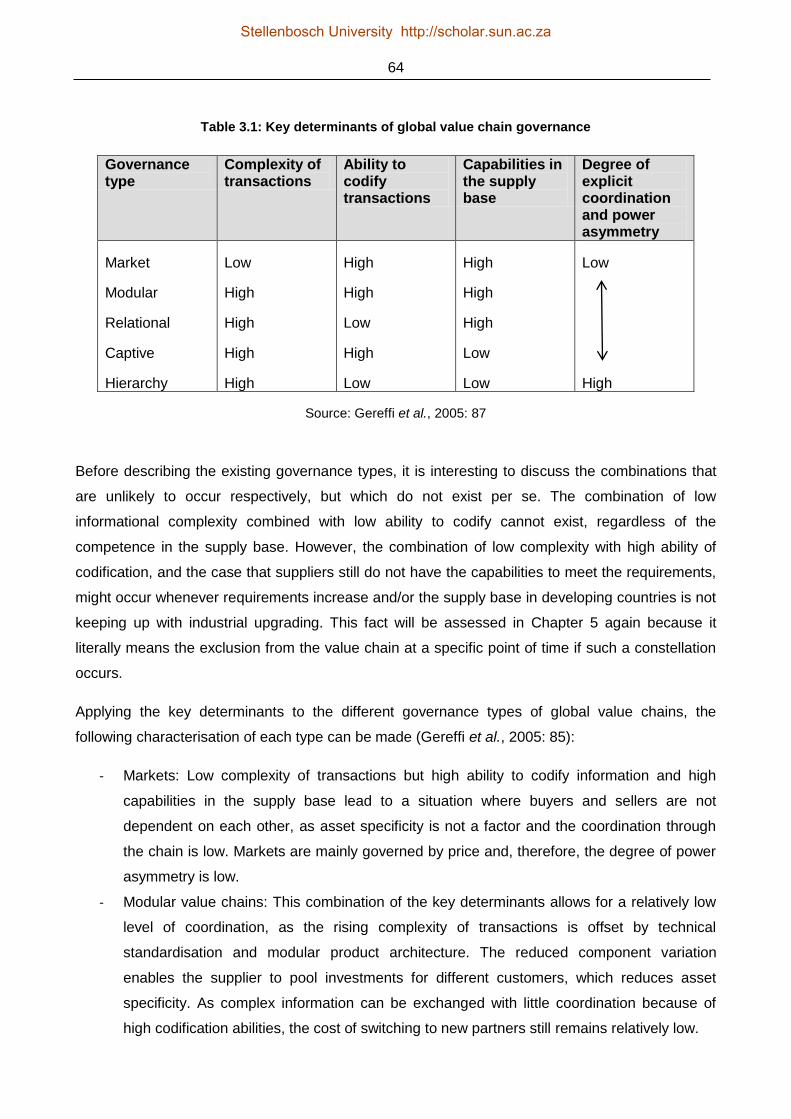
64
Table 3.1: Key determinants of global value chain governance
Governance type
Complexity of transactions
Ability to codify transactions
Capabilities in the supply base
Degree of explicit coordination and power asymmetry
Market
Modular
Relational
Captive
Hierarchy
Low
High
High
High
High
High
High
Low
High
Low
High
High
High
Low
Low
Low
High
Source: Gereffi et al., 2005: 87
Before describing the existing governance types, it is interesting to discuss the combinations that
are unlikely to occur respectively, but which do not exist per se. The combination of low
informational complexity combined with low ability to codify cannot exist, regardless of the
competence in the supply base. However, the combination of low complexity with high ability of
codification, and the case that suppliers still do not have the capabilities to meet the requirements,
might occur whenever requirements increase and/or the supply base in developing countries is not
keeping up with industrial upgrading. This fact will be assessed in Chapter 5 again because it
literally means the exclusion from the value chain at a specific point of time if such a constellation
occurs.
Applying the key determinants to the different governance types of global value chains, the
following characterisation of each type can be made (Gereffi et al., 2005: 85):
- Markets: Low complexity of transactions but high ability to codify information and high
capabilities in the supply base lead to a situation where buyers and sellers are not
dependent on each other, as asset specificity is not a factor and the coordination through
the chain is low. Markets are mainly governed by price and, therefore, the degree of power
asymmetry is low.
- Modular value chains: This combination of the key determinants allows for a relatively low
level of coordination, as the rising complexity of transactions is offset by technical
standardisation and modular product architecture. The reduced component variation
enables the supplier to pool investments for different customers, which reduces asset
specificity. As complex information can be exchanged with little coordination because of
high codification abilities, the cost of switching to new partners still remains relatively low.
Stellenbosch University http://scholar.sun.ac.za

65
- Relational value chains: When supplier capabilities and product complexity are high, but
product specifications cannot be codified, a close relationship, including the need to
exchange tacit information, can be expected. The motivation for lead firms to allow high
levels of coordination and a mutual dependence comes from the advantage of access to
competitive competencies, which is offered by the highly competent supply base. As these
relationships can be regulated by reputation and social or spatial proximity, the high costs
of switching to new partners feed the regulation between the players.
- Captive value chains: When the capabilities in the supply base are low, but the complexity
of transactions and the capacity for codification is high, lead firms tend to capture the
supplier by investing in control and coordination and narrowing down the transactions to
particular tasks. Out of this transactional dependence, the supplier faces high switching
costs, making an exit an unattractive option, although the dominance of the lead firm
controls the linkage between the partners.
- Hierarchy: When the ability to codify transactions and the capabilities in the supply base are
low, but the product complexity is high, lead firms are required to develop and manufacture
in-house. As the exchange of tacit information between different value chain activities is on
a high level, it is crucial that intellectual property is controlled effectively.
Stellenbosch University http://scholar.sun.ac.za

66
Figure 3.12 depicts the findings of these five different forms of global value chain governance.
Figure 3.12: Five types of global value chain governance
Source: Gereffi et al., 2005: 89
Value chain governance patterns are not static, but change when industries upgrade. Additionally,
the value chain pattern is not applicable to the whole industry (Gereffi et al., 2005: 90). Increasing
complexity can be observed as lead firms place new demands on the value chain (e.g. just in time
supply and product differentiation) and reduce supplier competences in relation to new demands.
Whenever there is shrinking ability in terms of codification, innovation has taken place in the value
chain. Also, supplier competence changes over time as suppliers learn and adapt to technology
requirements, and decreases when new technology is introduced into the value chain.
Stellenbosch University http://scholar.sun.ac.za
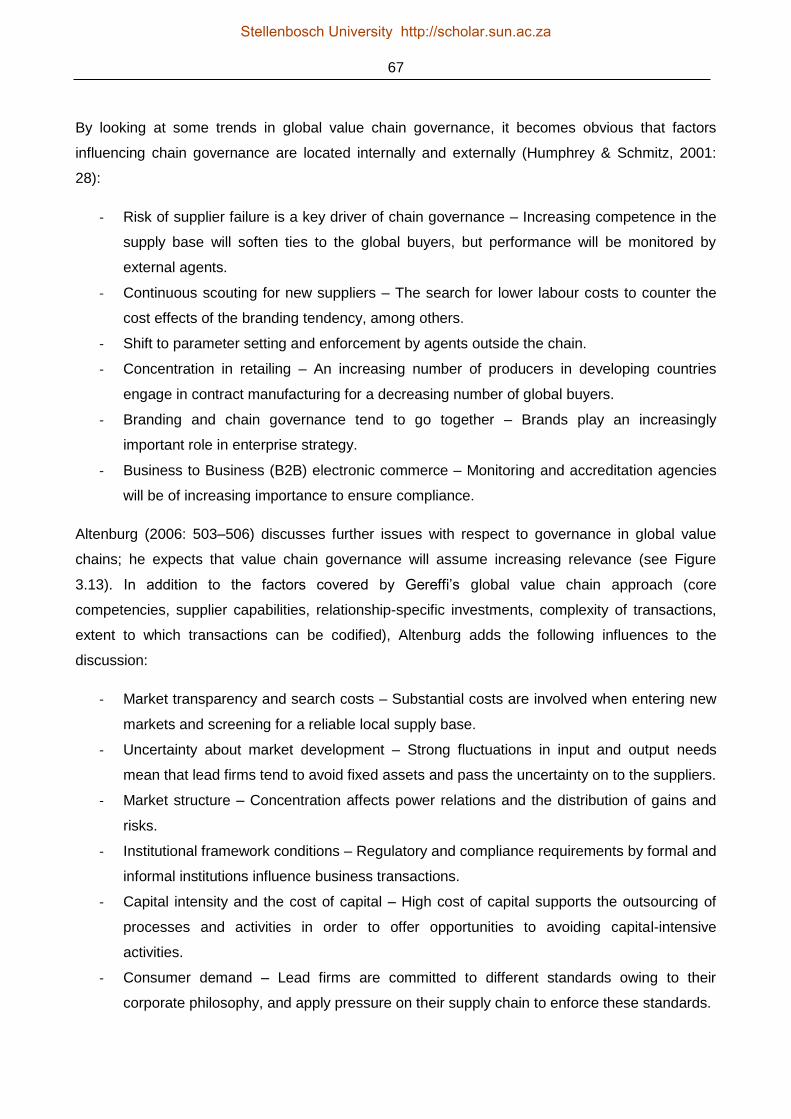
67
By looking at some trends in global value chain governance, it becomes obvious that factors
influencing chain governance are located internally and externally (Humphrey & Schmitz, 2001:
28):
- Risk of supplier failure is a key driver of chain governance – Increasing competence in the
supply base will soften ties to the global buyers, but performance will be monitored by
external agents.
- Continuous scouting for new suppliers – The search for lower labour costs to counter the
cost effects of the branding tendency, among others.
- Shift to parameter setting and enforcement by agents outside the chain.
- Concentration in retailing – An increasing number of producers in developing countries
engage in contract manufacturing for a decreasing number of global buyers.
- Branding and chain governance tend to go together – Brands play an increasingly
important role in enterprise strategy.
- Business to Business (B2B) electronic commerce – Monitoring and accreditation agencies
will be of increasing importance to ensure compliance.
Altenburg (2006: 503–506) discusses further issues with respect to governance in global value
chains; he expects that value chain governance will assume increasing relevance (see Figure
3.13). In addition to the factors covered by Gereffi‟s global value chain approach (core
competencies, supplier capabilities, relationship-specific investments, complexity of transactions,
extent to which transactions can be codified), Altenburg adds the following influences to the
discussion:
- Market transparency and search costs – Substantial costs are involved when entering new
markets and screening for a reliable local supply base.
- Uncertainty about market development – Strong fluctuations in input and output needs
mean that lead firms tend to avoid fixed assets and pass the uncertainty on to the suppliers.
- Market structure – Concentration affects power relations and the distribution of gains and
risks.
- Institutional framework conditions – Regulatory and compliance requirements by formal and
informal institutions influence business transactions.
- Capital intensity and the cost of capital – High cost of capital supports the outsourcing of
processes and activities in order to offer opportunities to avoiding capital-intensive
activities.
- Consumer demand – Lead firms are committed to different standards owing to their
corporate philosophy, and apply pressure on their supply chain to enforce these standards.
Stellenbosch University http://scholar.sun.ac.za

68
Figure 3.13: Increasing relevance of value chain governance
Source: Altenburg, 2006: 502
3.4 SYNTHESIS
This chapter pointed out insights about automotive value and supply chains, and discussed the
concept of global value chain governance. Several factors and concepts described in this chapter
impact on the sustainability of local suppliers in emerging markets. Figure 3.14 lists these factors
alphabetically within each subsection. These factors will be considered for the development of a
comprehensive model of sustainability of local suppliers in emerging markets, provided in Chapter
5, and in the conclusion of the literature review.
Stellenbosch University http://scholar.sun.ac.za
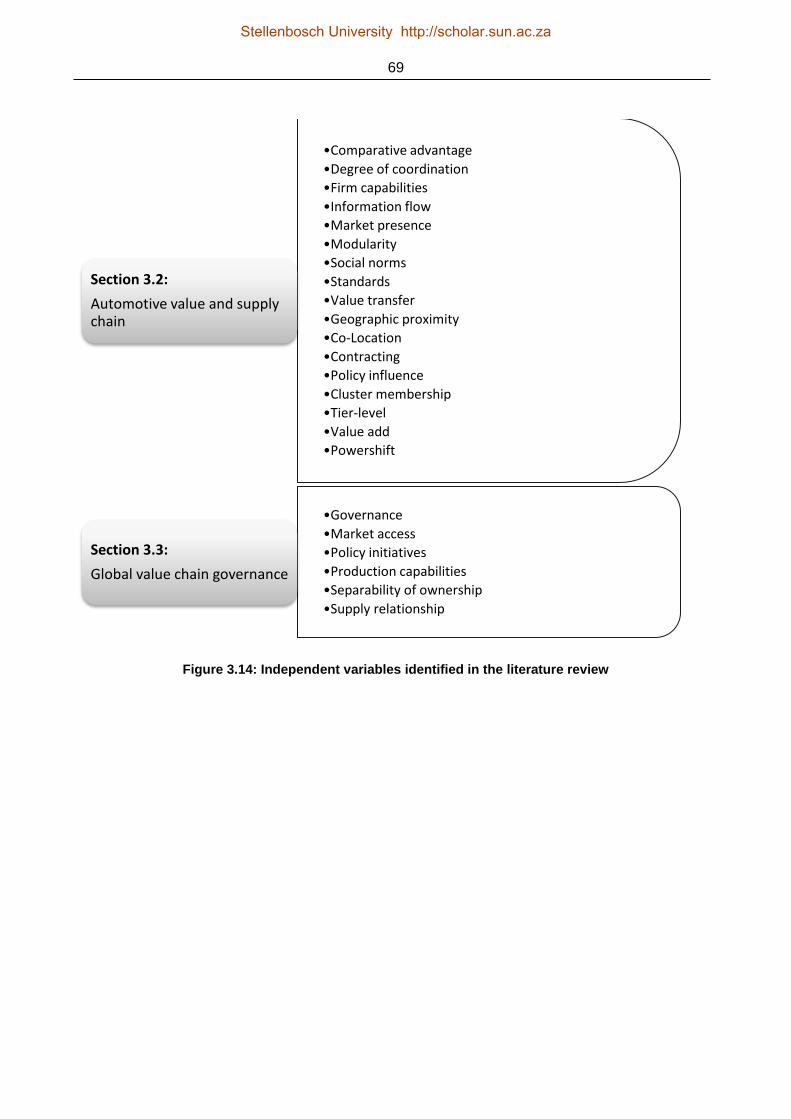
69
Figure 3.14: Independent variables identified in the literature review
•Comparative advantage
•Degree of coordination
•Firm capabilities
•Information flow
•Market presence
•Modularity
•Social norms
•Standards
•Value transfer
•Geographic proximity
•Co-Location
•Contracting
•Policy influence
•Cluster membership
•Tier-level
•Value add
•Powershift
Section 3.2:
Automotive value and supply chain
•Governance
•Market access
•Policy initiatives
•Production capabilities
•Separability of ownership
•Supply relationship
Section 3.3:
Global value chain governance
Stellenbosch University http://scholar.sun.ac.za

70
CHAPTER 4
LITERATURE REVIEW: MARKET ACCESS IN EMERGING
MARKETS
4.1 INTRODUCTION
This section discusses local supplier sustainability from two different angles. The first point of view
examines emerging-market specifics with respect to entry barriers and upgrading opportunities of a
local supplier industry to a global value chain, like the automotive industry. The second discussion
is the issue of market access, which is seen as a crucial factor for long-term sustainability. The
prerequisites for participation in global production networks are examined and how these
capabilities and requirements can be accomplished from a strategic point of view.
4.2 PERSPECTIVES OF LOCAL AUTOMOTIVE SUPPLIERS IN EMERGING
MARKETS
Altenburg (2006: 499) states: „The fact that trade is shifting from anonymous market-based
exchange of products to more durable patterns of industrial organization, with an increasingly
prominent role of lead firms, has multiple implications for developing countries:
- Minimum requirements for participation in value chains tend to rise as lead firms demand
increasing scales of production as well as compliance with more sophisticated product and
process standards.
- The competitiveness of the respective chain may rise or decline, hence also the viability of
developing country firms in these chains may be affected.
- Gains and risks will usually be renegotiated and redistributed among customers, retailers,
traders, processors and suppliers.
- The increasing or decreasing efficiency of value chains will affect the quality, availability
and price level of goods and services.‟
What does this mean for a local supply base in an emerging market? It can be argued that lead
firms pursue the same interests as their upstream and downstream partners as far as the efficiency
of the supply chain is concerned (Sturgeon & Van Biesebroeck, 2010: 27). But on the other hand,
they are looking for advantages when it comes to the distribution of risks and rents. Therefore, the
interests in relation to quality standards, purchasing prices and contractual obligations differ
substantially between the lead firms and their suppliers. Lead firms also pay attention to foster
competition in order to enhance their purchasing and bargaining power in the value chain, but only
to the extent that the size of their supply chain partners remains manageable (Altenburg, 2006:
Stellenbosch University http://scholar.sun.ac.za

71
517–518). Summing up, it can be argued that lead firms in the value chain try to optimise their
gains from the relationship with supply chain partners as long as the extent is only complementary
to their own activities.
Another factor comes into the equation when the variable of proximity is introduced. Lead firms
tend to have a reliable, low-cost, high-quality local supply base nearby. This is especially the case
for bulky, transaction-cost-intensive supplies (Altenburg, 2006: 518). However, this case is only
valid when transport costs are high and standardisation is not in place. In all other cases, lead
firms tend to make use of their global production and sourcing network. Local firms and their
stakeholders (especially government institutions), on the other hand, are interested in developing a
local supply base.
All this is due to changing governance structures, which transform the automotive industries in
developing countries. As described earlier, this fact can be manifested in two ways:
- The integration of developing countries into global auto production systems, which leads to
the exposure of local companies to the global value chains of their customers
- The emergence of global component suppliers that are increasingly responsible for
designing and delivering component systems at multiple locations around the world
(Humphrey, 2003: 122)
Humphrey (2000) says that the governance structures in the automotive value chain principally
allow for different strategic approaches to develop perspectives for local suppliers in emerging
markets. These include:
- „Going it alone‟ as a first-tier supplier – which effectively means becoming global and
competing with much larger global component manufacturers.
- Developing an alliance with an international leading supplier – which offers substantial
access to technology and markets.
- Being a national first-tier supplier through licensing designs and technology – which seems
difficult, as transnational companies tend to set up their own operations in the follow-
sourcing concept of the OEMs.
- Finding a profitable niche in the second tier – although the tendency of the second-tier
supplier stage is to be cost-competitive, this space is not likely to be allocated by
international companies, as their financial and managerial capabilities are not sufficient to
expand their business overseas.
Stellenbosch University http://scholar.sun.ac.za

72
- Finding a specialist position as a global supplier – which depends on the availability, and
capability to make use, of comparative advantages of the home market; often this
perspective is tied to raw materials, labour cost or specialisation in products (Humphrey,
2000: 266).
- Being a supplier to both domestic and international aftermarkets. The ability of locally
owned firms to compete in each of these markets can be influenced by support provided by
local and national institutions (Humphrey & Memedovic, 2003: 43).
These findings are supported by the Trade and Development department of the United Nations,
UNCTAD/DITE (2007), which show in their research on linking local businesses into global value
chains that collective efficiency through horizontal clusters (Altenburg & Meyer-Stamer, 1999:
1697) or vertical TNC-linkages give the best opportunities to pursue the abovementioned
perspectives. Humphrey and Schmitz (1996: 1873) describe this as a „triple-C approach‟ for the
industrial policy of a developing country – an approach that combines ideas about customer-
oriented, collective and cumulative.
So what are the implications for local suppliers in emerging markets? As Barnes and Morris (2008:
34) state in their work about the South African automotive industry, there are three key challenges
for developing economies. Firstly, there are the characteristics and governance of producer-driven
value chains with centralised power in the form of the OEMs as lead firms. Secondly, there is
agglomeration of power in terms of access to information flows in global multinational firms. And
thirdly, there are competitive pressures in the global markets, which lead to the deterioration of
financial results.
The restructuring of automotive supply chains has implications for local suppliers (Sturgeon & Van
Biesebroeck, 2010: 4). As power is centralised in the hands of lead firms – either OEMs or large
suppliers – the domestic industry in developing countries seems to be confined to the second tier
of the value chain (Sturgeon & Florida, 2000: 64). This is mainly because of the follow-sourcing
characteristics in the industry. New production sites in emerging markets by OEMs are likely to be
supplied by international first-tier suppliers that are tied to the OEMs. This is because the OEMs
want the same quality in products and processes throughout their operations in order to deliver the
final customer a comparable product and/or service in every market (Fujita & Child Hill, 1999: 221).
Although first-tier suppliers tend to develop their own supply networks in developing countries, it
can be said that the financial and managerial possibilities of the second-tier supplier landscape do
not allow for the concept of follow sourcing (Humphrey & Memedovic, 2003: 32). This offers
opportunities for locally owned suppliers to enter the value chain and occupy the second tier of
component manufacturing. As the first-tier suppliers have to concentrate their efforts on the
production and delivery of modules and systems, even the chance to upgrade from low-skill
Stellenbosch University http://scholar.sun.ac.za
73
operations (and, therefore, normally low value-added products) to producing more sophisticated
components for the domestic supplier landscape is given. To take advantage of these niche
markets it is important that the supplier has information about the outsourcing strategies of the first-
tier supplier in order to focus the resources on the right products. If the products cannot be offered
by the local supplier industry, first-tier suppliers have to either contract multinational firms or import
the products. The implication for local South African suppliers is that they must also take into
account the changed environment with respect to governmental regulations and policy. As the
automotive component industry does not receive any substantial protection any more it is faced
with issues of competitiveness on two fronts. On the one hand, it needs to improve the general
performance of its operations in order to compete with the threat of imported products, and on the
other hand it needs to connect with lead firms for the sake of relationships with OEMs and the
facilitation of export opportunities (Barnes, 2000a: 408). An interesting fact that is sometimes
neglected is the buyer‟s organisational structure. The automotive industry normally works in
centralised organisational units (e.g. centralised purchasing units in the lead firms‟ headquarters)
to take advantage of economies of scale and efficient business processes. Therefore, it might be
important that suppliers that wish to participate in the buyer‟s value chain have a presence and
visibility in traditional and booming markets (Sturgeon & Van Biesebroeck, 2010: 27).
Figure 4.1: Changing assembler-supplier relations
Source: Humphrey, 2003: 131
Stellenbosch University http://scholar.sun.ac.za

74
Figure 4.1 and 4.2 describe the change in flow of components under the concept of follow sourcing
and show that it is most likely that suppliers in developing countries will connect to the international
first-tier suppliers of the OEMs in order to get access to markets and information.
Figure 4.2: Global sourcing from developing-country partners
Source: Humphrey & Memedovic, 2003: 41
4.3 SOUTH AFRICA AS AN EMERGING MARKET IN THE GLOBAL
AUTOMOTIVE VALUE CHAIN
The picture of emerging markets in the global automotive value chain turns out to be quite diverse.
It ranges from the situation in China, with its exploding domestic growth rates and a rapidly
developing automotive industry (both domestically and internationally owned), to South Africa, with
expected moderate growth rates and a domestic industry that finds itself in a competitive
international environment while still looking for the upgrade to full manufacturing stages. Looking at
the different concepts that have been discussed earlier, it becomes obvious that there are certain
features that distinguish the South African automobile industry from other emerging markets.
The first distinctive feature is the limited domestic market, although government initiatives aim for it
to grow to 1.2 million vehicles by 2020 – including exports. However, the domestic market and the
southern African regional markets are too small to be recognised as a viable automotive
environment. Therefore, the capacities of domestic production must also be used for export
purposes to accomplish sufficient economies of scale. This leads to the question of which markets
Stellenbosch University http://scholar.sun.ac.za
75
should be targeted and whether the infrastructure of the country is sufficient to support expansion
into global markets. The second issue raised by limited inbound market options is whether it is
possible to link local suppliers in the global value chain. This issue certainly does not concern the
multinational companies or their joint ventures because their subsidiaries or affiliates will profit from
being bound into the global production network of their parent companies. Therefore, the question
is how locally owned suppliers can be brought into the global value chain and what the
preconditions for this linkage are.
The second distinctive feature is the economic stage of the South African automotive industry.
From a historical point of view the industry is quite mature with regard to OEM-structure and a
dispersed local supplier industry. All of the vehicle assemblers have been operating their plants for
decades and use their South African hub to supply domestic markets in the southern African
region, as well as to serve specific markets that either fit into production strategy (like export
markets for right-hand-drive vehicles) or offer trade agreements (like the North American Free
Trade Agreement because of the African Growth and Opportunity Act). Additionally, the import-
export scheme of the Motor Industry Development Program brings a high rate of inner-company
trade for OEMs and large suppliers, as they use the South African location for labour and products
that are raw-material-intensive. Because of the long history of the industry the multinational
supplier landscape has also formed itself according to how it has been shaped by the OEMs. The
multinational supplier industry uses the South African market as a hub for exports. For instance,
the industry for catalytic converters uses the proximity to raw-material markets for precious metals
in southern Africa to optimise working capital. The question then arises whether the exporting
companies are local suppliers or multinational enterprises. If the latter it should be asked how
much value-add is contributed by local suppliers and how they are integrated into the value chain.
The third unique characteristic, it can be argued, is the concept of economic geography. The South
African automotive industry seems to be highly fragmented from the lead firms‟ headquarters, as
operations by the vehicle manufacturers and their suppliers are concentrated in the traditional triad
markets and expanding into the big emerging markets, like China and India. There are other
exceptions for cost reasons, as European vehicle manufacturers locate operations in Eastern
Europe – and also force their suppliers to follow – and the same applies to North America, as
OEMs and suppliers tend to shift operations either to Mexico or to the southern areas of the US.
Therefore one needs to question why vehicle manufacturers still maintain their operations in South
Africa, given that the country very distant from any emerging or traditional markets. One answer
may be related to the history of the South African automotive industry, as mentioned above. As the
industry has been operating in South Africa for decades, an environment has developed in which
world-quality standards can be achieved and export support through the Motor Industry
Stellenbosch University http://scholar.sun.ac.za

76
Development Program results in a fairly competitive cost situation. A second answer lies in the
comparative advantage of South African operations. With its wealth of raw-material resources,
South Africa offers OEMs and suppliers opportunities to directly engage with the raw-material
suppliers.
The fourth attribute of South Africa‟s automotive industry is its long-lasting protection and support
through governmental regulations. Although this characteristic does not substantially differentiate
South Africa from other emerging markets, like Brazil, the switch from protectionist local content
programmes to a supportive regulatory policy in 1995 gives the industry a unique feature. The
market exposure to global competitive pressures led to a restructuring of the industry in terms of
ownership structures in the OEM and supplier businesses. It also meant a transformation from low-
volume, uneconomical vehicle production to high-volume unit output with the aim of achieving
economies of scale. The export-import complementation scheme brought the opportunity to offset
import duties by exporting products.
4.4 UPGRADING AND POSITIONING OF LOCAL AUTOMOTIVE SUPPLIERS IN
THE VALUE CHAIN
The perspectives of automotive suppliers, as described in the previous section, lead to the
question: How can local automotive supplier enterprises develop and position themselves in order
to take advantage of the globalised automotive value chain? Two influences have a major impact
on this question. Firstly, the capabilities of suppliers to upgrade themselves either horizontally or
vertically; and secondly, the ability of these companies to position themselves at the right place in
the value chain.
Research on linking among local suppliers in global value chains suggests different overarching
approaches to the question of market access. These approaches will be examined in the following
discussion, but it is important to mention that the base layers of a firm‟s competitiveness and
operational excellence have to be sufficient to link into global value chains before looking at the
more general concepts of integration. Once local suppliers are capable of production to
internationally required standards and show their performance in the domestic supply chain they
can advance by upgrading horizontally or vertically in the value chain (Giuliani, Pietrobelli &
Rabellotti, 2005: 552).
The issue of market access is located on the level of industry or macroeconomic mechanisms in
the global automotive value chain: at what stage of the value chain is it likely to get market access?
In general, this question views the value chain in a three-dimensional way.
Stellenbosch University http://scholar.sun.ac.za
77
The first dimension relates to whether the point of access is located in the upstream or
downstream part of the value chain. The upstream value chain feeds components to the
assemblers, whereas the downstream value chain offers services concerning the distribution of
products to the final customer. The question to be asked with regard to this issue is whether local
automotive suppliers should target the vehicle manufacturers directly or should rather focus on
further opportunities in the value chain. Opportunities for access to the value chain could lie in the
upstream value chain as a second or third supplier, as well as in the very downstream value chain
when after-sales come into play. This fact is also supported by findings from the Organisation for
Economic Co-operation and Development, the OECD (2008) which provide insights gleaned from
case studies in Mexico, India and South Africa. Local suppliers in developing countries were not
able to become global sourcing partners and, therefore, started to link in as second-tier suppliers
(Lee & Cason, 1994: 240). The next differentiation of upgrading opportunities is tied to the question
of whether the business process of the supplier is a high- or low-value-adding activity. The degrees
of value-add have implications for the competitive pressures that the participating companies have
to deal with. Low-value-adding activities are generally found in price-sensitive environments,
whereas high-value-adding activities normally appear in technologically advanced product areas
that do not follow regular price mechanisms in general. These products offer advantages of a
technological or other nature that cannot be offset by market regulations. The third layer of the
three dimensions of the value chain relates to the issue of whether primary or supportive functions
are performed by the companies that are seeking market access. Primary functions involve
everything used for the actual processing of the product, like material conversion or the assembly
of sub-modules or systems; supportive functions are found in the service areas around the value
chain.
The next issue of access to a value chain relates to the channel that is used to acquire contracts
with other members of the value chain. Access can be either granted horizontally through efficient
local clusters or vertically by linkages between transnational and small to medium-sized local
companies. Efficient local clusters refer to the issue of whether a competitive advantage can be
offered to the receiving value chain by these conglomerates of industrial production. An efficient
local cluster in this context describes the effects of a combination of some firms that use a cluster
approach to continuously improve their performance (e.g. by benchmarking activities, etc.). Vertical
linkages between transnational companies and local suppliers explain the relationship between
foreign companies and the domestic supplier landscape, which is used to profit from the low-cost
input factors. The chance to upgrade opportunities and backward linkages by means of technology
and knowledge introduced by foreign direct investment are numerous (Humphrey & Schmitz, 2004:
354). Table 4.1 lists the differences involved in governance and upgrading in clusters versus value
chains.
Stellenbosch University http://scholar.sun.ac.za
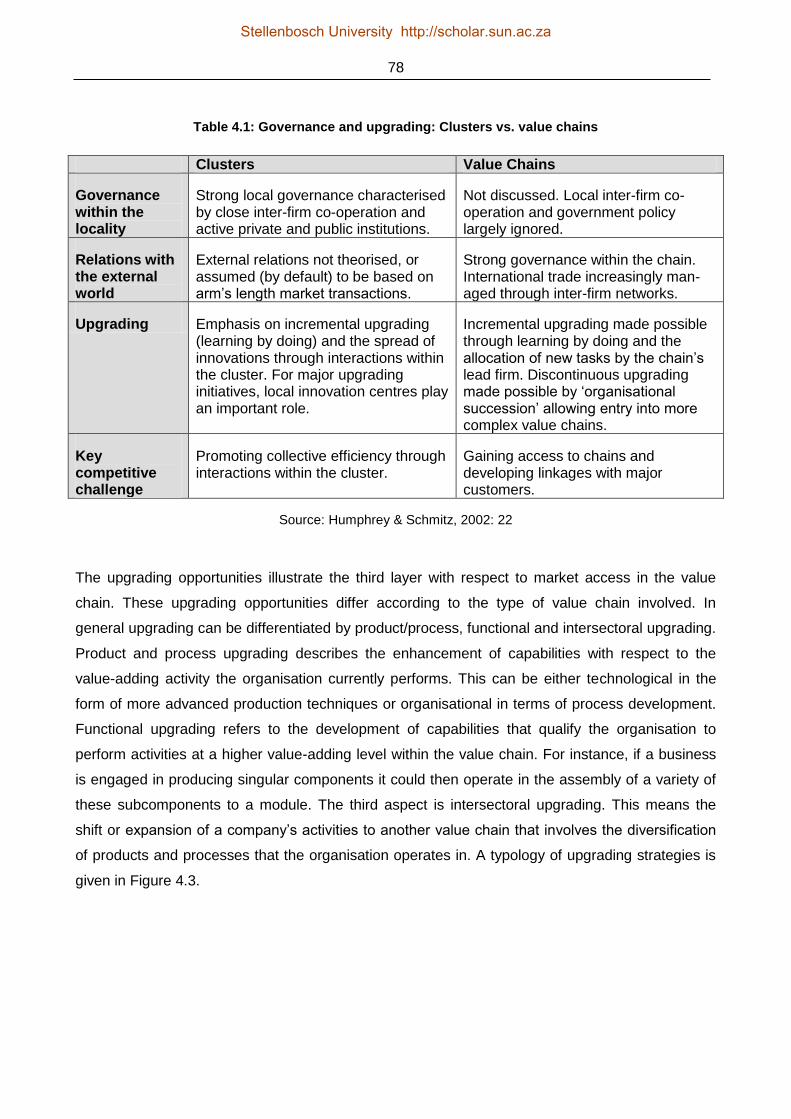
78
Table 4.1: Governance and upgrading: Clusters vs. value chains
Clusters Value Chains
Governance within the locality
Strong local governance characterised by close inter-firm co-operation and active private and public institutions.
Not discussed. Local inter-firm co-operation and government policy largely ignored.
Relations with the external world
External relations not theorised, or assumed (by default) to be based on arm‟s length market transactions.
Strong governance within the chain. International trade increasingly man-aged through inter-firm networks.
Upgrading Emphasis on incremental upgrading (learning by doing) and the spread of innovations through interactions within the cluster. For major upgrading initiatives, local innovation centres play an important role.
Incremental upgrading made possible through learning by doing and the allocation of new tasks by the chain‟s lead firm. Discontinuous upgrading made possible by „organisational succession‟ allowing entry into more complex value chains.
Key competitive challenge
Promoting collective efficiency through interactions within the cluster.
Gaining access to chains and developing linkages with major customers.
Source: Humphrey & Schmitz, 2002: 22
The upgrading opportunities illustrate the third layer with respect to market access in the value
chain. These upgrading opportunities differ according to the type of value chain involved. In
general upgrading can be differentiated by product/process, functional and intersectoral upgrading.
Product and process upgrading describes the enhancement of capabilities with respect to the
value-adding activity the organisation currently performs. This can be either technological in the
form of more advanced production techniques or organisational in terms of process development.
Functional upgrading refers to the development of capabilities that qualify the organisation to
perform activities at a higher value-adding level within the value chain. For instance, if a business
is engaged in producing singular components it could then operate in the assembly of a variety of
these subcomponents to a module. The third aspect is intersectoral upgrading. This means the
shift or expansion of a company‟s activities to another value chain that involves the diversification
of products and processes that the organisation operates in. A typology of upgrading strategies is
given in Figure 4.3.
Stellenbosch University http://scholar.sun.ac.za

79
Figure 4.3: A typology of upgrading strategies
Source: Herr, 2006: 2
Giuliani et al. (2005: 565) state that interactions between lead firms and local suppliers do not play
a significant role with regard to product and process upgrading. Market liberalisation has caused
the lead firms to displace most of the local ones in favour of their existing supply network – in this
case, multinational suppliers. Giuliani et al. furthermore come to the conclusion that participating in
a value chain does not necessarily lead to opportunities for upgrading in the specific industry. They
state that the interest is intrinsic to the firms that want to operate as suppliers, and upgrading is
facilitated by market mechanisms.
Figure 4.4 summarises the options pointed out above and describes who supports or promotes the
development opportunities structured according to the governance structure that the supplier feeds
into.
Stellenbosch University http://scholar.sun.ac.za

80
Figure 4.4: Summary of innovation processes and the interrelation of concepts, actors and their
interactions
Source: Brach & Kappel, October 2009: 18
Having described the opportunities of access to value chains, it is worthwhile looking at some of
the benefits and risks of exclusion. Because global networks and, therefore, global value chains
are widely dispersed and fragmented it is an imperative to link into global networks of knowledge
(Barnes & Morris, 2008). These „key channels of knowledge‟ enable participants to acquire
important information about the governance of the value chains. Necessary information in this
matter could be who the lead firms in the value chain are and how the relationships between lead
firms and suppliers are configured (Fu, Pietrobelli & Soete, 2010: 13).
It should also be noted that producer-driven value chains contain the risk of supplier failure
(Schmitz, 1999). These supplier issues can range from delivery problems to quality issues, which
put the lead firms in the value chain into a position where they depend on the reliability of their
suppliers. To minimise the risk lead firms tend to operate with suppliers that already have an
established relationship and operate globally. By doing this, lead firms rely on single sourcing in
Stellenbosch University http://scholar.sun.ac.za

81
particular circumstances, but can benefit from the global operation networks of the multinational
suppliers, as issues on delivery or quality can be resolved in the supplier‟s organisation itself. A
trend that is reinforcing this issue is the ongoing consolidation in the supplier industry. With the rise
of the so-called mega-suppliers, the power in buyer-seller relationships in the automotive industry
is likely to shift in favour of large suppliers that offer high competencies in innovative technologies
(Sturgeon & Florida, 2000: 69). This power shift could cause inefficiencies in the supply chain, as
the chain is controlled by different participants with diverse aims. Stakeholders in the value chain,
the OEMs and the large suppliers all target profit maximisation in their field of business, which
could lead to uneconomical allocation of capital and resources.
What do the perspectives and the upgrading opportunities mean in terms of positioning in the
automotive value chain for emerging-market suppliers? Dawar & Frost (1999: 122) suggest the
following typology (see Figure 4.5) in their work about survival strategies for local companies in
emerging markets. Their classification is dependent on the competitive assets of the local firm and
the pressures to globalise in the industry. With respect to the automotive industry, it can be said
that the pressures to globalise are rather high for emerging-market companies. This is because a
critical mass in terms of economies of scale must be reached to compete in the automotive value
chain. According to the framework the „dodger‟ and the „contender‟ approaches should be targeted
in this constellation.
Figure 4.5: Positioning of emerging-market companies
Source: Dawar & Frost, 1999: 122
Stellenbosch University http://scholar.sun.ac.za
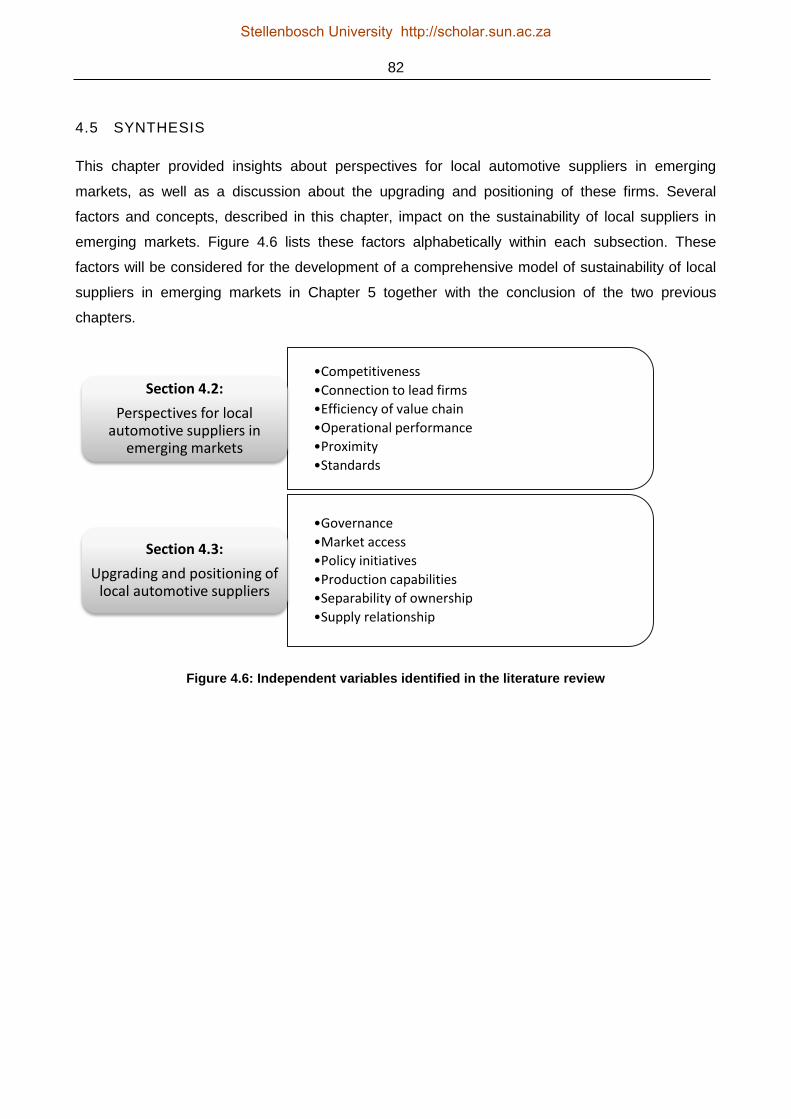
82
4.5 SYNTHESIS
This chapter provided insights about perspectives for local automotive suppliers in emerging
markets, as well as a discussion about the upgrading and positioning of these firms. Several
factors and concepts, described in this chapter, impact on the sustainability of local suppliers in
emerging markets. Figure 4.6 lists these factors alphabetically within each subsection. These
factors will be considered for the development of a comprehensive model of sustainability of local
suppliers in emerging markets in Chapter 5 together with the conclusion of the two previous
chapters.
Figure 4.6: Independent variables identified in the literature review
•Competitiveness
•Connection to lead firms
•Efficiency of value chain
•Operational performance
•Proximity
•Standards
Section 4.2:
Perspectives for local automotive suppliers in
emerging markets
•Governance
•Market access
•Policy initiatives
•Production capabilities
•Separability of ownership
•Supply relationship
Section 4.3:
Upgrading and positioning of local automotive suppliers
Stellenbosch University http://scholar.sun.ac.za
83
CHAPTER 5
DEVELOPMENT OF THE CONCEPTUAL MODEL
5.1 INTRODUCTION
This chapter summarises the theoretical approaches with respect to the formulation of the
conceptual model. Therefore, the theoretical concepts from the literature review are generalised
and analysed for their capability to offer a solution for the research problem. In the further course of
this chapter the factors for the sustainability of local suppliers in the automotive value chain in
South Africa are aggregated from the conclusions of each literature review chapter. This
aggregation is then used to formulate a holistic conceptual model.
5.2 CONCLUSIONS OF THE LITERATURE RESEARCH
The most relevant theories that have been discussed during the literature review are the following:
- Globalisation (see Section 2.2), as it focuses on the integration of trade, foreign direct
investment across countries and the spread of technology.
In terms of globalisation, vehicle manufacturers tend to set up manufacturing plants in
emerging markets to overcome regulations, profit from the low-cost input factors and
produce vehicles in proximity to their final markets. The growth perspectives and the
comparative advantage of emerging markets lead to a vertical fragmentation of the
automotive value chain, as suppliers follow their customers because they are forced to do
so by the lead firms. With this issue the possibility of inefficiencies in the value chain arises.
These inefficiencies can range from strategic disadvantages as suppliers follow a different
production strategy to high opportunity cost when the venture does not turn out
successfully. Conversely, the opportunity of foreign direct investment brings technology and
knowledge to the emerging markets. This will likely increase the competence of the supply
base and enable local suppliers to gain access not only to the domestic market, but also to
international markets. Globalisation connects with the concepts of global value chains,
economic geography and political economy. One of the main criticisms in terms of the
application to the research issue is the fact that globalisation is commonly connected to
market areas with high growth rates – the „shining‟ emerging economies like China. The
concept does not neglect other emerging economies, but it offers fewer insights for these
areas. Nevertheless, the theory of globalisation offers implications about the effectiveness
of foreign direct investment and the spread of technology.
Stellenbosch University http://scholar.sun.ac.za

84
- Political economy (see Section 2.3) because it refers to the interdisciplinary studies drawing
from economics, law and political science and is explains how the political environment and
economics influence each other.
The theory of political economy interferes with the theoretical concepts of global value
chains and economic geography. The main reason for this interference is that political
economy discusses the influences of trade agreements and government regulations in
particular areas of economic activity (mostly in the area of countries or trade regions). As all
of the concepts deal with dispersed operations in different areas, the influences of trade
agreements and/or government are an additional dimension discussed by political
economists. Even though the concept of political economy gives references to the research
questions it does not give an answer to the sustainability issue of local suppliers in
emerging markets without government protection. However, the theoretical ideas of political
economy are of great relevance to the research issue, as automotive products are among
the 25 highest-ranked products that are traded globally. This makes the automotive industry
a well-respected sector in those countries where it accounts for a significant proportion of
the gross domestic product.
- Economic geography (see Section 3.2), which concerns itself with the location, distribution
and spatial organisation of economic activities worldwide; it also includes thoughts on
globalisation and cluster theory.
Economic geography offers some explanations for the changes in the automotive industry
that have occurred as a result of the impact of fragmentation in the production processes in
the last decades (see Section 2.2 for a more detailed discussion). Although the concept of
economic geography considers many of the research problems, the specific issue of
sustainability of local suppliers in developing markets is not explored in depth. However,
particular issues, like the dispersion of production networks into geographical areas, are
examined. Compared to the concept of global value chains, it economic geography places
more emphasis on the spatial organisation of economic activities. Therefore, it adds an
important aspect to the global value chain notions.
Stellenbosch University http://scholar.sun.ac.za

85
- Fragmentation and cluster theory (see Section 3.2), which focuses on the concentration of
specialised industries in particular locations.
Market access not only refers to competitive advantages that are provided by suppliers to
lead firms in terms of cost rewards and access to technology, it also depends on
geographic proximity and social ties within the industry. Cluster theory can help to explain
some of the issues that are quite distinctive to the automotive industry. Clusters can be
defined as geographically proximate groups of interconnected companies and associated
institutions in a particular field, linked by commonalities and complementarities. These
agglomerations of firms are based on trust, reputation and mutual dependence. The
improvement of processes through combined efforts of the members of a cluster is the
most visible advantage. As cluster theory focuses on informal relationships in a particular
value chain, one major question is what are the prerequisites for membership? Membership
is important because it is believed that efficient clusters offer horizontal access to the
automotive value chain. Clusters are also likely to develop in emerging markets because
the combination of the capabilities of locally owned firms helps to comply with the
requirements in global value chains.
- Value chain analysis (see Section 3.2) categorises the generic value-adding activities of an
organisation (or beyond by analysing supply chains) and identifies the cost and value
drivers of each activity.
Value chain analysis directly assesses the issue of how to link into a production network.
By analysing the value chain the different stages of value-added of a product, the players
in the chain and the underlying business models of the participants in the value chain are
identified. It can also be concluded which lead firms in the value chain strategically opt for
in-house production. Therefore, important information on the components that are
outsourced and the core competencies of the lead firms can be assessed. The discussion
of a value chain also leads to an awareness of where the competitive advantages of
specific stages in the value chain are located and which companies can perform these
activities. With regard to the research question, value chain analysis gives answers to the
specific question of how value-added is distributed in a particular production process and
where the opportunities for likely market access are given. The consideration of
competitive advantages explores the opportunities for local suppliers in emerging markets
on the one hand, but is not sufficient with regard to the question of what the requirements
for successful entry into the value chain are. In particular, value chain analysis adds to the
Stellenbosch University http://scholar.sun.ac.za
86
concept of global value chains because it investigates the technical foundations of a
specific value chain.
- Supply chain strategy (see Section 3.2) is used in the field of supply chain management
(SCM) to outline the planning and management of all activities in sourcing, procurement
and logistics.
Supply chain strategy or management describes the planning and management of all
activities related to sourcing and procurement and all logistics management activities. From
a lead firm perspective it sets the footprint of the supplier network and also configures the
supplier landscape. The most important concepts with respect to the configuration of the
supplier network in the context of the research issues are single sourcing and follow
sourcing. Single sourcing describes the decision of a lead firm (which acts as a buyer in this
case) to supply a particular product from one specific supplier only. On the one hand, this
procedure puts the buyer in a dependent position where the risk of supplier failure is
extremely high; but on the other, the bargaining position improves through increased
economies of scale. The concept of follow sourcing is much more important in the context
of the research. Follow sourcing describes the movement of suppliers that „follow‟ their
customers to new production areas. Lead firms, in this case the customers, want their
important first-tier suppliers to set up supply in proximity to new production sites to ensure
equal supply in terms of cost and quality in their global production network. The lead firms‟
knowledge of supply chain strategy (and management) in the automotive industry is one
important factor in answering the research problems. It gives answers about the location of
the lead firms, but does not consider the question how local suppliers can compete or link
with transnational companies, which are preferred by the lead firms. Supply chain strategy
interferes with all of the other microeconomic concepts, as these concepts have direct
influence on the decisions on the supply chain strategy of a particular company.
- Global value chain governance (see Section 3.3) focuses on the spatial distribution of
activities and the exploration of how to engage in a value chain.
The global value chain concept gives insights into the dispersion and governance of the
automotive value chain. As the global value chain is a hybrid concept that recognises
macroeconomic as well as microeconomic factors, it can explain some of the specific
issues which are shaping the automotive industry. It recognises the pure impact of
Stellenbosch University http://scholar.sun.ac.za

87
transactions while looking at the complexity of transactions and it also examines the issues
of the ability to codify information and the capabilities in the supply base. Therefore, the
approach of global value chains considers not only global industry-level issues, but also
acknowledges issues that are specific to particular regions. In terms of the research
questions, the conclusion is that by applying measures of the concept of global value
chains the specifics of the automotive industry in developing markets can be adequately
understood. Nevertheless, in its generalised form it does not recognise the level of the
value chain that is being examined (e.g. the relationship between OEM and first-tier
supplier or the relationship between other members of the value chain). And it does not
take into account where the value chain is located (e.g. in developed or emerging markets).
- Firm-level learning and capabilities (see Sections 4.2 and 4.4) explore the question of what
measures and upgrading options companies have and pursue.
Firm-level learning and capabilities describe competencies in the supply base. They allow
possibilities for horizontal or vertical upgrading in a specific supply chain of a particular
company. The theory of firm-level learning and capabilities is fundamental to the research
problem. As companies in emerging markets are required to comply with global standards,
the element of firm-level learning and capabilities will be regarded as a prerequisite to the
research. Therefore, this aspect will not be discussed in depth during the further research.
The approach is partly considered in the concept of global value chains, as capabilities in
the supply base define a variable in the discussion of governance of value chains. Firm-
level learning and capabilities also refer to modularisation and supply chain strategy
because suppliers who want to get access to the value chain have to be able to cope with
current technological developments, like modularisation, and also have to show their
qualification in the supply chain in order to be considered by lead firms with regard to their
decisions about the supply chain landscape.
All these theories can be used to describe the global automotive value chain in the context of the
research problem. However, the question still remains as to how local suppliers in the automotive
industry can link into the global automotive value chain and whether there is a theoretical model
that describes the issue of the sustainability of local automotive suppliers in emerging markets.
From a literature-review point of view, it can be stated that a holistic approach with regard to the
research question based on existing theories does not exist because of the complex system that is
Stellenbosch University http://scholar.sun.ac.za
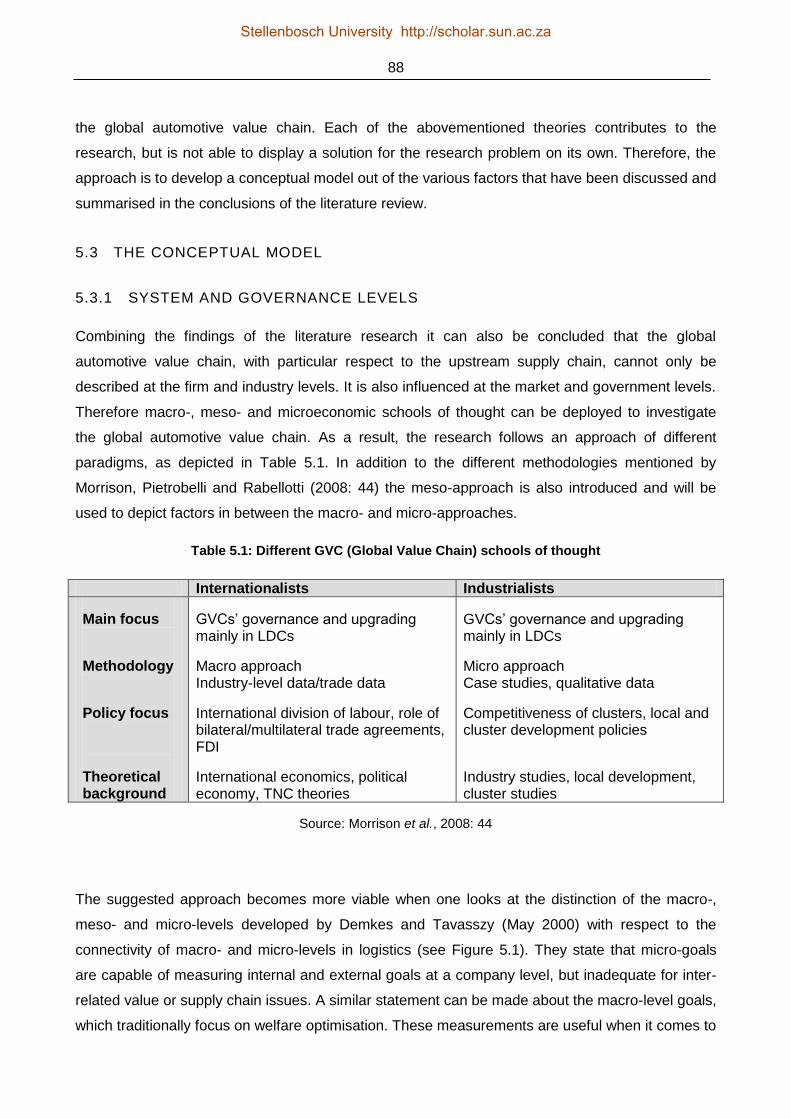
88
the global automotive value chain. Each of the abovementioned theories contributes to the
research, but is not able to display a solution for the research problem on its own. Therefore, the
approach is to develop a conceptual model out of the various factors that have been discussed and
summarised in the conclusions of the literature review.
5.3 THE CONCEPTUAL MODEL
5.3.1 SYSTEM AND GOVERNANCE LEVELS
Combining the findings of the literature research it can also be concluded that the global
automotive value chain, with particular respect to the upstream supply chain, cannot only be
described at the firm and industry levels. It is also influenced at the market and government levels.
Therefore macro-, meso- and microeconomic schools of thought can be deployed to investigate
the global automotive value chain. As a result, the research follows an approach of different
paradigms, as depicted in Table 5.1. In addition to the different methodologies mentioned by
Morrison, Pietrobelli and Rabellotti (2008: 44) the meso-approach is also introduced and will be
used to depict factors in between the macro- and micro-approaches.
Table 5.1: Different GVC (Global Value Chain) schools of thought
Internationalists Industrialists
Main focus
Methodology
Policy focus
Theoretical background
GVCs‟ governance and upgrading mainly in LDCs
Macro approach Industry-level data/trade data
International division of labour, role of bilateral/multilateral trade agreements, FDI
International economics, political economy, TNC theories
GVCs‟ governance and upgrading mainly in LDCs
Micro approach Case studies, qualitative data
Competitiveness of clusters, local and cluster development policies
Industry studies, local development, cluster studies
Source: Morrison et al., 2008: 44
The suggested approach becomes more viable when one looks at the distinction of the macro-,
meso- and micro-levels developed by Demkes and Tavasszy (May 2000) with respect to the
connectivity of macro- and micro-levels in logistics (see Figure 5.1). They state that micro-goals
are capable of measuring internal and external goals at a company level, but inadequate for inter-
related value or supply chain issues. A similar statement can be made about the macro-level goals,
which traditionally focus on welfare optimisation. These measurements are useful when it comes to
Stellenbosch University http://scholar.sun.ac.za

89
comparative analysis among different nations but must be reconfigured in order to be adequate for
an industry analysis.
Figure 5.1: Migration towards supply chain focus
Source: Demkes & Tavasszy, 2000: 16
In the conclusion on governance methodology, which was discussed in the literature review about
the governance of global value chains, the conceptual model also proposes to include levels of
governance as a further factor in the model. Governance levels are open to a typology suggested
by Coe and Hess (December 2006) in their work about global production networks. They
differentiate between political, institutional, industrial (or inter-firm) and intra-firm governance. This
concept adds to the inter-firm governance of the global value chain approach (GVC) and informs
about the intra-firm, institutional and political forms of governance.
In conclusion, the conceptual model is suggested to be composed of two layers, namely the
system levels and the governance levels. The system levels contain macro-, meso- and micro-
views and the governance levels are subdivided into government, market, industry and corporate
influences. The layers of the conceptual model are shown in Figure 5.2.
Stellenbosch University http://scholar.sun.ac.za
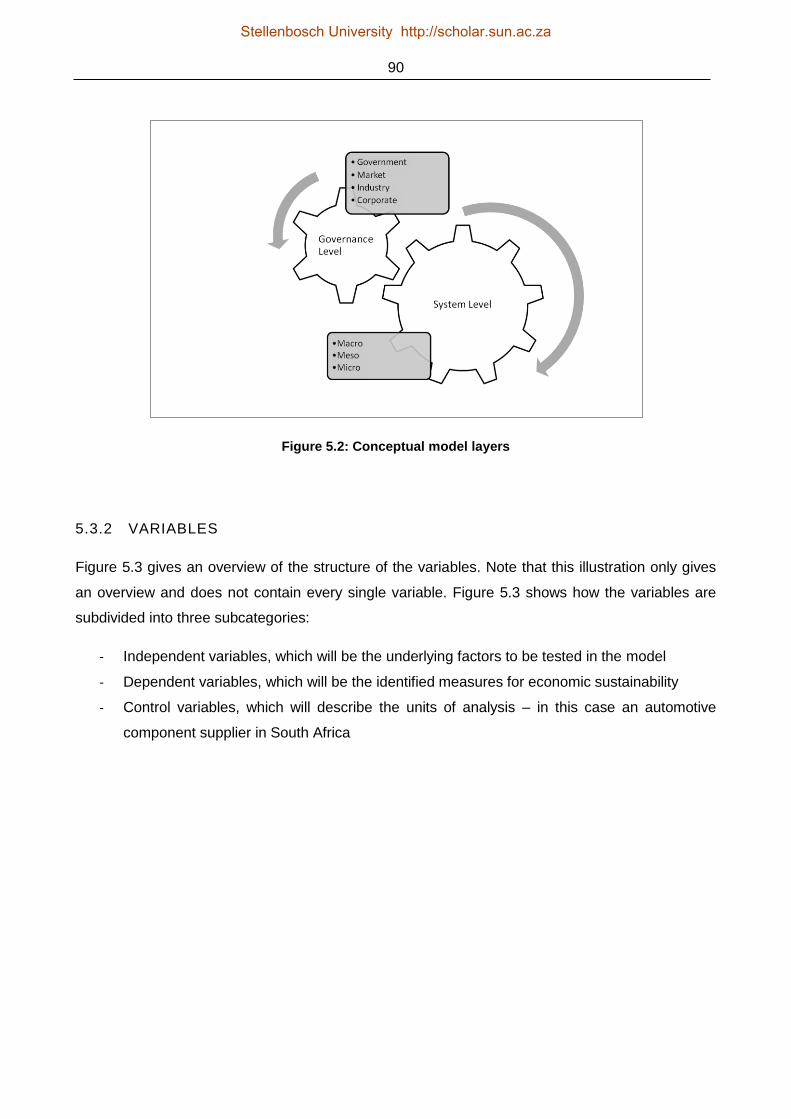
90
Figure 5.2: Conceptual model layers
5.3.2 VARIABLES
Figure 5.3 gives an overview of the structure of the variables. Note that this illustration only gives
an overview and does not contain every single variable. Figure 5.3 shows how the variables are
subdivided into three subcategories:
- Independent variables, which will be the underlying factors to be tested in the model
- Dependent variables, which will be the identified measures for economic sustainability
- Control variables, which will describe the units of analysis – in this case an automotive
component supplier in South Africa
Stellenbosch University http://scholar.sun.ac.za
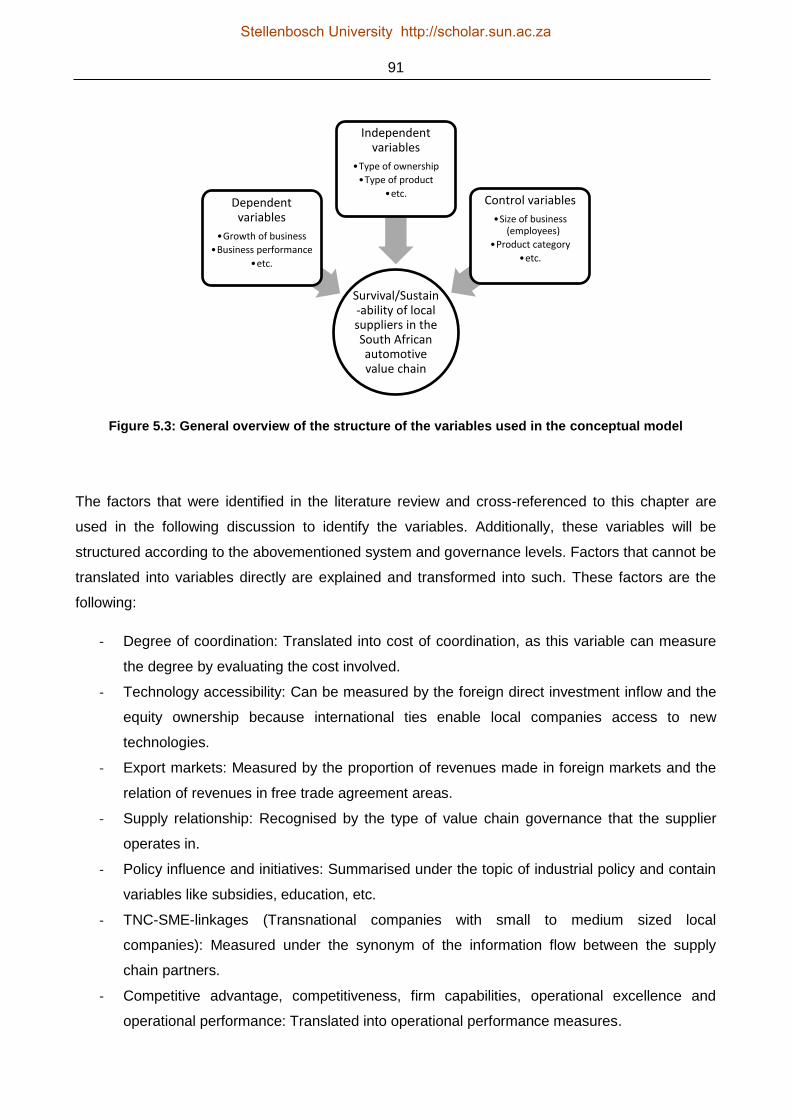
91
Figure 5.3: General overview of the structure of the variables used in the conceptual model
The factors that were identified in the literature review and cross-referenced to this chapter are
used in the following discussion to identify the variables. Additionally, these variables will be
structured according to the abovementioned system and governance levels. Factors that cannot be
translated into variables directly are explained and transformed into such. These factors are the
following:
- Degree of coordination: Translated into cost of coordination, as this variable can measure
the degree by evaluating the cost involved.
- Technology accessibility: Can be measured by the foreign direct investment inflow and the
equity ownership because international ties enable local companies access to new
technologies.
- Export markets: Measured by the proportion of revenues made in foreign markets and the
relation of revenues in free trade agreement areas.
- Supply relationship: Recognised by the type of value chain governance that the supplier
operates in.
- Policy influence and initiatives: Summarised under the topic of industrial policy and contain
variables like subsidies, education, etc.
- TNC-SME-linkages (Transnational companies with small to medium sized local
companies): Measured under the synonym of the information flow between the supply
chain partners.
- Competitive advantage, competitiveness, firm capabilities, operational excellence and
operational performance: Translated into operational performance measures.
Survival/Sustain-ability of local suppliers in the South African automotive value chain
Dependent variables
•Growth of business
•Business performance
•etc.
Independent variables
•Type of ownership
•Type of product
•etc. Control variables
•Size of business (employees)
•Product category
•etc.
Stellenbosch University http://scholar.sun.ac.za
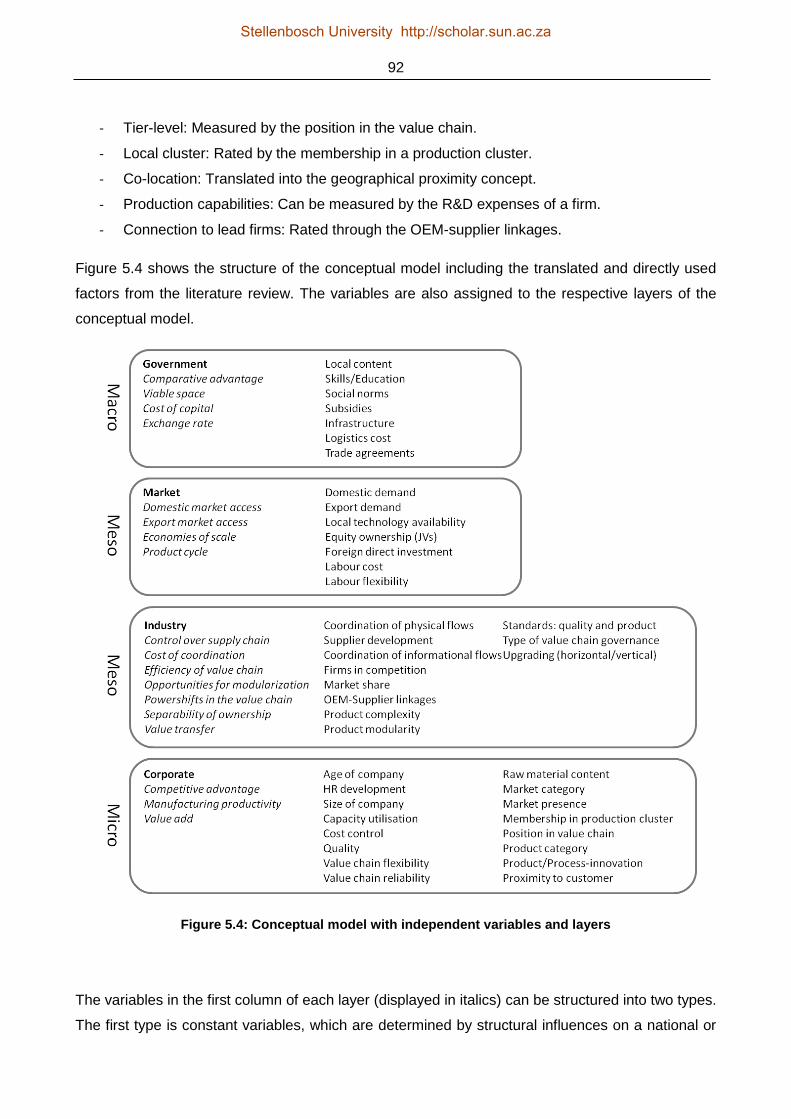
92
- Tier-level: Measured by the position in the value chain.
- Local cluster: Rated by the membership in a production cluster.
- Co-location: Translated into the geographical proximity concept.
- Production capabilities: Can be measured by the R&D expenses of a firm.
- Connection to lead firms: Rated through the OEM-supplier linkages.
Figure 5.4 shows the structure of the conceptual model including the translated and directly used
factors from the literature review. The variables are also assigned to the respective layers of the
conceptual model.
Figure 5.4: Conceptual model with independent variables and layers
The variables in the first column of each layer (displayed in italics) can be structured into two types.
The first type is constant variables, which are determined by structural influences on a national or
Stellenbosch University http://scholar.sun.ac.za
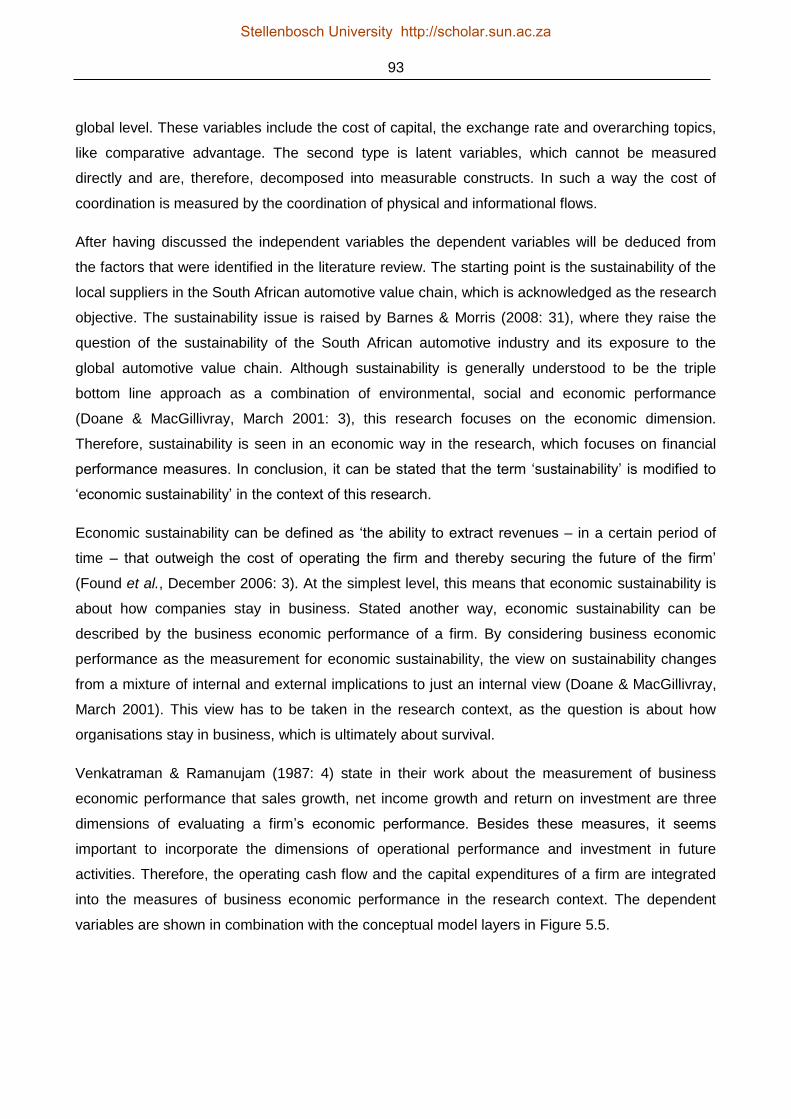
93
global level. These variables include the cost of capital, the exchange rate and overarching topics,
like comparative advantage. The second type is latent variables, which cannot be measured
directly and are, therefore, decomposed into measurable constructs. In such a way the cost of
coordination is measured by the coordination of physical and informational flows.
After having discussed the independent variables the dependent variables will be deduced from
the factors that were identified in the literature review. The starting point is the sustainability of the
local suppliers in the South African automotive value chain, which is acknowledged as the research
objective. The sustainability issue is raised by Barnes & Morris (2008: 31), where they raise the
question of the sustainability of the South African automotive industry and its exposure to the
global automotive value chain. Although sustainability is generally understood to be the triple
bottom line approach as a combination of environmental, social and economic performance
(Doane & MacGillivray, March 2001: 3), this research focuses on the economic dimension.
Therefore, sustainability is seen in an economic way in the research, which focuses on financial
performance measures. In conclusion, it can be stated that the term „sustainability‟ is modified to
„economic sustainability‟ in the context of this research.
Economic sustainability can be defined as „the ability to extract revenues – in a certain period of
time – that outweigh the cost of operating the firm and thereby securing the future of the firm‟
(Found et al., December 2006: 3). At the simplest level, this means that economic sustainability is
about how companies stay in business. Stated another way, economic sustainability can be
described by the business economic performance of a firm. By considering business economic
performance as the measurement for economic sustainability, the view on sustainability changes
from a mixture of internal and external implications to just an internal view (Doane & MacGillivray,
March 2001). This view has to be taken in the research context, as the question is about how
organisations stay in business, which is ultimately about survival.
Venkatraman & Ramanujam (1987: 4) state in their work about the measurement of business
economic performance that sales growth, net income growth and return on investment are three
dimensions of evaluating a firm‟s economic performance. Besides these measures, it seems
important to incorporate the dimensions of operational performance and investment in future
activities. Therefore, the operating cash flow and the capital expenditures of a firm are integrated
into the measures of business economic performance in the research context. The dependent
variables are shown in combination with the conceptual model layers in Figure 5.5.
Stellenbosch University http://scholar.sun.ac.za
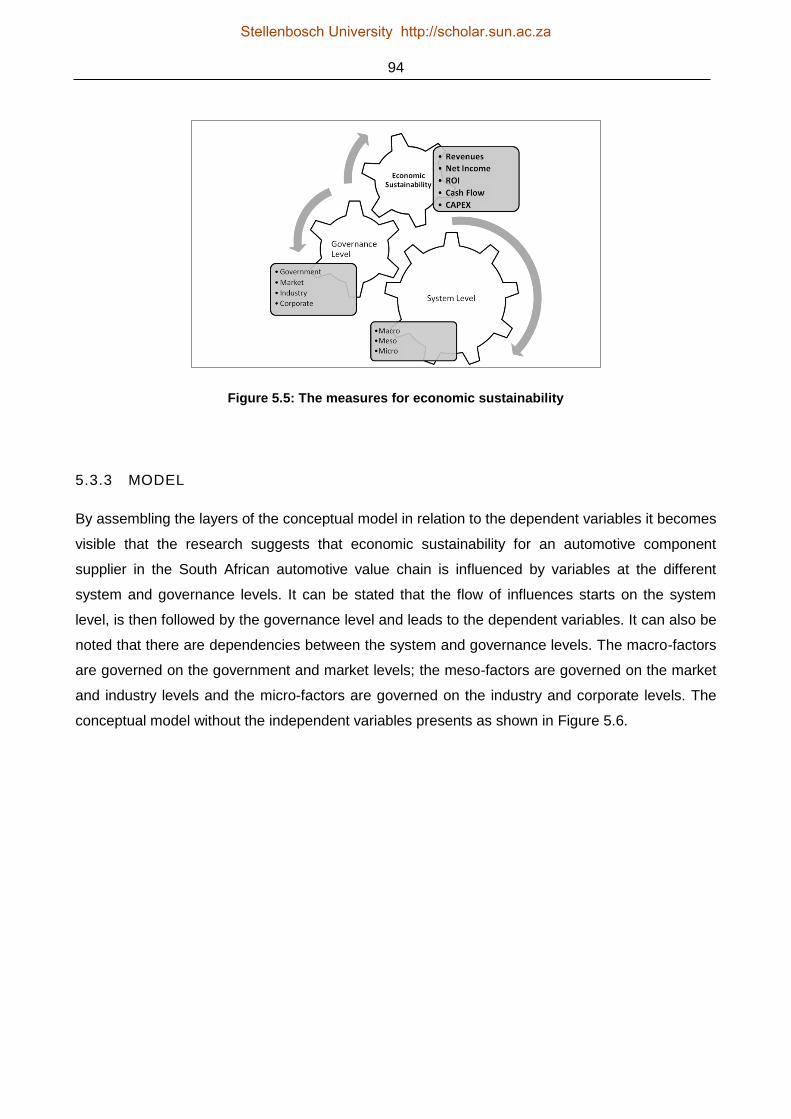
94
Figure 5.5: The measures for economic sustainability
5.3.3 MODEL
By assembling the layers of the conceptual model in relation to the dependent variables it becomes
visible that the research suggests that economic sustainability for an automotive component
supplier in the South African automotive value chain is influenced by variables at the different
system and governance levels. It can be stated that the flow of influences starts on the system
level, is then followed by the governance level and leads to the dependent variables. It can also be
noted that there are dependencies between the system and governance levels. The macro-factors
are governed on the government and market levels; the meso-factors are governed on the market
and industry levels and the micro-factors are governed on the industry and corporate levels. The
conceptual model without the independent variables presents as shown in Figure 5.6.
Stellenbosch University http://scholar.sun.ac.za
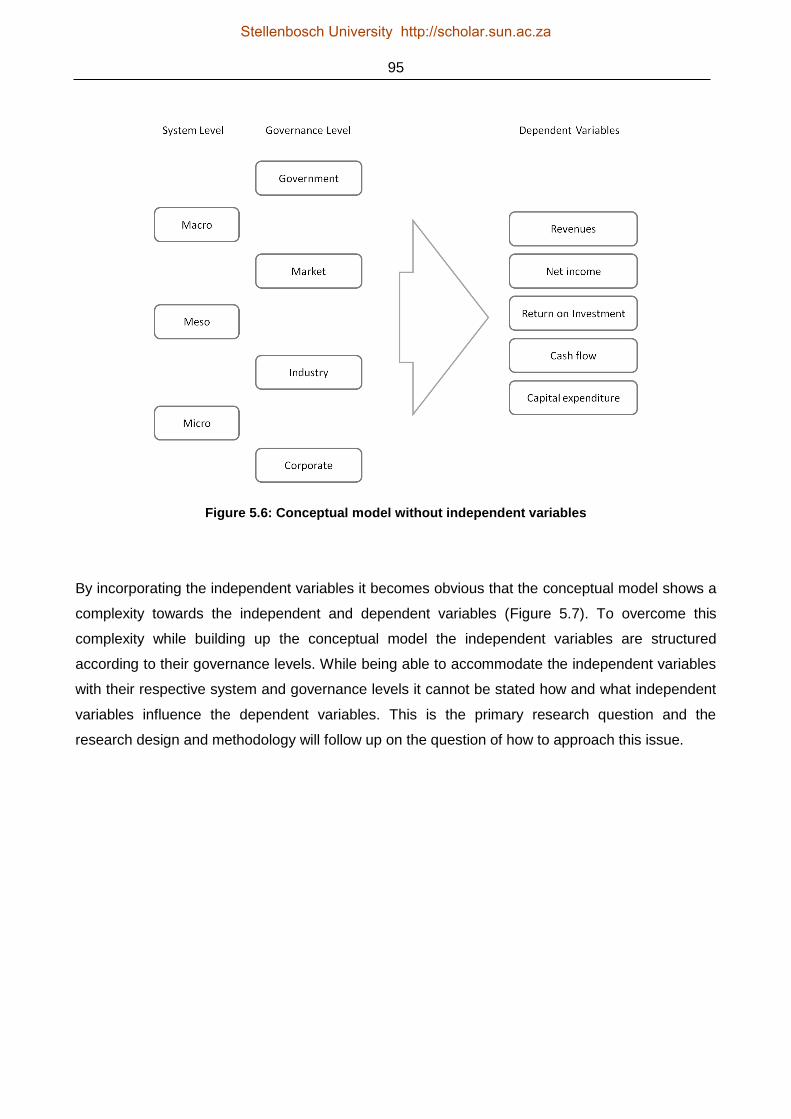
95
Figure 5.6: Conceptual model without independent variables
By incorporating the independent variables it becomes obvious that the conceptual model shows a
complexity towards the independent and dependent variables (Figure 5.7). To overcome this
complexity while building up the conceptual model the independent variables are structured
according to their governance levels. While being able to accommodate the independent variables
with their respective system and governance levels it cannot be stated how and what independent
variables influence the dependent variables. This is the primary research question and the
research design and methodology will follow up on the question of how to approach this issue.
Stellenbosch University http://scholar.sun.ac.za

96
Figure 5.7: Conceptual model including independent variables
5.3.4 RESEARCH QUESTIONS
After having developed the conceptual model, the research questions must be linked to the model.
The primary research question is how local automotive suppliers in emerging markets can build up
or secure competitiveness, which is equal to the question of which factors influence the local
supplier sustainability in the research environment. The secondary research questions relate to
factors that should change or enhance the sustainability of local suppliers. With regard to the
sustainability issue, the following assumptions can be made:
- Economic sustainability is assumed to be influenced by the independent variables.
- The independent variables show significant correlations (positive or negative) to the
dependent variables.
- Economic sustainability is not only based on the micro-level factors, but also derives from
meso- and macro-factors, which occur at the industry, market and government levels.
With regard to the secondary research objective, the factors and variables of the conceptual model
will be investigated according to their relevance and importance. This matter is twofold: the first
Stellenbosch University http://scholar.sun.ac.za

97
aim is to identify patterns with regard to the levels of the model where a change or improvement
should take place; the second intention proves or disproves the theoretical findings of the literature
review, with regard to the local supplier industry in the South African automotive value chain. To be
more precise, the latter means that concepts like follow sourcing or the isolation of local suppliers
to their home markets will be analysed.
5.4 SYNTHESIS
This chapter has summarised the bodies of theory that contribute to a solution for the research
problem. As stated earlier, it can be concluded that the existing theory does not offer a holistic
approach. Therefore, a conceptual model is designed that includes the different factors that
influence the economic sustainability of local automotive component suppliers. The conceptual
model is structured in system and governance levels in order to acknowledge the characteristics of
the factors. By adding the independent and dependent variables to the model a holistic approach
to the research problem is presented.
The next chapter will show how the conceptual model will be tested and validated and how the
factors of the conceptual model will be analysed according to their influences on the research
problem.
Stellenbosch University http://scholar.sun.ac.za
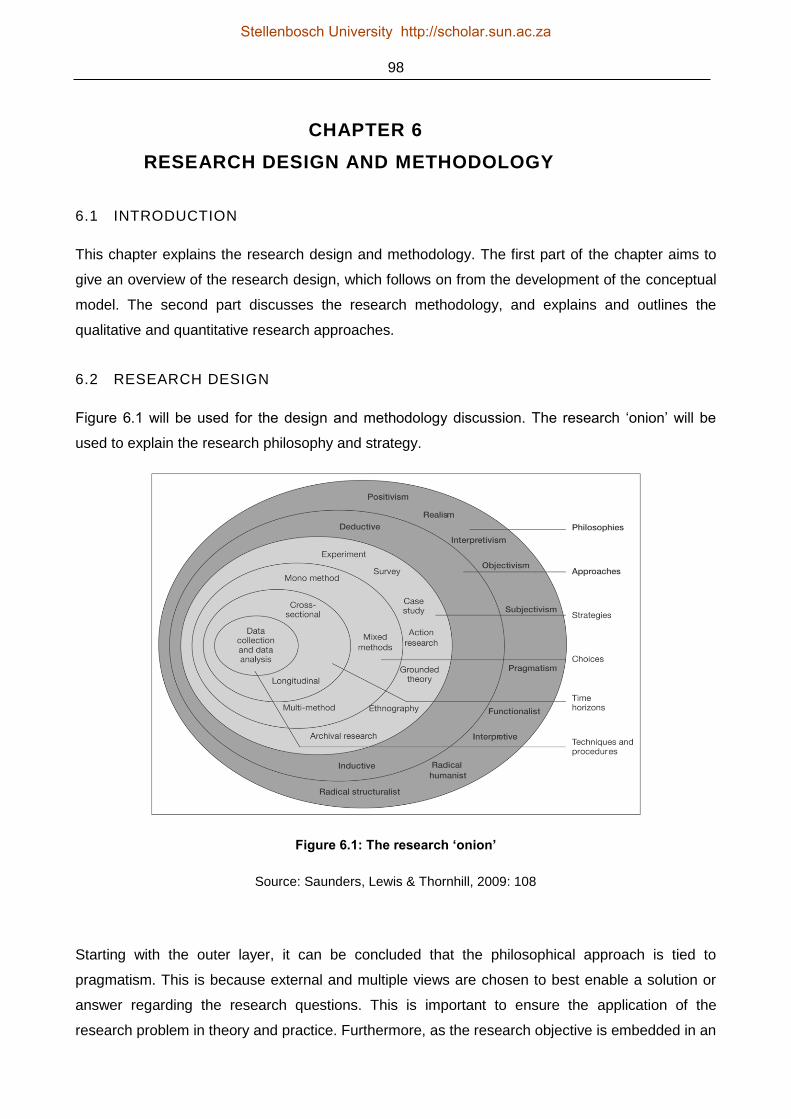
98
CHAPTER 6
RESEARCH DESIGN AND METHODOLOGY
6.1 INTRODUCTION
This chapter explains the research design and methodology. The first part of the chapter aims to
give an overview of the research design, which follows on from the development of the conceptual
model. The second part discusses the research methodology, and explains and outlines the
qualitative and quantitative research approaches.
6.2 RESEARCH DESIGN
Figure 6.1 will be used for the design and methodology discussion. The research „onion‟ will be
used to explain the research philosophy and strategy.
Figure 6.1: The research ‘onion’
Source: Saunders, Lewis & Thornhill, 2009: 108
Starting with the outer layer, it can be concluded that the philosophical approach is tied to
pragmatism. This is because external and multiple views are chosen to best enable a solution or
answer regarding the research questions. This is important to ensure the application of the
research problem in theory and practice. Furthermore, as the research objective is embedded in an
Stellenbosch University http://scholar.sun.ac.za
99
environment that is highly dynamic and a trendsetter, it has to be considered that observable
phenomena are as important as subjective meanings of the industry‟s stakeholders. To overcome
the dichotomy of the research, the focus is practical applied research and integrating different
perspectives to help interpret the data (Saunders et al., 2009: 119).
The foundation of the research is formed by a deductive approach. However, in order to take the
research stakeholder‟s view into account (in this case the automotive component supplier
industry), the design follows an inductive approach in the second phase (after the literature
review). This is needed to ensure that the views from this dynamic industry are considered in the
further course of the research. In the third phase the approach moves back to deduction, as it is
aims to test the conceptual model and to identify, reduce and generalise the factors that influence
the research problem. However, there is also an inductive influence in this phase, as not all of the
variables could be tested and evaluated regarding their influence on the research objective.
The specific outline of the research design and the other layers of the „research onion‟ will be
discussed in the next paragraphs. Subsequently, Section 6.3 (Research methodology) discusses
the choice and set-up of the methods used to investigate the problem.
The literature review and the conceptual model show that test data is needed to revise and
decompile the complexity of the research objective in order to make it applicable in theory and
practice. The complexity of the research problem also necessitates triangulating the design. Given
that theory discloses that the research question cannot be answered by a single application of a
particular body of knowledge, the need to approach the research problem from different angles
arises (Blumberg, Cooper & Schindler, 2008: 201). This leads to a need to combine an exploratory
and explanatory study – a two-stage design – to identify the factors that influence supplier
sustainability in the field of research. The exploratory part is used to clarify the understanding of
the research problem (Saunders et al., 2009: 139), whereas the explanatory part is used to explain
the relationships between the variables of the conceptual model (Saunders et al., 2009: 140).
This leads to a multiple-method choice for data collection (Saunders et al., 2009: 150). This
approach is advocated particularly for business and management research (Curran & Blackburn,
2001: 119). As discussed earlier, the mix of qualitative and quantitative approaches is executed in
a sequence to, firstly, revise the key issues and the conceptual model, and, secondly, to explain
the relationships of the research variables (Karami, Rowley & Analoui, 2006: 48). This also relates
to the pragmatic research approach, as it builds the opportunity to combine micro- and macro-
levels of the research, which is important for the research objective (Onwuegbuzie & Leech, 2005:
383).
Stellenbosch University http://scholar.sun.ac.za
100
6.3 RESEARCH METHODOLOGY
6.3.1 LITERATURE REVIEW
An extensive literature review is undertaken to investigate the scope and set a demarcation of the
field of research. Therefore, the research objectives are broken up in sub elements to allow for an
academic approach. The first sub element discusses current aspects of the worldwide automotive
value chain with special respect to the phenomenon of globalisation. Subsequently, the status of
South Africa‟s automotive industry is explained and linked to the global automotive value chain.
Additionally the literature review discusses the concept of value chains with special attention to the
upstream component value chain and also reviews the concept of global value chain governance.
Finally, the aspect of how local automotive suppliers in emerging markets can upgrade and
position themselves in the automotive value chain is discussed.
6.3.2 QUALITATIVE RESEARCH
6.3.2.1 VALIDATION DISCUSSIONS
As described in the research design, the research objective is embedded in an environment where
theory and practice are strongly related because of the high dynamics in the automotive industry,
not only in South Africa, but worldwide. This is emphasised by the fact that the South African
automotive OEMs and most of the component suppliers are either bound to a worldwide production
network or export cars and components to overseas markets.
Therefore, it is necessary to align the theoretical research objectives with industry needs, as well
as to ensure practical applications of the research findings. In order to facilitate the process of
alignment, two major automotive bodies are approached:
- The Automotive Industry Development Centre (AIDC)
- The National Association of Automotive Component and Allied Manufacturers (NAACAM).
These bodies (see AIDC, 2011 and NAACAM, 2011 for further information) are used to capture
and discuss the industry needs.
The validation discussions are set up with members of the Automotive Industry Development
Centre and National Association of Automotive Component and Allied Manufacturers and follow a
semi-structured approach. In the early phase of the research the discussion was aimed at
considering the South African automotive environment and the inherent differences to the
developed countries. The follow-up discussion was aimed at validating the findings from the
Stellenbosch University http://scholar.sun.ac.za

101
literature review and the conceptual model in order to prepare the further qualitative and
quantitative research.
As the abovementioned discussions are aimed at further qualifying the research strategy, design
and methodology, the findings are already incorporated in the overall concept. Therefore, the
findings of the discussion are not mentioned in particular in this section.
6.3.2.2 FOCUS GROUP AND INTERVIEWS
6.3.2.2.1 INTRODUCTION
The literature review concluded with a complex model with regard to the research objective. As the
complexity of the model derives from the number of independent variables on the different system
and governance levels, it was decided to align theory and practice. This alignment is implemented
by the use of a focus group and semi-structured interviews to discuss the complexity of the
conceptual model and validate the findings from the literature review. This alignment is the first
goal of the qualitative research methods. As a result, the conceptual model is adapted according to
the findings of the focus group and interviews.
The second target of the focus group and interviews is to capture the current state of the South
African automotive industry. This is done to identify main features and topics of the automotive
value chain in South Africa with particular emphasis on how they differ from those of developed
countries.
The findings of the focus group and interviews will be used to point out factors and issues with
regard to the research objectives.
6.3.2.2.2 SET-UP
The focus group was organised as follows:
- The location was Cape Town, the venue the Solution Workshop (see The Solution
Workshop, 2011 for further information)
- The aim was to gather four to eight participants
- The target audience was Chief Executive Officers (CEOs), Managing Directors (MDs),
senior managers from automotive firms (either OEMs or suppliers) and other value-/supply-
chain related professionals
- The focus group itself was a two-hour session
- An external moderator was used (Venetia Amato from Solution Workshop)
- The session was audio recorded and a transcript is available for analysis
Stellenbosch University http://scholar.sun.ac.za

102
The interviews were run with the following set-up:
- Location is the particular venue/office of the interview partner
- It is aimed to conduct 2-3 interviews
- The target audience are CEOs, MDs, Senior Managers from automotive firms (either OEMs
or suppliers) and other value-/supply-chain related professionals
- The semi-structured interviews itself will be a 1 hour session
- The interviews are moderated by the author of the research report
- The sessions were audio recorded and transcripts are available for analysis
6.3.2.2.3 AGENDA
The general agenda for the focus group and the interviews was as follows:
- Introduction
- General industry probe
- Trends in the industry
- Discussion about conceptual model
Levels/attributes
Factors (independent variables)
Measures for sustainability (dependent variables)
- Group/interview closure
The guideline for the focus group discussion and interviews is provided in Appendix A. The
discussion guide was primarily developed for the focus group discussion and was then used in the
interviews (with deviations according to the method of semi-structured interviews).
6.3.2.2.4 DATA COLLECTION
The focus group was held on 12 October 2010, 18h00, at The Solution Workshop, Cape Town.
There were four participants (after eight positive replies to the invitations had been received in
advance). The group consisted of two managing directors from automotive suppliers in the Cape
Town area; one managing director of a packaging business (and, therefore, in the supply- and
value-chain-related area) and an executive procurement and supply chain director of an
automotive OEM. The following statements to the data collection process of the focus group are
feedback from the moderator of the focus group:
Stellenbosch University http://scholar.sun.ac.za

103
- It can be stated that the respondents were well recruited and fitted the profile well.
- Their various backgrounds helped to contribute to diverse perceptions, and the level which
they operate on contributed well to the flow of the discussion.
- The group itself flowed really well. The discussion started on a general level and then
filtered down to more specifics. The majority of the discussion was around the proposed
conceptual model.
- Due to the technical nature of the topic, no metaphorical or projective techniques were
used.
- The format was that of open-ended questioning and in-depth probing.
The focus group was conducted in the suggested time frame of two hours. The results of the focus
group are captured in audio format and a transcript is available for the analysis.
The first semi-structured interview was conducted on 19 October 2010, 10h00, with a general
manager of an automotive supplier in the Cape Town area. The interview took place in the office of
the interview partner and the duration was one hour. The result of the interview is captured in audio
format and a transcript is available for analysis.
The second semi-structured interview was conducted on 20 October 2010 10h00 with a former
executive of Nissan SA, currently working as an independent consultant. The interview took place
in the office of the interview partner and the duration was one and a half hours. The result of the
interview is captured in audio format and a transcript is available for the analysis.
6.3.2.2.5 DATA ANALYSIS
The transcripts and notes of the qualitative research methods were used to analyse the data. The
analysis followed two different directions. The first direction aimed at the revision and validation of
the conceptual model. Therefore, the available data was screened for comments and
recommendations with regard to the proposed conceptual model.
The second direction of the analysis of the qualitative research methods aimed at the identification
of patterns with regard to issues in the South African automotive industry with special respect to
the component supplier industry. Therefore, overarching themes will be identified and aggregated
to patterns with regard to the research objective.
Stellenbosch University http://scholar.sun.ac.za

104
6.3.3 QUANTITATIVE RESEARCH
6.3.3.1 INTRODUCTION
Having explained the qualitative part of the research, this section discusses the quantitative
methods of the research. An empirical study is needed because of the partial availability of
secondary data due to the type of the unit of analysis. The unit of analysis are suppliers of
components for the automotive industry; they range from listed companies to private companies.
Additionally, there is a lack of primary data about the South African automotive value chain. These
facts necessitate collecting primary data across the research variables in order to ensure a valid
analysis.
6.3.3.2 SURVEY
The aim is to employ a firm-level survey to explore the impact of the factors in the proposed
conceptual model on local firms‟ competitiveness and upgrading (Morrison et al., 2008: 52). In
particular, the combination of variables at the macro- and meso-levels and the fact that the unit of
analysis is the company level make it indispensable to gather data in the field.
As there is also a lack of data about the automotive value chain in South Africa and theoretical
concepts do not explore the core question of improved sustainability of local suppliers in depth, the
aim was to formulate a field study among the component suppliers in the South African automotive
industry. The research need derives from three major points. The first one is that past and current
data about the South African automotive component supplier industry is only available for
operational measures. The second point is that secondary data is not available throughout the
industry, as the companies – which are the units of analysis – are not always listed. The third and
most significant point derives from the findings of the literature review and the conceptual model.
The complexity and layers of the conceptual model create a need to gather data which can be
used in order to create modelling data with regard to the research objectives. This data will give
insights about the structure of the value chain and reveal implications for the local supplier industry
in terms of competitive issues and economic sustainability.
Stellenbosch University http://scholar.sun.ac.za

105
6.3.3.3 SET-UP
The survey was carried out using the following design:
- Web-based questionnaire
- Duration approximately 20–30 minutes.
- Foundation is the conceptual model
- Influence of variables on the research objective will be tested
- Variables on the meso- and macro-levels have to be translated into the firm-level
perspective in order to gather the relevant data
- Unit of analysis is the single company
6.3.3.4 SAMPLING
The identification of the sample was done by a non-probability sampling technique, as the
population of the South African automotive suppliers can only be estimated due to the lack of a
comprehensive national list. Nevertheless, the National Association of Automotive Component and
Allied Manufacturers and the Automotive Industry Development Centre, which were approached in
order to align the research to practical issues, provided address databases.
In order to estimate the population size of the South African automotive supply industry the
Automotive Industry Development Centre database was used, as this list is based on latest market
data (see also http://www.autoindustry.co.za/SupplierSearch/SupplierSearch.aspx for further
information). This list has been data cleaned and shows a total number of 469 automotive
suppliers with a local presence in South Africa. This number includes component suppliers down to
the fourth tier level, as well as service providers to the automotive industry.
Due to the focus on the component supplier industry it was decided to make use of the database of
the supplier organisation NAACAM (National Association of Automotive Component and Allied
Manufacturers) in order to define a sample. Their members‟ database provides a sample with
respect to the component industry of the automotive supplier population in South Africa. After data
cleaning the list on a company level (so that regional production sites were excluded) and after
identifying the component suppliers, 114 automotive suppliers were identified to be included in the
sample. This results in a 24 per cent sample of the estimated total population of automotive
suppliers from the Automotive Industry Development Centre database (see above, 469 suppliers).
The fact that the sample is derived from an organisation from inside the South African automotive
supplier industry together with the focus on approaching the component industry makes it a
purposive homogeneous sample. The homogeneity is caused by the fact that it is specifically
Stellenbosch University http://scholar.sun.ac.za

106
designed to study the component industry of the South African automotive value chain as an
overarching research matter. Additionally it can be argued that this sample was chosen because
accessibility to the members of the National Association of Automotive Component and Allied
Manufacturers is high due to the ability to inform and contact them directly and indirectly through
their official body.
6.3.3.5 RESPONSE RATE
Due to the direct and indirect accessibility of the sample the expected response rate was 30 per
cent or higher. The endorsement of the National Association of Automotive Component and Allied
Manufacturers by its CEO and the direct mailing of the survey invitations to the sample entities
suggest that the targeted response rate was achievable. In addition to the accessibility it can be
stated that the awareness of a survey in the sample could be increased through impact
presentations at an annual conference of the National Association of Automotive Component and
Allied Manufacturers organisation and the participation of the author in regional meetings of the
National Association of Automotive Component and Allied Manufacturers.
The response rate for the survey can be calculated as shown in Table 6.1.
Table 6.1: Survey response rate
Number of component suppliers in NAACAM database (sample) 114
Responses usable
(not ended, but more than 50 per cent of questions answered)
53
Responses ended (finished entire questionnaire) 38
Response rate for „responses usable‟ 46%
Response rate for „responses ended‟ 33%
Additionally, the following calculations can be made. By taking the component suppliers of the
National Association of Automotive Component and Allied Manufacturers‟ database and putting
them in relation to the estimated population size of South African automotive suppliers, it can be
assessed that 24 per cent of the population is included in the sample. It can also be estimated that
three out of four suppliers are component suppliers (this is the proportion of the National
Association of Automotive Component and Allied Manufacturers‟ database) and, therefore, 347
Stellenbosch University http://scholar.sun.ac.za

107
suppliers out of the estimated population are component manufacturers. The response rate
decreases to 15 per cent when comparing the usable responses to the estimated population size.
6.3.3.6 QUESTIONNAIRE
6.3.3.6.1 INTRODUCTION
This section discusses the questionnaire that relates to the field study. The design of the
questionnaire is shown and the variables from the conceptual model are related to the questions in
the questionnaire.
6.3.3.6.2 DESIGN
The questionnaire follows a self-administered and internet-mediated design. This is done with the
aid of a survey-software called Checkbox.
The questionnaire starts with a cover letter in which the intentions, requirements and contact
information are given. The questionnaire includes 46 questions. The types of questions range from
rating, quantity and qualitative.
The data points used in the questionnaire relate to 2009 – if not otherwise stated. This is because
the primary research was undertaken in the course of 2010 and early 2011 so that the latest official
data available were 2009 data. Although 2009 fell within the worldwide financial crisis it is
nevertheless believed that the mechanisms between the factors and measures of sustainability
remain the same.
A testing of the survey was done in preparation for carrying out the questionnaire to the potential
respondents. This pilot showed satisfactory results, although the time required to complete it, was
a concern of the pilot respondents. Therefore, answer bands for the numerical questions were
brought into the questionnaire for ease of use and to make the responses with respect to the
financial data more anonymous.
The full questionnaire is provided in Appendix B.
Stellenbosch University http://scholar.sun.ac.za
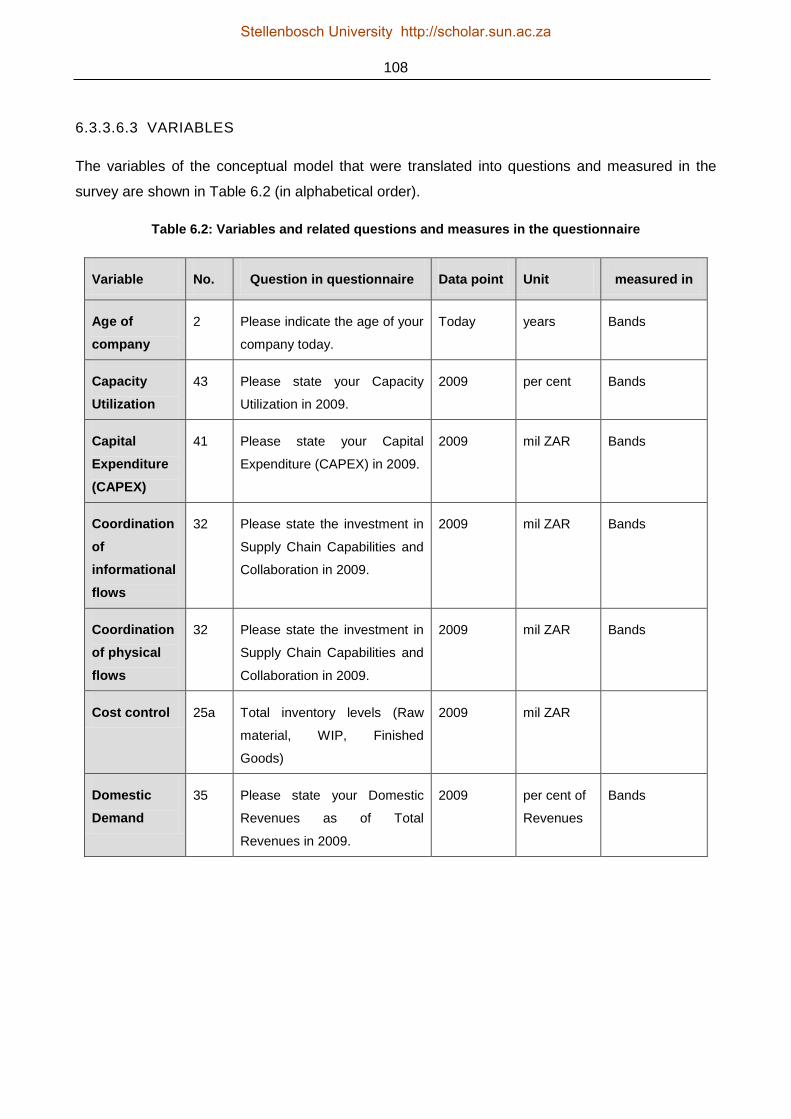
108
6.3.3.6.3 VARIABLES
The variables of the conceptual model that were translated into questions and measured in the
survey are shown in Table 6.2 (in alphabetical order).
Table 6.2: Variables and related questions and measures in the questionnaire
Variable No. Question in questionnaire Data point Unit measured in
Age of
company
2 Please indicate the age of your
company today.
Today years Bands
Capacity
Utilization
43 Please state your Capacity
Utilization in 2009.
2009 per cent Bands
Capital
Expenditure
(CAPEX)
41 Please state your Capital
Expenditure (CAPEX) in 2009.
2009 mil ZAR Bands
Coordination
of
informational
flows
32 Please state the investment in
Supply Chain Capabilities and
Collaboration in 2009.
2009 mil ZAR Bands
Coordination
of physical
flows
32 Please state the investment in
Supply Chain Capabilities and
Collaboration in 2009.
2009 mil ZAR Bands
Cost control 25a Total inventory levels (Raw
material, WIP, Finished
Goods)
2009 mil ZAR
Domestic
Demand
35 Please state your Domestic
Revenues as of Total
Revenues in 2009.
2009 per cent of
Revenues
Bands
Stellenbosch University http://scholar.sun.ac.za

109
Variable No. Question in questionnaire Data point Unit measured in
Equity
ownership
3 Please indicate the type of
ownership of your company.
Today categories Internationally
owned/
Joint Venture/
Locally owned/
Locally owned
using
international
license
Firms in
competition
20 Please state the number of
competitors in your market.
Today number Bands
Foreign
direct
investment
(FDI)
4 If internationally tied please
indicate the FDI (Foreign
Direct Investment) in the last 5
years.
2007-2011 mil ZAR Bands
HR
development
38 Please state your HR-Training
expenditures as of Total
Revenues in 2009.
2009 per cent of
Revenues
Bands
Infrastructure 7,8,
9,10,
11
How would you rate the South
African Road-Infrastructure
compared to the developed
markets (e.g. Europe, US)?
Today Lickert 7 inferior/
comparable/
superior
Labour cost 12 How would you rate the South
African labour cost including all
influences compared to the
developed markets (e.g.
Europe, USA)?
Today Lickert 7 inferior/
comparable/
superior
Labour
flexibility
6a,b Please state the percentages
of the following categories of
your employees in 2009 -
Temporarily/Broker workers
2009 per cent of
Total
Employees
Local
Content
23 Local content of TOP-product Today per cent of
Product
cost
Stellenbosch University http://scholar.sun.ac.za
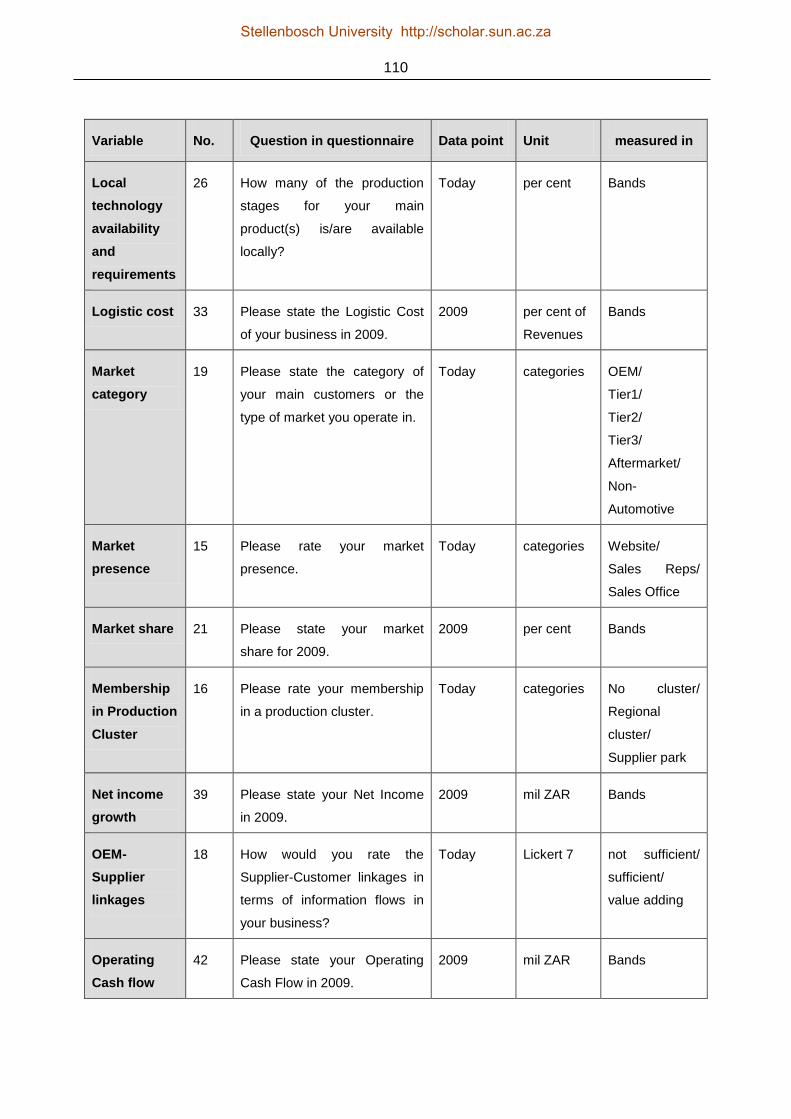
110
Variable No. Question in questionnaire Data point Unit measured in
Local
technology
availability
and
requirements
26 How many of the production
stages for your main
product(s) is/are available
locally?
Today per cent Bands
Logistic cost 33 Please state the Logistic Cost
of your business in 2009.
2009 per cent of
Revenues
Bands
Market
category
19 Please state the category of
your main customers or the
type of market you operate in.
Today categories OEM/
Tier1/
Tier2/
Tier3/
Aftermarket/
Non-
Automotive
Market
presence
15 Please rate your market
presence.
Today categories Website/
Sales Reps/
Sales Office
Market share 21 Please state your market
share for 2009.
2009 per cent Bands
Membership
in Production
Cluster
16 Please rate your membership
in a production cluster.
Today categories No cluster/
Regional
cluster/
Supplier park
Net income
growth
39 Please state your Net Income
in 2009.
2009 mil ZAR Bands
OEM-
Supplier
linkages
18 How would you rate the
Supplier-Customer linkages in
terms of information flows in
your business?
Today Lickert 7 not sufficient/
sufficient/
value adding
Operating
Cash flow
42 Please state your Operating
Cash Flow in 2009.
2009 mil ZAR Bands
Stellenbosch University http://scholar.sun.ac.za

111
Variable No. Question in questionnaire Data point Unit measured in
Position in
Value Chain
19 Please state the category of
your main customers or the
type of market you operate in.
Today categories OEM/
Tier1/
Tier2/
Tier3/
Aftermarket/
Non-
Automotive
Product
Category
22 Please categorize your TOP-
product.
Today categories Powertrain/
Electrics &
Electronics/
Interior/
Exterior/
Chassis/
Raw material
Product
complexity
23e Standardization category of
TOP-Product
Today Lickert 7 Standard/
Customized/
Special
Product
Modularity
23d Classification of TOP-Product Today categories Component/
Module/
System
Product/
Process-
Innovation
37 Please state your R&D
expenditures as of Total
Revenues in 2009.
2009 per cent of
Revenues
Bands
Proximity to
Customer
17 Please rate the impact of your
geographical distance to
current & potential customers
on your business success.
Today Lickert 3 no impact/
medium/
high
Quality 25b Customer return rates (0 km) 2009 ppm
Raw Material
Content
23b Raw-material content of TOP-
Product
Today per cent of
Product
cost
Stellenbosch University http://scholar.sun.ac.za
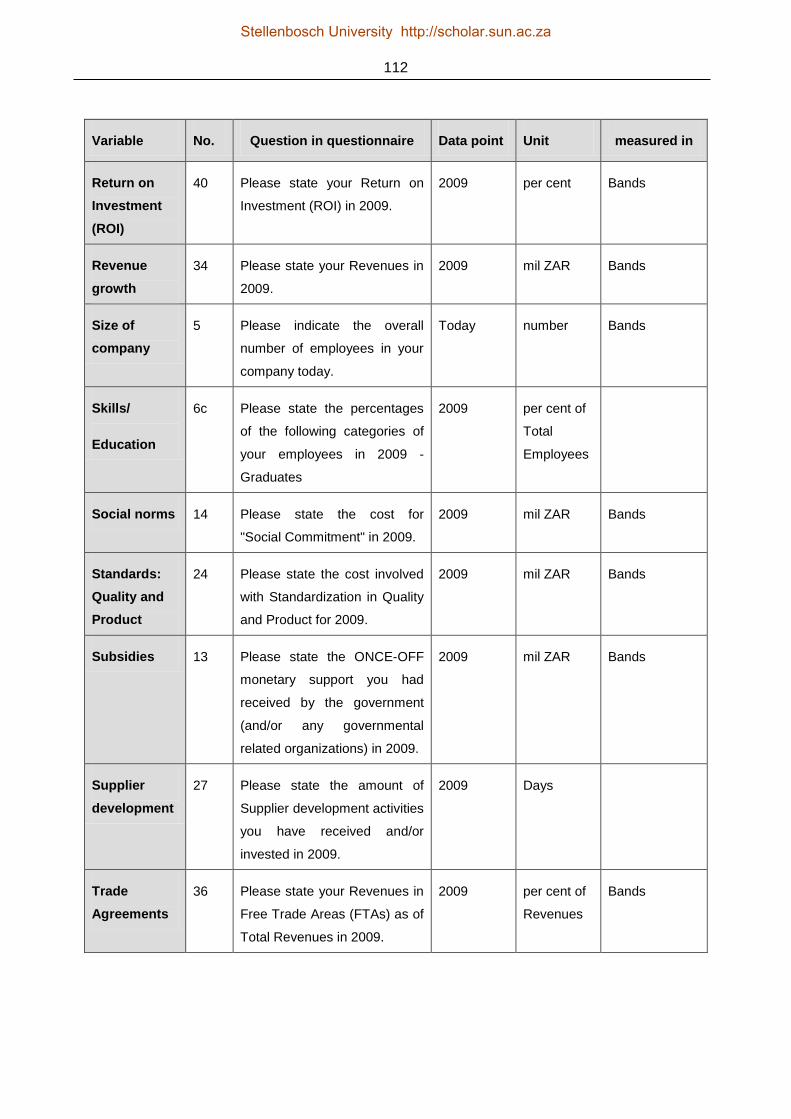
112
Variable No. Question in questionnaire Data point Unit measured in
Return on
Investment
(ROI)
40 Please state your Return on
Investment (ROI) in 2009.
2009 per cent Bands
Revenue
growth
34 Please state your Revenues in
2009.
2009 mil ZAR Bands
Size of
company
5 Please indicate the overall
number of employees in your
company today.
Today number Bands
Skills/
Education
6c Please state the percentages
of the following categories of
your employees in 2009 -
Graduates
2009 per cent of
Total
Employees
Social norms 14 Please state the cost for
"Social Commitment" in 2009.
2009 mil ZAR Bands
Standards:
Quality and
Product
24 Please state the cost involved
with Standardization in Quality
and Product for 2009.
2009 mil ZAR Bands
Subsidies 13 Please state the ONCE-OFF
monetary support you had
received by the government
(and/or any governmental
related organizations) in 2009.
2009 mil ZAR Bands
Supplier
development
27 Please state the amount of
Supplier development activities
you have received and/or
invested in 2009.
2009 Days
Trade
Agreements
36 Please state your Revenues in
Free Trade Areas (FTAs) as of
Total Revenues in 2009.
2009 per cent of
Revenues
Bands
Stellenbosch University http://scholar.sun.ac.za

113
Variable No. Question in questionnaire Data point Unit measured in
Type of Value
Chain
Governance
28 Please indicate the type of
governance you experience in
the value chain you are
involved in.
Today categories Market/
Modular/
Relational/
Captive
Upgrading
(Functional,
Horizontal/Ve
rtical)
29,
30
Please state the number of
Horizontal Upgrades in the
Value Chain your company
has done in the last three (3)
years.
2009-2011 Number of
upgrades
Bands
Value Chain
Flexibility
25c,d Lead times to customer from
production (domestic and
international)
2009 days
Value Chain
Reliability
25e On time delivery 2009 per cent
6.3.3.7 DATA COLLECTION
The chosen medium for the field study was a web-based survey. The online software used is a
comprehensive tool that can administer the development of the questionnaire, management of the
address database and the controlling of responses and results (for further information, see Prezza
Technologies Inc., 2011). Due to the fact that confidential data (financial figures, etc.) were
collected, the responses were fully anonymous and the results could only be accessed by the
author.
The data collection was conducted from mid-November 2010 to mid-February 2011. Beforehand
presentations were given at a conference of the National Association of Automotive Component
and Allied Manufacturers in Durban and at four regional meetings of the National Association of
Automotive Component and Allied Manufacturers (Western Cape, Gauteng, East London and Port
Elizabeth). This was done to explain the impact of the study and to initiate a higher response rate.
The first run of the survey in November/December 2010 led to a low response rate of 8 per cent.
Consequently, the survey was repeated in January/February 2011. Already captured results could
still be used and the response rate increased to 25 per cent. In order to further improve the
Stellenbosch University http://scholar.sun.ac.za

114
response rate a telephone campaign was conducted in mid-February 2011, which helped increase
the response rate to 46 per cent.
6.3.3.8 DATA ANALYSIS
The collected data were analysed with descriptive and inferential statistics. The descriptive
statistics were used to build up a picture of the South African automotive component supplier
industry. Therefore, the descriptive statistics for each independent and dependent variable were
described. To further analyse the differences and specifics of the supplier landscape group
comparisons were made. The following groups were chosen for this analysis:
- Ownership: Internationally vs. locally owned suppliers
- Product category: Interior, exterior, chassis, electric/electronics, powertrain, raw material
- Position in value chain and type of market: Tier 1 supplier, Tier 2 supplier, Tier 3+ supplier,
aftermarket supplier
The inferential statistics were used to extract dependencies between the independent and
dependent variables. Each independent variable was tested for correlation to the dependent
variables. Therefore, the Spearman‟s rank correlation coefficient was used to analyse the ordinal
data, and ANOVA (analysis of variance) statistics were used to test the categorical data.
It must be added that the generalisation of the data is a limitation of the study. As the sample is
purposive, homogeneous generalisations as to the total South African automotive supplier industry
cannot be made per se. Despite that, the findings section uses the wording, as it would be possible
to refer to the total population of component suppliers in South Africa.
Stellenbosch University http://scholar.sun.ac.za

115
6.4 SYNTHESIS
In conclusion, the research design shows two interesting features. The first is that the conceptual
model and the focus group/interviews inform each other. As explained earlier, this approach was
chosen because the conceptual model is viewed as a proposal from the theoretical point of view. In
order to align this theoretical view with practical applications the focus group and interviews were
used to achieve this objective. In other words, the conceptual model is used as a base for the
discussion in the qualitative research to examine the factors for sustainability, issues and strengths
in the South African automotive supply chain. The second feature is the twofold design, whereby
the data gathering was performed using two different approaches: a qualitative aspect, which was
supplied by the focus group, interviews and qualitative questions from the survey, and a
quantitative aspect, where the data was gathered through the survey. Figure 6.2 shows an overall
view of the research design and methodology with these two distinctive features.
Figure 6.2: Research design and methodology
Stellenbosch University http://scholar.sun.ac.za
116
CHAPTER 7
FINDINGS
7.1 INTRODUCTION
The quantitative and qualitative data of the survey are analysed according to the concepts and
variables used in the conceptual model. Therefore, the variables and the overarching levels of the
conceptual model are related to patterns. These patterns are identified to reduce the complexity of
the conceptual model in order to show the most relevant findings of the quantitative data in a
structured way. Alternatively, it can be stated that the patterns are used to assign attributes to the
research variables in order to be able to conceptualise the findings of the research.
The patterns used in the research are the following:
- Industrial policy, which can be related to a nation‟s plan to officially and strategically
influence sectoral development and therefore a specific industry portfolio.
- Infrastructure/logistics: Refers to the physical and organisational structures of the country to
support the operations of an industry or enterprise. As logistics cost are directly dependent
on the geographical location of the country and the efficient use of the country‟s
infrastructure, the independent variable logistics cost is located on the macro level in this
case. This means that logistics cost are not viewed as the effective and efficient use of the
available infrastructure which would result in the fact that logistics cost are located on the
micro level.
- Domestic market: This is tied to the single market in the particular country and shows the
specifics of that market.
- International market: Relates to globalisation and views the influences of trade, investment
and technology under the integrations of national economies.
- Labour market: Describes the interactions between workers and employers, and the
resulting patterns of wages, employment and income.
- Value chain: Relates to the activities of a firm operating in a specific industry or the various
processes of an industry in order to produce goods or services.
- Supply chain: Describes the system and its activities of producing and moving a product
from supplier to customer.
- Internal value chain: Is used to describe the activities on a firm level in the context of the
research.
- Company characteristics: Accommodates the control variables of the research and is used
to describe the units of analysis.
Stellenbosch University http://scholar.sun.ac.za
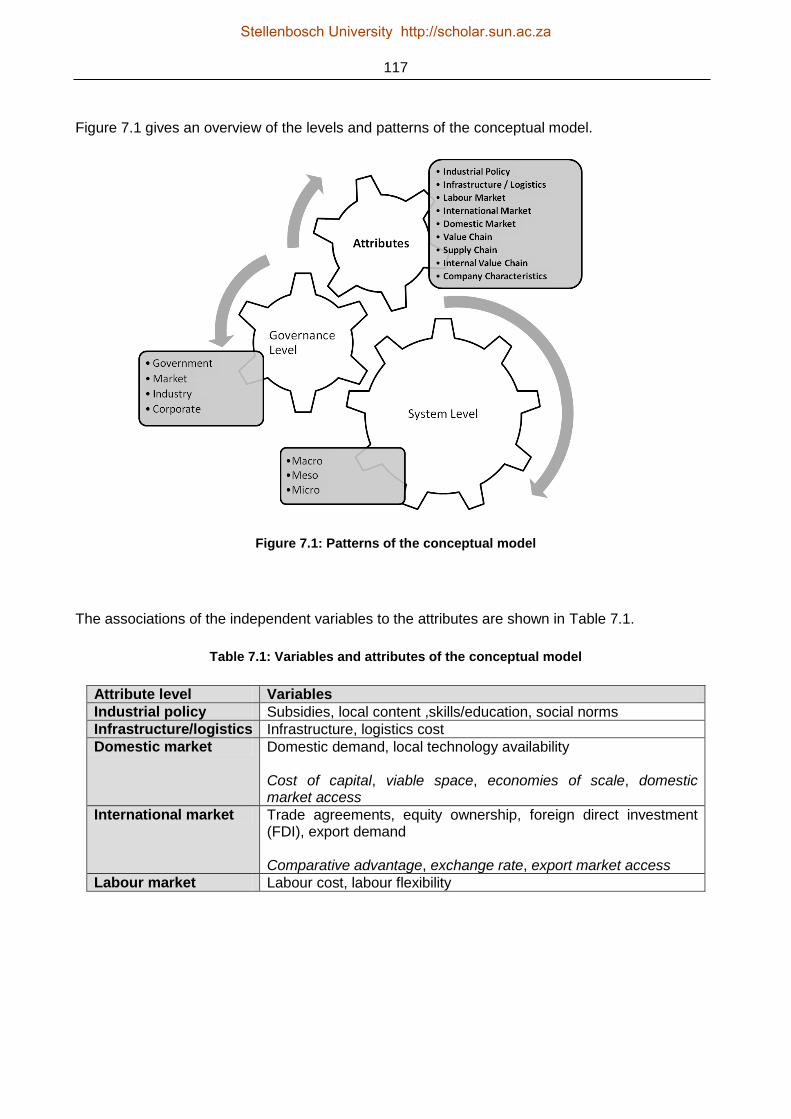
117
Figure 7.1 gives an overview of the levels and patterns of the conceptual model.
Figure 7.1: Patterns of the conceptual model
The associations of the independent variables to the attributes are shown in Table 7.1.
Table 7.1: Variables and attributes of the conceptual model
Attribute level Variables
Industrial policy Subsidies, local content ,skills/education, social norms
Infrastructure/logistics Infrastructure, logistics cost
Domestic market Domestic demand, local technology availability Cost of capital, viable space, economies of scale, domestic market access
International market Trade agreements, equity ownership, foreign direct investment (FDI), export demand Comparative advantage, exchange rate, export market access
Labour market Labour cost, labour flexibility
Stellenbosch University http://scholar.sun.ac.za

118
Attribute level Variables
Value chain Coordination of informational flows, firms in competition, market share, OEM-supplier linkages, product complexity, product modularity, standards: quality and product, type of value chain, governance, upgrading (horizontal/vertical), market category, market presence, membership in production cluster, position in value chain, product category, product/process-innovation, proximity to customer Product cycle, control over supply chain, cost of coordination, efficiency of value chain, opportunities for modularisation, powershifts in the value chain, separability of ownership, value transfer
Supply chain Coordination of physical flows, supplier development, raw material content
Internal value chain Capacity utilisation, cost control, quality, value chain reliability, value chain flexibility Productivity, value add, competitive advantage
Company characteristics
Age of company, size of company, HR development
7.2 FOCUS GROUP
7.2.1 INTRODUCTION
The analysis of the focus group discussions gives input into the conceptual model and the survey
as to issues in the South African automotive industry. The analysis, therefore, states findings to
topics that are related to the variables of the conceptual model as well as key themes that are
relevant for the South African automotive industry. According to Krueger and Casey (2009: 125),
this approach follows the constant comparative framework. This framework is used to identify key
themes and patterns in qualitative data.
7.2.2 CONCEPTUAL MODEL
The discussion about the conceptual model started with the dependent variables and was followed
by the independent variables. The independent variables were discussed in the order of macro-,
meso- and micro-level variables. The focus group confirmed the dependent variables of the
conceptual model.
A focal point of the discussion was the governmental issues that impact on the economic
sustainability model that was proposed for the automotive industry in South Africa. With respect to
this unique feature and the relating independent variables on the macro-level, the focus group
came to the conclusion that industrial policy is a generic term for the variables subsidies, local
Stellenbosch University http://scholar.sun.ac.za

119
content and trade agreements. This finding is considered in the conceptual model insofar as the
measured variables are subsidies in terms of monetary subsidies received, local content for the
top-product and revenues in areas with trade agreements. In the following discussion the term
„industrial policy‟ is used explicitly for subsidies. The focus group furthermore concluded that the
term „social norms‟ should not only include topics like BEE and HIV/AIDS, but also the skill level
available in South Africa as well as the cultural characteristics of the country. The skill level is
considered by the percentage of graduates in the company in the model; the cultural topic was not
been measured due to the limitations of the survey and the study. All other variables on the macro-
level were confirmed in the discussion.
The findings on the meso-level are clustered in market issues and industry issues. On the market
level the focus group discussed the impact of the diffusion of the local market by imports of
international OEMs that are not located in South Africa. Examples of these kinds of OEMs are
companies like Hyundai, Kia and Tata. The fact that these OEMs are entering the South African
domestic market with entry-level products makes it difficult for South African OEMs and for
automotive component suppliers to retain their domestic market share. This issue can be seen as
an actual threat for the entire domestic automotive industry, but can only be measured by the
number of imports to the South African domestic market. Therefore, this issue is considered in the
theoretical part about the South African automotive industry and the conceptual model, but is not
added to the survey. An indirect acknowledgement of the import issue is given by the
measurement of domestic demand in the form of domestic revenues of the South African
automotive component suppliers. Another discussion on the market-level topics debated the
availability of technology in South Africa. The focus group participants stated that the technological
capabilities are directly dependent on a partnership with firms from the developed countries. Two
measures to accommodate this issue are integrated in the conceptual model as well as in the
survey. The first is foreign direct investment inflow by company; the second measures the number
of production stages that are available locally.
The focus group discussed three issues with regard to industry measures on the meso-level. The
first relates to the number of vehicle models in the market and to the fact that the automotive value
chain can be regarded as a buyer market which mainly relies on the sophistication of the market.
Therefore, economies of scale play an important role in the value chain system. This finding is
considered in the model as well as in the conceptual model. On the one hand, the type of value
chain governance is measured and on the other hand a ratio of the number of products and the
total production volume is calculated. The next issue relates to production flexibility and was
discussed in terms of the labour market. The participants stated that the availability of workers
through labour brokers increases the flexibility to react to variations in demand. This finding is
Stellenbosch University http://scholar.sun.ac.za
120
considered in the conceptual model and in the survey by measuring the percentage of labour
broker workers and temporary workers as a percentage of the total workforce. The next issue that
came up in the focus group discussion was the fact that component suppliers need information
about demand in the value chain. This finding is considered under the concept of supply chain
collaboration and supply chain development, and is accounted for in the conceptual model and
measured by the investment in supply chain activities and the supplier development activities in the
survey.
7.2.3 ISSUES
This section discusses the issues with regard to the South African automotive industry that were
found in the focus group discussion. The major issues discussed in the focus group are associated
with the macro-level and concern the influences of local government.
The first issue relates to the labour market. Participants criticized the inflexible labour market while
operating within highly volatile in- and output markets. The focus group participants stated that
especially the recent strike and salary increases make it difficult to operate in the international
automotive value chain. An additional factor is labour legislation with the inherent minimum wages
while the state wants to overcome the challenge of high percentages of unemployment.
The second issue which can be indirectly related to the first deals with HIV/AIDS, skills and BEE.
The participants stated that the topic HIV/AIDS influences their productivity because especially in
labour-intensive sectors the companies have to employ and train alternative employees. The
participants also commented on the skills development agencies (SETA, the Skills and Education
Training Authorities) because it seems difficult to deal with the authorities in terms of reliability.
Another topic in this regard is BEE, which enables preferred procurement but is also required by
the customers in the automotive value chain. One of the participants viewed BEE and the
associated costs as marketing expenses because the customer wants it.
With regard to infrastructure the focus group concludes that one of the major disadvantages in
South Africa is the rail network. Due to the fact that the rail system is not reliable or non-existent
the logistics and transport have to be handled via road which impacts on the logistics cost
structure. The other factor with regard to infrastructure is seen in the high port costs. As South
Africa is located far away from the major export markets these two factors have a negative impact
on the cost structure of the automotive component suppliers.
Because of the dependence of component manufacturers on export contracts the exchange rate
with the major currencies is a significant factor. As the export contracts are mostly dealt in foreign
Stellenbosch University http://scholar.sun.ac.za

121
currencies and most of the inputs are factored in ZAR, the volatility of the rand, and especially the
strength of the ZAR to the US dollar and the euro, impacts on the profitability of the suppliers.
Related to the former issue is the fact that the domestic market is too small to be viable on its own.
The automotive industry relies on export programmes, and the OEMs in particular are incorporated
into the production networks of their parent companies. The small domestic market also makes it
difficult to localise production (and therefore technology), as the volumes in the domestic market
are limited.
Additionally, it can be found that the locally owned suppliers seem not to be capable of developing
components themselves, as access to design information from the lead firms is restricted and is
tied to supply relationships. Furthermore, each of the OEMs requires different quality and
environmental standards, which the component suppliers have to comply with.
7.2.4 SYNTHESIS
As stated in the conclusion to the previous section, the focus group and interview results are used
to inform the conceptual model about specifics in the South African automotive industry. The
findings are already incorporated in the conceptual model in order to avoid confusion, but are
repeated in short in the following:
- Exchange rate – the exchange needs to incorporated as the automotive industry in South
Africa is dependent on export business
- Skills/education – this factor is a specific to South Africa and relates to the skill level
available in the country
- Labour flexibility – as flexibility in terms of production is a strength of the South African
automotive industry, the availability of flexible labour needs to be assessed
- Supplier development – this issue arises as local suppliers must be able to compete
globally
- HR development – this factor relates to the skill and education issue from above
Stellenbosch University http://scholar.sun.ac.za
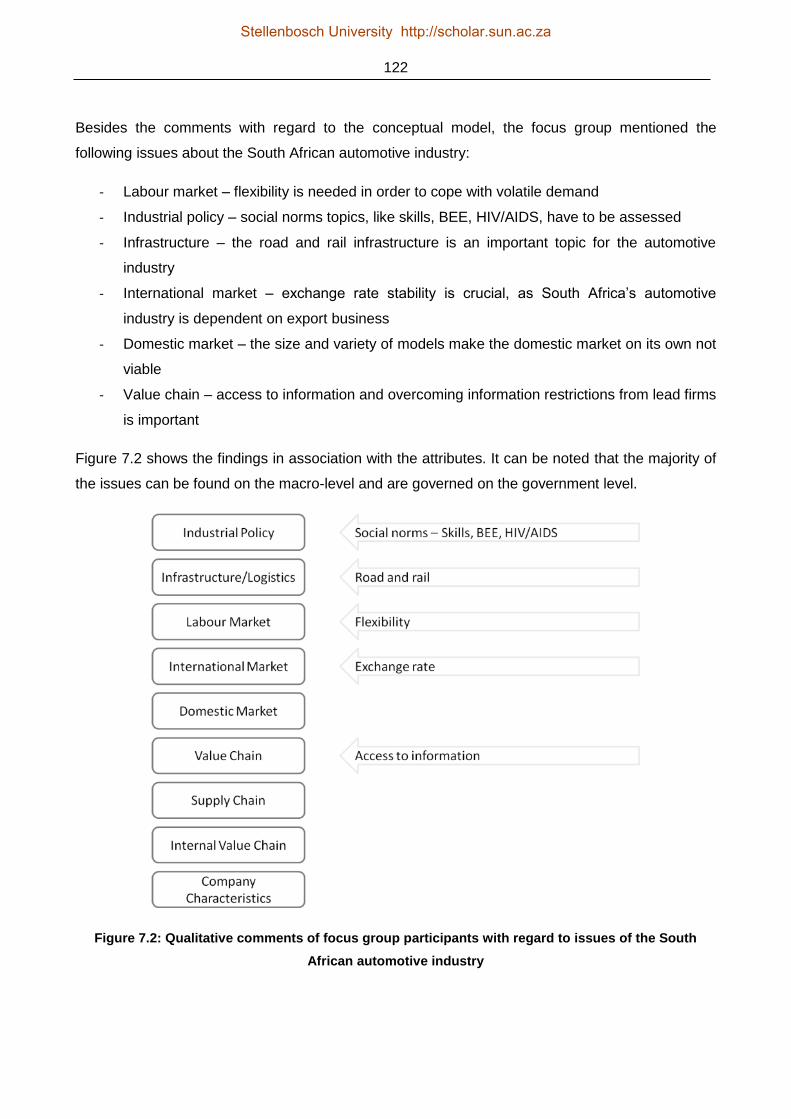
122
Besides the comments with regard to the conceptual model, the focus group mentioned the
following issues about the South African automotive industry:
- Labour market – flexibility is needed in order to cope with volatile demand
- Industrial policy – social norms topics, like skills, BEE, HIV/AIDS, have to be assessed
- Infrastructure – the road and rail infrastructure is an important topic for the automotive
industry
- International market – exchange rate stability is crucial, as South Africa‟s automotive
industry is dependent on export business
- Domestic market – the size and variety of models make the domestic market on its own not
viable
- Value chain – access to information and overcoming information restrictions from lead firms
is important
Figure 7.2 shows the findings in association with the attributes. It can be noted that the majority of
the issues can be found on the macro-level and are governed on the government level.
Figure 7.2: Qualitative comments of focus group participants with regard to issues of the South
African automotive industry
Stellenbosch University http://scholar.sun.ac.za
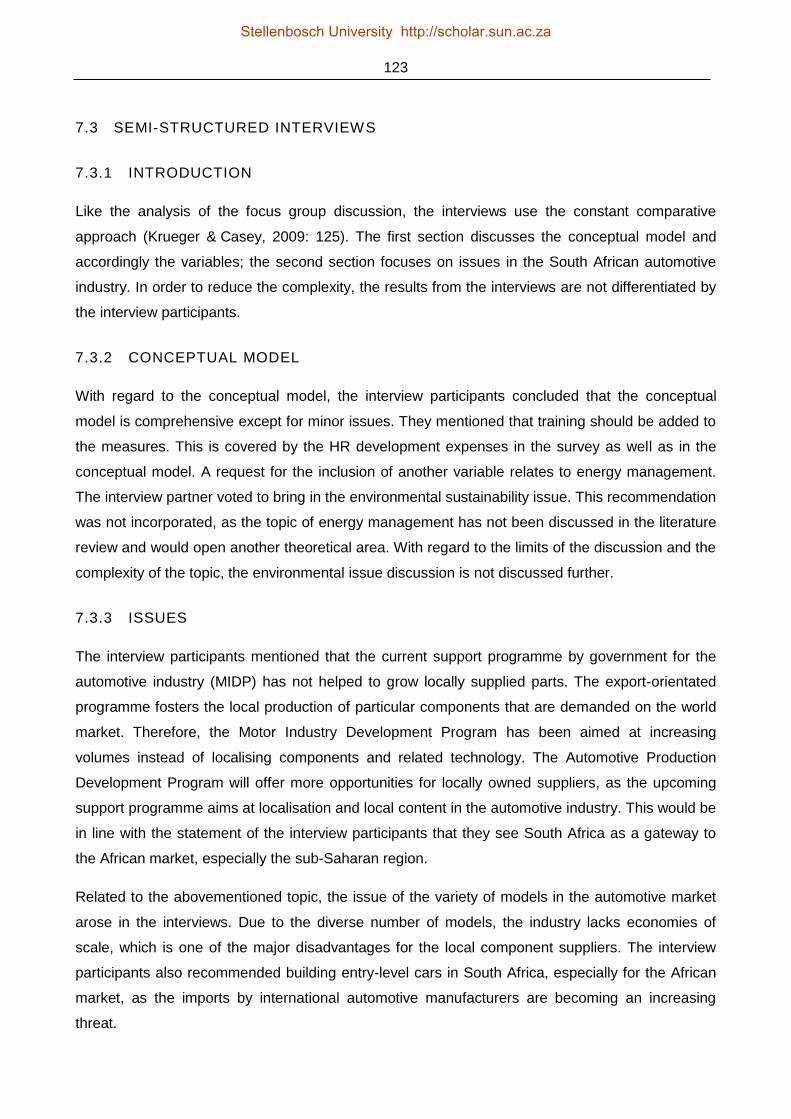
123
7.3 SEMI-STRUCTURED INTERVIEWS
7.3.1 INTRODUCTION
Like the analysis of the focus group discussion, the interviews use the constant comparative
approach (Krueger & Casey, 2009: 125). The first section discusses the conceptual model and
accordingly the variables; the second section focuses on issues in the South African automotive
industry. In order to reduce the complexity, the results from the interviews are not differentiated by
the interview participants.
7.3.2 CONCEPTUAL MODEL
With regard to the conceptual model, the interview participants concluded that the conceptual
model is comprehensive except for minor issues. They mentioned that training should be added to
the measures. This is covered by the HR development expenses in the survey as well as in the
conceptual model. A request for the inclusion of another variable relates to energy management.
The interview partner voted to bring in the environmental sustainability issue. This recommendation
was not incorporated, as the topic of energy management has not been discussed in the literature
review and would open another theoretical area. With regard to the limits of the discussion and the
complexity of the topic, the environmental issue discussion is not discussed further.
7.3.3 ISSUES
The interview participants mentioned that the current support programme by government for the
automotive industry (MIDP) has not helped to grow locally supplied parts. The export-orientated
programme fosters the local production of particular components that are demanded on the world
market. Therefore, the Motor Industry Development Program has been aimed at increasing
volumes instead of localising components and related technology. The Automotive Production
Development Program will offer more opportunities for locally owned suppliers, as the upcoming
support programme aims at localisation and local content in the automotive industry. This would be
in line with the statement of the interview participants that they see South Africa as a gateway to
the African market, especially the sub-Saharan region.
Related to the abovementioned topic, the issue of the variety of models in the automotive market
arose in the interviews. Due to the diverse number of models, the industry lacks economies of
scale, which is one of the major disadvantages for the local component suppliers. The interview
participants also recommended building entry-level cars in South Africa, especially for the African
market, as the imports by international automotive manufacturers are becoming an increasing
threat.
Stellenbosch University http://scholar.sun.ac.za

124
The interview participants mentioned issues with labour legislation and labour flexibility. This
matter repeats the comments from the focus group discussion. An interesting statement from the
interview participants is that it can be noted that productivity is going up faster than employment.
This suggests a diffusion of automation and manual labour taking place in the South African
automotive industry.
Another topic which is mentioned in the focus group already is the currency exchange rate. One
interview participant was not as concerned about the exchange rate as the focus group members
because his company has a balanced import and export ratio. This enables the company to
compensate fluctuations in the exchange rate.
The infrastructure was criticised by the interview participants like the focus group members. They
mentioned that the rail system is dysfunctional and the road system is falling apart due to
depletion. Another infrastructural factor mentioned by the interview participants is the unreliable
energy supply, which they said is a challenge for the South African automotive industry.
The last issue mentioned by the interview participants was access to technology, and production
and information networks of the globalised players in the automotive industry. Despite the need for
these issues, the South African automotive industry is able to produce vehicles and components to
the highest quality levels.
7.3.4 SYNTHESIS
As stated in the conclusion to the previous section, the focus group and interview results are used
to inform the conceptual model about specifics in the South African automotive industry. The
findings are already incorporated in the conceptual model in order to avoid confusion, but are
repeated in short in the following:
- Cost of capital – this factor needs to be added, as upgrading in the value chain is related to
investment.
The interview partners mentioned next to the comments with regard to the conceptual model the
following issues about the South African automotive industry:
- Industrial policy – the Automotive Production Development Program is needed for the
localisation of business
- Domestic market – economies of scale are needed, which can be accomplished by a
smaller range of vehicle models
- Labour market – labour legislation and flexibility are important issues for the sustainability
of the South African automotive industry
Stellenbosch University http://scholar.sun.ac.za
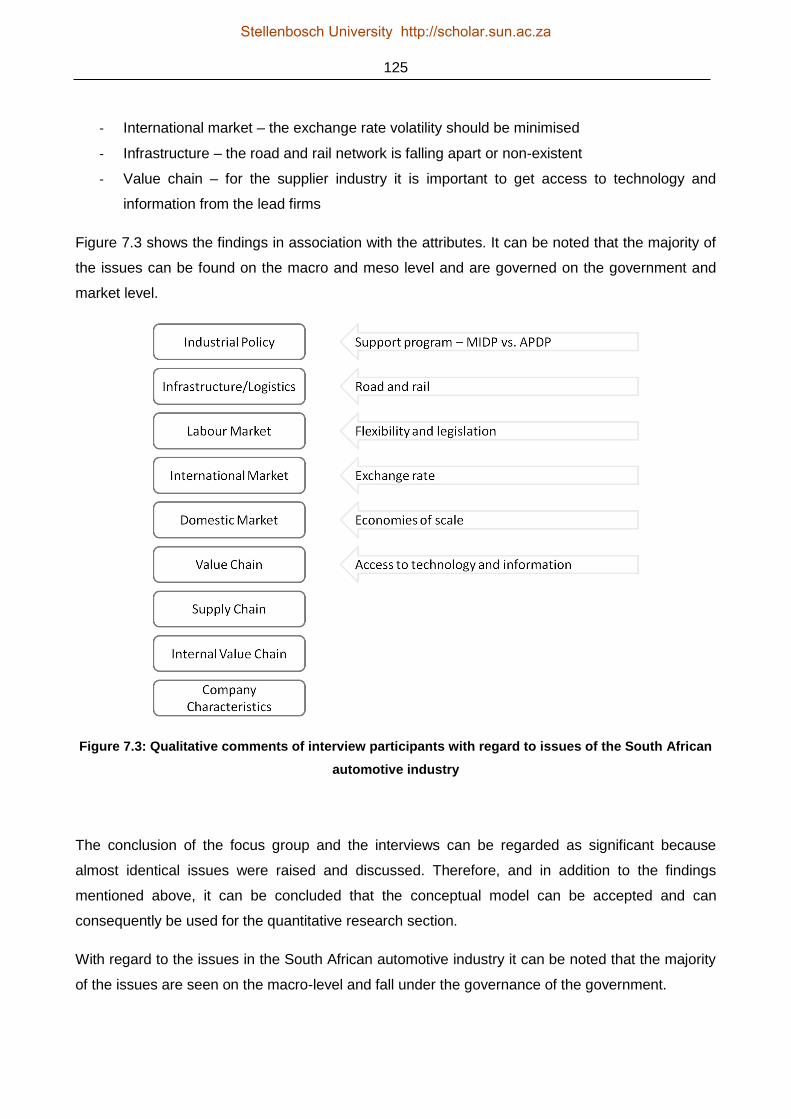
125
- International market – the exchange rate volatility should be minimised
- Infrastructure – the road and rail network is falling apart or non-existent
- Value chain – for the supplier industry it is important to get access to technology and
information from the lead firms
Figure 7.3 shows the findings in association with the attributes. It can be noted that the majority of
the issues can be found on the macro and meso level and are governed on the government and
market level.
Figure 7.3: Qualitative comments of interview participants with regard to issues of the South African
automotive industry
The conclusion of the focus group and the interviews can be regarded as significant because
almost identical issues were raised and discussed. Therefore, and in addition to the findings
mentioned above, it can be concluded that the conceptual model can be accepted and can
consequently be used for the quantitative research section.
With regard to the issues in the South African automotive industry it can be noted that the majority
of the issues are seen on the macro-level and fall under the governance of the government.
Stellenbosch University http://scholar.sun.ac.za
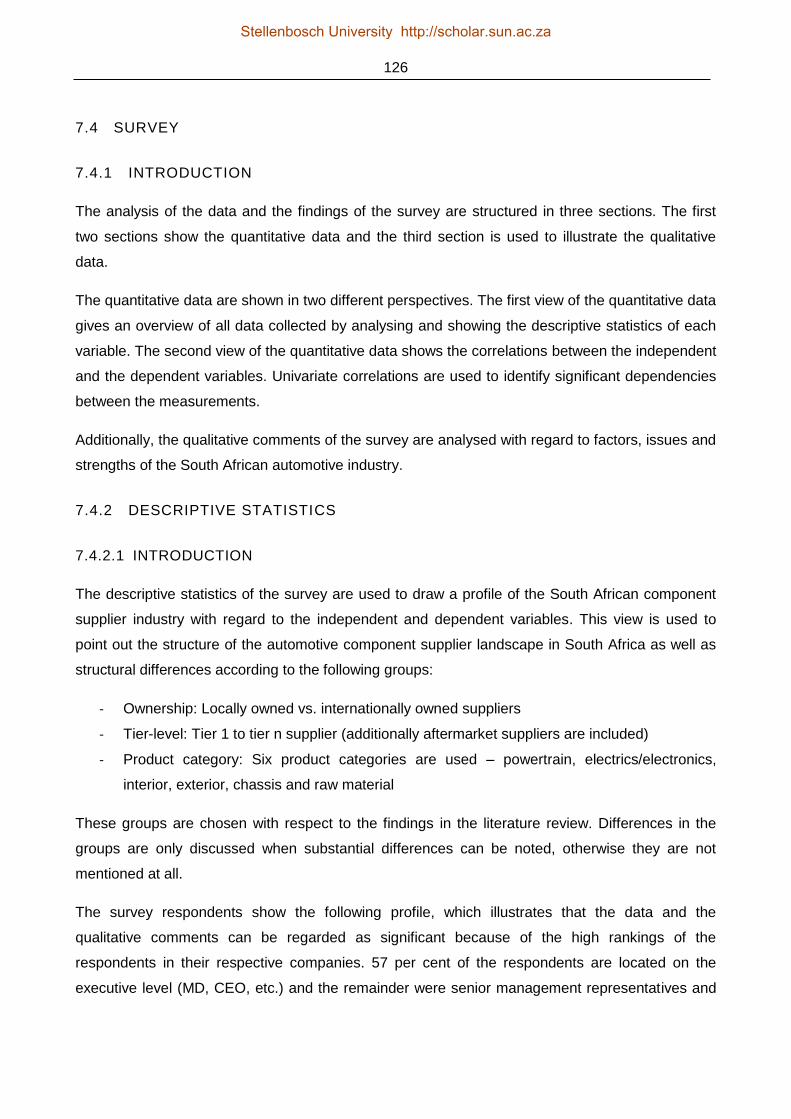
126
7.4 SURVEY
7.4.1 INTRODUCTION
The analysis of the data and the findings of the survey are structured in three sections. The first
two sections show the quantitative data and the third section is used to illustrate the qualitative
data.
The quantitative data are shown in two different perspectives. The first view of the quantitative data
gives an overview of all data collected by analysing and showing the descriptive statistics of each
variable. The second view of the quantitative data shows the correlations between the independent
and the dependent variables. Univariate correlations are used to identify significant dependencies
between the measurements.
Additionally, the qualitative comments of the survey are analysed with regard to factors, issues and
strengths of the South African automotive industry.
7.4.2 DESCRIPTIVE STATISTICS
7.4.2.1 INTRODUCTION
The descriptive statistics of the survey are used to draw a profile of the South African component
supplier industry with regard to the independent and dependent variables. This view is used to
point out the structure of the automotive component supplier landscape in South Africa as well as
structural differences according to the following groups:
- Ownership: Locally owned vs. internationally owned suppliers
- Tier-level: Tier 1 to tier n supplier (additionally aftermarket suppliers are included)
- Product category: Six product categories are used – powertrain, electrics/electronics,
interior, exterior, chassis and raw material
These groups are chosen with respect to the findings in the literature review. Differences in the
groups are only discussed when substantial differences can be noted, otherwise they are not
mentioned at all.
The survey respondents show the following profile, which illustrates that the data and the
qualitative comments can be regarded as significant because of the high rankings of the
respondents in their respective companies. 57 per cent of the respondents are located on the
executive level (MD, CEO, etc.) and the remainder were senior management representatives and
Stellenbosch University http://scholar.sun.ac.za
127
other high-ranked managers. An overview of the structure of the respondents is given in the Figure
7.4.
Figure 7.4: Profile of the survey respondents
7.4.2.2 PROFILE OF SOUTH AFRICAN AUTOMOTIVE COMPONENT SUPPLIERS
7.4.2.2.1 OWNERSHIP
The data shows that 47 per cent of the automotive component suppliers in South Africa are
internationally owned. 49 per cent of the suppliers are locally owned, with 19 per cent of them
using international patents or licences. 4 per cent of the suppliers are joint ventures between
locally owned and internationally owned suppliers. Taking revenue into account, the data shows
that 78 per cent of the revenues are generated by internationally owned suppliers or joint ventures.
The data agrees with the trend shown in Section 2.3.3, where research by Barnes (2000; 2004)
points to the development of a supplier base in South Africa the majority of which is internationally
owned. Barnes states in an analysis based on a sample of four OEM-supplier structures taking into
account purchasing values that 70 per cent of the component supplies originate in an international
environment (either wholly owned international suppliers or joint ventures of locally owned and
internationally owned suppliers).
The high percentage of locally owned suppliers in terms of numbers of participants in the South
African automotive value chain needs attention. Locally owned suppliers account for nearly half of
the supplier firms, but are only able to generate 20 per cent of the revenues. This fact is in line with
the concept of follow sourcing – lead firms, in this case the automotive OEMs, rebuild their supply
Stellenbosch University http://scholar.sun.ac.za
128
structure in the developing markets. Therefore, it seems valid to conclude that the mechanism of
follow sourcing is strongly existent in the South African automotive component market and it can
be assumed that the majority of the value-add is accomplished by the internationally owned
suppliers. To prove this issue, two structural facts should be taken into account: the tier structure of
the internationally and locally owned suppliers, as well as the product categories in which the
respective suppliers operate.
7.4.2.2.2 TIER STRUCTURE
The data shows that more than 50 per cent of the South African automotive component suppliers
operate on the first tier level. Twenty per cent of the firms occupy the second tier level; a further 10
per cent are third-tier level suppliers; 15 per cent supply the aftermarket; and 5 per cent are
integrated in an intercompany network. Although the revenue structure implies that the locally
owned suppliers are situated at lower value-add stages, the data does not prove this. The
distribution of tier levels with respect to the international and local group is equivalent to the overall
findings of the value chain structure. This means that there is no difference in the value chain stage
occupation of the internationally owned suppliers versus the locally owned suppliers. The
implication of the ownership-related revenue structure can, therefore, not be proven with a
difference of the tier structure of the mentioned groups.
Other implications that can be drawn from the results of the survey are that there must be strong
competition on the first tier level, as the percentage of the total also shows that the locally owned
suppliers are able to get market access on the first tier level, which shows the ability to compete
with the internationally owned suppliers.
7.4.2.2.3 PRODUCT CATEGORY
The analysis of the product categories shows the following overall picture: 29 per cent of the South
African automotive component suppliers operate in the powertrain business, 27 per cent supply
interior parts and 17 per cent manufacture parts for the exterior of vehicles. A further 13 per cent
operate in the chassis category, 10 per cent produce electric and electronic parts and 4 per cent
supply wheels and tyres. The relatively high percentage of powertrain and interior suppliers can be
explained by the fact that most of the components related to these categories are bulky and,
therefore, demand high logistics costs. Lead firms, therefore, aim to locate these parts in
geographic proximity to their production sites in order to avoid high logistics cost and ensure
delivery reliability and flexibility.
Coming back to the implication made above that the revenue structure is influenced by the product
categories in which the suppliers operate, it must be stated that there is no difference in the
Stellenbosch University http://scholar.sun.ac.za

129
product structure of the internationally and locally owned suppliers. Therefore, the implication
cannot be proven by the current data.
An interesting fact is that the data does not show any raw material suppliers. This leads to an
interesting implication. Firstly, raw material suppliers are not integrated into the South African
automotive value chain, or at least are not seen as automotive suppliers. The question that arises
is why the South African component industry does not integrate one of its potential sources of a
major competitive advantage – the availability and proximity to raw materials – into its value chain.
As the research is focused on component suppliers, one explanation is that the survey simply has
not targeted these kinds of suppliers. Another justification can be made by the fact that most of the
raw material suppliers do not only supply the automotive industry, but have a diversified customer
portfolio and are, therefore, not regarded as automotive suppliers.
7.4.2.2.4 AGE
The age of the South African automotive component suppliers shows that the industry is in a rather
mature stage, meaning that there have not been not a lot of new entrants in the market in the last
five years. Only 12 per cent of the companies are five years and younger. The average age of the
firms is 17.2 years; two-thirds of the firms are older than 21 years.
As stated in Section 3.2, it can be deduced that the automotive upstream value chain is
characterised by high entry barriers with regard to technology and processes. Companies that
have participated longer in the industry must have adapted more than younger companies, and are
presumably better established. Also, older companies have gained more experience in the industry
and are possibly better networked than younger companies. As the automotive industry in South
Africa is in the stage of transformation to full manufacturing (see Section 2.3), these established
companies will from the backbone of the supply chain, but will also be accompanied by new
entrants.
The data shows that JVs and wheel/tyre suppliers are younger than the other groups. However,
the conclusions that can be reached are restricted, as they were only two respondents in each of
these groups.
7.4.2.2.5 REVENUES
In terms of the revenue structure, the South African automotive component suppliers average ZAR
363 million. Two-thirds of the firms generate revenues below ZAR 200 million and 25 per cent
more than ZAR 800 million. These last figures show that the analysis is skewed towards smaller
Stellenbosch University http://scholar.sun.ac.za

130
companies. By looking at the median of ZAR 175 million, it becomes obvious that the majority of
firms have revenues below ZAR 200 million, as stated above.
As mentioned in the analysis of the ownership structure, the revenues of the locally owned
suppliers are less than the revenues of internationally owned suppliers. A locally owned supplier
generates ZAR 187 million on average, whereas the internationally owned suppliers average ZAR
436 million. It can again be concluded that internationally tied suppliers are able to generate more
than double the revenue of locally owned suppliers.
Additionally, it can be found that third and lower-tier-level suppliers average ZAR 89 million in
revenue – much less than the other tier levels. This finding can be explained by the firm size, as
these companies are smaller in terms of employees.
7.4.2.2.6 EMPLOYEES
The average size of a South African automotive component supplier in terms of employees is 289.
Fifty per cent of the businesses employ more than 250 people. The majority of the smaller
companies with less than 100 employees are locally owned.
Still, the question is whether the higher revenues of internationally owned suppliers can be
attributed the concept of follow sourcing only. In order to draw a further conclusion, the next
paragraph uses employee numbers as a measurement of size.
By looking at the ratio of revenue per employee it becomes obvious that the locally owned
suppliers have lower revenues per employee than the internationally owned suppliers. The locally
owned businesses generate ZAR 0.30 million in revenue per employee, whereas the internationally
owned suppliers average ZAR 1.35 million per employee. This could mean that locally owned
suppliers operate on a more manual basis and are not able to produce the same output per
employee as the internationally owned suppliers.
The data also reveals that chassis and electric/electronic suppliers have higher revenue rates per
employee (ZAR 1.89 million and 1.32, respectively) than firms in the other product categories. This
fact is to be expected for the electric/electronic suppliers due to the nature of their highly
sophisticated products, but is unexpected for the chassis suppliers.
Stellenbosch University http://scholar.sun.ac.za
131
7.4.2.3 GOVERNMENT INFLUENCES
In this section governmental influences on the automotive component supplier industries is
described and analysed.
7.4.2.3.1 SUBSIDIES
Automotive component suppliers in South Africa received an average of ZAR 1.1 million in direct
government subsidies in 2009. This financial support, however, went to only 20 per cent of the
companies; the remaining 80 per cent did not receive any governmental support. An explanation
could be that these companies did not apply for support.
Powertrain suppliers show the highest average in terms of these subsidies. These companies
received an average of ZAR 1.95 million, which is the highest value together with
electric/electronics suppliers, which average ZAR 1.90 million. Internationally owned suppliers
received ZAR 1.82 million, more than twice the subsidies of the locally owned suppliers. The
subsidies are also concentrated on first tier suppliers and, unexpectedly, on aftermarket suppliers.
The low levels of direct subsidies can be explained by the logic of the Motor Industry Development
Program, which in general rewards duty-free allowances rather than direct subsidies. Therefore,
the amount of direct monetary subsidies is low.
7.4.2.3.2 INFRASTRUCTURE
The South African automotive component suppliers state that apart from communications
infrastructure, the infrastructure relating to roads, rail, shipping and energy is less developed than
that of developed countries. The perception is measured on a seven-point Lickert scale, where the
respondents were asked to state whether the particular infrastructure is inferior to developed
countries (level 1 on the Lickert scale), comparable (level 4) or superior (level 7).
Road infrastructure is perceived to be on level 3, which implies that businesses find the road
infrastructure to be inferior to that of developed countries. Twenty-nine per cent of the suppliers
stated that they experience the road infrastructure to be comparable or superior to that of
developed countries. Road infrastructure is the only measure in this context where locally owned
suppliers perceive the state of infrastructure to be significantly different from the perception of
internationally owned suppliers. Locally owned suppliers rate the road infrastructure on 2.5 on the
Lickert scale; the internationally owned suppliers put it at 3.5. An explanation is that the locally
owned suppliers are not fully integrated into the advanced infrastructure and location of the OEMs
and, therefore, their customers. This necessitates higher logistical requirements for these
suppliers.
Stellenbosch University http://scholar.sun.ac.za

132
The rail infrastructure was perceived to be inferior to road infrastructure. Rail infrastructure was
rated on a level of 1.7 on the Lickert scale; there were no responses stating that the rail
infrastructure is superior to road. Fifty per cent of the businesses stated that rail infrastructure is far
inferior. The shipping infrastructure in South Africa is perceived to be slightly inferior to that of
developed countries. The South African automotive suppliers rate the shipping infrastructure with a
mean of 3.5 on the Lickert scale. Only 13 per cent of the companies perceive the shipping
infrastructure to be superior to that of developed countries. With regard to the energy infrastructure
the perceived level for South Africa is inferior to that of developed countries. The energy
infrastructure is rated on a level of 2.4 on the Lickert scale, with no responses stating that the
energy infrastructure is superior. The communications infrastructure is perceived to be on the
same level as developed countries. 50 per cent of the supplier companies stated that they
experience communications to comparable to developed countries, with a mean of 3.8 on the
Lickert scale.
It can be concluded that despite its geographical disadvantage, South Africa shows a lack in its
level of infrastructural development, except for the communications networks. Important structures
in the logistics network for the automotive industry seem not to be taken care of by government or
related institutions. This fact might impose a further disadvantage and, therefore, a threat to the
automotive industry. It could be questioned whether this disadvantage is inherent in the
geographical distance to major markets and customers, and cannot be resolved through
improvements in the overall infrastructure to shorten lead times to international and local
customers. On the other hand, it can be assumed that a major source of the disadvantages is
caused by the state-owned businesses that are responsible for the infrastructure (e.g. Transnet for
road, rail and ship and Eskom for energy).
7.4.2.3.3 LOGISTICS COSTS
Taking the argument further, it is important to qualify logistic costs in order to evaluate these
findings. The South African automotive component suppliers spend an average of 7.7 per cent of
their revenues on logistics. The range of two-thirds of the suppliers lies between 1 and 10 per cent.
Firms focusing on the domestic market show a mean of 9.1 per cent of their revenue spent on
logistics; companies that merely supply international markets (export revenues more than 50 per
cent) show an average of 5.1 per cent. The following interpretation may be a bit loose, but
following on from the conclusion made in the infrastructure section above that South Africa‟s
infrastructure is less developed than that of developed countries could mean that outbound
logistics from South Africa to international markets might be less expensive than logistics costs
within South Africa itself. Additionally, it could mean that the value-add for export products is much
Stellenbosch University http://scholar.sun.ac.za

133
higher – and, therefore, the revenues. As the logistics cost is measured as a percentage of
revenue, this means that exporters generate higher revenues while simultaneously logistics costs
remain the same.
Internationally owned suppliers stated that logistics costs accounted for 9.7 per cent of their
revenues and locally owned suppliers had an average of 4.9 per cent. It can be assumed that
internationally owned suppliers import more parts for their products, which leads to a higher
logistics cost proportion. In conclusion it can be said that locally owned suppliers locate their
supply chain in the domestic area.
Some exemptions to the general average occur on the product category and tier level. Powertrain
and exterior suppliers show considerably lower logistics cost than firms in the other product
categories. They average 5.4 per cent compared to 9.3 per cent. Suppliers on the third and lower
tier levels have an average of 5.5 per cent of logistics cost, which is substantially lower than the
other tier levels.
7.4.2.3.4 LOCAL CONTENT
The average local content of the South African automotive suppliers for their top product (most
sold product) is 59 per cent, meaning that 41 per cent of the parts for these products are imported.
Thirteen per cent of the suppliers state that their top product only contains local parts. All of these
companies are locally owned suppliers. Powertrain products show a higher local content, with an
average of 68 per cent. This is the only product category that differs substantially from the average.
Coming back to the above discussion that internationally owned suppliers have a higher
percentage of logistics cost in their revenues, the local content of these suppliers averages 52 per
cent for their top product. Locally owned suppliers have a higher local content percentage in their
top products, with an average of 68 per cent. Therefore, the conclusion can be drawn that
internationally owned suppliers import more parts for their products.
7.4.2.3.5 TRADE AGREEMENTS
South African automotive component suppliers generate 20 per cent of their revenues in free trade
agreement (FTA) areas. Export-oriented firms have an average of 35 per cent of their revenues in
free trade agreement areas, whereas firms focusing on the domestic market average 10 per cent
of their revenues in free trade agreement areas. 50 per cent of the automotive component
suppliers in South Africa do not export into free trade agreement areas at all. A substantial
difference between internationally owned suppliers and locally owned suppliers and the different
Stellenbosch University http://scholar.sun.ac.za

134
tier levels cannot be recognised for this measure. But it can be stated that powertrain components
have a high percentage, with 44 per cent being exported into free trade agreement areas.
In general, it can be said that despite the trade agreements of South Africa (which are mentioned
in Chapter 5) the percentage of exports going into free trade agreement areas is only 50 per cent
of total exports. In conclusion this means that for the remaining 50 per cent of automotive
component exports regular duties will be payable. Hence, South African automotive component
suppliers do not use the free trade agreements of South Africa to the full extent.
7.4.2.3.6 SOCIAL COMMITMENT
Social commitment spending covers areas like BEE and HIV/AIDS. The average spending of the
South African automotive component suppliers in terms of social commitment is ZAR 2.3 million.
Therefore, 50 per cent of the firms do not have any expenses in this area.
The only recognisable differences in the groups are connected to their tier level. Firms on the
second tier level show a substantially higher average spend on social commitment than the other
subgroups.
7.4.2.4 MARKET INFLUENCES
7.4.2.4.1 DOMESTIC AND EXPORT DEMAND
The average of domestic revenues of South African automotive suppliers is 64 per cent. One-third
of the suppliers show revenues below 50 per cent in the domestic market. 60 per cent of the
suppliers generate between 80 and 100 per cent of their revenues in the local market. Locally,
suppliers have always more than 50 per cent domestic revenues. It can be noted that the locally
owned suppliers generate 81 per cent of their revenues domestically, whereas internationally
owned suppliers make 56 per cent of their revenues in the South African market. Interesting is the
figure for the locally owned suppliers using international patents or licences. This group shows an
average of 60 per cent domestic revenues, which implies dependence on accessibility to state-of
the-art technology as well as international networks to generate more revenues through export
activities.
Additionally it can be found that second-tier suppliers generate only about 50 per cent of their
revenues on home turf, whereas aftermarket suppliers average 86 per cent domestic revenues.
With regard to product category, powertrain suppliers are the least connected group with regard to
domestic demand, with an average 39 per cent of domestic revenues.
Stellenbosch University http://scholar.sun.ac.za
135
A twofold conclusion is possible from this data. Firstly, it can be noted that locally owned suppliers
mainly rely on domestic demand while the risk of the internationally owned suppliers is leveraged
through their export revenues. Secondly, it can be stated that the ties of the internationally owned
suppliers to their home areas is useful to generate export revenues at the same time as the locally
owned suppliers have their customers mainly in the domestic market for the same reasons.
7.4.2.4.2 FOREIGN DIRECT INVESTMENT
South African automotive component suppliers received an average of ZAR 21.5 million; 50 per
cent of the respondents did not receive any foreign direct investment. All of the foreign direct
investment inflow was received by companies with international ties.
This leads to the conclusion that locally owned suppliers have not acquired new international
partners or investors. The inflow of foreign direct investment has only been directed towards
companies that already have international ties.
7.4.2.4.3 LABOUR
The South African labour market is used by the automotive component suppliers as follows:
suppliers make use of temporary workers, with an average of 6.7 per cent of their total employees.
More than 50 per cent of the firms use temporary employees in their workforce. In some cases this
figure rises to 40 per cent. Additionally, South African automotive component suppliers make use
of workers from labour brokers. The average lies at 8 per cent, and, like temporary workers, more
than 50 per cent of the firms make use of labour brokers. Extreme values go up to 60 per cent for
this category. Averages for the percentage of labour broker and temporary workers are
substantially higher on the third and lower tier levels. This implies that the demand for firms on this
level is more volatile.
By looking at the percentage of graduates in the firms it can be stated that the average is 8.5 per
cent, with the majority of firms employing between 1 and 10 per cent of graduates. Extreme values
go up to 80 per cent. Differences in the occurrence with regard to ownership can only be
recognised when analysing the percentage of graduates in the particular groups. Locally owned
South African suppliers show a percentage of 2.4 per cent, considerably below the average,
whereas locally owned suppliers using international patents or licences show a considerably higher
percentage, with 26.4 per cent of graduates in such companies. It can also be noted that first-tier
suppliers employ a higher average of graduates than the other groups. With regard to the product
categories, the highest proportion of graduates can be noted with the electric/electronic suppliers.
The findings imply the need for a higher level of graduate employees in certain groups and show
the requirements in terms of skilled labour.
Stellenbosch University http://scholar.sun.ac.za
136
The perception of South African automotive suppliers is that labour cost in the country is less than
in developed countries. The mean of South Africa‟s labour cost is 92 per cent of developed
countries. This perception includes influences on labour cost, such as strikes, but does not take
into account productivity. Internationally owned suppliers rate the labour cost in South Africa at 87
per cent of the cost in developed countries, which is considerably lower than the locally owned
suppliers, which rate it at 95 per cent. This implies that labour-intensive production is still a factor
for the allocation of production in South Africa.
7.4.2.4.4 TECHNOLOGY
The South African automotive component suppliers state that the availability of production
processes and technology in the country is on average 90 per cent. This figure was measured by
comparing the needed production stages for a particular product with the locally available
production stages. 80 per cent of the suppliers state that at least 90 per cent of the production
processes are available locally. The lowest value was for suppliers with electrical/electronic
components. This group states that 68 per cent of the production stages are available in the
country.
In conclusion it can be stated that there is a deficit of technology available locally, especially for
new technology like electrics and electronics.
7.4.2.5 INDUSTRY INFLUENCES
7.4.2.5.1 PRODUCT CHARACTERISTICS
The South African automotive component suppliers mainly supply products on a component level
to their customers. 80 per cent of all top products are on a component basis. 13 per cent of the
products are modules and 7 per cent of the products are on a system level. There are no
considerable differences in the dimensions of ownership and product category with regard to the
modularisation level of the products. Hence, the data suggests that there is a basis for the
production of modules and systems in terms of capabilities.
By looking at the standardisation of the top products it can be seen that the average top product is
customised to customer‟s needs. 20 per cent of the products are standard items, whereas one-
third are specialised components. Taking the ownership structure into account it can be stated that
more specialised products are supplied by internationally owned suppliers and more standardised
products are produced by locally owned suppliers. A difference with regard to the product
categories cannot be seen.
Stellenbosch University http://scholar.sun.ac.za

137
The average raw material content of the top products of the South African automotive component
suppliers is 50 per cent. This value differs considerably in the product categories, as interior
suppliers in particular state that the raw material content for their products is 66 per cent. This
phenomenon can be explained by the fact that seats (and especially leather seats) contain high
values of raw material. Interestingly, the data also leads to a considerable difference in raw
material content with regard to internationally and locally owned suppliers. The former group states
42 per cent of raw material in their top products; locally owned suppliers operate with 57 per cent
of raw material content in their top products.
7.4.2.5.2 VALUE CHAIN
Value chain governance in the South African automotive component supply chain shows that 65
per cent of the suppliers are bound in either a market type or a relational type of governance. 30
per cent of the suppliers operate in a market environment where commodity suppliers supply
standard products and the relationship to customers is based on arm‟s-length markets. 35 per cent
of the suppliers find themselves in a relational environment where turn-key suppliers supply
complex modular products (or feed into the supply chain of those products), and the relationship
consists of mutual interdependence. 20 per cent of the suppliers in the South African automotive
value chain are bound in modular relationships to their customers. Modular value chain
governance means that turn-key suppliers supply modular products that are customised for a
specific customer, but are supplied to different customers in different specifications. The captive
type of value chain governance is experienced by 15 per cent of the suppliers. Captive suppliers
supply non-standard products that are solely produced to the buyer‟s needs.
In general, it can be stated that half of the South African automotive component suppliers work in
an environment where standardised and customised products are supplied to the customers
(market and modular), and the other half of suppliers operate with highly customised products
(relational and captive). With regard to ownership and product category, there are no obvious
patterns.
Upgrading activities of the South African automotive component suppliers are measured in the
number of horizontal (e.g. new products) and vertical upgrades (e.g. new production stage added)
in the last three years. The average for horizontal upgrades is 1.7, and for vertical upgrades 1.5.
Eighty per cent of the suppliers have at least accomplished one horizontal upgrade and 70 per cent
of suppliers were able to achieve at least one vertical upgrade. With regard to horizontal upgrades,
40 per cent of the suppliers have more than three upgrades, whereas 20 per cent have not
upgraded in the last three years. More than three vertical upgrades were accomplished by 20 per
cent of the suppliers, while 30 per cent did not upgrade vertically at all.
Stellenbosch University http://scholar.sun.ac.za
138
By looking at the structure of upgrades when taking ownership into account it can be observed that
the locally owned South African suppliers have considerable higher numbers of upgrades than
average. This group averages 2.4 horizontal upgrades and 2.1 vertical upgrades. This could
indicate that the locally owned suppliers need to or are willing to upgrade their overall capabilities
to play a role in the local and international automotive value chain.
7.4.2.5.3 COORDINATION
Coordination is assessed for informational flows as well as for physical flows. Informational flows
were measured by suppliers‟ perception of whether the customer-supplier linkages are sufficient.
The average perception on a seven-point Lickert scale is that information flows in the South African
automotive component industry are sufficient. The mean lies at 4.2 on the scale and the data is
normally distributed. Also, there are no considerable differences between the groups.
In terms of physical flows it can be determined that 60 per cent of the South African automotive
component suppliers invested in supply chain activities. The average spending for the
improvement of physical flows lies at ZAR 3.9 million. The other 40 per cent have not invested into
supply chain improvement at all. Although the overall numbers should not be given too much
weight, it can be stated that suppliers on the first and second tier level and suppliers in the interior
and exterior business invested the biggest portion on supply chain activities.
7.4.2.5.4 STANDARDS AND QUALITY
In terms of quality development in the industry value chain, two measures were applied. The first
one is the investment in standards with regard to product and quality. The South African
automotive component suppliers state an average of ZAR 3.2 million. One-third of the firms did not
invest in standardisation processes and methods. Locally owned suppliers using international
patents or licences invest a considerably higher amount than the other groups, and average ZAR
4.5 million. The analysis also shows that the locally owned suppliers invest below average
amounts, whereas the internationally owned suppliers spend above average.
The second measurement taken was supplier development activities. This topic was investigated
in both directions – the supplier development that the South African automotive component
suppliers have received from their customers and the activities that have been given to their own
supply chain. In terms of received supplier development activities, the average lies at 12.6 days. 50
per cent of the suppliers state that they have not received any support. The average of supplier
development activities given to their own suppliers lies at 29.5 days. Similar to the received
supplier development activities, 50 per cent of the firms have not given any activities to their
suppliers.
Stellenbosch University http://scholar.sun.ac.za
139
The group of internationally owned suppliers has received and given considerably more days of
supplier development activities. This group averages 16.7 days in received activities and 49.7 days
in given activities. This data shows that internationally owned suppliers are on the one hand more
in the focus of the activities by their customers and on the other hand more concerned about the
development of their own supply chain. It can also be noted that the position in the value chain
influences supplier development activities. Suppliers on the first or second tier levels give and
receive considerably higher amounts of activities. This group gives 16.4 days and receives 31
days. Again, it can be noted that these firms are more involved in the development of the value
chain.
7.4.2.5.5 SALES
The sales organisation of South African automotive component suppliers is assessed by looking at
their market presence, their affiliation to automotive clusters and their perception about the impact
of geographical proximity to their customers.
75 per cent of the South African automotive component suppliers operate through sales offices and
representatives to cooperate with their customers. The remainder use websites to foster their
relationship with customers. It can be noted that internationally owned suppliers and suppliers on
the first tier level operate to a much higher degree through sales offices. This finding implies that
the lead firms demand direct contact with their direct suppliers.
50 per cent of the South African automotive component suppliers are not related to automotive
clusters. 45 per cent of the firms belong to regional clusters and 5 per cent are organised in
supplier parks. There are no discernible substantial differences in the groups.
The South African automotive component suppliers state that geographical proximity has a
medium to high impact on their business success with current and potential customers. 40 per cent
of the firms state that the impact is high, and 51 per cent experience a medium impact. 9 per cent
of the businesses say that there is no impact on business success. It is interesting that the
internationally owned suppliers state that the impact of proximity is rather higher than average, and
in this respect separate themselves from the other groups.
7.4.2.5.6 COMPETITION
The average market share of the South African automotive component suppliers is 40.3 per cent.
One-third of the firms state that their market share is 50 per cent or higher. It can be noted that
there is an increasing market share starting with the locally owned suppliers towards the
internationally owned suppliers. These groups average 30.5 per cent 44.0 per cent of market
Stellenbosch University http://scholar.sun.ac.za
140
share, respectively. The other groups do not show substantial differences with regard to market
share.
The average number of competitors for South African automotive component suppliers is 4.0.
Three clusters, each with one-third of the total, can be identified. The clusters are 1–2 competitors,
3–4 competitors and 5 or more competitors. Similar to the market share statement, it can be noted
that the locally owned suppliers experience the strongest competition, with an average of 4.8
competitors, whereas the internationally owned suppliers have to cope with 3.6 competitors. From
a tier-level point of view, the first tier level and the aftermarket are the most competitive. These
groups average 4.8 and 5.3 competitors, respectively.
7.4.2.6 CORPORATE INFLUENCES
7.4.2.6.1 OPERATIONAL PERFORMANCE
Five measures are taken for the operational performance of the South African automotive
component suppliers.
The first is cost control, which is measured in total inventory levels (raw material, work in
progress/work in process and finished goods). The average for the firms lies at ZAR 48.1 million.
Two-thirds of the companies have inventory levels between ZAR 1 and 40 million. Relative to their
revenues, the inventory level mean is 12.5 per cent. Substantial differences can be noted while
looking at aftermarket suppliers, which have an average of 26.1 per cent of inventory levels. And
another substantial difference can be noted when considering powertrain suppliers, which show an
average of 7.9 per cent of inventory levels.
In terms of quality, the South African automotive component suppliers are measured by customer
return rates with regard to 0km ppm (parts per million). The average for the firms lies at 305 ppm
with 90 per cent of the companies having values between 1 and 500 ppm. It can be noted that the
ppm rates are considerably higher on the first tier level, where they average 499 ppm and in the
exterior product category, with an average of 1,637 ppm.
With regard to value chain flexibility, the lead times in days to domestic customers and
international customers were measured. The average for domestic lead times is 9.5 days with a
range of 1–30 days. International customers have an average lead time of 38 days with a range of
1–50 days. The lead times differ considerably for the aftermarket suppliers, which have 26.7 days
for domestic lead times and 58.3 days for export lead times. By eliminating the values for the
aftermarket the lead times for the suppliers that operate in the „running‟ value chain of the
Stellenbosch University http://scholar.sun.ac.za
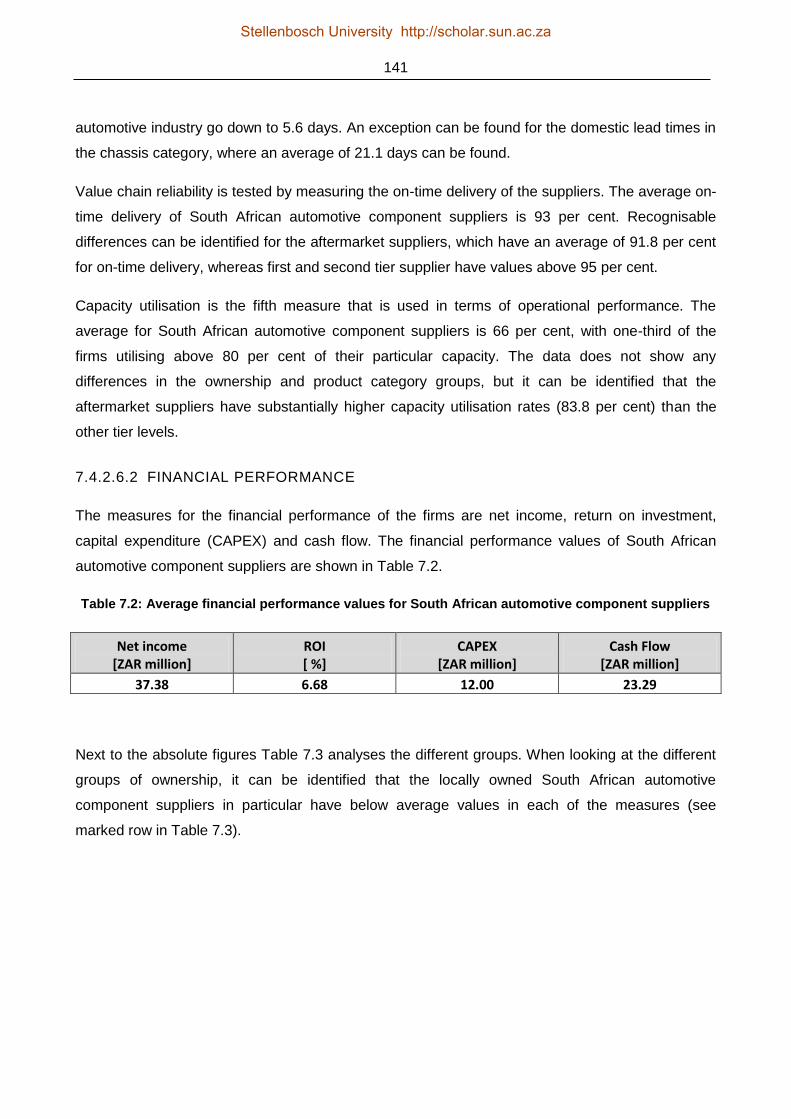
141
automotive industry go down to 5.6 days. An exception can be found for the domestic lead times in
the chassis category, where an average of 21.1 days can be found.
Value chain reliability is tested by measuring the on-time delivery of the suppliers. The average on-
time delivery of South African automotive component suppliers is 93 per cent. Recognisable
differences can be identified for the aftermarket suppliers, which have an average of 91.8 per cent
for on-time delivery, whereas first and second tier supplier have values above 95 per cent.
Capacity utilisation is the fifth measure that is used in terms of operational performance. The
average for South African automotive component suppliers is 66 per cent, with one-third of the
firms utilising above 80 per cent of their particular capacity. The data does not show any
differences in the ownership and product category groups, but it can be identified that the
aftermarket suppliers have substantially higher capacity utilisation rates (83.8 per cent) than the
other tier levels.
7.4.2.6.2 FINANCIAL PERFORMANCE
The measures for the financial performance of the firms are net income, return on investment,
capital expenditure (CAPEX) and cash flow. The financial performance values of South African
automotive component suppliers are shown in Table 7.2.
Table 7.2: Average financial performance values for South African automotive component suppliers
Net income [ZAR million]
ROI [ %]
CAPEX [ZAR million]
Cash Flow [ZAR million]
37.38 6.68 12.00 23.29
Next to the absolute figures Table 7.3 analyses the different groups. When looking at the different
groups of ownership, it can be identified that the locally owned South African automotive
component suppliers in particular have below average values in each of the measures (see
marked row in Table 7.3).
Stellenbosch University http://scholar.sun.ac.za

142
Table 7.3: Differences in groups according to ownership status of the financial performance of South
African automotive component suppliers
Net income
[ZAR million] ROI [ %]
CAPEX [ZAR million]
Cash Flow [ZAR million]
Internationally owned supplier 49.57 5.24 13.69 31.64
Joint venture of locally owned South African and international supplier 63.00 16.00 13.00 25.50
Locally owned South African supplier 5.20 5.50 5.20 7.80
Locally owned South African supplier using international patents/licences 17.00 9.17 13.00 8.67
Grand total 37.38 6.68 12.00 23.29
It can be identified that locally owned suppliers generate below average values in net income,
capital expenditure (CAPEX) and cash flow (see Table 7.4). This fact could be associated with the
lower average revenues, which is investigated in the next section by putting the financial
performance measures in perspective to the revenues. As the return on investment is a relative
measure, it can be found that the internationally owned suppliers and the locally owned suppliers
operate on the same level but below the average of the other two groups.
Table 7.4: Financial performance measures of South African automotive component suppliers in
relation to revenues
Net income/ revenues [%]
ROI [ %]
CAPEX/ revenues [%]
Cash Flow/ revenues [%]
Internationally owned supplier 9.3 5.2 5.9 7.9
Joint venture of locally owned South African and international supplier 15.3 16.0 4.4 5.6
Locally owned South African supplier 3.6 5.5 3.6 5.4
Locally owned South African supplier using international patents/licences 6.4 9.2 8.7 5.0
Grand total 8.0 6.7 5.7 6.8
Financial performance relative to revenues shows an especially different result. The locally owned
suppliers are still below average with regard to net income relative to revenues despite the fact that
return on investment is on the same level as internationally owned suppliers.
By splitting the suppliers in two groups – the first with international ties and including the
internationally owned suppliers as well as the joint ventures between international firms and South
African firms, and the second with national ties and including the locally owned suppliers and
Stellenbosch University http://scholar.sun.ac.za

143
locally owned suppliers using international licences/patents – the data shows substantial
differences in net income and cash flow (see marked fields in Table 7.5). This finding must be seen
according the firm sizes, as internationally tied suppliers are bigger than locally tied suppliers, but
especially for the net income figures it must be noted that the internationally tied suppliers are able
to generate a higher margin.
Table 7.5: Differences in financial performance of internationally tied and nationally tied South
African automotive component suppliers
Net income
[ZAR million] ROI [ %]
CAPEX [ZAR million]
Cash Flow [ZAR million]
Internationally owned supplier 49.57 5.24 13.69 31.64
Joint venture (JV) of locally owned South African and international supplier 63.00 16.00 13.00 25.50
Grand total 51.25 6.59 13.61 30.88
Locally owned South African supplier 5.20 5.50 5.20 7.80
Locally owned South African supplier using international patents/licences 17.00 9.17 13.00 8.67
Grand total 9.63 6.88 9.10 8.13
Table 7.6 and Table 7.7 only state absolute figures, as the relative values to revenues are not
representative due to the numbers of respondents in each group. With regard to the tier structure,
the first tier suppliers show the highest net income in absolute figures, whereas the third and lower
tier suppliers are able to generate the highest return on investment. In terms of cash flow, the
second tier suppliers show below average values.
Table 7.6: Differences in financial performance of South African automotive component suppliers
according to main customers
Net income
[ZAR million] ROI [ %]
CAPEX [ZAR million]
Cash Flow [ZAR million]
Aftermarket 15.40 5.98 10.40 28.00
Intercompany 13.00 -1.00 13.00 63.00
OEM 56.09 4.77 13.79 23.09
Tier-1 31.50 7.75 9.75 9.50
Tier-2 21.33 16.00 9.75 21.33
Grand total 37.38 6.68 12.00 23.29
When looking at product categories it becomes obvious that the ROIs in the groups are
substantially different. Powertrain suppliers are able to generate four times higher return on
Stellenbosch University http://scholar.sun.ac.za

144
investment than the chassis suppliers. Despite the low results in return on investment, the net
income by the chassis suppliers is double the average of all groups. The lowest net income results
can be attached to the electric/electronic and exterior suppliers. In terms of capital expenditure, the
interior suppliers show a substantially lower value than the other groups.
Table 7.7: Differences in financial performance of South African automotive component suppliers
according to product categories
Net income
[ZAR million] ROI [ %]
CAPEX [ZAR million]
Cash Flow [ZAR million]
Chassis 80.86 2.52 10.83 25.33
Electric/electronics 12.75 8.95 13.00 22.25
Exterior 16.00 6.63 13.00 22.25
Interior 22.80 6.00 6.50 19.17
Powertrain 25.50 11.75 16.43 28.50
Grand total 37.38 6.68 12.00 23.29
The measures for the financial performance also include figures on the expense level with regard
to R&D and HR training expenditures. The average for the South African automotive component
suppliers is 2.13 per cent of revenues for R&D expenditures and 1.63 per cent of revenues for HR
training expenditures. No differences can be identified across the different groups.
7.4.2.7 SYNTHESIS
The key findings from the descriptive statistics are illustrated in the following overview (see Tables
7.8–7.12). In order to use the suggested structure from the introduction of this section, the findings
are related to the attributes, and organised according to the governance levels. This conclusion
summarises the findings in terms of the structure, profile, specifics and differences of the groups in
the South African automotive supplier industry.
Stellenbosch University http://scholar.sun.ac.za
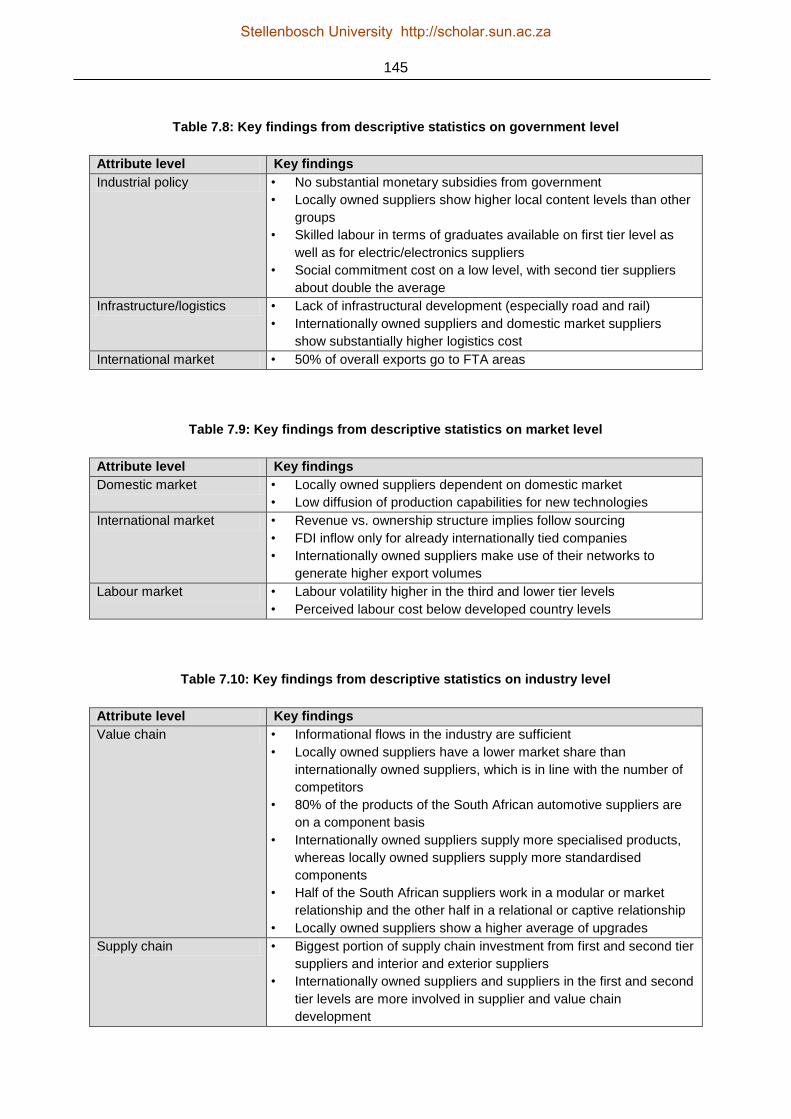
145
Table 7.8: Key findings from descriptive statistics on government level
Attribute level Key findings
Industrial policy • No substantial monetary subsidies from government
• Locally owned suppliers show higher local content levels than other
groups
• Skilled labour in terms of graduates available on first tier level as
well as for electric/electronics suppliers
• Social commitment cost on a low level, with second tier suppliers
about double the average
Infrastructure/logistics • Lack of infrastructural development (especially road and rail)
• Internationally owned suppliers and domestic market suppliers
show substantially higher logistics cost
International market • 50% of overall exports go to FTA areas
Table 7.9: Key findings from descriptive statistics on market level
Attribute level Key findings
Domestic market • Locally owned suppliers dependent on domestic market
• Low diffusion of production capabilities for new technologies
International market • Revenue vs. ownership structure implies follow sourcing
• FDI inflow only for already internationally tied companies
• Internationally owned suppliers make use of their networks to
generate higher export volumes
Labour market • Labour volatility higher in the third and lower tier levels
• Perceived labour cost below developed country levels
Table 7.10: Key findings from descriptive statistics on industry level
Attribute level Key findings
Value chain • Informational flows in the industry are sufficient
• Locally owned suppliers have a lower market share than
internationally owned suppliers, which is in line with the number of
competitors
• 80% of the products of the South African automotive suppliers are
on a component basis
• Internationally owned suppliers supply more specialised products,
whereas locally owned suppliers supply more standardised
components
• Half of the South African suppliers work in a modular or market
relationship and the other half in a relational or captive relationship
• Locally owned suppliers show a higher average of upgrades
Supply chain • Biggest portion of supply chain investment from first and second tier
suppliers and interior and exterior suppliers
• Internationally owned suppliers and suppliers in the first and second
tier levels are more involved in supplier and value chain
development
Stellenbosch University http://scholar.sun.ac.za

146
Table 7.11: Key findings from descriptive statistics on corporate level
Attribute level Key findings
Value chain • 50% of the suppliers operate in powertrain and interior
• No raw material suppliers
• 75% of the South African automotive component suppliers operate
through sales offices and representatives, and 50 % are organised
in a cluster
• Strong competition, but ability to get market access on the first tier
level for locally owned suppliers
Supply chain • Specific product groups with substantially higher raw material
content – especially interior
• Locally owned suppliers with higher raw material content in their
products
Internal value chain • Average of inventory levels at 12.5% of revenues; aftermarket
suppliers inventory levels at 26.1% of revenues
• Quality level at 301 ppm in average; first tier suppliers at 499 ppm
• Domestic lead times at 9.5 days, with aftermarket suppliers at 5.6
days
• Lead times for first and second tier suppliers above 95%
• Capacity utilisation at 66% for 2009; aftermarket suppliers above
80%
Company characteristics • Age of companies implies establishment and maturity
Table 7.12: Key findings from descriptive statistics for dependent variables
Dependent variables • Skewed distribution for revenues towards smaller suppliers
• Revenues per employee four times higher for internationally owned
suppliers than locally owned suppliers
• Locally owned suppliers below average with regard to absolute
financial figures
• ROI on the same level for locally and internationally owned
suppliers
• third tier suppliers with the highest ROI and first tier suppliers with
the highest net income
• Powertrain suppliers with the highest ROI and chassis suppliers
with lowest ROI, but the highest net income
Stellenbosch University http://scholar.sun.ac.za

147
7.4.3 CORRELATIONS
7.4.3.1 INTRODUCTION
An investigation of correlations between the independent and dependent variables is used to
identify patterns with regard to the economical sustainability of the South African automotive
component suppliers. The independent and dependent variables from the conceptual model are
compared using the Spearman‟s rank correlation coefficient to determine dependencies between
the variables. Correlations with a significance of p ≤ 0.05 are treated as significant, whereas
correlations with a significance of 0.05 < p ≤ 0.10 are treated as having a tendency towards
dependency. The results are clustered according to the system levels from the conceptual model.
This is done in order to be able to qualify patterns in terms of the economic sustainability of the
South African automotive component suppliers.
7.4.3.2 MACRO-LEVEL
7.4.3.2.1 OVERVIEW
Table 7.13 and the following tables in this section are structured in the same way:
- The system level in the first column shows the category of the independent variable
- The independent variable is named in the second column
- The Spearman rank correlation coefficient is shown in the third column
- The dependent variable is named in the fourth column
- The fifth column shows the significance of the correlation. (Correlations with a significance
of p ≤ 0.05 are treated as significant, whereas correlations with a significance of 0.05 < p ≤
0.10 are treated as having a tendency towards dependency.)
Table 7.13: Correlations between the independent and dependent variables on the macro-level
System level
Independent variable Spearman Dependent variable
Significance
Macro TOP – product local content (per cent) -0.33 Revenues Tendency
Macro Logistics cost 0.39 Revenues Significant
Macro FDI 0.35 Revenues Tendency
Macro Infrastructure – road 0.50 Net income Significant
Macro Infrastructure – ship 0.51 ROI Significant
Macro FTA revenues (per cent) 0.35 ROI Tendency
Macro TOP – product local content (per cent) -0.35 Cash flow Tendency
Macro Infrastructure – ship 0.38 Cash flow Tendency
Macro Infrastructure – rail 0.37 Cash flow Tendency
Stellenbosch University http://scholar.sun.ac.za

148
System level
Independent variable Spearman Dependent variable
Significance
Macro Social commitment 0.61 CAPEX Significant
Macro Logistics cost 0.41 CAPEX Significant
Macro FDI 0.39 CAPEX Tendency
Macro Infrastructure – ship 0.36 CAPEX Tendency
There are 13 pairs of independent and dependent variables on the macro-level that show a
correlation.
7.4.3.2.2 INDUSTRIAL POLICY
Three dominant patterns can be identified when looking at the macro-variables. The first is tied to
the issue of local content and, therefore, related to industrial policy. It appears that higher local
content leads to lower revenues and lower cash flow. Both correlations are not statistically
significant, but the tendencies are inherent in the collected data. How can these mechanisms be
explained? The negative correlation of local content vs. revenues can be interpreted in the way
that the more local content is contained in the products, the less technologically advanced is the
product – and in conclusion smaller revenues are achieved. This is because the technological
standards and availability in South Africa are not on the same level as in developed countries.
Furthermore, this means that products with a high local content can either not be used in the
current vehicle models or cover the „old technology‟ parts in the vehicles, which means that
projects and, therefore, revenues are restricted. The negative correlation of local content to cash
flow can be explained by the fact that the supplier industry has to develop the local supply chain to
be in a position to compete in an international environment. So the more local content a top
product of a South African automotive component supplier contains, the more development in the
local supply chain is needed. Hence, because this development needs to be financed from the
firm‟s cash flow the correlation to the local content is negative.
Another significant correlation can be identified between the social commitment (cost for BEE,
HIV/AIDS, etc.) and the capital expenditure (CAPEX) of a firm. The positive dependency between
these variables means the higher the cost for social commitment, the higher the capital
expenditure of the firm. Again, it can be argued that the adaptation to and the requirements of the
specific environment need investment in the organisation, which is financed out of the cash flow of
the firm.
Stellenbosch University http://scholar.sun.ac.za

149
7.4.3.2.3 INFRASTRUCTURE AND LOGISTICS
The second pattern is related to logistics and infrastructure. Seven correlations can be identified
with regard to this pattern. Five of these correlations are related to the perception of the South
African infrastructure compared to the infrastructure in developed countries. The perception of the
South African shipping infrastructure correlates positively with the return on investment of the firms
in a significant way and to the cash flow and the capital expenditure with a tendency. Additionally,
the perception of the South African road infrastructure correlates significantly with the net income
and the perception of the South African rail infrastructure relates with a tendency to the cash flow
of the firms. What does this mean and how can it be interpreted? Obviously, it is inappropriate to
draw conclusions from a perception about an issue and the hard facts of financial figures.
Nevertheless, a relation can be built up in the sense that a perception leads to the way in which the
firms (and their managers) cope with disadvantages. So why does a better perception about the
South African shipping infrastructure lead to better financial performance? One argument is that
the firms that cope with the disadvantages achieve better solutions to overcome the inherent
issues. This could mean that these companies accept the disadvantages and work their way
around them or invest in solutions to overcome the shortfalls. In conclusion, it can be stated that
despite the general perception that the South African infrastructure is inferior to developed
countries (see paragraph 7.4.2.3.2), the suppliers that perceive the state of the infrastructure better
perform better in the abovementioned financial measures.
The other two measures that relate to the logistics and infrastructure pattern are tied to the relative
logistics cost to revenues. The first significant correlation is found between the relative logistics
cost and revenues, stating that there is a positive relationship for these measures. This means the
higher the relative logistics cost to revenues, the higher the revenues of the firm. This phenomenon
can be explained by the fact that logistics cost increases faster than revenues. Therefore, it can be
argued that there must be a function of logistics cost and revenues whereby logistics costs tend to
increase independently and more rapidly than the revenues of a firm. Corresponding to this finding
a positive correlation of relative logistic cost and capital expenditure can be found. This means the
higher the relative logistics cost, the higher the capital expenditure of a firm. An interpretation is
that firms invest in logistics solutions in order to reduce their relative logistics cost. This investment
increases the capital expenditure of the firms.
In conclusion, it can be argued that the infrastructural issues in South Africa are a factor for the
economic performance and sustainability of the automotive component suppliers, as next to the
perceptive relationships the relative logistics cost shows an unexpected function, which cannot
only be explained by South Africa‟s geographical disadvantage.
Stellenbosch University http://scholar.sun.ac.za
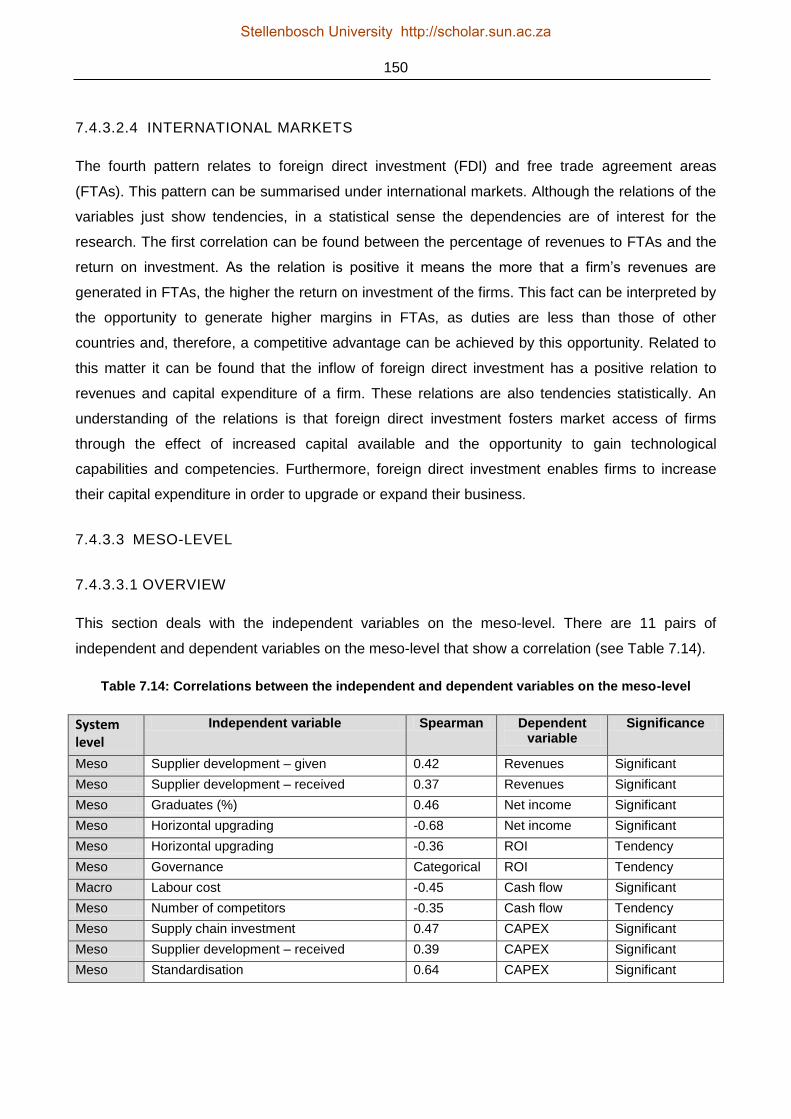
150
7.4.3.2.4 INTERNATIONAL MARKETS
The fourth pattern relates to foreign direct investment (FDI) and free trade agreement areas
(FTAs). This pattern can be summarised under international markets. Although the relations of the
variables just show tendencies, in a statistical sense the dependencies are of interest for the
research. The first correlation can be found between the percentage of revenues to FTAs and the
return on investment. As the relation is positive it means the more that a firm‟s revenues are
generated in FTAs, the higher the return on investment of the firms. This fact can be interpreted by
the opportunity to generate higher margins in FTAs, as duties are less than those of other
countries and, therefore, a competitive advantage can be achieved by this opportunity. Related to
this matter it can be found that the inflow of foreign direct investment has a positive relation to
revenues and capital expenditure of a firm. These relations are also tendencies statistically. An
understanding of the relations is that foreign direct investment fosters market access of firms
through the effect of increased capital available and the opportunity to gain technological
capabilities and competencies. Furthermore, foreign direct investment enables firms to increase
their capital expenditure in order to upgrade or expand their business.
7.4.3.3 MESO-LEVEL
7.4.3.3.1 OVERVIEW
This section deals with the independent variables on the meso-level. There are 11 pairs of
independent and dependent variables on the meso-level that show a correlation (see Table 7.14).
Table 7.14: Correlations between the independent and dependent variables on the meso-level
System level
Independent variable Spearman Dependent variable
Significance
Meso Supplier development – given 0.42 Revenues Significant
Meso Supplier development – received 0.37 Revenues Significant
Meso Graduates (%) 0.46 Net income Significant
Meso Horizontal upgrading -0.68 Net income Significant
Meso Horizontal upgrading -0.36 ROI Tendency
Meso Governance Categorical ROI Tendency
Macro Labour cost -0.45 Cash flow Significant
Meso Number of competitors -0.35 Cash flow Tendency
Meso Supply chain investment 0.47 CAPEX Significant
Meso Supplier development – received 0.39 CAPEX Significant
Meso Standardisation 0.64 CAPEX Significant
Stellenbosch University http://scholar.sun.ac.za

151
7.4.3.3.2 LABOUR MARKET
The pattern that can be identified is labour, or more specifically the labour market. A significant
negative correlation is given between the perception of labour cost and a firm‟s cash flow. This fact
could be interpreted that the more the firm‟s (or the leaders of the businesses) experience that the
labour cost of South Africa is unfavourable in terms of a comparative advantage to the developed
countries, the more they invest in automation of their processes. This investment is financed out of
their cash flow. The question that can be raised in this relation is whether it makes sense to
upgrade in automation and processes and replace manual work in an environment that still has an
advantage in terms of labour cost compared to the major automotive countries in the developed
world. In fact, the answer can only be given in combination with the requirements of the lead firms
in the automotive industry. These lead firms request high product and process standards with
regard to quality. Therefore, automation with the simultaneous replacement of manual labour might
be needed to compete in the global automotive value chain.
Additionally, the percentage of graduates in a firm correlates positively with the net income in a
significant way. This finding can be interpreted in the sense that a higher level of education in the
firm enables it to raise the value-add of its products and, therefore, earn more net income. As the
percentage of graduates in the workforce is directly related to the absolute amount of net income
this fact translates into a competitive advantage for the particular firm.
7.4.3.3.3 VALUE CHAIN
A new pattern is connected to issues in the value chain. This pattern is not only found for variables
on the meso-level, but is also continued for variables on the micro-level. The first relation relates to
the cost of standardisation for products and quality in dependence to the capital expenditure of a
firm. This positive correlation states that the greater the cost a firm has for standardisation issues,
the higher the capital expenditure. This dependence is explained in the sense that standardisation
in quality and product is connected to investment in processes and automation.
The next dependency shows the effect of competition to the cash flow a firm. It states that the
higher the number of competitors, the less the cash flow of a firm. This negative relation implies
that more competition leads to more expenses of the firm and, therefore, less cash flow. As these
expenses cannot be qualified, a further conclusion than the general relationship pointed out before
is out of reach.
The third relation that can be pointed out from the dataset is of a categorical nature. The type of
value chain governance in which the firms operate is related to the return on investment of a firm.
Although the correlation between this pair of variables is a tendency only, the relation is of high
Stellenbosch University http://scholar.sun.ac.za

152
interest for the research. Figure 7.5 points out the relation of the categories of value chain
governance to the return on investment. It can be determined that the return on investment of a
firm increases in relation to the following types of value chain governance: captive → modular →
market → relational. Why is the relational type of value chain governance favourable in terms of
return on investment? In theory, the relational type of governance is characterised by a higher
degree of coordination and power asymmetry than the market or modular type of governance,
which makes them more dependent on a specific customer. This dependency normally leads to
financial pressures, as the lead firms are dictating the prices. Therefore, it can be assumed that the
finding derives from the power- and activity-shift in the automotive value chain. OEMs divert
activities and, therefore, coordination efforts to the suppliers of choice and bind them in a bi-
directional relationship. The increased efforts of the supplier are rewarded, which leads to an
increased return on investment of the supplier.
Figure 7. 5: ANOVA analysis for the type of value chain governance in relation to ROI
The other relations that belong to the value chain pattern are connected to horizontal upgrading of
a firm. The data shows a significant negative correlation between the number of horizontal
upgrades and the net income of a firm. Additionally there is a tendency that the horizontal
upgrades also influence the return on investment negatively. These correlations mean that the
more horizontal upgrades an automotive component supplier deploys, the less net income and
return on investment the firm achieves. How can this fact be explained and interpreted? It can be
Stellenbosch University http://scholar.sun.ac.za

153
assumed that the diversification of the product portfolio has significant influences on the overall
financial performance of a firm. This could be for two reasons. The first is that the new business
needs to ramp up (especially as the data show the upgrades in the last three years) to be
financially worthwhile; the second reason could be that the new product category is not adding
value to the company‟s business.
7.4.3.3.4 SUPPLY CHAIN
The next pattern that can be identified is related to supply chain activities of the South African
automotive component suppliers. Three of the four correlations are connected to the matter of
supplier development – either in the form of received activities of the firms‟ customers or in self-
deployed activities to their own supply chain. A significant positive correlation can be found
between received and given supplier development activities and the revenues of a firm. This
means the more supplier development the firms have received or given, the higher the revenues of
these firms. An interpretation is that the development of the downstream and upstream value chain
of a particular component supplier has positive influences on the business of these companies.
This can be explained by the impact of supplier development on the capabilities and competencies,
which lead to increased acknowledgement by the lead firms in terms of awarded contracts. The
third correlation associated with supplier development relates to an increasing capital expenditure
the more supplier development the firms receive. This fact can be explained by the demands that
are involved with supplier development. The supplier development activities are likely to include
upgrades processes in order to increase quality, reliability and flexibility of the supplier. Therefore,
the „developed‟ company has to invest and its capital expenditure increases.
In direct relation to this fact stands the correlation of investment in supply chain and the capital
expenditure of a firm. The significant positive correlation states that the more investment in supply
chain activities a firm has, the more the capital expenditure. This seems logical, as upgrades in
processes and methods with regard to supply chain improvement need investment.
Stellenbosch University http://scholar.sun.ac.za
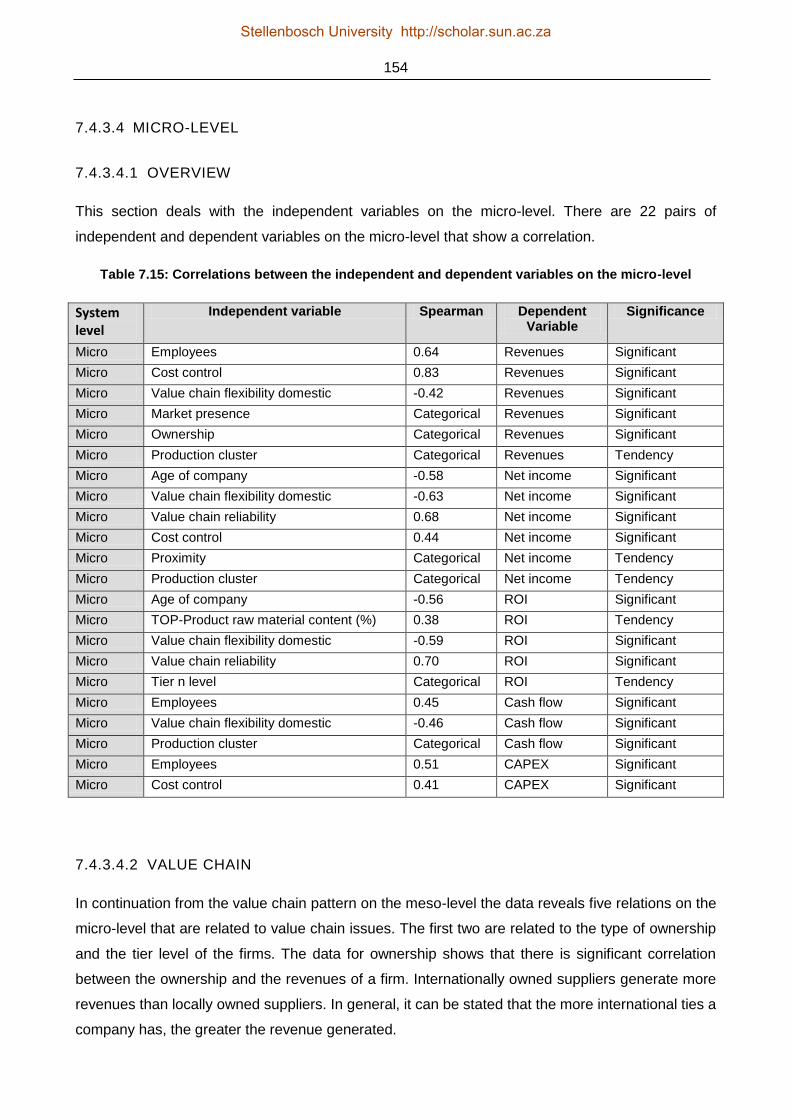
154
7.4.3.4 MICRO-LEVEL
7.4.3.4.1 OVERVIEW
This section deals with the independent variables on the micro-level. There are 22 pairs of
independent and dependent variables on the micro-level that show a correlation.
Table 7.15: Correlations between the independent and dependent variables on the micro-level
System level
Independent variable Spearman Dependent Variable
Significance
Micro Employees 0.64 Revenues Significant
Micro Cost control 0.83 Revenues Significant
Micro Value chain flexibility domestic -0.42 Revenues Significant
Micro Market presence Categorical Revenues Significant
Micro Ownership Categorical Revenues Significant
Micro Production cluster Categorical Revenues Tendency
Micro Age of company -0.58 Net income Significant
Micro Value chain flexibility domestic -0.63 Net income Significant
Micro Value chain reliability 0.68 Net income Significant
Micro Cost control 0.44 Net income Significant
Micro Proximity Categorical Net income Tendency
Micro Production cluster Categorical Net income Tendency
Micro Age of company -0.56 ROI Significant
Micro TOP-Product raw material content (%) 0.38 ROI Tendency
Micro Value chain flexibility domestic -0.59 ROI Significant
Micro Value chain reliability 0.70 ROI Significant
Micro Tier n level Categorical ROI Tendency
Micro Employees 0.45 Cash flow Significant
Micro Value chain flexibility domestic -0.46 Cash flow Significant
Micro Production cluster Categorical Cash flow Significant
Micro Employees 0.51 CAPEX Significant
Micro Cost control 0.41 CAPEX Significant
7.4.3.4.2 VALUE CHAIN
In continuation from the value chain pattern on the meso-level the data reveals five relations on the
micro-level that are related to value chain issues. The first two are related to the type of ownership
and the tier level of the firms. The data for ownership shows that there is significant correlation
between the ownership and the revenues of a firm. Internationally owned suppliers generate more
revenues than locally owned suppliers. In general, it can be stated that the more international ties a
company has, the greater the revenue generated.
Stellenbosch University http://scholar.sun.ac.za
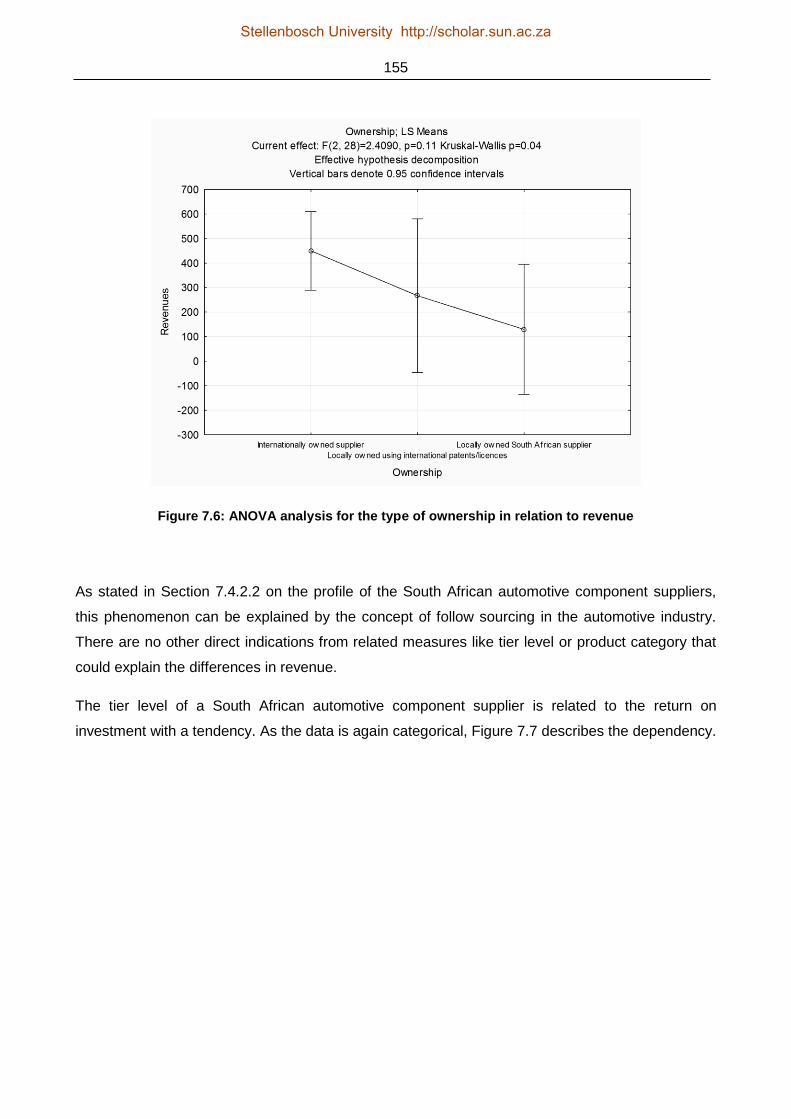
155
Figure 7.6: ANOVA analysis for the type of ownership in relation to revenue
As stated in Section 7.4.2.2 on the profile of the South African automotive component suppliers,
this phenomenon can be explained by the concept of follow sourcing in the automotive industry.
There are no other direct indications from related measures like tier level or product category that
could explain the differences in revenue.
The tier level of a South African automotive component supplier is related to the return on
investment with a tendency. As the data is again categorical, Figure 7.7 describes the dependency.
Stellenbosch University http://scholar.sun.ac.za
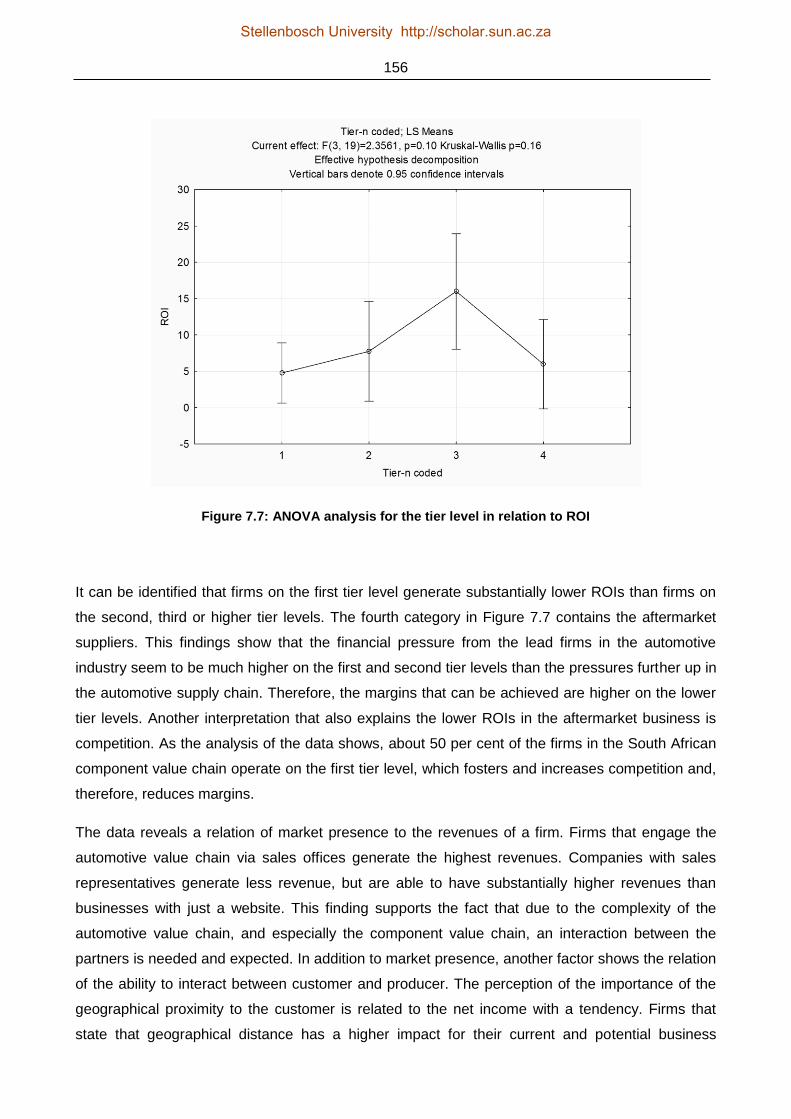
156
Figure 7.7: ANOVA analysis for the tier level in relation to ROI
It can be identified that firms on the first tier level generate substantially lower ROIs than firms on
the second, third or higher tier levels. The fourth category in Figure 7.7 contains the aftermarket
suppliers. This findings show that the financial pressure from the lead firms in the automotive
industry seem to be much higher on the first and second tier levels than the pressures further up in
the automotive supply chain. Therefore, the margins that can be achieved are higher on the lower
tier levels. Another interpretation that also explains the lower ROIs in the aftermarket business is
competition. As the analysis of the data shows, about 50 per cent of the firms in the South African
component value chain operate on the first tier level, which fosters and increases competition and,
therefore, reduces margins.
The data reveals a relation of market presence to the revenues of a firm. Firms that engage the
automotive value chain via sales offices generate the highest revenues. Companies with sales
representatives generate less revenue, but are able to have substantially higher revenues than
businesses with just a website. This finding supports the fact that due to the complexity of the
automotive value chain, and especially the component value chain, an interaction between the
partners is needed and expected. In addition to market presence, another factor shows the relation
of the ability to interact between customer and producer. The perception of the importance of the
geographical proximity to the customer is related to the net income with a tendency. Firms that
state that geographical distance has a higher impact for their current and potential business
Stellenbosch University http://scholar.sun.ac.za
157
generate higher net income than firms that think the impact is medium. This fact supports the
finding from above with regard to the market presence of the firms. Although it is only a perception
that is used to analyse the relationship of the independent and dependent variables, it nevertheless
shows the importance of the relation between customer and producer in general.
In addition to the above findings, it can be identified that the affiliation to an automotive cluster is
related to the revenue, the net income and the cash flow a firm. Although the first two
dependencies are by trend, this agglomeration of correlations shows the importance of clusters in
the automotive industry. The data shows the same mechanism of relation for all three pairs of
variables: when firms are affiliated to a cluster they generate higher revenues, higher net income
and have a better cash flow. This finding adds to the statements from above, as again it seems to
be compulsory that the customers in the automotive component value chain not only expect to be
supplied with parts, but also to be closely linked to their suppliers through relation- and information
management.
7.4.3.4.3 SUPPLY CHAIN
With regard to the supply chain pattern, one further relationship can be identified on the micro-
level. The raw material content of the top product is positively correlated to the return on
investment of a firm by trend. This means that the higher the raw material content of a top product
of a component supplier, the higher the return on investment of the firm. An explanation of this
relationship is that the production of products with high raw material content is favourable for the
business because the raw material supply chain in South Africa offers advantages in terms of
proximity and sources. As explained earlier in the research with the example of the catalytic
converter industry, South Africa‟s wealth of raw-material resources can be advantageous for the
component suppliers when it comes to distances to the sources of the specific raw material.
7.4.3.4.4 INTERNAL VALUE CHAIN
The following correlations are value chain measures. In order to differentiate these dependencies,
which relate to the operational performance of a firm, from the general value chain measures it was
chosen to use the internal value chain as a pattern in this case. In general it can be found that the
cost control, the value chain flexibility and the value chain reliability show correlations with the
independent variables. All the dependencies are statistically significant.
The first correlation is associated with the cost control of the firm, which is measured by total
inventory levels (raw material, work in progress, finished goods). This independent variable is
positively correlated to the revenues, net income and capital expenditure of a firm. The relation to
revenues and capital expenditure can be explained by the fact that the higher the revenue the firm
Stellenbosch University http://scholar.sun.ac.za
158
generate, the higher the inventory levels, as stocks increase as does capital expenditure, as more
investment is needed to support the sustainability of production and sales. The indication from the
previous findings and conclusion can also explain the increase in net income. As this variable is
measured in absolute numbers, it seems fair to conclude that increasing inventory levels are
caused by increasing revenue and whenever the revenue is profitable the net income must
increase as well.
The second correlation relates to value chain flexibility, which is measured in lead times from
production to domestic and export customers. Although both types of customers are measured, the
correlations only appear for the domestic customers. The correlations for the domestic lead times
are statistically significant and negatively correlated in all cases. It can be found that the domestic
lead time correlates with revenue, net income, return on investment and cash flow of the South
African automotive component suppliers. The negative correlation implies that the less lead time
the firms have, the more the dependent measures increase in value. Therefore, it can be
concluded that shorter lead times are rewarded in the automotive industry. It appears that lead
time is an important variable due to concepts of just in sequence and just in time in the automotive
value chain.
The third correlation is tied to value chain reliability. This variable is measured in on-time delivery
to customers, and relates in a statistically significant way to the net income and return on
investment of the component suppliers. The positive relation shows that the greater the percentage
of on-time delivery, the higher the net income and return on investment of the firms. This fact
continues the trend from above, as the current logistics and production concepts rely on reliable
delivery. If a certain percentage of on-time delivery is not achieved, then the entire automotive
value chain is at risk. Therefore, performance in this point is consequently rewarded in terms of
business performance.
Stellenbosch University http://scholar.sun.ac.za

159
7.4.3.4.5 COMPANY CHARACTERISTICS
Although the following relations are tied to the pattern of labour and the labour market, their origins
are at the micro-level of a firm. The age of a company is significantly negatively related to the net
income and return on investment of the business. This means the older the company, the less net
income and return on investment achieved. So the question is why do older companies generate
less net income and are less profitable? An explanation is the older workforce of those companies.
As these companies have been in the business for at least more than a decade, their workforce is
older (and more experienced) than the workforce of younger companies. This implies that the
employees of an older firm earn higher wages and salaries and, therefore, the firm has higher
expenses for this cost factor.
The following three pairs of variables are more related to size than to financial performance and
sustainability. The data shows that the number of employees is positively and statistically
significant to the revenues, cash flow and capital expenditure of a firm. This means the more
employees a firm has, the more the value of the three dependent variables increases. As
especially the relationship between the number of employees and revenues is a function of a firm‟s
size, it also indicates that manual labour is used in a proportional way in the companies. This is
because an increase in revenues could also happen without a significant growth in employees
when automation is used to rationalise the effects of an increase in production capacities.
Therefore, the correlation to capital expenditure must be directly related to that issue, as high
capital expenditure indicates the extension of capacities. This does not mean that an increase in
revenue eliminates the possibility of a simultaneous increase in capital expenditure, but it means
that it is likely that the capital expenditure is not used for automation. The correlation between
number of employees and cash flow indicates that manual labour is still a large factor in the South
African automotive industry and it profitability – at least in terms of cash flow – as well. Therefore, it
can be concluded that the number of employees not only points towards the size of a firm, but is a
signal for the degree of manual labour and the tendency of automation in a firm.
7.4.3.5 SYNTHESIS
The key findings from the inferential statistics are illustrated in the following overview (see Table
7.16). In order to use the suggested structure from the introduction of this section, the findings are
related to the attributes and organised according to the governance levels.
Stellenbosch University http://scholar.sun.ac.za
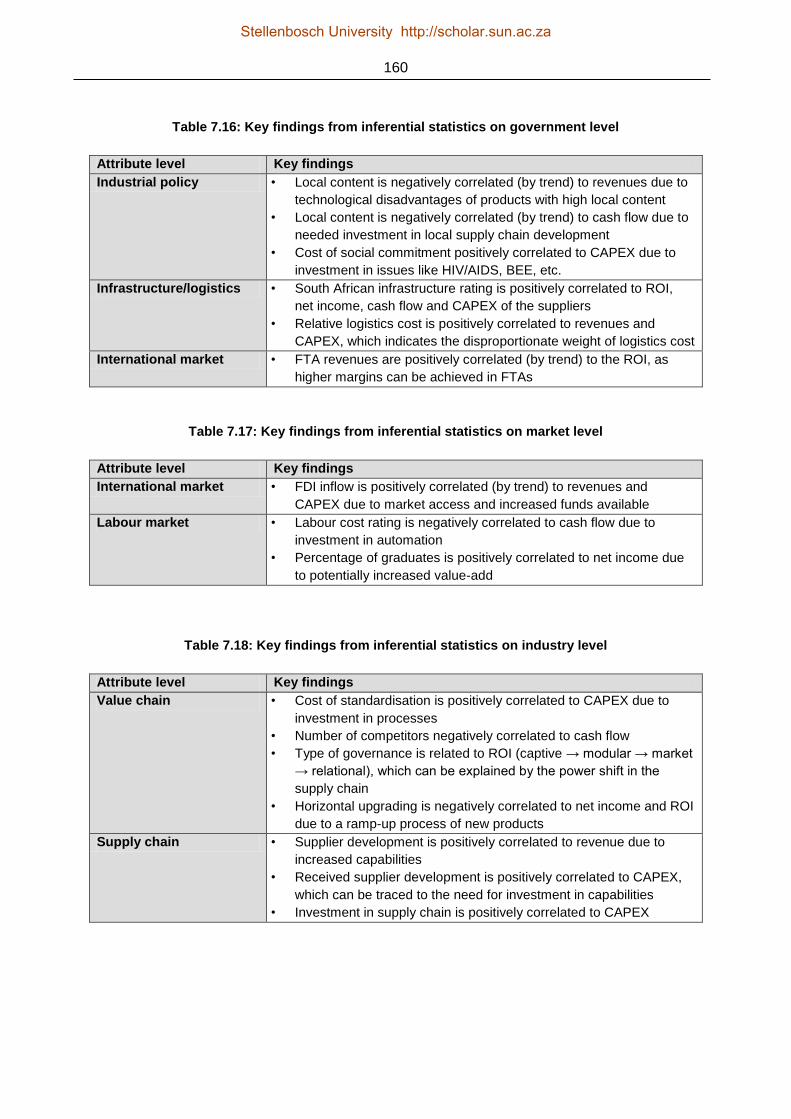
160
Table 7.16: Key findings from inferential statistics on government level
Attribute level Key findings
Industrial policy • Local content is negatively correlated (by trend) to revenues due to
technological disadvantages of products with high local content
• Local content is negatively correlated (by trend) to cash flow due to
needed investment in local supply chain development
• Cost of social commitment positively correlated to CAPEX due to
investment in issues like HIV/AIDS, BEE, etc.
Infrastructure/logistics • South African infrastructure rating is positively correlated to ROI,
net income, cash flow and CAPEX of the suppliers
• Relative logistics cost is positively correlated to revenues and
CAPEX, which indicates the disproportionate weight of logistics cost
International market • FTA revenues are positively correlated (by trend) to the ROI, as
higher margins can be achieved in FTAs
Table 7.17: Key findings from inferential statistics on market level
Attribute level Key findings
International market • FDI inflow is positively correlated (by trend) to revenues and
CAPEX due to market access and increased funds available
Labour market • Labour cost rating is negatively correlated to cash flow due to
investment in automation
• Percentage of graduates is positively correlated to net income due
to potentially increased value-add
Table 7.18: Key findings from inferential statistics on industry level
Attribute level Key findings
Value chain • Cost of standardisation is positively correlated to CAPEX due to
investment in processes
• Number of competitors negatively correlated to cash flow
• Type of governance is related to ROI (captive → modular → market
→ relational), which can be explained by the power shift in the
supply chain
• Horizontal upgrading is negatively correlated to net income and ROI
due to a ramp-up process of new products
Supply chain • Supplier development is positively correlated to revenue due to
increased capabilities
• Received supplier development is positively correlated to CAPEX,
which can be traced to the need for investment in capabilities
• Investment in supply chain is positively correlated to CAPEX
Stellenbosch University http://scholar.sun.ac.za

161
Table 7.19: Key findings from inferential statistics on corporate level
Attribute level Key findings
Value chain • Equity ownership is related to revenue; more international equity
leads to more revenue due to access to networks
• Tier level is related to ROI: third → second → aftermarket → first in
decreasing order, which indicates increasing price pressure on the
first tier level
• Market presence is related to revenue; sales offices generate
higher revenue due to informational flows
• Geographical proximity is positively related to net income, which
indicates advantageous circumstances of nearby locations
• Membership in production cluster has positive impact on revenue,
net income and cash flow (follows the geographical proximity issue)
Supply chain • Raw material content is positively correlated to ROI due to the
advantages of the local raw material supply chain
Internal value chain • Cost control is positively correlated to revenue, net income and
CAPEX
• Domestic lead time is negatively correlated to revenue, net income,
ROI and cash flow, which implies an advantage of short delivery
times
• Delivery reliability is positively correlated to net income and ROI,
which follows the same pattern as lead time
Company characteristics • Age of a company is negatively correlated to net income and ROI,
which could be related to an older workforce (and, therefore, more
expensive)
• Number of employees is positively correlated to revenue, cash flow,
and CAPEX mainly relates to the size of a firm
The following independent variables do not show any correlation to the dependent variables. As it
cannot be concluded that these variables can be disqualified from the conceptual model, a short
annotation for each variable is provided in order to assess the situation:
- HR development – seems to play a role on the national education/skill level, but is not
directly related on a firm level.
- Product/process innovation – seems to play a role on the industry level, but is not directly
related on firm level.
- Capacity utilisation – developing countries are not as over-utilised as developed countries,
therefore no correlation.
- Quality – is a basic for market access, but not rewarded in financial terms.
- Product category – no differences in economic performance of old and new technology can
be seen.
- Market share – economic sustainability is not directly dependent on market share.
Stellenbosch University http://scholar.sun.ac.za

162
- OEM-supplier linkages – the informational linkages in the industry and between OEMs and
suppliers are not directly linked to economic sustainability.
- Product complexity – the complexity of the product in terms of standard vs. specialised
features does not influence the financial figures of a company.
- Product modularity – the modularity of the product in terms of components vs. modules
does not influence the financials of a company.
The following variables were identified in the qualitative data to be of a major impact on the
economic sustainability, but this direction cannot be recognised and supported in terms of the
quantitative findings. Therefore, it can be concluded that these variables play a major role for the
stakeholders in the South African automotive component industry and may have implications for
the future:
- Subsidies
- Domestic demand
- Local technology availability
- Labour flexibility
The conclusion also aggregates the identified and discussed correlations. Therefore, the
correlations from the above are sorted according to the attributes as introduced in the beginning of
the findings section. The summary is presented in Figure 7.8.
Figure 7.8: Correlations from an attribute to the group of dependent variables
Stellenbosch University http://scholar.sun.ac.za
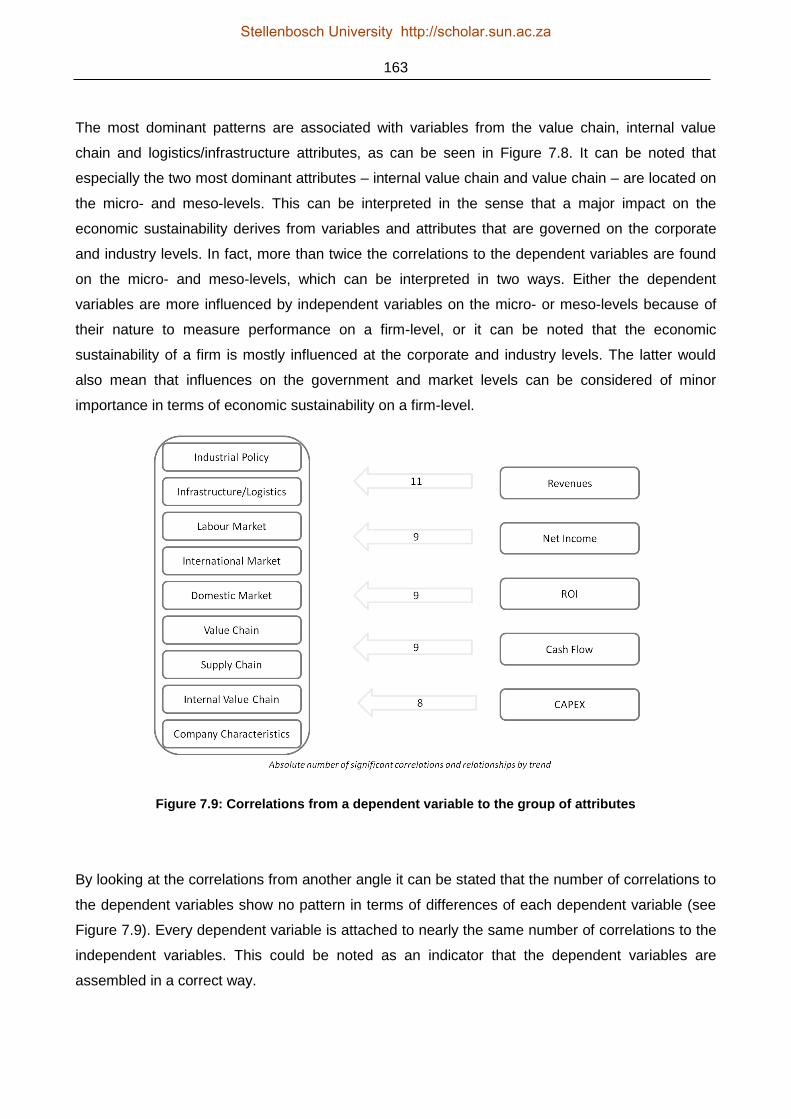
163
The most dominant patterns are associated with variables from the value chain, internal value
chain and logistics/infrastructure attributes, as can be seen in Figure 7.8. It can be noted that
especially the two most dominant attributes – internal value chain and value chain – are located on
the micro- and meso-levels. This can be interpreted in the sense that a major impact on the
economic sustainability derives from variables and attributes that are governed on the corporate
and industry levels. In fact, more than twice the correlations to the dependent variables are found
on the micro- and meso-levels, which can be interpreted in two ways. Either the dependent
variables are more influenced by independent variables on the micro- or meso-levels because of
their nature to measure performance on a firm-level, or it can be noted that the economic
sustainability of a firm is mostly influenced at the corporate and industry levels. The latter would
also mean that influences on the government and market levels can be considered of minor
importance in terms of economic sustainability on a firm-level.
Figure 7.9: Correlations from a dependent variable to the group of attributes
By looking at the correlations from another angle it can be stated that the number of correlations to
the dependent variables show no pattern in terms of differences of each dependent variable (see
Figure 7.9). Every dependent variable is attached to nearly the same number of correlations to the
independent variables. This could be noted as an indicator that the dependent variables are
assembled in a correct way.
Stellenbosch University http://scholar.sun.ac.za
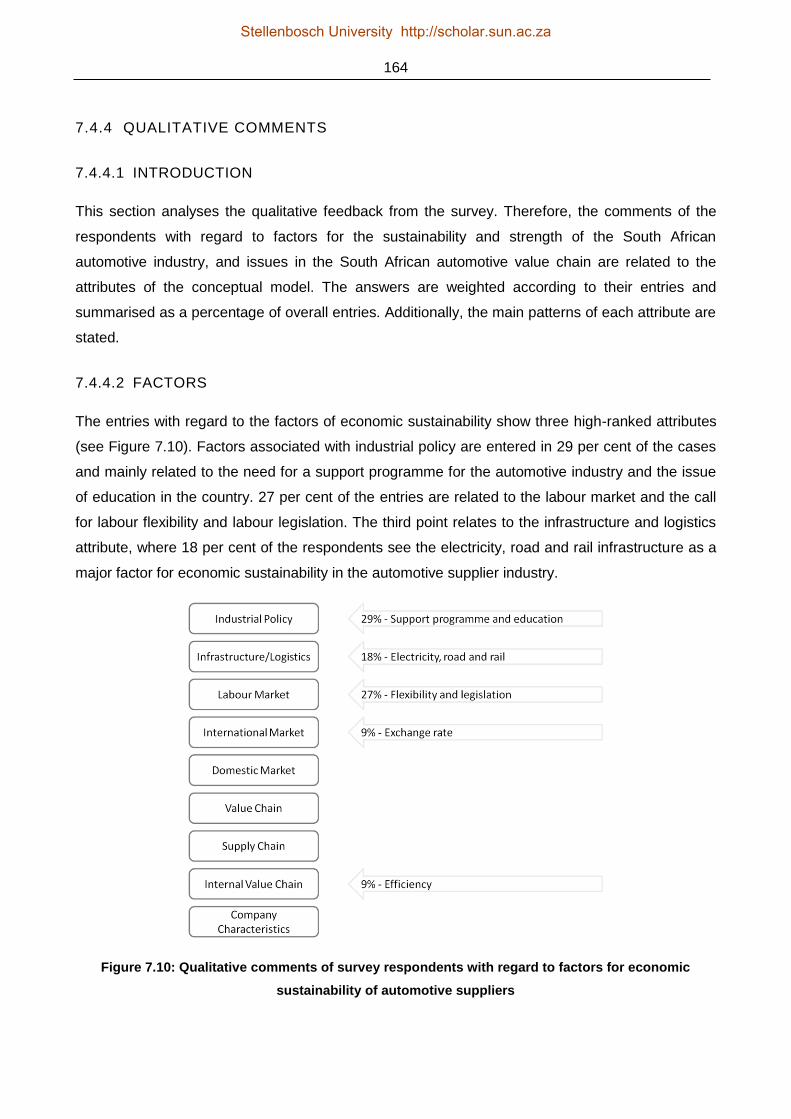
164
7.4.4 QUALITATIVE COMMENTS
7.4.4.1 INTRODUCTION
This section analyses the qualitative feedback from the survey. Therefore, the comments of the
respondents with regard to factors for the sustainability and strength of the South African
automotive industry, and issues in the South African automotive value chain are related to the
attributes of the conceptual model. The answers are weighted according to their entries and
summarised as a percentage of overall entries. Additionally, the main patterns of each attribute are
stated.
7.4.4.2 FACTORS
The entries with regard to the factors of economic sustainability show three high-ranked attributes
(see Figure 7.10). Factors associated with industrial policy are entered in 29 per cent of the cases
and mainly related to the need for a support programme for the automotive industry and the issue
of education in the country. 27 per cent of the entries are related to the labour market and the call
for labour flexibility and labour legislation. The third point relates to the infrastructure and logistics
attribute, where 18 per cent of the respondents see the electricity, road and rail infrastructure as a
major factor for economic sustainability in the automotive supplier industry.
Figure 7.10: Qualitative comments of survey respondents with regard to factors for economic
sustainability of automotive suppliers
Stellenbosch University http://scholar.sun.ac.za

165
7.4.4.3 STRENGTHS
The strengths of the South African automotive industry can be related to five attributes of the
conceptual model (see Figure 7.11). 30 per cent of the entries are related to the internal value
chain of a supplier company. The major advantages of the South African suppliers can be seen in
their production flexibility as well as in their manufacturing quality. 21 per cent of the entries see
South Africa‟s infrastructure with the stable financial system and the good IT infrastructure as a
strength of the automotive industry. The new industry‟s support programme (the Automotive
Production Development Program) and the stable environment in South Africa are seen as another
strength for the local South African automotive component industry. 15 per cent of the entries of
the respondents see the related attribute of industrial policy as a strength. Additionally, the
industry‟s establishment and the presence of international players are regarded as positive
characteristics of the South African automotive industry. Respectively, 12 per cent of the entries
are mentioned regarding the named characteristics.
Figure 7.11: Qualitative comments of survey respondents with regard to strengths of the South
African automotive industry
Stellenbosch University http://scholar.sun.ac.za
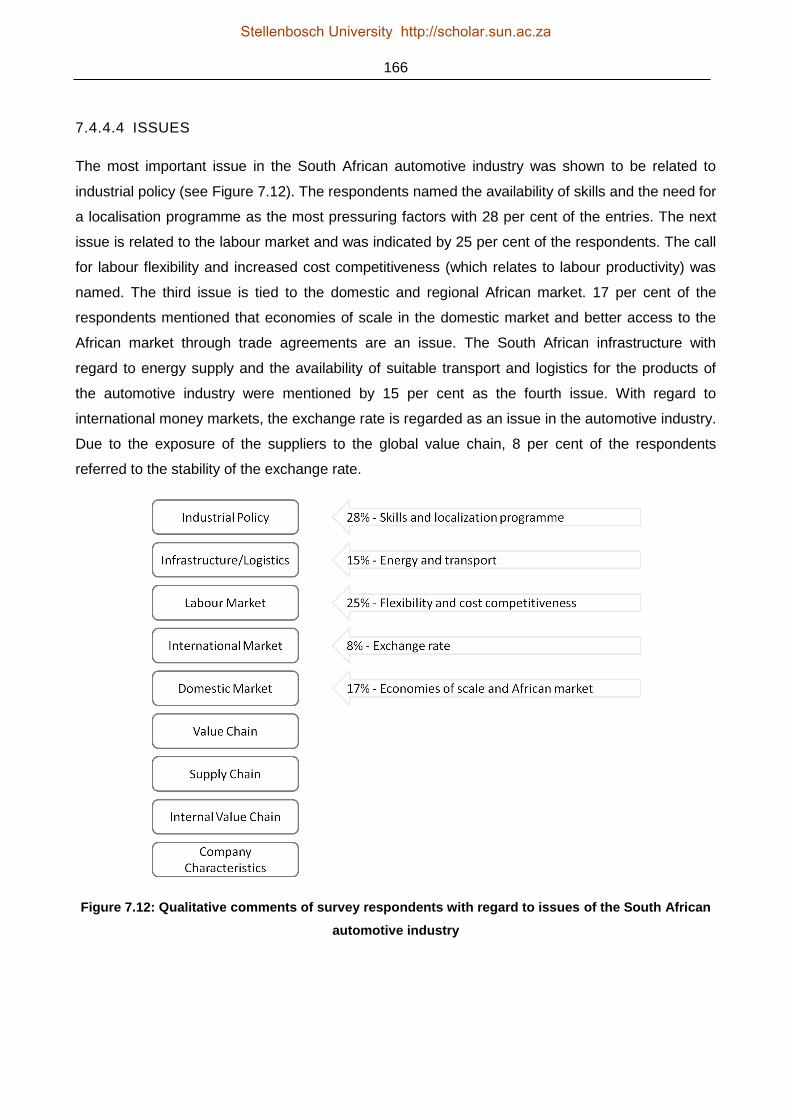
166
7.4.4.4 ISSUES
The most important issue in the South African automotive industry was shown to be related to
industrial policy (see Figure 7.12). The respondents named the availability of skills and the need for
a localisation programme as the most pressuring factors with 28 per cent of the entries. The next
issue is related to the labour market and was indicated by 25 per cent of the respondents. The call
for labour flexibility and increased cost competitiveness (which relates to labour productivity) was
named. The third issue is tied to the domestic and regional African market. 17 per cent of the
respondents mentioned that economies of scale in the domestic market and better access to the
African market through trade agreements are an issue. The South African infrastructure with
regard to energy supply and the availability of suitable transport and logistics for the products of
the automotive industry were mentioned by 15 per cent as the fourth issue. With regard to
international money markets, the exchange rate is regarded as an issue in the automotive industry.
Due to the exposure of the suppliers to the global value chain, 8 per cent of the respondents
referred to the stability of the exchange rate.
Figure 7.12: Qualitative comments of survey respondents with regard to issues of the South African
automotive industry
Stellenbosch University http://scholar.sun.ac.za

167
7.4.4.5 SYNTHESIS
In the qualitative sections, a major role is played by factors and issues on the macro- and meso-
levels, whereas the quantitative data shows that the majority of factors for economic sustainability
are tied to the micro- and meso-levels. There seems to be a difference between the perception of
the stakeholders and the actual data in the automotive value chain. This is quite an interesting fact
and will be discussed further in the next section.
Stellenbosch University http://scholar.sun.ac.za

168
CHAPTER 8
CONCLUSION
8.1 INTRODUCTION
Up until now, the research has described the sustainability problem of local automotive component
suppliers with respect to the South African automotive value chain. The following theories and key
points considering the role of automotive component suppliers have been discussed:
- Trends in the automotive industry with a focus on globalisation and the location of
production
- The South African automotive industry with regard to the current status, historical
development and structural challenges
- The automotive value and supply chain with respect to governance issues
- The market access and upgrading strategies for local suppliers in emerging markets
The theoretical aspects have been used to identify factors for the economic sustainability of local
suppliers in the South African automotive value chain in order to build a conceptual model. The
factors of the conceptual model have been structured according to their system and governance
levels in order to provide a structure on the micro-, meso- and macro-levels of the research
problem. The conceptual model proposes that the factors that are translated into independent
variables have an influence on the dependent variables that constitute economic sustainability.
The model has been assessed and confirmed in the qualitative research. Consequently, the
conceptual model has been tested with modelling data from primary research in the South African
automotive component value chain. The analysis of the data leads to the research objectives
where the influence of the factors on a firm level is assessed. The evaluation of the conceptual
model will be discussed in Section 8.2.
Sections 8.3 and 8.4 deal with the secondary objective of the research, which aims to show factors
for the economic sustainability of automotive component suppliers, which should improve or
change. This is addressed by using the qualitative data. Therefore, the focus group, the semi-
structured interviews and the qualitative data from the survey are analysed according to patterns
with regard to issues in the South African automotive value chain, and particularly the supplier
industry. In combination with the descriptive statistics from the quantitative data the status of the
South African component supplier industry can be shown as well.
The limitations and implications for further research are presented in Section 8.5.
Stellenbosch University http://scholar.sun.ac.za
169
8.2 THE EVALUATION OF THE MODEL
The proposed conceptual model has been tested in two ways:
- Qualitative research: A focus group and semi-structured interviews confirmed the
conceptual model with minor changes. Changes had been recognised especially on the
macro-level, where the influence of industrial policy and other governmental issues were
added. The structure of the model with respect to the system and governance levels is
proven in the qualitative research.
- Quantitative research: A firm-level survey was employed to gather the relevant modelling
data. This data was used to test the influence of the proposed factors on economic
sustainability by analysing the correlations between each independent and dependent
variable. The correlations were used to test the effectiveness of the factors on the
economic sustainability, but not all of the factors could be confirmed. This fact needs further
investigation. Nevertheless, significant and underlying dimensions of local supplier
sustainability were established.
In order to further structure the model, attributes were introduced that were identified by the main
patterns with regard to theory and practice. These latent variables have to be tested and confirmed
in further research. At this stage they are used to decompile the complexity of the conceptual
model. The revised and structured research can be presented in the following illustration (see
Figure 8.1).
Stellenbosch University http://scholar.sun.ac.za

170
Figure 8.1: The model for the sustainability of local suppliers in the South African automotive value
chain
Furthermore, the qualitative research can be used to identify significant and underlying dimensions
on the macro-, meso- and micro-levels of local supplier sustainability. As stated earlier in the
findings section, a conclusion can be made with regard to the major patterns of correlation
between the independent variables (the proposed factors for economic sustainability) and the
dependent variables. Significant correlations can be found on each system and governance level,
which shows that the economic sustainability of automotive component suppliers is influenced by:
- long-term goals on sustainability and growth on a macro-level;
- medium to short-term goals on geographical and sectoral optimisation on the meso-level;
and
- short-term goals on shareholder maximisation on the micro-level.
It can also be concluded that the economic sustainability of an automotive component supplier firm
in South Africa is not only governed (and therefore influenced) by market forces and corporate
performance, but it is also affected by regulations and activities on the government level and
factors that are controlled on the industry level.
Stellenbosch University http://scholar.sun.ac.za
171
In terms of dominant patterns of the influence on the economic sustainability, it can be concluded
that factors connected to the automotive value chain, the corporate performance and the
infrastructural environment play the dominant role.
8.3 IMPLICATIONS FOR THEORY
The research contributes to theory in the following ways:
- The development of a conceptual model where the factors for the economic sustainability of
automotive component suppliers in emerging markets is aggregated and structured.
- The testing of the model in terms of integrity and totality with qualitative industry data.
- The identification of factors that influence the measures of economic sustainability through
primary quantitative industry data.
- The discussion of the status of the South African automotive component suppliers with
regard to the factors of economic sustainability.
The uniqueness of the approach derives from the fact that the relevant parts of the theoretical
aspects are subsumed in an overarching model. This model is developed in order to include and
allow for the specifics of the automotive industry as well as those of emerging markets (in this
case, South Africa). The answers and solutions offered by the research are more tied to the „what‟
is contributing towards the research objective than to the „how‟ of the characteristics of the
research problem. This means that further research is needed to investigate the effectiveness of
the conceptual model. In conclusion, it can be stated that the research summarises the theoretical
aspects with regard to the research problem and builds up a holistic approach as a problem
solution.
An interesting conclusion of the analysis of the qualitative and quantitative data is that the main
patterns differ substantially in direction. The qualitative data identifies factors on the government
level (and, therefore, predominantly on the macro-level) with regard to the economical
sustainability of the South African automotive component suppliers, whereas the quantitative
section of the research points towards factors on the corporate and the industry levels (mainly on
the micro- and meso-levels). This could mean that the subjective interpretation of the stakeholders
from the quantitative research – in this case, the automotive component suppliers – points towards
more governmental regulation and attendance in the South African automotive industry.
Nevertheless, theory and this research tell a different story. The quantitative data shows that the
major factors of economic sustainability derive from the corporate and industry levels and are
accompanied by infrastructural factors on the government level. An answer to this phenomenon
could arise from differences between developing and developed countries. Due to the historical
Stellenbosch University http://scholar.sun.ac.za

172
development of the South African automotive industry and the history of protection of the domestic
industry, the call for governmental support could be inherent in the industry. It must also be stated
that the survival of the South African automotive industry in the medium to long term is at least
partially dependent on government regulations and initiatives, as the quests for economies of scale
and increased competitiveness must be supported by national structures and regulations.
Nevertheless, the immediate responsibility lies with the industry and especially with the OEMs and
suppliers as a major part of the automotive value chain.
8.4 IMPLICATIONS FOR PRACTICE
The following discussion points to the conclusion of the more practical applications of the research.
However, the practical issues are tied to the theoretical implications and will be related to these:
- Local content: Despite the local content requirements and demands for increased local
content by government and industry, the negative relation of local content to revenue and
cash flow of a supplier firm shows another direction. Hence, it must be concluded that the
current dependencies on local content are caused by deficiencies in local supply chain in
terms of technological capabilities.
- Logistics cost: Due to the fact that the South African automotive industry is dependent on
export volumes to achieve sufficient economies of scale, the state of the country‟s transport
infrastructure needs attention. Additionally, the fact that the logistics cost shows a
disproportional function to the revenue of a supplier firm indicates that the cost (and
productivity) of the South African infrastructure providers must be questioned.
- Markets: The research data reveals that locally owned suppliers are more dependent on
the domestic market than internationally owned suppliers and those with incoming foreign
direct investment. These latter two groups make use of their international production and
sales networks, and generate higher export volumes, which make them more independent
in the South African domestic market. Additionally, it can be recognised that the use of
export markets seems to be more efficient when these export markets are located in free
trade agreement areas.
Stellenbosch University http://scholar.sun.ac.za
173
- Value chain positioning and governance: Positive effects on economic sustainability can be
recognised when the supplier is operating on the second or third tier levels (leads to higher
return on investment compared to first tier level or aftermarket). It can also be noted that
higher revenues are generated by suppliers that have more international ties (as mentioned
above), but there is no conclusion on the financial productivity measures with regard to
foreign equity. In terms of value chain governance, the automotive suppliers should try to
establish the relational or market types of governance, as these offer the highest return on
investment expectations. This positioning of the supplier‟s firm in the automotive value
chain must be seen in relation to the types of products which the supplier feeds into the
value chain. The fact that most of the products of the South African automotive suppliers
are on a component basis, and that products by locally owned suppliers also represent
standardised products, puts the suppliers in a specific position in the automotive value
chain. From a value chain governance view, the standardised component relates to the
market type of governance, whereas a specialised component would belong to the
relational type of governance.
- Fragmentation: The location of production and the presence in the market play a
substantial role in supplier sustainability. The research data shows that proximity to
customers, the establishment of sales offices and representatives, and ultimately the
membership in a production cluster have positive implications on the economic
sustainability of a firm in the automotive value chain in South Africa. Especially the cluster
development should be promoted by government and industry in order to achieve
efficiencies through linkages in the supply chain and transfer of capabilities between
international and local suppliers. Additionally it can be found that supplier development
activities are directly related to higher revenues in the industry. On the one hand, these
activities could be related to supplier development and, therefore, the opportunity to
upgrade own capabilities and qualify for the lead firm‟s supply chain. On the other hand, it
could mean that the own supply chain has been developed and, therefore, qualified to
serve into the automotive value chain.
Another contributory factor for practice is presented by pointing out the status of the South African
automotive value chain with the focus on the supplier component industry. By doing this,
conclusions can be made to factors that should change or improve in the immediate environment
of the supplier, as well as to factors that are situated at the industry, market and government
levels.
Stellenbosch University http://scholar.sun.ac.za

174
8.5 LIMITATIONS AND IMPLICATIONS FOR FURTHER RESEARCH
The main limitation of the research derives from the limited data available for the South African
automotive value chain with respect to the component suppliers. In order to overcome this
limitation, primary research was undertaken, but it must be found that the gathered data cannot be
used for the generalisation of the findings. Nevertheless, the findings give clear indications and
direction because of the structure of the respondents and the firms.
Due to the limitations in the completeness of the responses in the survey the analysis of the data is
also limited – and, therefore, the validation of the research by quantitative means. This means that
in general the principal causality of the model and variables is tested. For further analysis with a
regression or factor analysis the data is not satisfactory because of the fact that especially financial
data has not been supplied by the respondents due to company policies and secrecy issues.
In order to solve the issue of limited data it is necessary to get access to or create other data
sources. Only by integrating information from different data sources on the national, industry and
firm levels can a repeatability of the study be achieved. These data sources should also be able to
supply data on the macro- and meso-levels in order to incorporate the factors that cannot be
translated into firm-level variables. The next issue relates to benchmarking figures that are needed
to evaluate the measures for economical sustainability. Access to data from the developed
countries and other emerging markets are needed in order to make judgements and discuss
developments.
In addition to the limitations with regard to the data, there are several research requirements with
regard to the further development of the conceptual model. Despite the complexity of the model, it
should be possible to update the model by integrating new factors and removing old factors. In
addition, it is worthwhile incorporating the OEMs‟ view and environmental aspects into the model.
This should be done in order to cope with the developments in the automotive value chain.
Furthermore, the dependent variables need to be advanced in order to take into account revenue,
cost and financial structures.
As mentioned above, the longitudinal approach of the survey should be used in further research.
This would incorporate the time factor and allow for growth observations. Through this dynamic
approach, implications of the different governance levels could be identified in order to improve the
factors for the economic sustainability.
Stellenbosch University http://scholar.sun.ac.za

175
APPENDIX AND ATTACHMENTS
Appendix A: Discussion guide for Focus Group and Interviews
Produced by: Solutionworkshop (Venetia Amato) and Christian Nitschke
Last Change: 12.10.2010
This guide is to be used during the conducting of the focus groups. It will be used to keep structure
to the group, however if certain topics are raised that need further investigation, this should be
done.
INTRODUCTION (10 min)
Welcome everyone and get each to introduce themselves
Each can explain their positions and how long they have been in their current position
Explain purpose of the study, objectives and duration
GENERAL INDUSTRY PROBE (10 min)
What is the SA automotive industry like at the moment?
o Probe general issues
o Probe the feelings around this
What generally are the opportunities and threats for the SA automotive industry currently and
looking towards the future
How sustainable are local suppliers in this industry?
TRENDS (15 min)
What are the global trends that are currently happening in this industry?
How is this related to SA / Is SA following these trends?
What are the regulation trends that are happening nowadays?
Stellenbosch University http://scholar.sun.ac.za

176
Are there any supplier issues that need addressing locally?
Any infra-structural issues that are affecting the industry locally?
Are major production increases expected with the start of the APDP in 2013? (an estimated
guess)
THE MODEL / INFLUENCES (60 min)
Let us now take a look at the holistic model that is being put forward
o On the right, there is a block – “sustainability of local suppliers” and in there are 3
contributors to economic sustainability, namely: revenue growth, net income growth and
return on investment
o Do we all accept that this is the case and these 3 aspects do all contribute to
sustainability?
If we look at how this model works – there are 3 groups or categories, namely MACRO, MESO
and MICRO
Within each of these is a list of contributing aspects / factors which we need to discuss
Let‟s start on the MACRO level
o What issues are there around government that are impacting on economic sustainability
of this industry (Probe each as depicted on the model)
(probe each as depicted on the model)
Determine whether it does impact?
To what extent it impacts?
What else will impact that is not on this list? In other words, is anything missing
from this list?
Repeat discussion - on the MESO level, what market or Industry issues are there that are
impacting on this industry / influencing it (probe each as depicted on the model)
(probe each as depicted on the model)
Determine whether it does impact?
Stellenbosch University http://scholar.sun.ac.za

177
To what extent does it impact?
What else will impact that is not on this list? In other words, is anything missing
from this list?
On the MICRO level, what issues are there on a corporate level that are impacting on this
industry, influencing it
(probe each as depicted on the model)
Determine whether it does impact?
To what extent it impacts?
What else will impact that is not on this list? In other words, is anything missing
from this list?
What are the influences of the stakeholders (government, OEM, international suppliers,
customers) on the local supplier base
SA MARKET
Is there a viable space for locally owned suppliers in the future SA automotive value chain? /
Does this differ for internationally owned suppliers who distribute locally
What has to be done to increase the competitiveness of locally owned SA automotive suppliers
and how will this be supported?
What are the strategic and operational options for locally owned suppliers in SA?
THE FUTURE
What are the feelings regarding the following:
o Will the local content claims by the OEM‟s be achieved (60 per cent to 80 per cent) and
will the overall competitiveness of the SA market rise with higher local content
Stellenbosch University http://scholar.sun.ac.za

178
o What are the inefficiencies that need to be addressed in the SA automotive value chain
Give examples and describe
How could these be addressed – get specific solutions if possible
Thank respondents for participation
Stellenbosch University http://scholar.sun.ac.za

179
Appendix B: Questionnaire
Stellenbosch University http://scholar.sun.ac.za

180
Stellenbosch University http://scholar.sun.ac.za

181
Stellenbosch University http://scholar.sun.ac.za

182
Stellenbosch University http://scholar.sun.ac.za
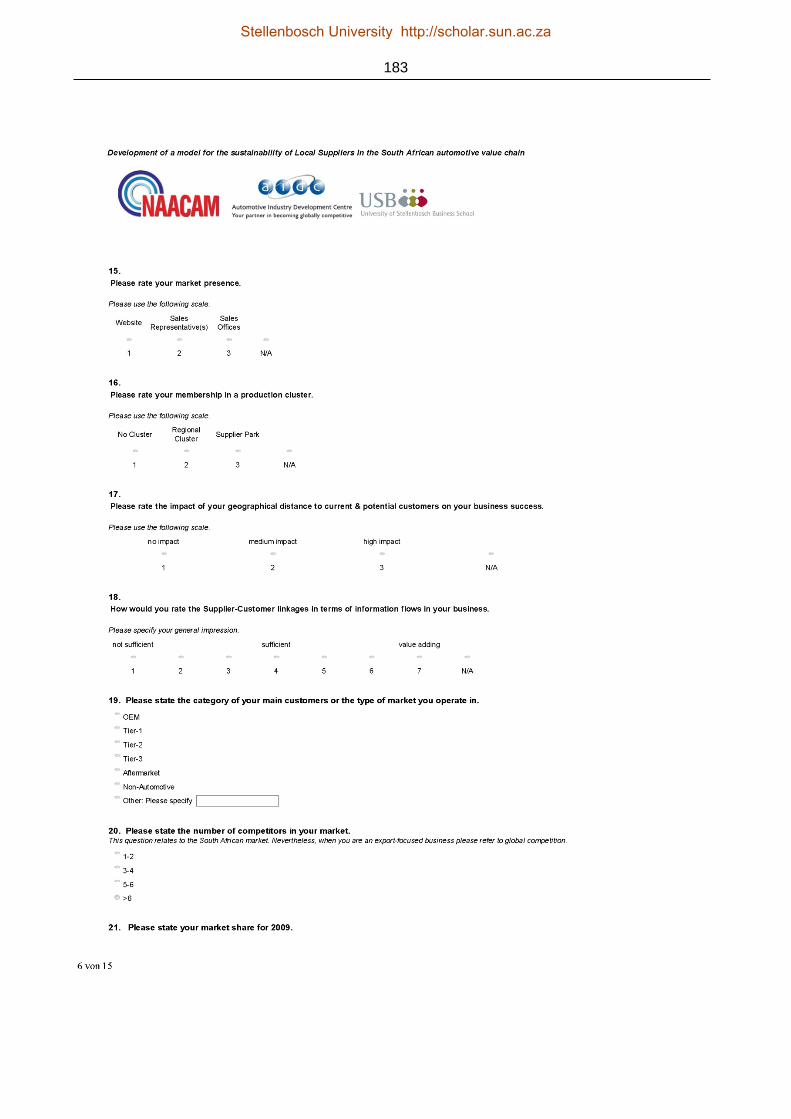
183
Stellenbosch University http://scholar.sun.ac.za

184
Stellenbosch University http://scholar.sun.ac.za

185
Stellenbosch University http://scholar.sun.ac.za
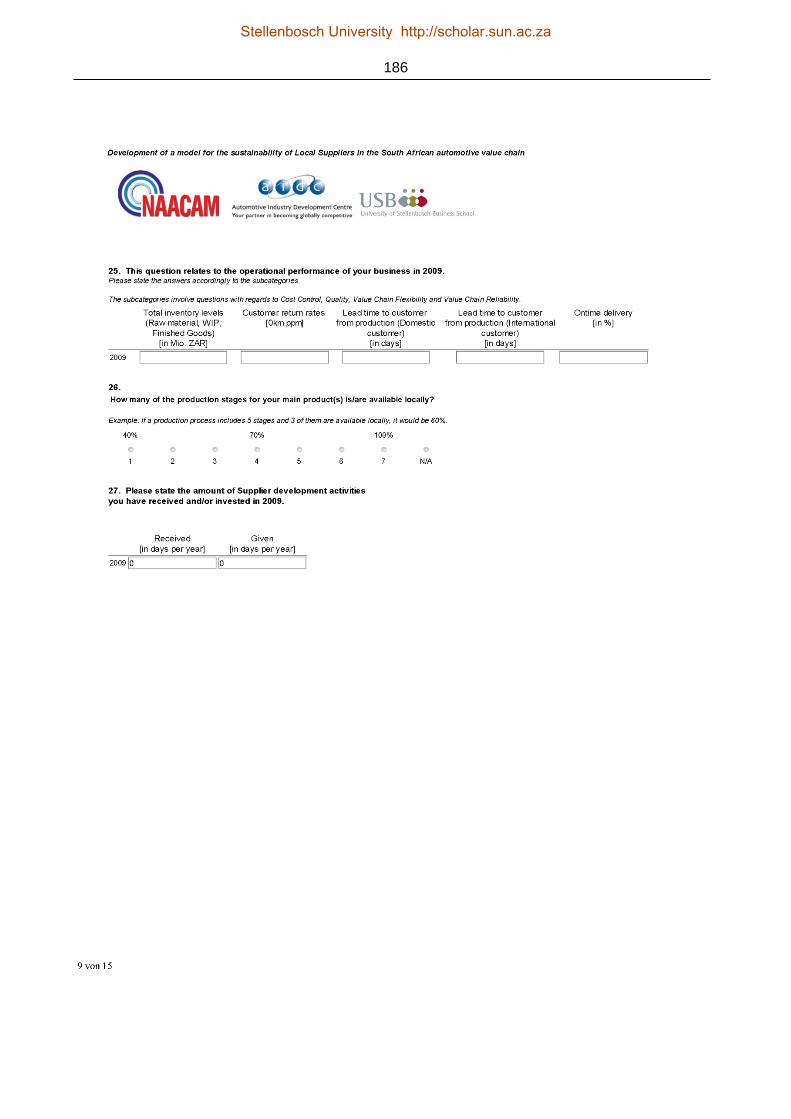
186
Stellenbosch University http://scholar.sun.ac.za
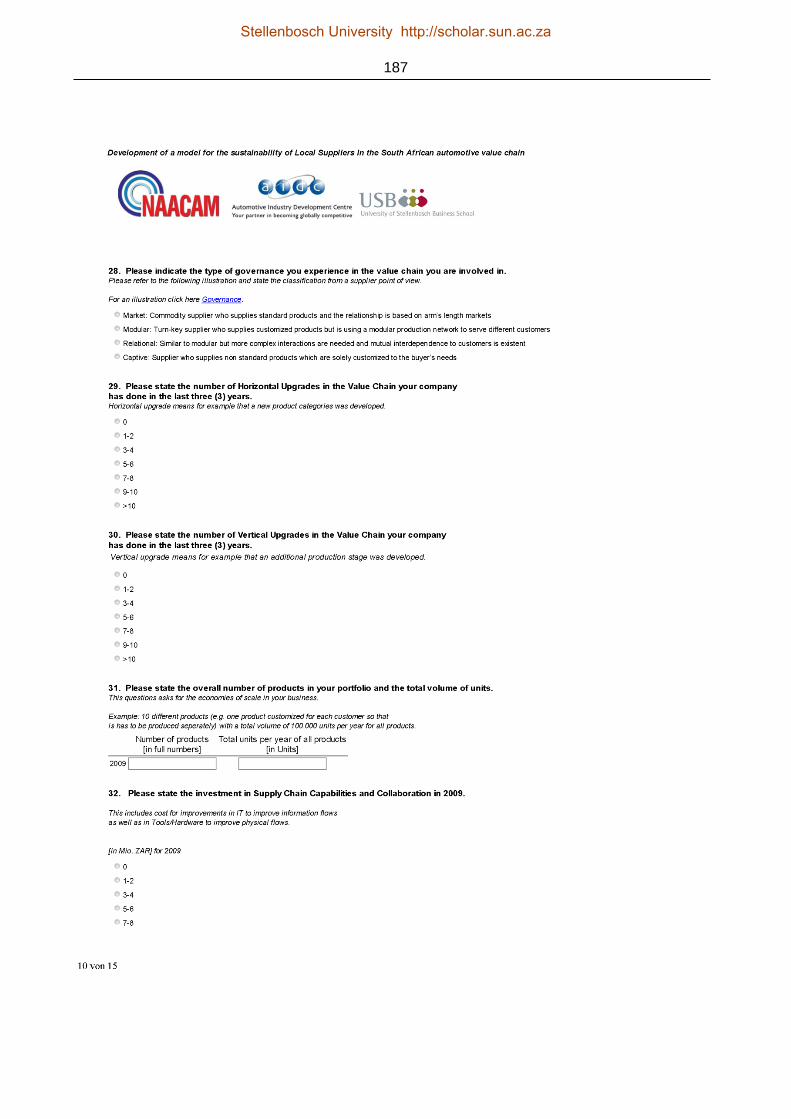
187
Stellenbosch University http://scholar.sun.ac.za

188
Stellenbosch University http://scholar.sun.ac.za

189
Stellenbosch University http://scholar.sun.ac.za

190
Stellenbosch University http://scholar.sun.ac.za
191
Stellenbosch University http://scholar.sun.ac.za

192
Stellenbosch University http://scholar.sun.ac.za

193
BIBLIOGRAPHY
AIDC. 2011. Automotive Industry Development Centre. [Online] available: http://www.aidc.co.za/.
Accessed: 05.07.2011.
Altenburg T. 2006. Governance Patterns in Value Chains and their Development Impact. European
Journal of Development Research, 18(4), 498–521.
Altenburg T. & Meyer-Stamer J. 1999. How to Promote Clusters: Policy Experiences from Latin
America. World Development, 27(9), 1693–1713.
Arndt S. W. & Kierzkowski H. 2001. Fragmentation: Introduction. In S. W. Arndt & H. Kierzkowski
(Eds.), Fragmentation: New production patterns in the world economy. Oxford University Press,
1–16.
Bailey D., De Ruyter, A., Michie J. & Tyler P. 2010. Global restructuring and the auto industry.
Cambridge Journal of Regions, Economy and Society, (3), 311–318.
Barloworld Logistics. 2010. supplychainforesight 2010. [Online] available:
www.supplychainforesight.co.za. Accessed: 12.03.2011.
Barnes J. 2000a. Changing lanes: The political economy of the South African automotive value
chain. Development Southern Africa, 17(3), 401–415.
Barnes J. 2000b. Domestic market pressures facing the South African automotive components
industry. Research report. Durban.
Barnes J. & Kaplinsky R. 2000. Globalisation and the Death of the Local Firm? The Automobile
Components Sector in South Africa. Regional Studies, 34(9), 797–812.
Barnes J. & Morris M. 2004. The German connection: Shifting hegemony in the political economy
of the South African automotive industry. Industrial and Corporate Change, 13(5), 789–814.
Barnes J. & Morris M. 2008. Staying alive in the global automotive industry: What can developing
economies learn from South Africa about linking into global automotive value chains? The
European Journal of Development Research, 20(1), 31–55.
Black A. 2001. Globalisation and restructuring in the South African automotive industry. Journal of
International Development, 13(6), 779–796.
Black A. 2009. Location, Automotive Policy, and Multinational Strategy: The Position of South
Africa in the Global Industry since 1995. Growth and Change, 40(3), 483–512.
Black A. & Bhanisi S. 2006. Globalisation, Imports and Local Content in the South African
Automotive Industry. TIPS Forum Papers. Johannesburg.
Stellenbosch University http://scholar.sun.ac.za
194
Blumberg B., Cooper D. R. & Schindler P. S. 2008. Business research methods (2. European ed.).
London: McGraw-Hill Education.
Boston Consulting Group. January 2010. Winning the BRIC automotive markets: Achieving deep
localization in Brazil, Russia, India and China. [Online] available: www.bcg.com. Accessed:
20.03.2010.
Brach J. & Kappel R. October 2009. Global Value Chains, Technology Transfer and Local Firm
Upgrading in Non-OECD Countries. GIGA Research Programme: Socio-Economic Challenges
in the Context of Globalisation. Hamburg.
Bryson, J. R. (Ed.). 1999. The economic geography reader: Producing and consuming global
capitalism. Chichester: Wiley.
Business Monitor International. March 2010. South Africa - Autos report. London: Business Monitor
International.
Cattaneo O., Gereffi G. & Staritz C. 2010. Global value chains in a postcrisis world: A development
perspective. Washington, DC: World Bank.
Coe N. M., Dicken P. & Hess M. 2008. Global production networks: Realizing the potential. Journal
of Economic Geography, 8(3), 271–295.
Coe N. M. & Hess M. December 2006. Global Production Networks: Debates and Challenges.
Manchester: GPERG Workshop.
Cohen S., Geissbauer R., Bhandari A. & D'heur M. 2008. Global Supply Chain Trends 2008-2010:
Driving Global Supply Chain Flexibility through Innovation. Munich: PRTM Management
Consultants.
Cokayne R. 2002. Ford's engine plant revs up to generate Forex of R1.5bn. Business Report.
[Online] available: http://www.businessreport.co.za. Accessed: 21.07.2010.
CSM Worldwide. 2009. Structural Challenges for the Future. [Online] available:
http://automotiveforecasting.com. Accessed: 21.07.2010.
Curran J. & Blackburn R. A. 2001. Researching the small enterprise. London: SAGE.
Datamonitor. August 2009. South Africa: Country analysis report. Datamonitor.
Dawar N. & Frost T. 1999. Competing with Giants: Survival Strategies for Local Companies in
Emerging Markets. Harvard Business Review, 77(2), 119–129.
Deloitte. 2009. A new era: Accelerating toward 2020 — An automotive industry transformed.
[Online] available: http://www.deloitte.com. Accessed: 21.07.2010.
Stellenbosch University http://scholar.sun.ac.za

195
Demkes R. & Tavasszy L. A. May 2000. Benchmarking infrastructure and logistics services across
Europe, Asia-Pacific and North America. Paper delivered at the International Meeting for
Research in Logistics, Trois-Rivieres, May 2000.
Doane D. & MacGillivray A. March 2001. Economic Sustainability: The business of staying in
business. London: New Economics Foundation.
Doran D. 2004. Rethinking the supply chain: an automotive perspective. Supply Chain
Management: An International Journal, 9(1), 102–109.
Doran D., Hill A., Hwang K. S. & Jacob G. 2007. Supply chain modularisation cases from the
French automobile industry. International of Production Economics, 106(1), 2–11.
DTI. 2008. Minister of Trade and Industry M. Mpahlwa's statement: Automotive Development
Programme announcement. [Online] available:
http://www.info.gov.za/speeches/2008/08090415151001.htm. Accessed: 07.03.2011.
DTI. 2010. Medium-Term Strategic Framework 2010–2013. [Online] available: www.thedti.gov.za.
Accessed: 07.03.2011.
Ellis S. 2008. How does the APDP stack up against the MIDP? South African Automotive
Benchmarking Club Newsletter No. 5. Hillcrest.
Found P., Beale J., Hines P., Naim M., Rich N., Sarmiento R.& Thomas A. December 2006. A
Theoretical Framework for Economic Sustainability of Manufacturing. Cardiff Logistics &
Operations Management Working Papers No. L/06/023. Cardiff.
Fourcade F. & Midler C. 2004. Modularisation in the auto industry: Can manufacturer‟s
architectural strategies meet supplier‟s sustainable profit trajectories? International Journal of
Automotive Technology and Management, 4(2–3), 240–260.
Frigant V. & Lung Y. 2002. Geographical proximity and supplying relationships in modular
production. International Journal of Urban and Regional Research, 26(4), 742–755.
FTSE Group. 2009. FTSE Global Equity Index Series Country Classification: SEPTEMBER 2009
UPDATE. [Online] available:
http://www.ftse.com/Indices/Country_Classification/Downloads/FTSE_Country_Classification_S
ept_09_update.pdf. Accessed: 03.03.2010.
Fu X., Pietrobelli C. & Soete L. September 2010. The Role of Foreign Technology and Indigenous
Innovation in Emerging Economies: Technological Change and Catching Up. Technical Notes.
Washington, DC.
Fujita K. & Child Hill R. 1999. Global Toyotaism and Local Development. In J. R. Bryson (Ed.), The
economic geography reader. Producing and consuming global capitalism. Chichester: Wiley,
217–222.
Stellenbosch University http://scholar.sun.ac.za
196
Gereffi G., Humphrey J. & Sturgeon T. 2005. The governance of global value chains. Review of
International Political Economy, 12(1), 78–104.
Giuliani E., Pietrobelli C. & Rabellotti R. 2005. Upgrading in Global Value Chains: Lessons from
Latin American Clusters. World Development, 33(4), 549–573.
Henderson J., Dicken P., Hess M., Coe N. & Yeung H. W.-C. 2002. Global production networks
and the analysis of economic development. Review of International Political Economy, 9(3),
436–464.
Herr M. L. 2006. Local Value Chain Development for Decent Work: An Operational Guide. Geneva:
International Labour Office.
Horváth & Partner. February 2010. Automotive Supplier Performance 2015. White Paper. Stuttgart.
Houghton R. 2010, March 4. Taking SA to the world. Business Day. [Online] available:
http://www.businessday.co.za. Accessed: 03.04.2010.
Hsuan J. 1999. Impacts of supplier-buyer relationships on modularization in new product
development. European Journal of Purchasing & Supply Management, 5(3-4), 197–209.
Humphrey J. 2000. Assembler-supplier relations in the auto industry: Globalisation and national
development. Competition & Change, 4(3), 245–271.
Humphrey J. 2003. Globalisation and supply chain networks: The auto industry in Brazil and India.
Global Networks, 3(2), 121–141.
Humphrey J., Lecler Y. & Salerno M. S. 2000. Global strategies and local realities: The auto
industry in emerging markets. New York, Palgrave Macmillan.
Humphrey J. & Memedovic O. 2003. The global automotive industry value chain: What prospects
for upgrading by developing countries. Sectoral Studies Series. Vienna.
Humphrey J. & Schmitz H. 1996. The Triple C approach to local industrial policy. World
Development, 24(12), 1859–1877.
Humphrey J. & Schmitz H. 2001. Governance in global value chains. IDS Bulletin, 32(3), 19–29.
Humphrey J. & Schmitz H. 2002. Developing Country Firms in the World Economy: Governance
and Upgrading in Global Value Chains. INEF Report No. 61. Duisburg.
Humphrey J. & Schmitz H. 2004. Chain governance and upgrading: Taking stock. In H. Schmitz
(Ed.), Local enterprises in the global economy. Issues of governance and upgrading.
Cheltenham: Elgar, 349–381.
Stellenbosch University http://scholar.sun.ac.za

197
Kaggwa M., Pouris A. & Steyn J. L. 2007. Sustaining automotive industry growth in South Africa: A
review of the first five years of the Motor Industry Development Programme. The South African
Journal of Economic History, 22(1/2), 51–73.
Kaggwa M., Steyn J. L. & Pouris A. 2009. Industrial policy, technology and the future of automotive
manufacturing in South Africa: Management of Engineering & Technology, 2009. PICMET
2009. Portland International Conference on Management of Engineering & Technology, 2009.
Kaplinsky R. 2010. The role of standards in global value chains. Washington, DC: World Bank
Poverty Reduction and Economic Management Network Internat. Trade Dep.
Karami A., Rowley J. & Analoui F. 2006. Research and knowledge building in management
studies: An analysis of methodological preferences. International Journal of Management,
23(1), 43–52.
KPMG. 2009a. Global location strategy for automotive suppliers. [Online] available:
www.kpmg.com. Accessed: 11.03.2010.
KPMG. 2009b. Global M&A: Outlook for automotive. [Online] available: www.kpmg.com. Accessed:
28.02.2011.
KPMG. 2010. KPMG’s Global Auto Executive Survey 2010: Industry Concerns and Expectations to
2014. [Online] available: www.kpmg.com. Accessed: 11.03.2010.
KPMG. March 2011. 2011 Global Automotive Executive Survey: Local South African
considerations. Pretoria.
Krueger R. A. & Casey M. A. 2009. Focus groups: A practical guide for applied research (4th ed.).
Thousand Oaks: SAGE Publications.
Lee N. & Cason J. 1994. Automobile commodity chains in the NICs: A comparison of South Korea,
Mexico and Brazil. In G. Gereffi & M. Korzeniewicz (Eds.), Commodity chains and global
capitalism. Westport Conn.: Praeger, 223–243.
Maile G. 2009. Creating a winning global location strategy for South African automotive suppliers.
Paper delivered at the South African Automotive Week, Durban, 8 October 2009.
Makapela L. September 2008. New auto incentive plan approved. [Online] available:
http://www.southafrica.info/business/investing/incentives/apdp-050908.htm. Accessed:
05.03.2011.
Morris D., Donnelly T. & Donnelly T. 2004. Supplier parks in the automotive industry. Supply Chain
Management: An International Journal, 9(2), 129–133.
Stellenbosch University http://scholar.sun.ac.za

198
Morrison A., Pietrobelli C. & Rabellotti R. 2008. Global value chains and technological capabilities:
A framework to study learning and innovation in developing countries. Oxford Development
Studies, 36(1), 39–58.
MSCI Barra. 2009. MSCI Market Classification Framework. [Online] available:
http://www.mscibarra.com/products/indices/international_equity_indices/gimi/stdindex/MSCI_Ma
rket_Classification_Framework.pdf. Accessed: 03.03.2010.
Mulenburg J. February 2008. What Does Complexity Have to Do With It?: Complexity, and the
Management of Projects. NASA Project Management Challenge. Daytona Beach, Florida.
NAACAM. 2010. NAACAM Profile. [Online] available:
http://naacamdirectory.webhouse.co.za/pages/32917. Accessed: 26.06.2011.
NAACAM. 2011. NAACAM – The Authority of the South African Automotive Components Industry.
[Online] available: http://www.naacam.co.za/site/default.asp. Accessed: 26.06.2011.
NAAMSA. 2007. Annual Report 2007. [Online] available: http://naamsa.co.za/papers/. Accessed:
18.01.2010.
NAAMSA. 2011a. National Association of Automobile Manufacturers of South Africa. [Online]
available: http://naamsa.co.za/. Accessed: 26.06.2011.
NAAMSA. 2011b. Quarterly review of business conditions: Motor vehicle manufacturing industry,
First quarter 2011. [Online] available: http://naamsa.co.za/papers/2011_firstquarter/index.html.
Accessed: 26.06.2011.
Nadvi K. 2008. Global standards, global governance and the organization of global value chains.
Journal of Economic Geography, 8(3), 323–343.
OECD. 2008. Enhancing the role of SMEs in global value chains. Paris OECD. [Online] available:
http://dx.doi.org/10.1787/472558038248. Accessed: 09.08.2011.
OECD. 2009. Globalisation and emerging economies: Brazil, Russia, India, Indonesia, China and
South Africa. Paris: OECD.
Onwuegbuzie A. & Leech N. L. 2005. On becoming a pragmatic researcher: The importance of
combining quantitative and qualitative research methodologies. International Journal of Social
Research Methodology, 8(5), 375–387.
Ponte S. & Gibbon P. 2005. Quality standards, conventions and the governance of global value
chains. Economy and Society, 34(1), 1–31.
Porter M. E. 1985. Competitive advantage: Creating and sustaining superior performance. New
York: Free Press.
Stellenbosch University http://scholar.sun.ac.za

199
Prezza Technologies Inc. 2011. Checkbox – Survey Solutions. [Online] available:
http://www.checkbox.com/. Accessed: 05.07.2011.
Reichhart A. & Holweg M. 2008. Co-located supplier clusters: forms, functions and theoretical
perspectives. International Journal of Operations & Production Management, 28(1), 53–78.
Robbins G. 2007. Linkages and supplier development in a local cluster: Experience from
organizing automotive firms in KwaZulu-Natal Province, South Africa. Paper delivered at the
Expert Meeting on Trade and Development Board Commission on Enterprise, Business
Facilitation and Development, Geneva, 2007.
Roland Berger & Rothschild. 2008. Global Automotive Supplier Study 2008. [Online] available:
www.rolandberger.com. Accessed: 25.10.2008.
Roland Berger & Rothschild. 2009. Global Automotive Supplier Study 2009: How suppliers can
master the auto crisis. [Online] available: www.rolandberger.com. Accessed: 19.11.2009.
Roland Berger & Lazard. 2010. Global Automotive Supplier Study: Quick rebound after the crisis –
Significant challenges ahead. [Online] available: www.rolandberger.com. Accessed:
23.02.2011.
Rugman A. M. & Collinson S. 2004. The regional nature of the world's automotive sector.
European Management Journal, 22(5), 471–482.
SAinfo. September 2008. South Africa's automotive industry. [Online] available:
http://www.southafrica.info/business/economy/sectors/automotive-overview.htm. Accessed:
05.03.2011.
Saunders M., Lewis P. & Thornhill A. 2009. Research methods for business students (5th ed.).
Harlow: Financial Times Prentice Hall.
Schlie E. & Yip G. 2000. Regional follows global: Strategy mixes in the world automotive industry.
European Management Journal, 18(4), 343–354.
Schmitz H. 1999. Global competition and local cooperation: Success and failure in the Sinos
Valley, Brazil. World Development, 27(9), 1627–1650.
Sturgeon T. J. 2001. How do we define value chains and production networks? IDS Bulletin, 32(3),
9–18.
Sturgeon T. J. 2002. Modular production networks: A new American model of industrial
organization. Industrial & Corporate Change, 11(3), 451–496.
Sturgeon T. J. 2008. Mapping integrative trade: Conceptualising and measuring global value
chains. Review of International Political Economy, 1(3), 237–257.
Stellenbosch University http://scholar.sun.ac.za
200
Sturgeon T. J. & Florida R. November 2000. Globalisation and Jobs in the Automotive Industry.
Working Paper Series. Cambridge.
Sturgeon T., Van Biesebroeck J. & Gereffi G. 2008. Value chains, networks and clusters:
Reframing the global automotive industry. Journal of Economic Geography, (8), 297–321.
Sturgeon T. J., Memedovic O., Van Biesebroeck J. & Gereffi G. 2009. Globalisation of the
automotive industry: Main features and trends. International Journal of Technological Learning
Innovation and Development, 2(1-2), 7–24.
Sturgeon T. J. & Van Biesebroeck J. 2009. Crisis and protection in the automotive industry: A
global value chain perspective. [Online] available: http://www-
wds.worldbank.org/external/default/WDSContentServer/WDSP/IB/2009/09/21/000158349_2009
0921125716/Rendered/PDF/WPS5060.pdf / http://dx.doi.org/10.1596/1813-9450-5060.
Accessed: 01.08.2010.
Sturgeon T. J. & Van Biesebroeck J. June 2010. Effects of the Crisis on the Automotive Industry in
Developing Countries: A Global Value Chain Perspective. Policy research working paper.
Washington, DC.
The Solution Workshop. 2011. [Online] available: http://www.thesolutionworkshop.co.za/.
Accessed: 05.07.2011.
Uallachain B. O. & Wasserman D. 1999. Vertical integration in a lean supply chain: Brazilian
automobile component parts. Economic Geography, 75(1), 21–42.
UNCTAD/DITE. 2007. Integrating developing countries’ SMEs in global value chains: Enhancing
the participation of small and medium-sized enterprises in global value chains. Geneva:
UNCTAD.
Veloso F., Henry C., Roth R. & Clark J. P. 2000. Global Strategies for the Development of the
Portuguese Autoparts Industry. [Online] available: http://www.citeve.com/bin-
cache/XPQC1DD5C44826DF7273C88ZKU.pdf. Accessed: 31.07.2010.
Veloso F. & Kumar R. January 2002. The automotive supply chain: Global trends and Asian
perspectives. ERD working paper series, Manila.
Venkatraman N. & Ramanujam V. August 1987. Measurement of business economic performance:
An examination of method convergence. Working Paper. Cambridge.
Vuori T. & Piik J. 2009. The co-evolution of academic research and industry practice: Evidence
from the US car industry. Aalto University, Department of Industrial Engineering and
Management, Aalto.
Ward‟s Auto. 2009. Data Reference Center. [Online] available: http://wardsauto.com/. Accessed:
15.07.2010.
Stellenbosch University http://scholar.sun.ac.za