a national conference for health care professionals ... · pdf filea national conference for...
TRANSCRIPT

A National Conference for Health Care Professionals
Tuesday 29th October 2013
The Westin Dragonara Resort, St Julian’s

Adverse Drug Reactions in Older People:
Tackling the Quiet Epidemic
D. O’Mahony,Dept. of Medicine (Gerontology),
University College, Cork,Ireland

Malta

Malta Ireland

Malta Ireland


Titanic 1912 Blarney Stone
Royal Cork Yacht Club 1720

Queen’s College,Cork.Founded 1845
Medical School, c. 1870
Medical School, 2012
Cork University Hospital/UCC

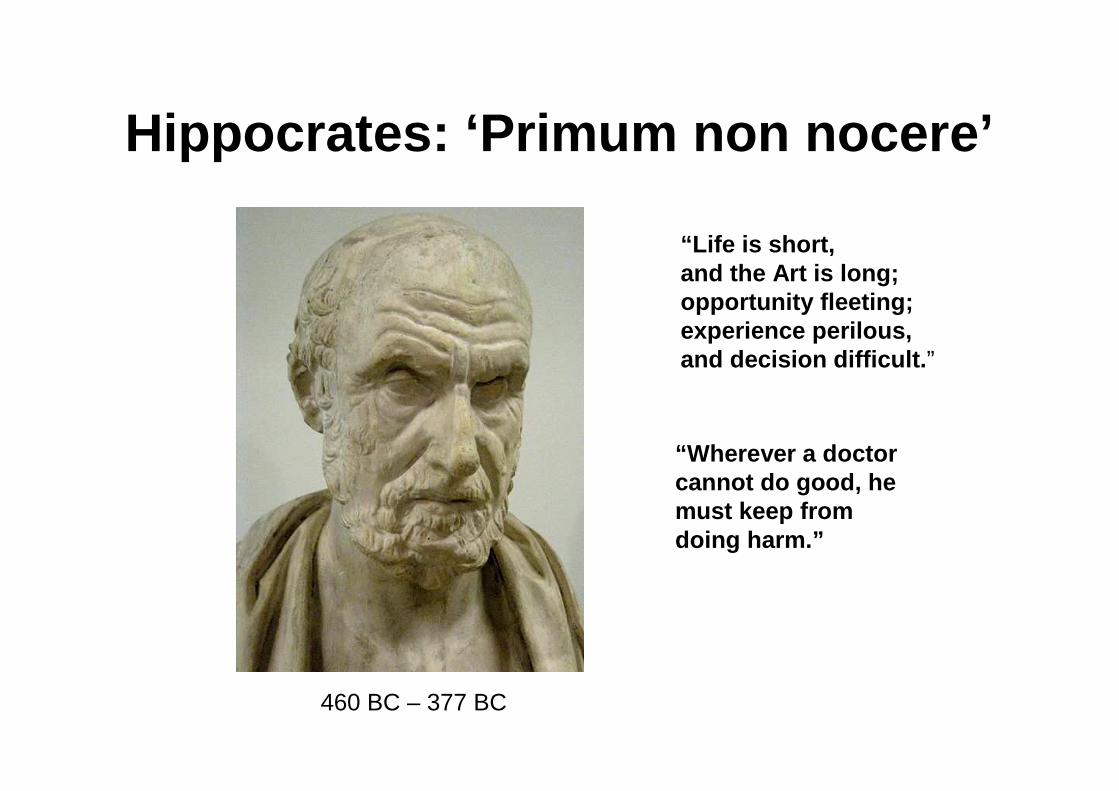
Hippocrates: ‘Primum non nocere’
“Life is short, and the Art is long; opportunity fleeting; experience perilous, and decision difficult. ”
“Wherever a doctor cannot do good, he must keep from doing harm.”
460 BC – 377 BC

Hippocrates: Therapeutic Restraint
“To do nothing is sometimesa good remedy. ”
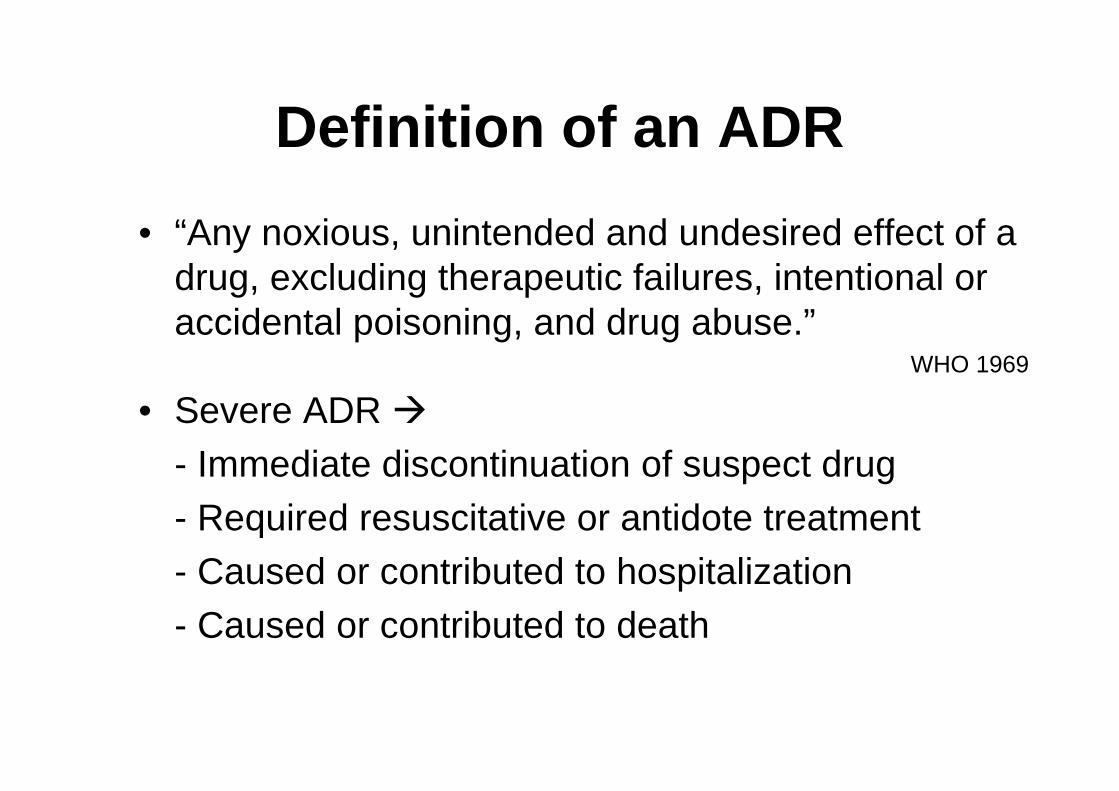
Definition of an ADR
• “Any noxious, unintended and undesired effect of a drug, excluding therapeutic failures, intentional or accidental poisoning, and drug abuse.”
WHO 1969
• Severe ADR �- Immediate discontinuation of suspect drug
- Required resuscitative or antidote treatment- Caused or contributed to hospitalization
- Caused or contributed to death

Adverse Drug Reactions (ADRs)• Type A: predictable, often dose-dependent, e.g. hypoglycaemia with
insulin, bleeding with warfarin, bradykinesia with neuroleptics
• Type B: unpredictable, idiosyncratic e.g. drug-induced skin rash
• Type C: related to duration of treatment or excessive dose e.g. analgesic nephropathy
• Type D: related to critical timing of treatment e.g. teratogenesis with thalidomide
• Type E: related to sudden withdrawal of long-term therapy, e.g. delirium with benzodiazepine withdrawal
Type A events account for > 80% of all ADRs

ADR epidemiology - 1
• 6% of hospital admissions
• 4% of hospital bed-days• Hospital stay in ADR patients 8% longer
• 0.3% of ADRs are fatal• Mortality in ADR patients increased x 19
• Incidence rate increasing with global ageing• Recent USA statistics: 5th highest cause of death

ADR epidemiology - 2
• Approx. 3% of all deaths in Sweden • Median age in men 81 yrs, in women 83 yrs;• Mortality in older ADR patients 7 times greater
than in younger ADR patients• Hospital admissions for ADRs increasing since
1980s
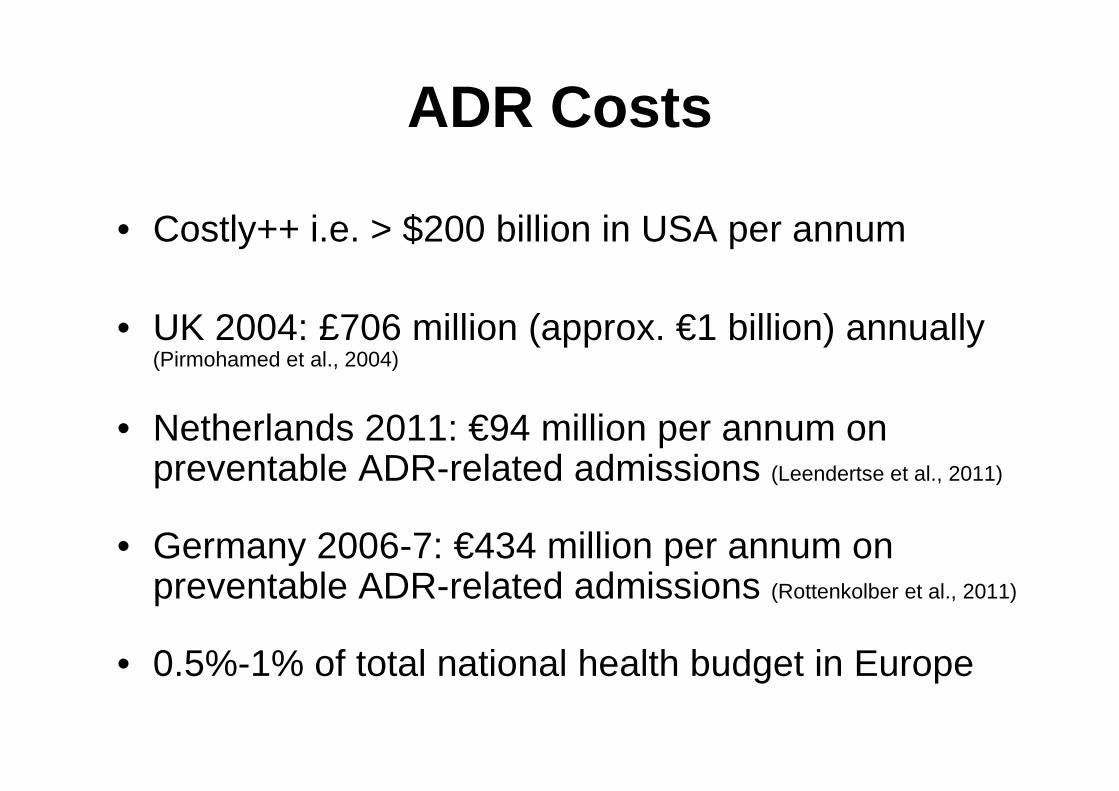
ADR Costs
• Costly++ i.e. > $200 billion in USA per annum
• UK 2004: £706 million (approx. €1 billion) annually (Pirmohamed et al., 2004)
• Netherlands 2011: €94 million per annum on preventable ADR-related admissions (Leendertse et al., 2011)
• Germany 2006-7: €434 million per annum on preventable ADR-related admissions (Rottenkolber et al., 2011)
• 0.5%-1% of total national health budget in Europe

ADR Risk Factors
• Age > 65• Female > Male• Polypharmacy (> 6 medicines/day)• Multimorbid illness (≥ 4 chronic diseases)• Chronic liver disease• Acute, chronic kidney disease (eGFR < 60
ml/min/1.73m2)• Chronic heart failure• Previous ADR• Certain drugs: insulin, anticoagulants, neuroleptics, oral
hypoglycaemic agents, non-steroidal anti-inflammatories
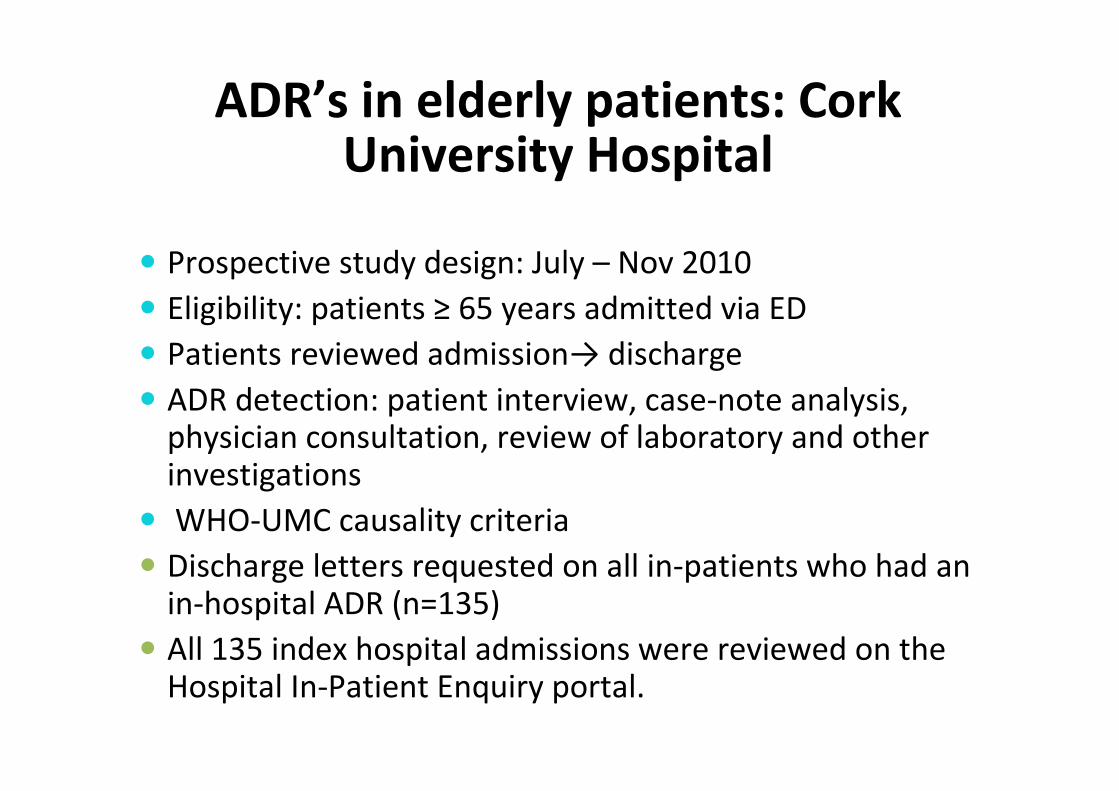
ADR’s in elderly patients: Cork University Hospital
� Prospective study design: July – Nov 2010
� Eligibility: patients ≥ 65 years admitted via ED
� Patients reviewed admission→ discharge
� ADR detection: patient interview, case-note analysis, physician consultation, review of laboratory and other investigations
� WHO-UMC causality criteria
� Discharge letters requested on all in-patients who had an in-hospital ADR (n=135)
� All 135 index hospital admissions were reviewed on the Hospital In-Patient Enquiry portal.
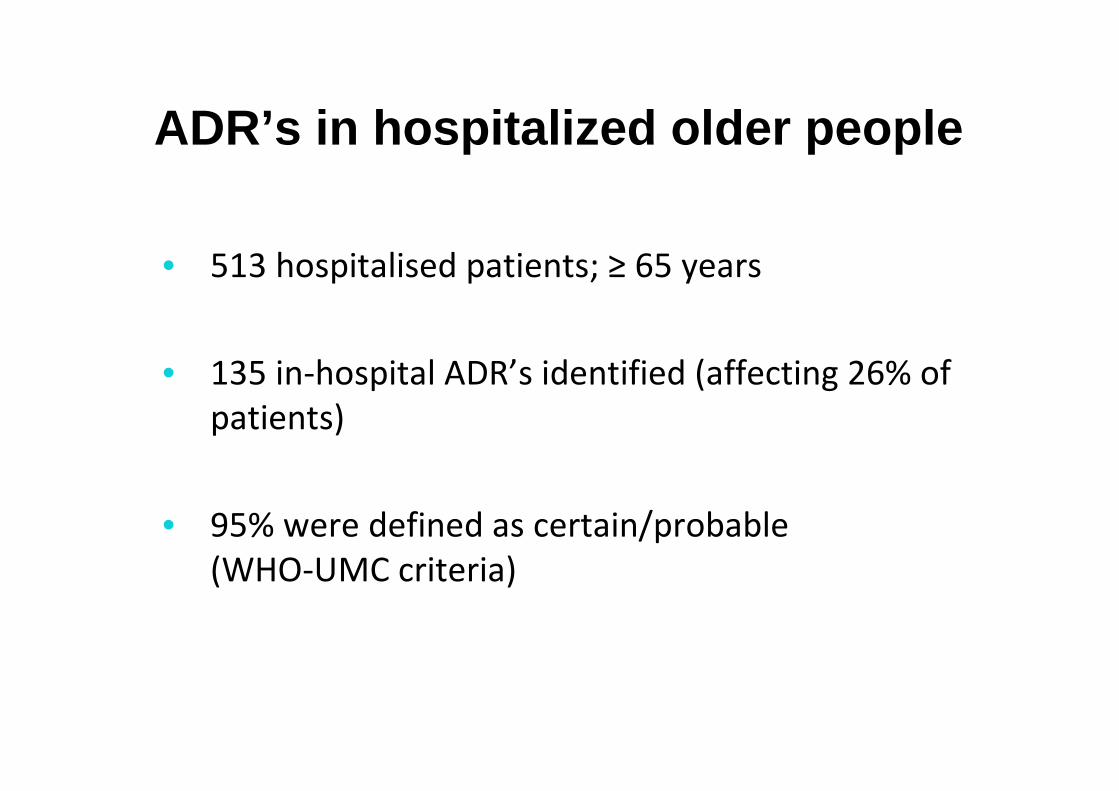
ADR’s in hospitalized older people
• 513 hospitalised patients; ≥ 65 years
• 135 in-hospital ADR’s identified (affecting 26% of
patients)
• 95% were defined as certain/probable
(WHO-UMC criteria)

Drug/Drug Class Adverse Drug Reaction No. (%)
Diuretics Acute kidney injury/electrolyte disturbance
45 (25%)
Benzodiazepines Fall(s) 32 (18%)Opiates Acute confusion/ falls/
sedation/constipation32 (18%)
Beta-blockers Symptomatic bradycardia/Orthostatic hypotension
16 (9%)
Anti-hypertensive’s (excluding diuretics + beta blockers)
Orthostatic hypotension/ Acute Kidney Injury/Hyperkalemia
14 (7.8%)
NSAID’s (excluding Aspirin) Gastritis/peptic ulceration/acute kidney injury
10 (5.6%)
Warfarin Haemorrhage 8 (4.5%)Anti-platelets Haemorrhage/gastritis 6 (3.3%)Neuroleptics Falls/parkinsonism 3 (1.6%)
Selective Serotonin Reuptake Inhibitors
Hyponatraemia 3 (1.6%)
Antibiotics (Cephalosporins)
Clostridium difficile colitis 3 (1.6%)

Recording of ADR’s in hospital
HIPE coded data Hospital Discharge summary
� 135 records analysed (100%)
� 27/135 (20%) detailed the
medication and associated ADR
� 124/135 (92%) discharge letters analysed
� 24/124 (19%) reported that patient had an ADR in hospital
� 8/24 :detailed description of the ADR
� 16/24: detailed the drug only but not the ADR
Insufficient recording of ADR’s by hospitals ���� Grossly under-reported rate of ADR’s by Irish Medicines Board.

ADR Causality : Naranjo Criteria
Definite ADR: 9 – 12
Probable ADR: 5 – 8
Possible ADR: 1 – 4
Doubtful ADR: 0

ADR Causality : WHO-UMC Criteria
WHO–UMC Causality Assessment Criteria
CategoriesTime Sequence
Other drugs / other diseases excluded
Dechallenge effect (symptoms are better)
Rechallengeeffect(symptoms are worse)
Certain Yes Yes Yes Yes
Probable Yes Yes Yes No
Possible Yes No No No
Unlikely No No No No

Polypharmacy
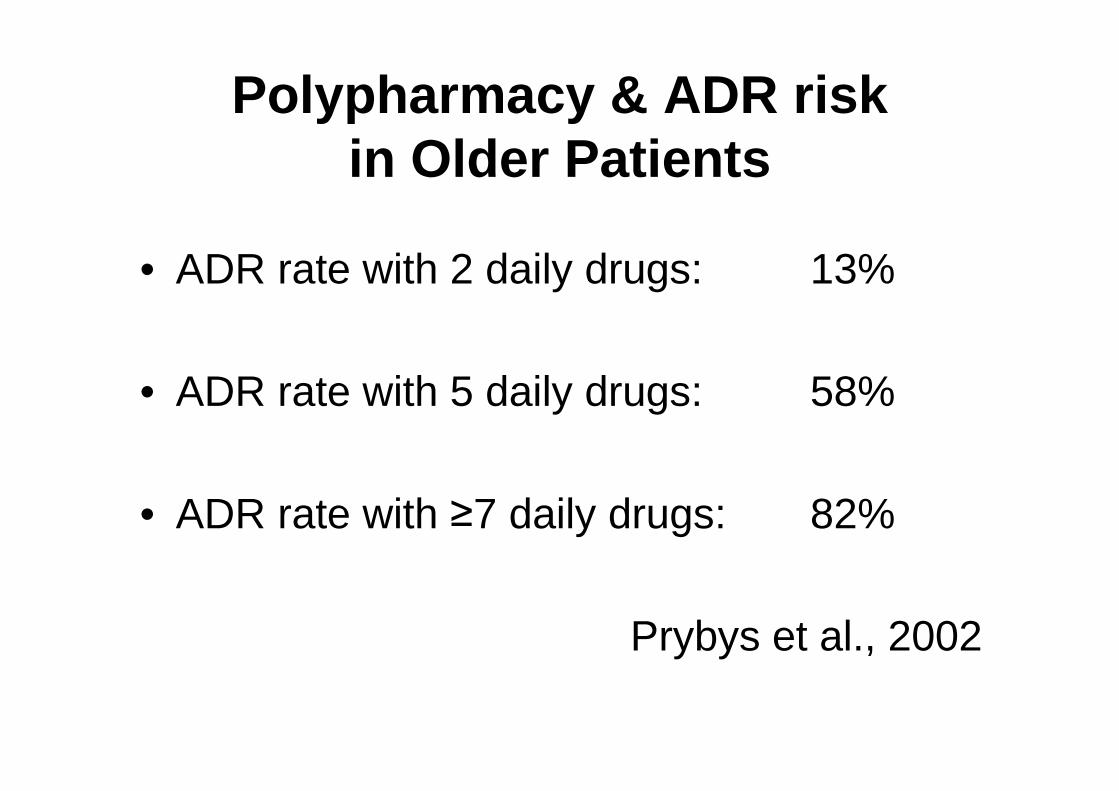
Polypharmacy & ADR risk in Older Patients
• ADR rate with 2 daily drugs: 13%
• ADR rate with 5 daily drugs: 58%
• ADR rate with ≥7 daily drugs: 82%
Prybys et al., 2002

Polypharmacy & Major Polypharmacy
Denham MJ, Brit Med Bull 1990
Median number ofdaily drugs taken by older people with acute illness admitted to hospital = 7 (IQR 5-10)

What causes polypharmacy?
R = 0.726
Gilmartin & O’Mahony, 2012

Polypharmacy: new definition
• “The inappropriate pharmacotherapeutic response from doctors to the presence of multimorbidity, usually in an older person, that results in heightened risk of adverse drug reactions and adverse drug events. The presence of 8 or more daily medicinesrepresents a serious risk of adverse drug-related morbidity, which should trigger corrective action.”
O’Mahony, 2012.
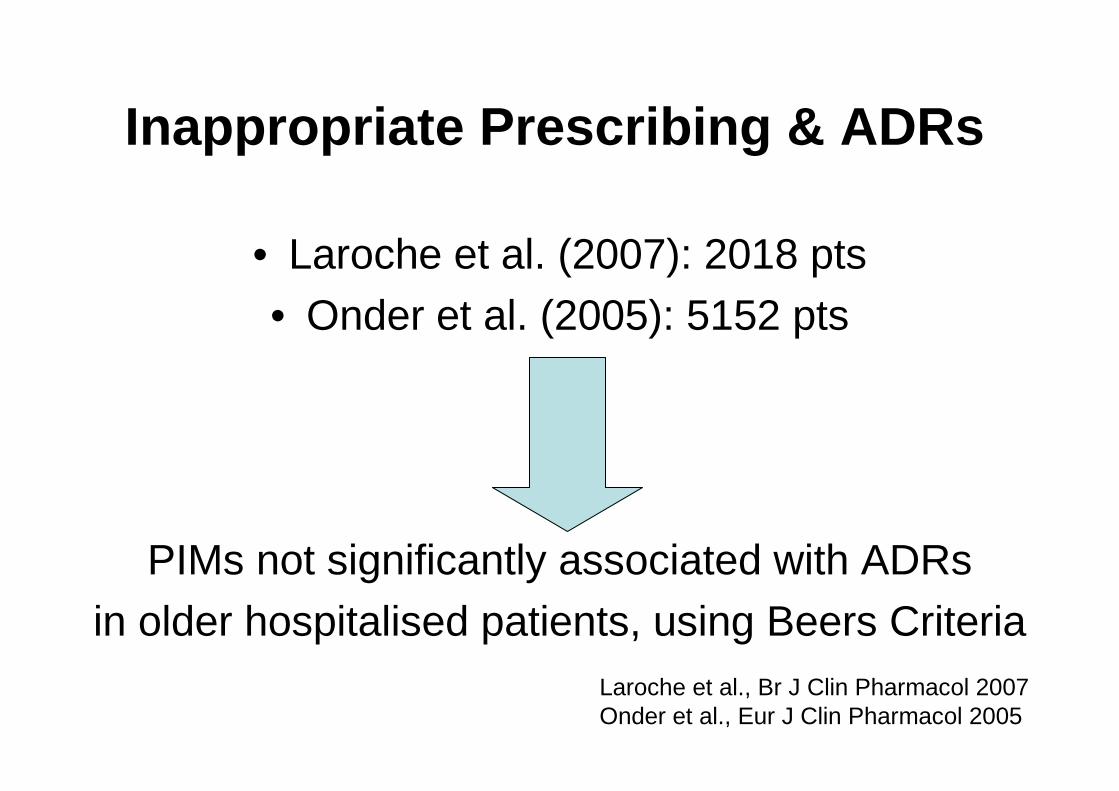
Inappropriate Prescribing & ADRs
• Laroche et al. (2007): 2018 pts • Onder et al. (2005): 5152 pts
PIMs not significantly associated with ADRs in older hospitalised patients, using Beers Criteria
Laroche et al., Br J Clin Pharmacol 2007Onder et al., Eur J Clin Pharmacol 2005

ADEs & Inappropriate Drugs
Arch Intern Med June, 2011
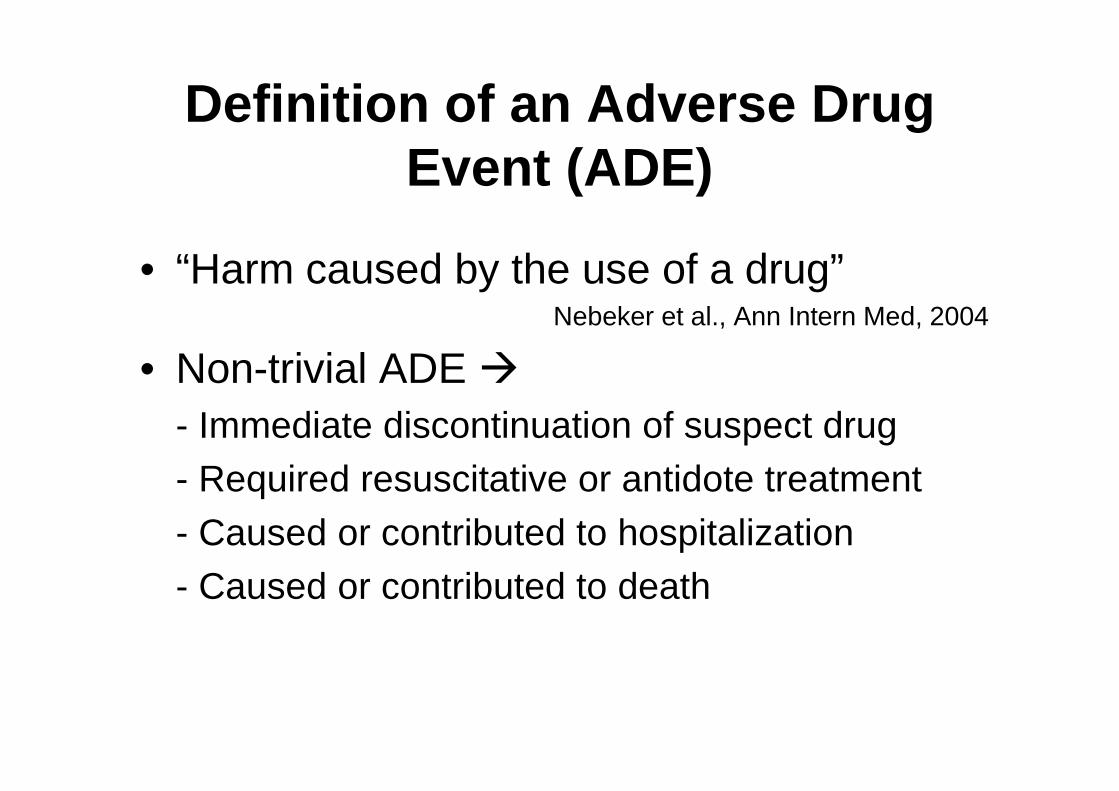
Definition of an Adverse Drug Event (ADE)
• “Harm caused by the use of a drug”Nebeker et al., Ann Intern Med, 2004
• Non-trivial ADE �- Immediate discontinuation of suspect drug- Required resuscitative or antidote treatment
- Caused or contributed to hospitalization- Caused or contributed to death
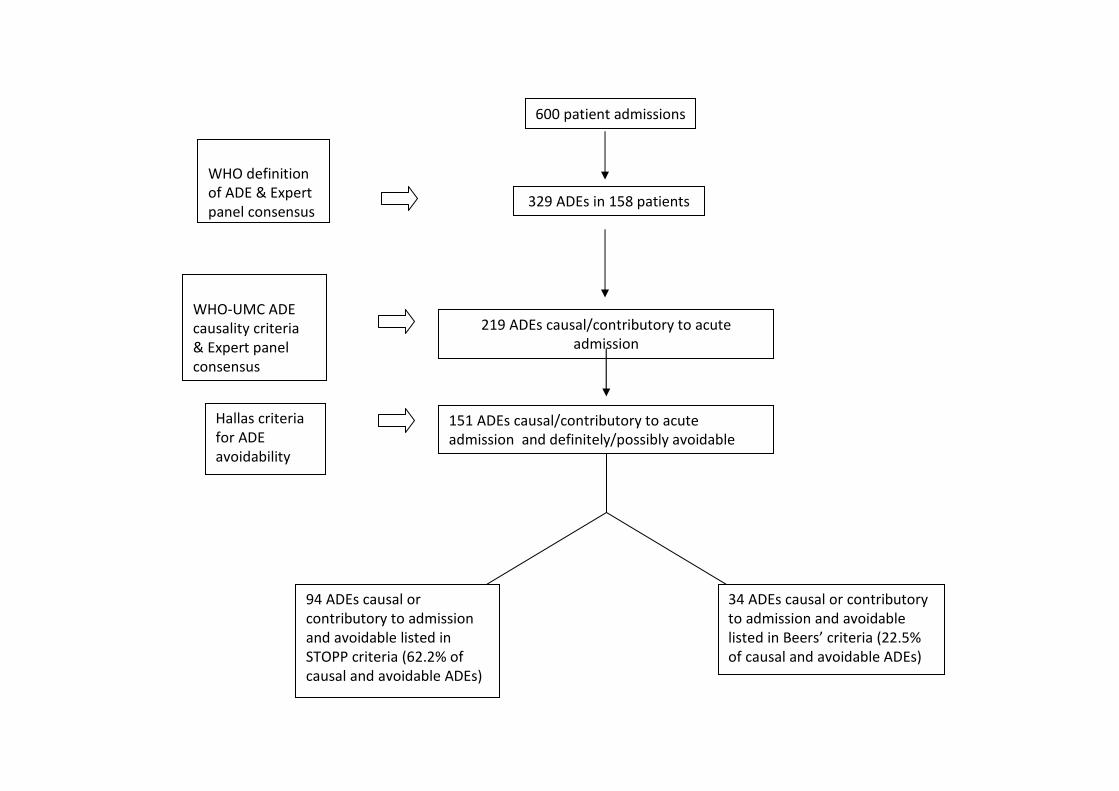
151 ADEs causal/contributory to acute
admission and definitely/possibly avoidable
219 ADEs causal/contributory to acute
admission
600 patient admissions
329 ADEs in 158 patients
Hallas criteria
for ADE
avoidability
WHO-UMC ADE
causality criteria
& Expert panel
consensus
WHO definition
of ADE & Expert
panel consensus
94 ADEs causal or
contributory to admission
and avoidable listed in
STOPP criteria (62.2% of
causal and avoidable ADEs)
34 ADEs causal or contributory
to admission and avoidable
listed in Beers’ criteria (22.5%
of causal and avoidable ADEs)
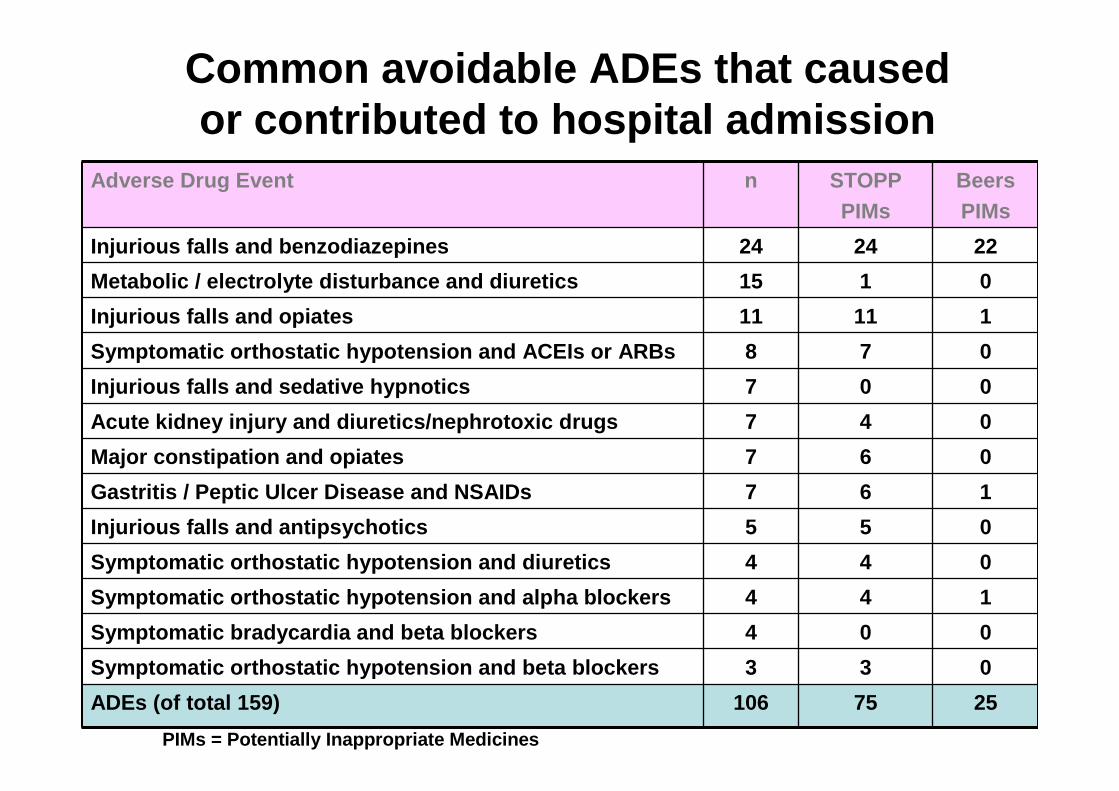
Adverse Drug Event n STOPPPIMs
BeersPIMs
Injurious falls and benzodiazepines 24 24 22
Metabolic / electrolyte disturbance and diuretics 15 1 0
Injurious falls and opiates 11 11 1
Symptomatic orthostatic hypotension and ACEIs or AR Bs 8 7 0
Injurious falls and sedative hypnotics 7 0 0
Acute kidney injury and diuretics/nephrotoxic drugs 7 4 0
Major constipation and opiates 7 6 0
Gastritis / Peptic Ulcer Disease and NSAIDs 7 6 1
Injurious falls and antipsychotics 5 5 0
Symptomatic orthostatic hypotension and diuretics 4 4 0
Symptomatic orthostatic hypotension and alpha block ers 4 4 1
Symptomatic bradycardia and beta blockers 4 0 0
Symptomatic orthostatic hypotension and beta blocke rs 3 3 0
ADEs (of total 159) 106 75 25
Common avoidable ADEs that causedor contributed to hospital admission
PIMs = Potentially Inappropriate Medicines

STOPP vs Beers: SummaryAfter adjusting for age, sex, comorbidity, dementia, baseline ADLs, number of medications……
• Clinically significant ADEs were listed in STOPP 2.54 times more often than in Beers criteria
• Risk of a non-trivial, avoidable ADE is increased significantly with STOPP medications (OR=1.85, 95% CI 1.51-2.26, p<0.001)
• Risk of a non-trivial, avoidable ADE is not increased significantly with Beers medications (OR=1.28, 95% CI 0.94-1.72,p=0.11)
STOPP vs. Beers: Conclusion
• STOPP criteria predict ADEs to a significant degree; Beers criteria do not.
• Potentially inappropriate medications (PIMs) according to STOPP criteriarepresent a significant ADE risk factor
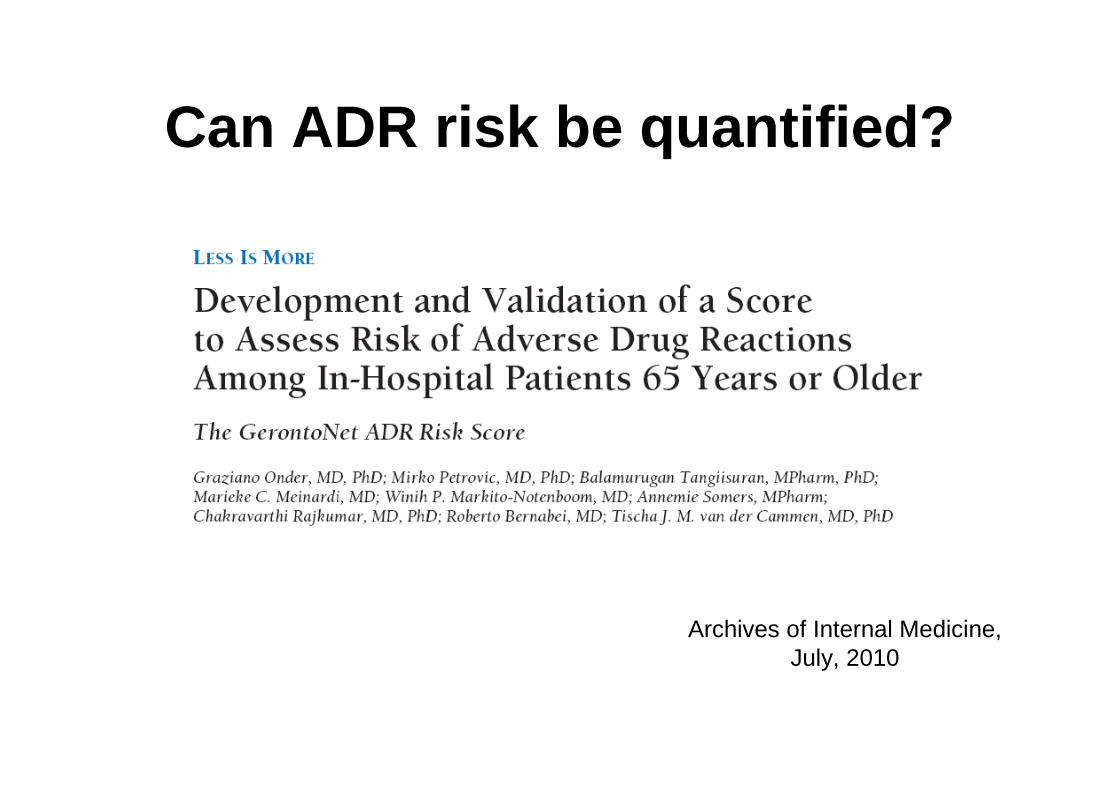
Can ADR risk be quantified?
Archives of Internal Medicine,July, 2010

GerontoNet ADR Risk Scale (1)

GerontoNet ADR Risk Scale (2)
N = 5936 N = 483

GerontoNet ADR Risk Scale (3)
i.e. GerontoNetScale could notpredict 30% ofthe ADRs in theprospectivevalidation study

Multimorbidity and Polypharmacy are notindependent variables
R = 0.726
Gilmartin & O’Mahony, 2012

Cork University Hospital ADR Study, 2011(1)
Age median (IQR) 77 (72-82)
Female n (%) 290 (56%)
CIRS* median (IQR) 22 (19-25)
Barthel Index median (IQR) 20 (17-20)
Source of Admission:HomeNursing HomeOther Hospital
n (%)n (%)n (%)
446 (86.9%)61 (11.9%)6 (1.2%)
Admitting Specialty:MedicineSurgeryGeriatric Medicine
n (%)n (%)n (%)
302 (58.9%)132 (25.7%)79 (15.4%)
Medication Use:Total number of medicationsDistributions0-5 medications6-10 medications11-14 medications≥ 15 medications
median (IQR)n (IQR)n (%)n (%)n (%)
38187 (5-10)168 (33%)237 (46%)88 (17%)20 (4%)
Characteristics of Study Population (n=513)
*Cumulative Illness Rating Scale

Cork University Hospital ADR Study, 2011(2)
Drug/Drug Class Adverse Drug Reaction No. (%)
Diuretics Acute kidney injury/electrolyte disturbance
45 (25%)
Benzodiazepines Fall(s) 32 (18%)
Opiates Acute confusion/ falls/sedation/constipation
32 (18%)
Beta-blockers Symptomatic bradycardia/Orthostatic hypotension
16 (9%)
Anti-hypertensives (excluding diuretics, beta-blockers)
Orthostatic hypotension/ Acute Kidney Injury/Hyperkalemia
14 (7.8%)
NSAID’s (excluding aspirin) Gastritis/peptic ulceration/acute kidney injury
10 (5.6%)
Warfarin Haemorrhage 8 (4.5%)
Anti-platelet drugs Haemorrhage/gastritis 6 (3.3%)
Neuroleptics Falls/parkinsonism 3 (1.6%)
Selective Serotonin Reuptake Inhibitors
Hyponatraemia 3 (1.6%)
Antibiotics (Cephalosporins) Clostridium difficile 3 (1.6%)
178 ADRs in 135/513 patients, i.e. 26% incidence ra te

Cork University Hospital ADR Study, 2011(3)
Variable ADR Group( n = 135)
Non-ADR Group ( n =378)
p value (Mann- Whitney
U-test)
Age in yearsMean (SD)
79 (7) 75 (7) < 0.001
Median number of medications
8 7 < 0.001
Length of stayDays (SD)
12 (12) 7 (9) < 0.001
Co-morbidityMean CIRS* (SD)
22 (3) 22 (4) 0.660
*Cumulative Illness Rating Scale
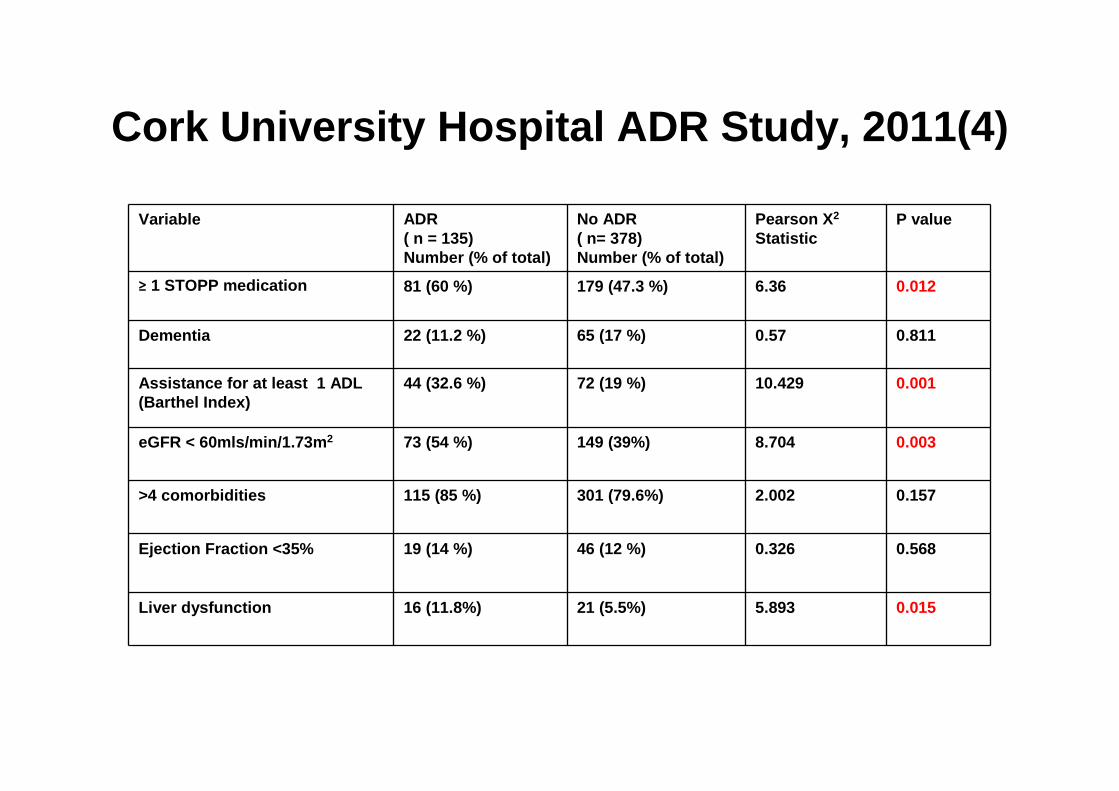
Cork University Hospital ADR Study, 2011(4)
Variable ADR( n = 135) Number (% of total)
No ADR ( n= 378) Number (% of total)
Pearson X 2
Statistic P value
≥ 1 STOPP medication 81 (60 %) 179 (47.3 %) 6.36 0.012
Dementia 22 (11.2 %) 65 (17 %) 0.57 0.811
Assistance for at least 1 ADL (Barthel Index)
44 (32.6 %) 72 (19 %) 10.429 0.001
eGFR < 60mls/min/1.73m 2 73 (54 %) 149 (39%) 8.704 0.003
>4 comorbidities 115 (85 %) 301 (79.6%) 2.002 0.157
Ejection Fraction <35% 19 (14 %) 46 (12 %) 0.326 0. 568
Liver dysfunction 16 (11.8%) 21 (5.5%) 5.893 0.015

Multivariate logistic regression analysis of independent ADR risk factors
Multi-Variate AnalysisVariable
Odds Ratio 95% Confidence Interval
Lower Upper
p -value
Age (years)65-7475-84≥ 85
2.122.22
1.22 3.691.68 4.23
0.015
0.0070.015
Renal Failure (eGFR < 60) 1.81 1.12 2.92 0.015
Liver Disease 1.86 0.90 3.84 0.0 90
Number of STOPP medications
2.40 1.26 4.59 0.008
Number of Medications 1.09 1.02 1.17 0.006
Assistance ≥ 1 activity of daily living
0.75 0.45 1.26 0.290
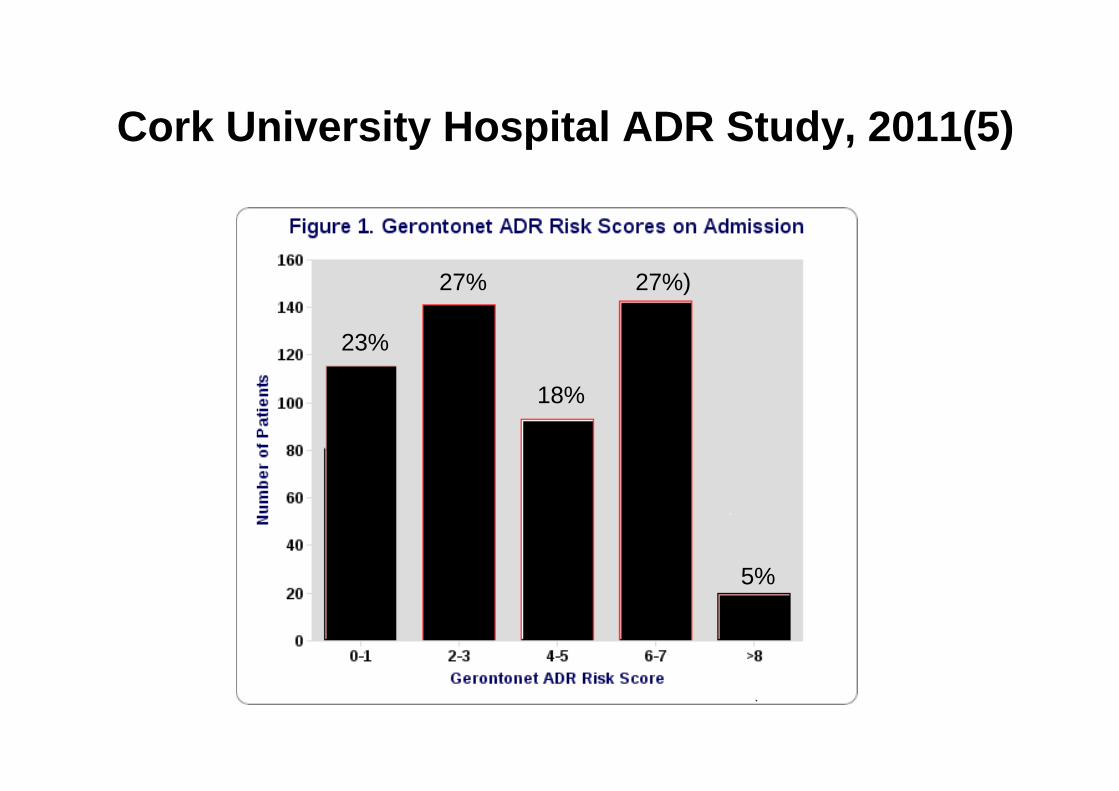
Cork University Hospital ADR Study, 2011(5)
23%
27%
18%
27%)
5%
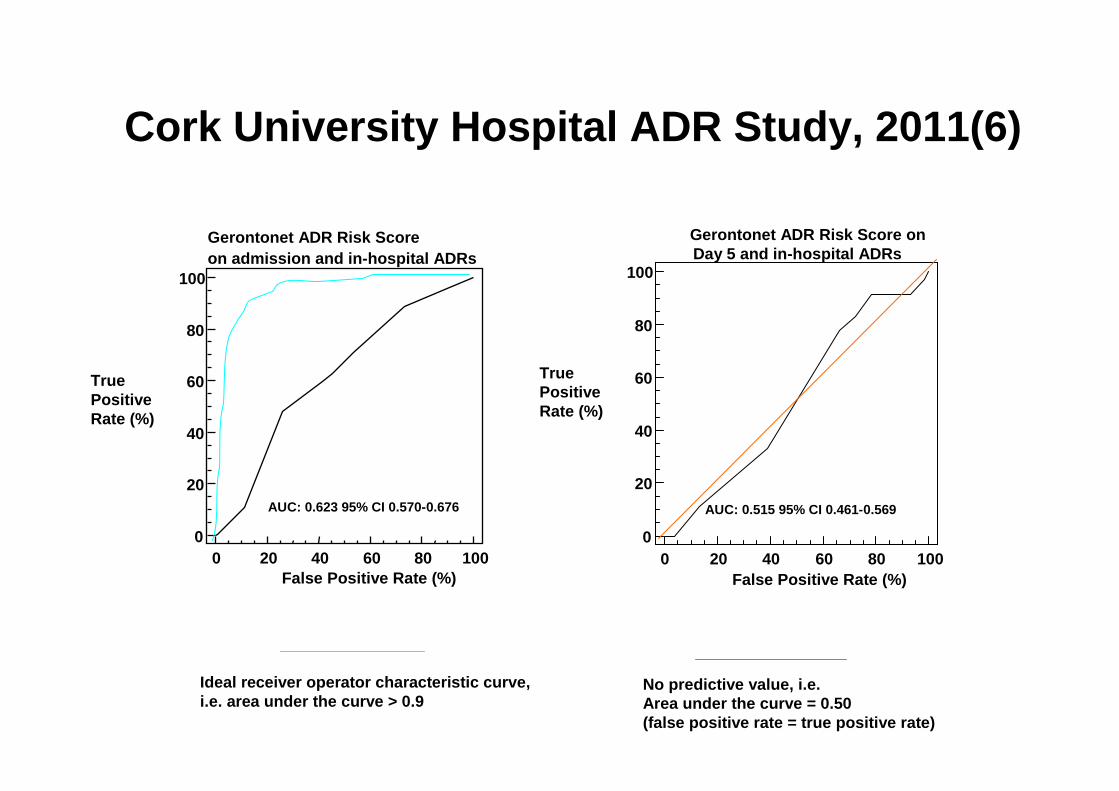
Cork University Hospital ADR Study, 2011(6)
0 20 40 60 80 100 0
20
40
60
80
100
False Positive Rate (%)
TruePositiveRate (%)
Gerontonet ADR Risk Score onDay 5 and in-hospital ADRs
0 20 40 60 80 1000
20
40
60
80
100
False Positive Rate (%)
AUC: 0.515 95% CI 0.461-0.569AUC: 0.623 95% CI 0.570-0.676
TruePositiveRate (%)
Gerontonet ADR Risk Scoreon admission and in-hospital ADRs
Ideal receiver operator characteristic curve,i.e. area under the curve > 0.9
No predictive value, i.e. Area under the curve = 0.50(false positive rate = true positive rate)
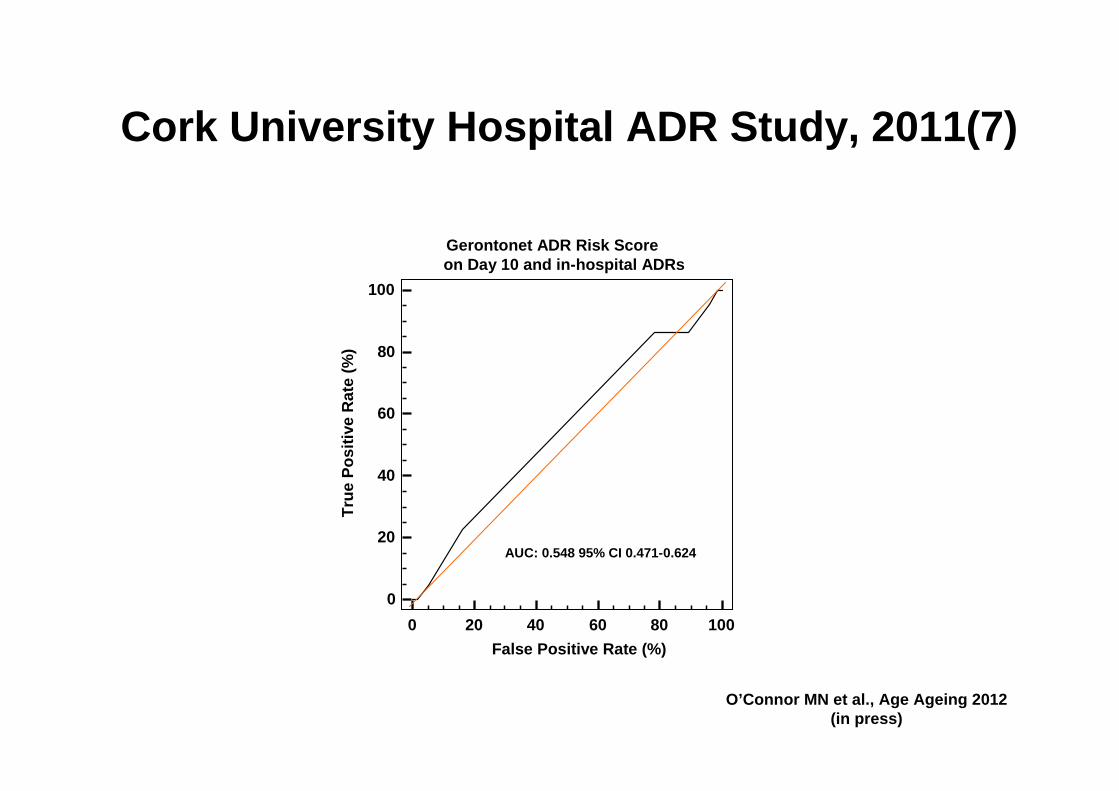
Cork University Hospital ADR Study, 2011(7)
Gerontonet ADR Risk Score on Day 10 and in-hospital ADRs
0 20 40 60 80 100
0
20
40
60
80
100
False Positive Rate (%)
Tru
e P
ositi
ve R
ate
(%)
AUC: 0.548 95% CI 0.471-0.624
O’Connor MN et al., Age Ageing 2012(in press)

GerontoNet ADR Risk Scale: Conclusions
• GerontoNet scale uses co-dependent variables i.e. statistically flawed
• At least 30% of ADRs in the prospective study are not detected by GerontoNet scale
• Cork prospective ADR study study shows poor ADR prediction of GerontoNet scale
• GerontoNet ADR risk scale does not meet the criteria for clinical utility
ADR prevention
• A new ADR risk scale is needed to identify high-risk older patients
• A new ADR Risk in Older People (ADRROP) scale must focus on modifiable ADR risk factors
• Computerized, standardized method of ADR risk assessment is needed
• Demographic imperative (rising at-risk population)
• Economic imperative (health budgets under strain)
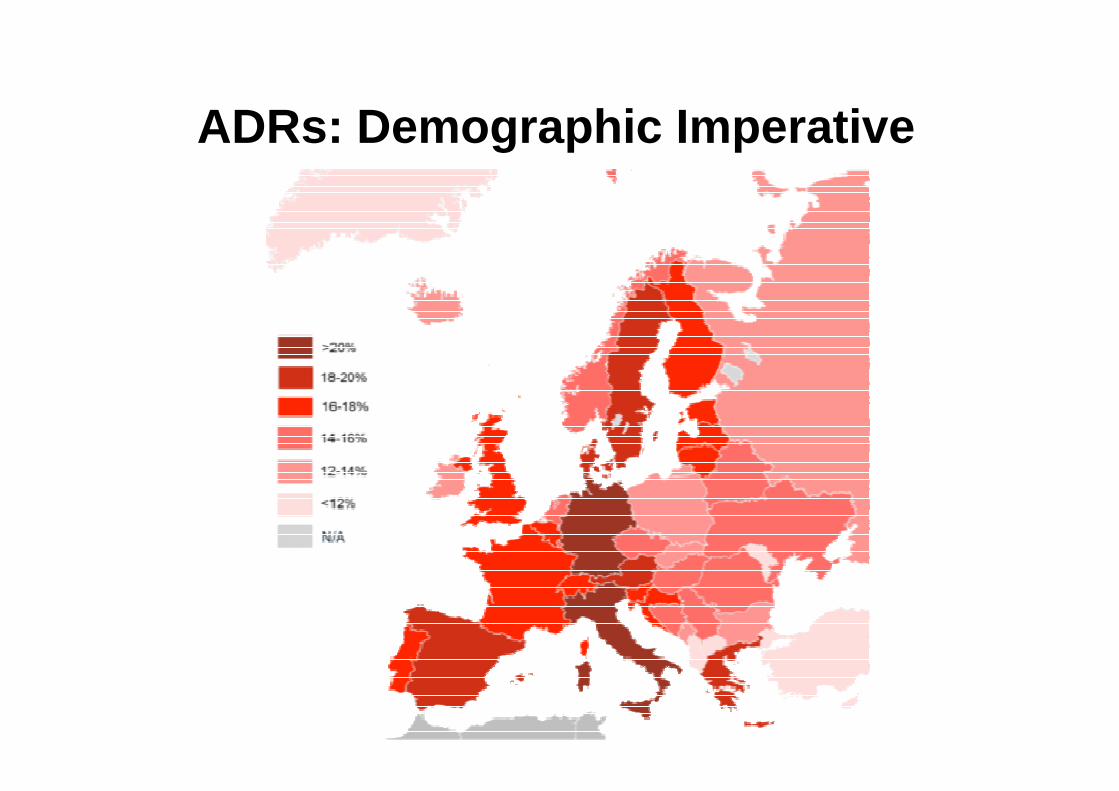
ADRs: Demographic Imperative

Interventions to prevent ADRs
• Focus on the high-risk groups i.e. frail elderly with multimorbidity, polypharmacy, renal disease, liver disease
• Must be cost effective• Education of prescribers• Surveillance by clinical pharmacists• Electronic methods of ADR prevention• ADR reporting
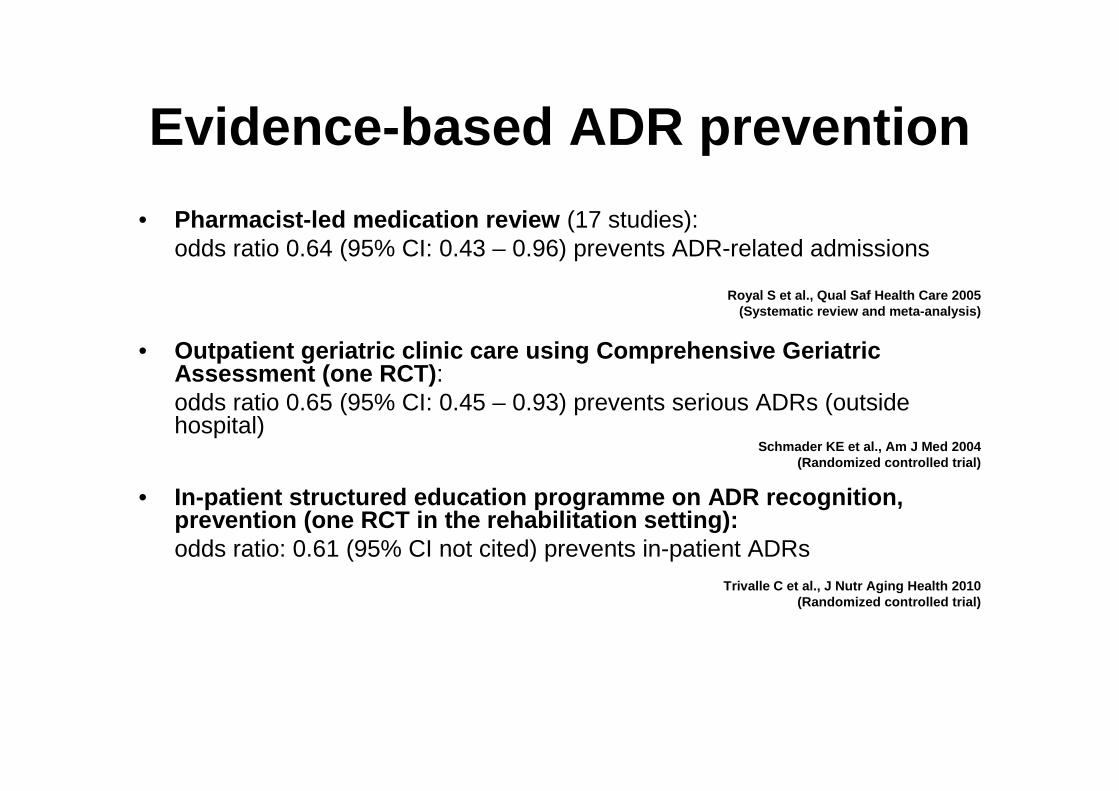
Evidence-based ADR prevention
• Pharmacist-led medication review (17 studies): odds ratio 0.64 (95% CI: 0.43 – 0.96) prevents ADR-related admissions
Royal S et al., Qual Saf Health Care 2005(Systematic review and meta-analysis)
• Outpatient geriatric clinic care using Comprehensiv e Geriatric Assessment (one RCT) :odds ratio 0.65 (95% CI: 0.45 – 0.93) prevents serious ADRs (outside hospital)
Schmader KE et al., Am J Med 2004(Randomized controlled trial)
• In-patient structured education programme on ADR re cognition, prevention (one RCT in the rehabilitation setting):odds ratio: 0.61 (95% CI not cited) prevents in-patient ADRs
Trivalle C et al., J Nutr Aging Health 2010(Randomized controlled trial)

Can STOPP & START criteria help to optimise prescribing in older people?
• Improve medication appropriateness?
• Reduce drug costs?
• Reduce incidence of ADRs/ADEs?
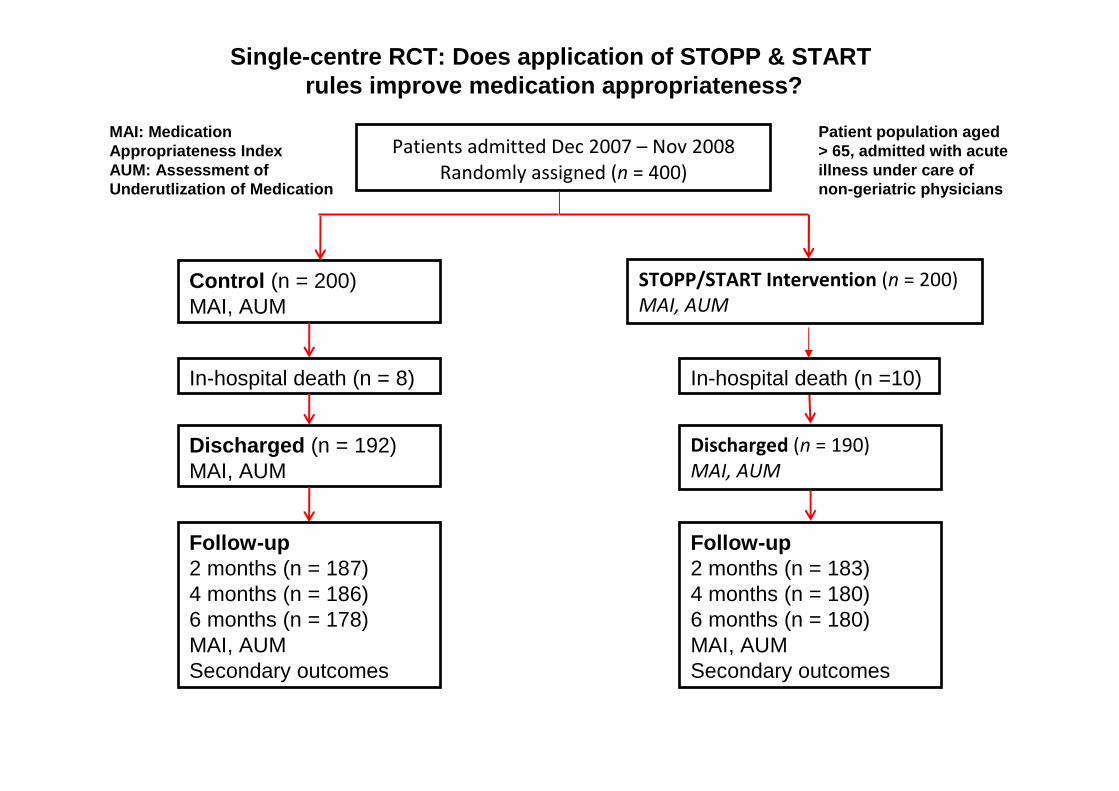
Patients admitted Dec 2007 – Nov 2008
Randomly assigned (n = 400)
Control (n = 200)MAI, AUM
STOPP/START Intervention (n = 200)
MAI, AUM
In-hospital death (n = 8) In-hospital death (n =10)
Discharged (n = 192)MAI, AUM
Discharged (n = 190)
MAI, AUM
Follow-up 2 months (n = 187)4 months (n = 186)6 months (n = 178)MAI, AUMSecondary outcomes
Follow-up2 months (n = 183)4 months (n = 180)6 months (n = 180)MAI, AUMSecondary outcomes
MAI: Medication Appropriateness IndexAUM: Assessment of Underutlization of Medication
Patient population aged > 65, admitted with acuteillness under care of non-geriatric physicians
Single-centre RCT: Does application of STOPP & STAR T rules improve medication appropriateness?
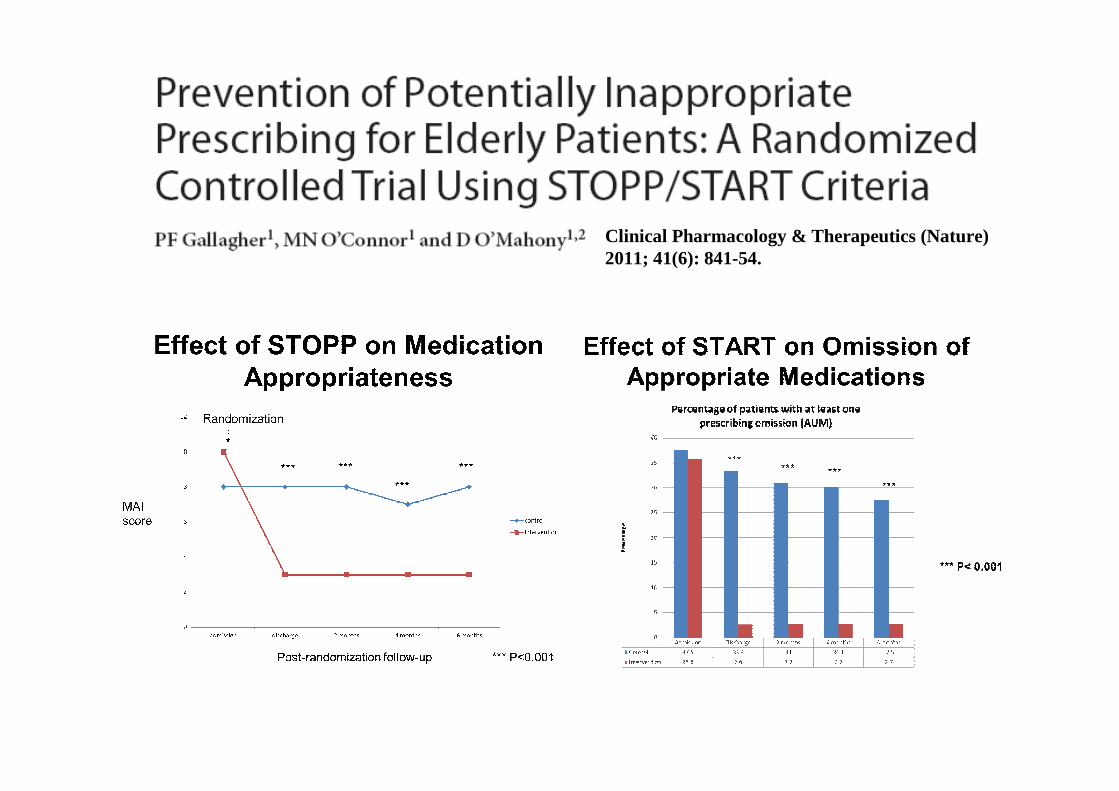
Clinical Pharmacology & Therapeutics (Nature) 2011; 41(6): 841-54.
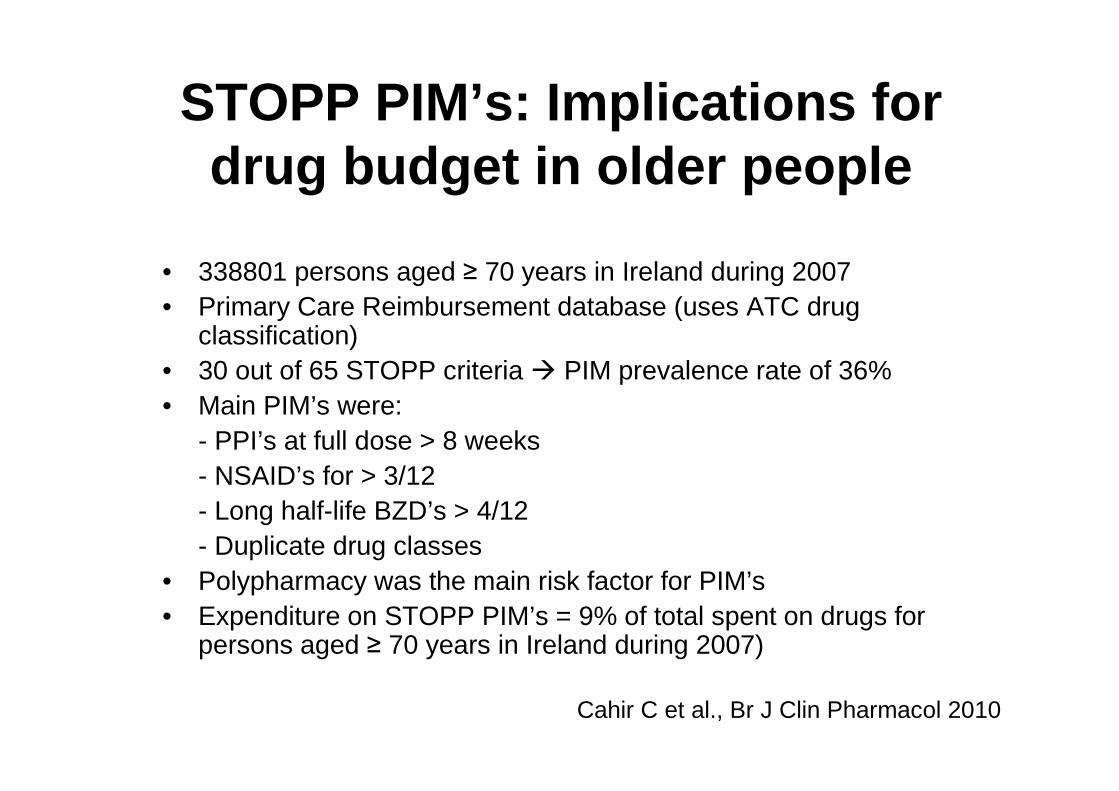
STOPP PIM’s: Implications for drug budget in older people
• 338801 persons aged ≥ 70 years in Ireland during 2007• Primary Care Reimbursement database (uses ATC drug
classification)• 30 out of 65 STOPP criteria � PIM prevalence rate of 36%• Main PIM’s were:
- PPI’s at full dose > 8 weeks- NSAID’s for > 3/12- Long half-life BZD’s > 4/12- Duplicate drug classes
• Polypharmacy was the main risk factor for PIM’s• Expenditure on STOPP PIM’s = 9% of total spent on drugs for
persons aged ≥ 70 years in Ireland during 2007)
Cahir C et al., Br J Clin Pharmacol 2010

STOPP/START Randomized Controlled Trial:
Older patientshospitalized withacute illness
Normal pharmaceutical care (N = 372)
Rigorous application of STOPP & STARTwithin 48 hours of admission (once only)(N = 360)
1o outcomes:- ADR incidence measured at Day 7-10 or at discharge 2o outcomes:- Length of hospital stay (LOS)- Total drug cost

Patients admitted between May 2011 and
May 2012. Assessed for eligibility (n=1042)
Excluded (n= 310)
-Expected length of stay ≤ 48 hours (n=110)
-Not meeting inclusion criteria (n=174)
-Declined to participate (n=20)
-Terminal Illness (=6)
Randomly assigned (n=732)
Control (n=372)
Normal pharmaceutical care
Intervention (n=360)
STOPP/START criteria
Follow-up:
Patient, nursing staff & physician interview
ADR detection, causality & preventability
In- hospital death
(n=9)
Discharged (n= 363)
Follow-up:
Patient, nursing staff & physician interview
ADR detection, causality & preventability
In-hospital death (n= 11)
Discharged (n= 349)
Application of STOPP/STARTcriteria at 48-72 hours post-admission
NIH trial number:NCT01467050
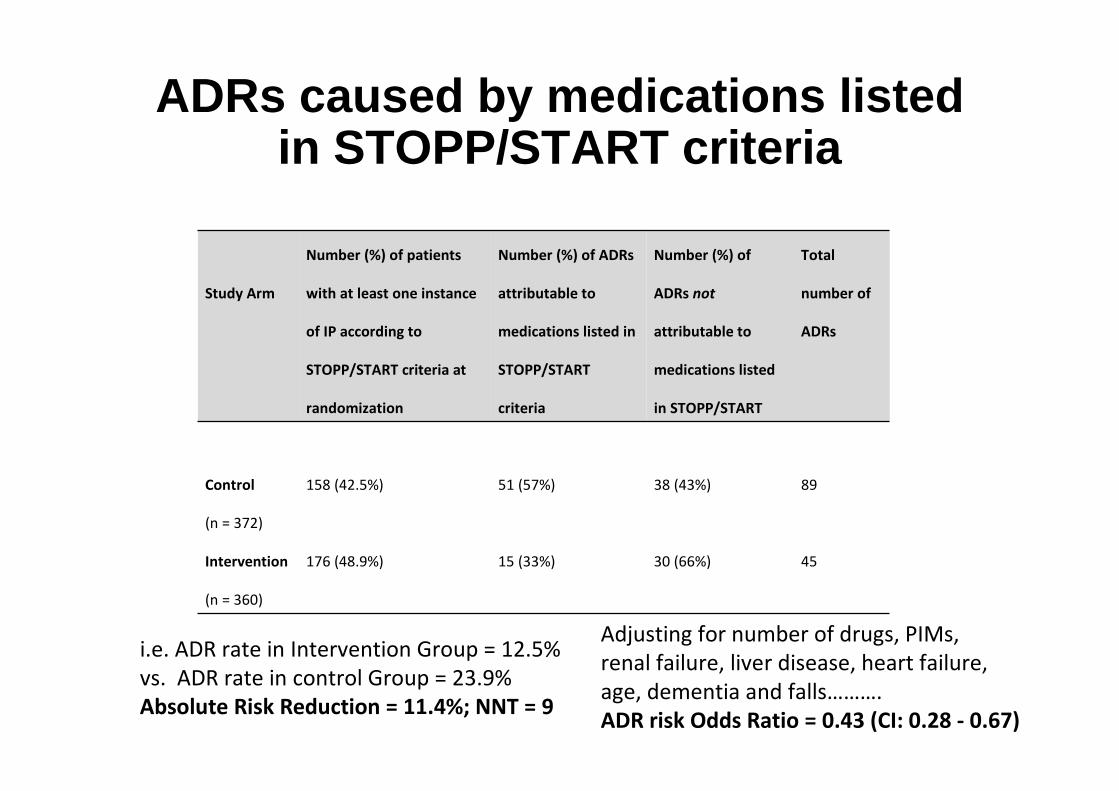
ADRs caused by medications listed in STOPP/START criteria
Study Arm
Number (%) of patients
with at least one instance
of IP according to
STOPP/START criteria at
randomization
Number (%) of ADRs
attributable to
medications listed in
STOPP/START
criteria
Number (%) of
ADRs not
attributable to
medications listed
in STOPP/START
Total
number of
ADRs
Control
(n = 372)
158 (42.5%) 51 (57%) 38 (43%) 89
Intervention
(n = 360)
176 (48.9%) 15 (33%) 30 (66%) 45
i.e. ADR rate in Intervention Group = 12.5%
vs. ADR rate in control Group = 23.9%
Absolute Risk Reduction = 11.4%; NNT = 9
Adjusting for number of drugs, PIMs,
renal failure, liver disease, heart failure,
age, dementia and falls……….
ADR risk Odds Ratio = 0.43 (CI: 0.28 - 0.67)

Secondary outcome measures
• Median (IQR) LOS was the same in both groups i.e. 8(4-14) days.
• Median (IQR) monthly drugs prescription cost at discharge in the intervention group = €73.16 (38.68-121.72); median (IQR) monthly cost in the control group = €90.62 (49.38-162.53), p< 0.001.

Structured Pharmacist Review of Medication RCT
• 4 parts, i.e.(i) Reconciliation of medication(ii) Detection of drug-related problems (DRPs)
using clinical decision support software (CDSS)
(iii) Assessment of CDSS-generated recommendations as applied to the patient
(iv) Preparation & delivery of customised pharmaceutical care plan

Patients assessed for eligibility (n=1833)
Excluded (n= 1,096)-Expected length of stay ≤ 48 hours (n=268)-Not meeting inclusion criteria (n=105)-Declined to participate (n=31)-Terminal Illness (n=45)-Not recruited due to time constraints (n=647)
Randomly assigned (n=737)
Control group (n=376)Routine care
Intervention group (n=361)Structured Pharmacist Review of Medication
Follow-up:Patient, nursing staff & physician interviewADR detection, causality & preventability
In- hospital deaths (n=17)
Discharged (n= 359)
Follow-up:Patient, nursing staff & physician interviewADR detection, causality & preventability
In-hospital deaths (n= 17)
Discharged (n= 344)
NIH trial number:NCT01467128
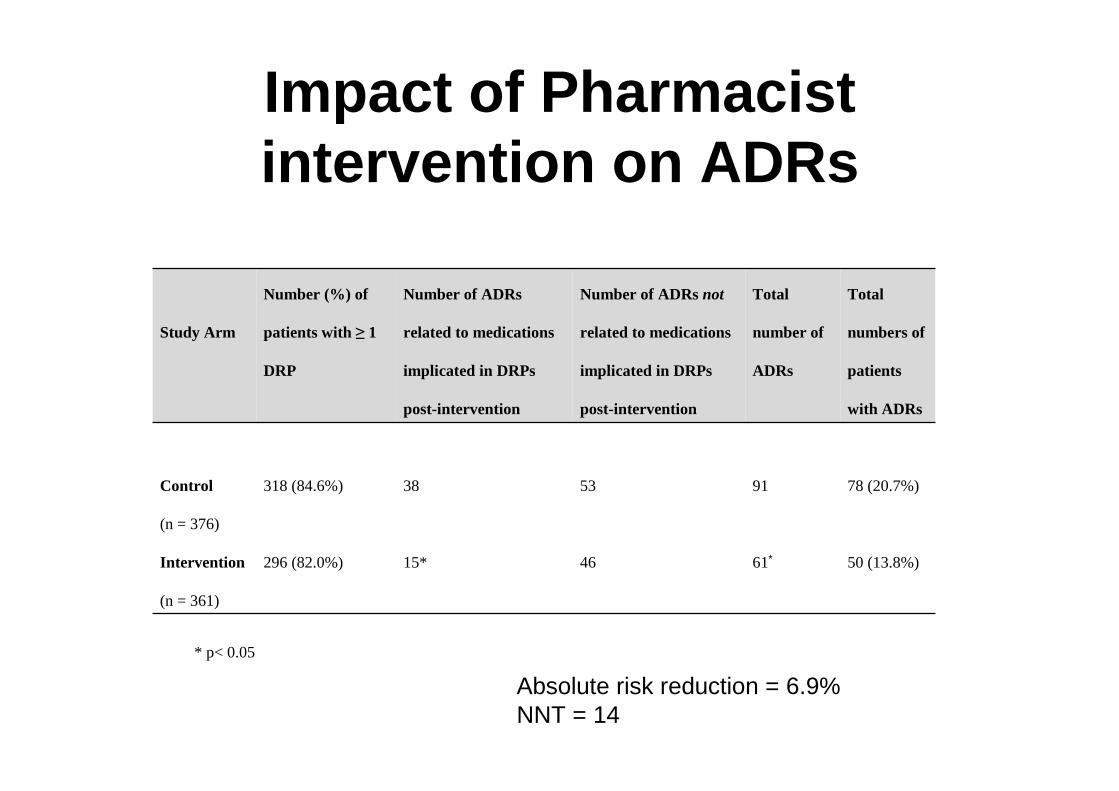
Impact of Pharmacist intervention on ADRs
Study Arm
Number (%) of
patients with ≥ 1
DRP
Number of ADRs
related to medications
implicated in DRPs
post-intervention
Number of ADRs not
related to medications
implicated in DRPs
post-intervention
Total
number of
ADRs
Total
numbers of
patients
with ADRs
Control
(n = 376)
318 (84.6%) 38 53 91 78 (20.7%)
Intervention
(n = 361)
296 (82.0%) 15* 46 61∗ 50 (13.8%)
* p< 0.05
Absolute risk reduction = 6.9%NNT = 14

Prescribing Optimization: Starting with a ‘blank canvas’
Drug indications
Drug-druginteraction
Drug-diseaseinteraction
Potentialinappropriateness
Potentialprescribingomissions
ADR/ADE riskfactors
Indications forpalliative drug
therapy
Generic drug list
Cheapest brands
Assessment of overall medicationappropriateness
Medicationsreconciliation

SENATOR
Age, sex, weight, height
Known diagnoses &severity
Drugs & doses
Drug formulations
Laboratory data:• biochemistry incl. eGFR• haematology• ECG rhythm, ischaemia
Scales: AMTS, Barthel,MNA-sf, CIRS-geriatric
Geriatric syndromesPresent or not?
British National Formulary:Indications, contraindications,
First Data Bank: drug-drug,drug-disease interactions
ADR risk scale
STOPP criteria
START criteria
1-year mortality risk >50%���� palliative therapy
Generic medication list
Least expensive brand list
Medication Appropriateness IndexSHiM screening
Full medication reconciliation

SENATOR clinical trial
• 2000 hospitalized older patients (1000 controls, 1000 intervention arm)
• Cluster-randomized design• SENATOR intervention within 48 hours of study entry• Primary outcome: ADR incidence during hospitalization• Secondary outcomes: MAI score at discharge, proportion
of patients receiving indicated non-pharmacological therapies
• Tertiary outcomes: All-cause mortality, re-hospitalization rate at 3 months post-randomization, total number of prescription drugs per patient
• Economic analysis


Unifying Theory/Concept
Inappropriate medicines
AdverseDrug ReactionsPolypharmacyComplex comorbidity
Polypharmacy is acore problem i.e.
inappropriateover-prescribing in
response to complex comorbidity
Prescribing cascades

Take-home messages - 1
• ADR’s in older people represents a major public health problem.
• ADR incidence is increasing in tandem with increased numbers of older people.
• Comorbid illness leading to polypharmacy is the main cause of ADR’s in old age.

Take-home messages - 2
• Pay careful attention to other ADR risk factors, i.e. chronic kidney disease, liver dysfunction, ADL dependency and inappropriate medication.
• Certain higher-risk medicines demand caution, e.g. insulin, anticoagulants, NSAID’s, neuroleptics, sedatives.
• When 1-year life expectancy is < 50%, consider a switch to palliative pharmacotherapy

Stephen Byrne, PhD Pat Barry, MDPaul Gallagher, PhD Cristin Ryan, PhD
David O’Sullivan, PhD
Marie O’Connor, MDHilary Hamilton, MRCPI
Joe Eustace, MD

Sir William Osler (1849 – 1919)
“One of the first duties of thephysician is to educate the masses not to take (inappropriate) medicine.”
“Imperative drugging – the ordering of medicine in any and every malady (i.e. polypharmacy) -is no longer regarded as the chief function of the doctor.”

A National Conference for Health Care Professionals
Tuesday 29th October 2013
The Westin Dragonara Resort, St Julian’s