a new era for hedge funds? - lyxor · a new era for hedge funds? july 2015 lyxor research white...
TRANSCRIPT

A NEW ERA FOR HEDGE FUNDS?J U L Y 2 0 1 5
L Y X O R R E S E A R C H
WHITE PAPER - ISSUE #12
PHILIPPE FERREIRA
Senior Cross Asset Strategist
JEAN-BAPTISTE BERTHONSenior Cross Asset Strategist
JEANNE ASSERAF-BITTONGlobal Head of Cross Asset Research
JEAN-MARC STENGERCIO Alternative Investments
715812_228195 White Paper.indd 1715812_228195 White Paper.indd 1 02/07/15 15:0702/07/15 15:07

715812_228195 White Paper.indd 2715812_228195 White Paper.indd 2 02/07/15 15:0702/07/15 15:07

3 >>
A N E W E R A F O R H E D G E F U N D S ?
J U LY 2 0 1 5L Y X O R R E S E A R C H
Foreword
Since the financial crisis, excluding the Euro crisis period, hedge funds have lagged traditional
assets until last year. This stands in contrast with the outstanding hedge funds’ track record
delivered over recent decades. Criticism against the lack of hedge funds outperformance
since the financial crisis climaxed in 2014.
The ability of hedge funds to generate sufficient alpha, while adequately capturing the market
beta was then put to question.
In this 12th edition of the White Paper we aim to respond to these questions and to estimate
a sustainable regime of performance achievable by hedge funds over the coming years. In
particular:
■ We review the main causes for the recent performance lag, which include unprecedented
accommodative monetary policies and tighter regulations.
■ They profoundly altered the Volatility / Correlation / Dispersion regimes, which are key drivers
of hedge fund returns.
■ We argue that evidences of a sustainable turn in these regimes are multiplying, which bode
well for the alpha generation environment. A new era might be gradually shaping up for hedge
funds.
■ Besides, we put to test hedge funds’ structural market exposures under 3 long-term macro-
economic scenarios, with a view to estimate a sustainable beta performance contribution.
It is reasonable, in our view, to expect hedge funds to deliver an annual excess returns in the
5-6% range, with low volatility.
We hope that this 12th issue addresses some of the questions our readers may have, while
providing credible assumptions to estimate the performance of hedge funds going forward.
Jean-Marc Stenger
CIO for Alternative Investments.
715812_228195 White Paper.indd 3715812_228195 White Paper.indd 3 02/07/15 15:0702/07/15 15:07

715812_228195 White Paper.indd 4715812_228195 White Paper.indd 4 02/07/15 15:0702/07/15 15:07

A N E W E R A F O R H E D G E F U N D S ?
J U LY 2 0 1 5L Y X O R R E S E A R C H
5 >>
Executive Summary
We evaluate the drivers of hedge fund returns and conclude that the normalisation of US monetary policy
and US equities’ loss of momentum will lead to HF outperformance versus traditional asset classes. We
expect annual excess returns in the 5-6% range.
Hedge funds have underperformed traditional asset classes over recent years. Despite its outstanding
track record over recent decades, the industry has come under mounting pressure. Inflows remain robust,
but hedge funds have significantly lowered both management and performance fees to adapt to the new
environment.
We evaluate the causes of the underperformance and find that the fall in bond yields in the wake of the
Fed’s QE programme has negatively impacted hedge funds. Additionally, the equity beta has fallen while
stocks rallied and alpha generation has shrunk as a result of the low volatility / low dispersion environment.
However, alpha generation has started to rise since mid-2014 and the environment is now improving, with
valuations stretched across the board, the economic cycle maturing and the Fed beginning to normalise
monetary policy.
Going forward and based on conservative assumptions, we estimate that hedge funds could deliver
annual excess returns in the 5-6% range with low volatility. We believe that diversifying portfolios with an
increased allocation to alternatives is particularly attractive at this point in the cycle. Hedge funds have
demonstrated their ability to protect portfolios against wide market fluctuations, a scenario that we cannot
exclude as the Fed turns the screw.
Hedge funds have underperformed recently but their long term track record is outstanding
100
300
500
700
900
1100
1300
1500
100
300
500
700
900
1100
1300
1500
Dec-89 Dec-92 Dec-95 Dec-98 Dec-01 Dec-04 Dec-07 Dec-10 Dec-13
HF underperformequities
HF underperformequities
Rebased at 100 as of December 1989. *The diversified portfolio is 60% MSCI World in USD (total return) and 40% Barclay’s Global Aggregate bond index, rebalanced every month. Source: HFR, Bloomberg, HFR, Lyxor AM.
715812_228195 White Paper.indd 5715812_228195 White Paper.indd 5 02/07/15 15:0702/07/15 15:07

<< 6
A N E W E R A F O R H E D G E F U N D S ?
J U LY 2 0 1 5L Y X O R R E S E A R C H
Hedge Funds Have Come Under Fire Recently...
Hedge funds have come under mounting pressure over the past five years in terms of their ability to deliver
returns in line with investors’ expectations. The bulk of the criticism has been essentially related to the
accusation that hedge funds collect fees that are allegedly no longer in line with the performance they
generate. In this report, we discuss the reasons for such criticism and address the question of hedge funds’
expected returns going forward.
To begin with, the chart below shows that hedge funds have in fact underperformed traditional asset classes
since February 2009. Since this date, global equities have delivered compound annual returns close to 18%
per year (in total return) while hedge funds have generated compound returns below 8%. Similarly, a diversified
portfolio composed of equities and bonds (60/40 respectively) has also generated substantially higher returns
at 12.7% per year.
Hedge funds have underperformed over the last six years
80
100
120
140
160
180
200
220
240
260
280
300
320
340
Feb-09 Feb-10 Feb-11 Feb-12 Feb-13 Feb-14 Feb-15 80
100
120
140
160
180
200
220
240
260
280
300
320
340
Rebased at 100 as of February 2009. *60% MSCI World in USD (total return) and 40% Barclay’s Global Aggregate bond index, rebalanced every month. Source: HFR, Bloomberg, HFR, Lyxor AM
From another perspective, the underperformance of hedge funds has also been seen on a risk-adjusted basis.
The chart below shows that since February 2009, both our diversified portfolio and a fixed income benchmark
have outperformed hedge funds on a risk-adjusted basis. However, hedge funds outperformed global equities
on a risk-adjusted basis thanks to their substantially lower volatility.
715812_228195 White Paper.indd 6715812_228195 White Paper.indd 6 02/07/15 15:0702/07/15 15:07

A N E W E R A F O R H E D G E F U N D S ?
J U LY 2 0 1 5L Y X O R R E S E A R C H
7 >>
It is interesting to note that looking beyond the overall hedge fund underperformance, some strategies have
stood out as strong performers. The Relative Value and Event Driven strategies have shown the highest
Sharpe ratios since 2009, respectively outperforming the fixed income benchmark and a diversified portfolio.
On the other side of the spectrum, Equity Hedge and Macro managers have underperformed, in particular the
so-called systematic diversified sub-strategy (CTAs). It is therefore important to keep in mind that hedge funds
constitute a heterogeneous asset class. Picking the right strategy and the right fund is the key here.
Over the last six years, hedge funds have underperformed a diversified portfolio on a risk adjusted
basis
-0.2
0.3
0.8
1.3
1.8
2.3
2.8
HFRI Relative
Value
Barclays Global
Aggregate
HFRI Event -Driven
Diver d (60 eqty/40
bond)
HFRI MSCIWorld
HFRI Equity Hedge
HFRI Macro (Total) Index
HFRI Macro: Systematic Diver
Sharpe ratio 2009 -2015
Sharpe ratio calculated using the 3m interest rates as the risk free rate. Source: Bloomberg, HFR, Lyxor AM
The underperformance of hedge funds has put the industry under pressure. Although hedge funds continue to
raise money year after year (with global AuM now reaching USD3 trillion), fees have been trending downward.
The chart below highlights the fact that the “two and twenty” hedge fund fee structure no longer prevails.
The current average fee structure for the industry is a 1.5% management fee and 17% performance fee. On
average, the smallest hedge funds have the highest fees (1.53% / 18%) while the largest have the lowest fees
(1.37% / 16%).
715812_228195 White Paper.indd 7715812_228195 White Paper.indd 7 02/07/15 15:0702/07/15 15:07

A N E W E R A F O R H E D G E F U N D S ?
J U LY 2 0 1 5L Y X O R R E S E A R C H
<< 8
The underperformance of the industry has translated into pressure on fees
16
16.5
17
17.5
18
18.5
19
1.25
1.3
1.35
1.4
1.45
1.5
1.55
1.6
1.65
2006 2007 2008 2009 2010 2011 2012 2013
Management fees (% of AuMs) - LEFT HS
Performance fees (% of pro ) - RIGHT HS
15%
16%
17%
18%
19%
1.2% 1.4% 1.6% 1.8%
Average Fees by Fund size
Management fees
Performance fees
$5bn+(1.37%; 16%)
All HF's(1.53%; 17%)
$1-$5bn(1.47%; 17%)
<$1bn(1.53%; 18%)
Source : HFR, Lyxor AM
Hedge funds continue to raise money
0
500
1000
1500
2000
2500
3000
90 92 94 96 98 00 02 04 06 08 10 12 14 -100 0 100 200
Relative Value
Event-Driven
Macro
Equity Hedge
Source : HFR, Lyxor AM
715812_228195 White Paper.indd 8715812_228195 White Paper.indd 8 02/07/15 15:0802/07/15 15:08
A N E W E R A F O R H E D G E F U N D S ?
J U LY 2 0 1 5L Y X O R R E S E A R C H
9 >>
...in Spite of an Outstanding Track Record
FOUR STYLISED FACTS
Historical data on hedge fund performance dates back to the early 90s. With 25 years of reliable data on hedge
funds across different business cycles, we are now able to draw strong conclusions regarding the asset class
in both absolute and relative terms. As such, we discuss in this section four principal stylised facts: absolute
performance, relative performance, risk-adjusted performance and decorrelation:
– The absolute performance of hedge funds has been outstanding: We calculate that annualised returns
of hedge funds after fees since 1990 have been above 10%. We also calculate that hedge funds have been
strong generators of “alpha”, creating an average of 4.5% per year between 1990 and 20151.
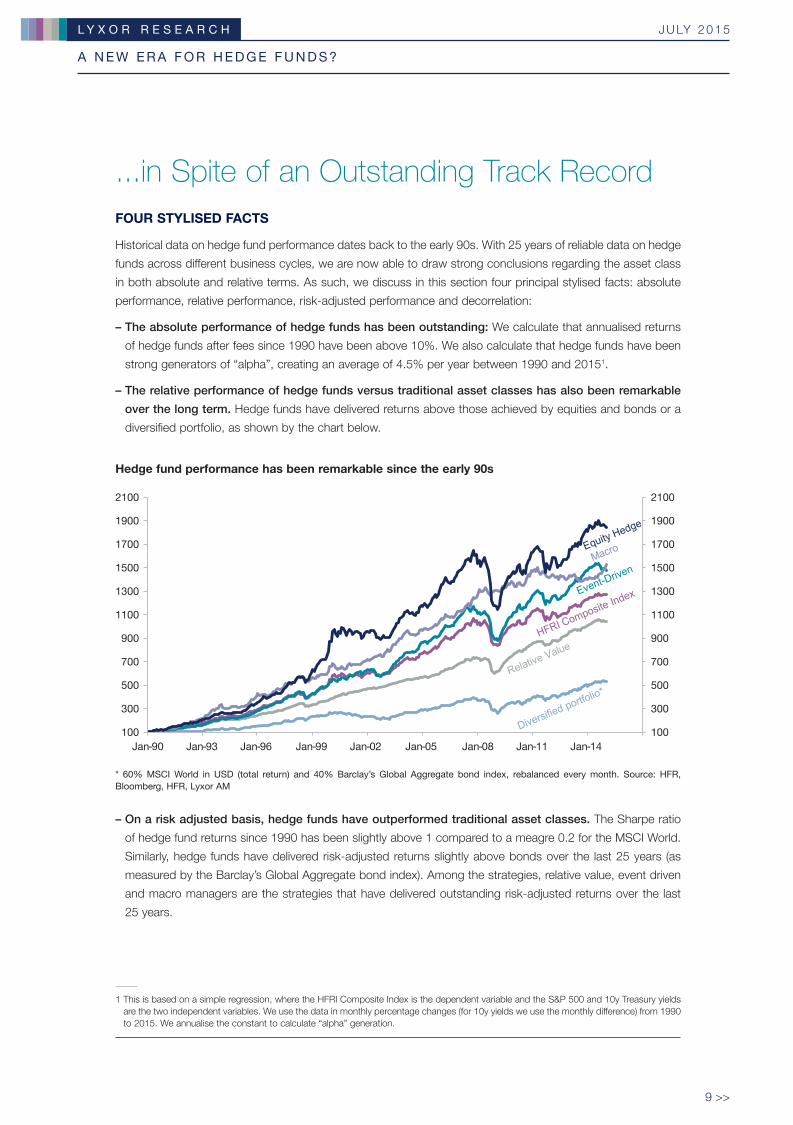
– The relative performance of hedge funds versus traditional asset classes has also been remarkable
over the long term. Hedge funds have delivered returns above those achieved by equities and bonds or a
diversified portfolio, as shown by the chart below.
Hedge fund performance has been remarkable since the early 90s
Jan-93 Jan-96 Jan-99 Jan-02 Jan-05 Jan-08 Jan-11 Jan-14 100
300
500
700
900
1100
1300
1500
1700
1900
2100
100
300
500
700
900
1100
1300
1500
1700
1900
2100
Jan-90
* 60% MSCI World in USD (total return) and 40% Barclay’s Global Aggregate bond index, rebalanced every month. Source: HFR, Bloomberg, HFR, Lyxor AM
– On a risk adjusted basis, hedge funds have outperformed traditional asset classes. The Sharpe ratio
of hedge fund returns since 1990 has been slightly above 1 compared to a meagre 0.2 for the MSCI World.
Similarly, hedge funds have delivered risk-adjusted returns slightly above bonds over the last 25 years (as
measured by the Barclay’s Global Aggregate bond index). Among the strategies, relative value, event driven
and macro managers are the strategies that have delivered outstanding risk-adjusted returns over the last
25 years.
1 This is based on a simple regression, where the HFRI Composite Index is the dependent variable and the S&P 500 and 10y Treasury yields are the two independent variables. We use the data in monthly percentage changes (for 10y yields we use the monthly difference) from 1990 to 2015. We annualise the constant to calculate “alpha” generation.
715812_228195 White Paper.indd 9715812_228195 White Paper.indd 9 02/07/15 15:0802/07/15 15:08

A N E W E R A F O R H E D G E F U N D S ?
J U LY 2 0 1 5L Y X O R R E S E A R C H
<< 10
Hedge funds have outperformed risk assets on a risk adjusted basis
-0.2
0.2
0.6
1.0
1.4
1.8
HFRI Relative Value
HFRI Event-Driven
HFRI Macro
(Total)Index
HFRI Barclays
Global Aggregate
HFRI EquityHedge
HFRI Macro: Systematic Diver
Diver d (60 eqty/ 40 bond)
MSCIWorld
Sharpe ratio 1990-2015
Sharpe ratio calculated using the 3m interest rates as the risk free rate. Source: Bloomberg, HFR, Lyxor AM
– The correlation between hedge funds and conventional asset classes has been low. The less correlated
strategy appears to have been Macro managers, which includes systematic managers. The correlation of
the HFRI Macro with a diversified portfolio composed of 60% equities and 40% bonds has been as low
as 0.4. The Macro strategy has been evenly correlated to equities and bonds at 0.35. Additionally, some
strategies such as Event Driven and Equity Hedge have shown no correlation with bonds (see table). Finally,
the correlation with equities has been higher for Event Driven and Equity Hedge managers at around 0.7.
One important reason why hedge funds have shown better risk adjusted returns is their low volatility. As
shown by the last line in the table below, all strategies have a lower annualised volatility than a diversified
60/40 portfolio. The annualised volatility of hedge funds over the entire period (1990-2015) has ranged from
4.3% for relative value to 9% for Equity Hedge compared to 9.2% for our diversified portfolio.
Low correlation between hedge funds and traditional asset classes
1990 - 2015
HFRI Relative
Value
HFRI Macro:
Systematic Diversified
HFRI Event Driven
HFRI Equity Hedge
HFRI Macro Index
MSCI World
Barclay’s bond index
Div portfolio
60/40
HFRI Relative Value 1
HFRI Macro: Systematic Diversified
0.16 1
HFRI Event Driven 0.78 0.38 1
HFRI Equity Hedge 0.68 0.49 0.84 1
HFRI Macro Index 0.34 0.6 0.5 0.55 1
MSCI World 0.53 0.41 0.69 0.72 0.35 1
Barclay’s bond index 0.07 0.14 0.02 0.04 0.35 0.09 1
Div portfolio 60/40 0.53 0.42 0.68 0.71 0.39 0.99 0.21 1
Annualized Volatility 4.3% 7.4% 6.7% 9.0% 7.3% 15.1% 3.0% 9.2%
* 60% MSCI World in USD (total return) and 40% Barclay’s Global Aggregate bond index, rebalanced every month. The Sharpe ratio is
calculated using the 3m interest rate as the risk free rate. Source: Bloomberg, HFR, Lyxor AM
715812_228195 White Paper.indd 10715812_228195 White Paper.indd 10 02/07/15 15:0802/07/15 15:08

A N E W E R A F O R H E D G E F U N D S ?
J U LY 2 0 1 5L Y X O R R E S E A R C H
11 >>
1 For further details on the biases of hedge fund databases, see Cazalet Z. and B. Zheng (2014), “Hedge Funds in Strategic Asset Allocation”, Lyxor White Paper #11 (March)
2 See Ibbotson R.G., Chen P. and Zhu, K. X. (2011), “The ABCs of hedge funds: alphas, betas, and costs.” Financial Analysts Journal (67):15–25.
3 See for instance Jagannathan R., Malakhov A. and Novikov D. (2010), “Do hot hands exist among hedge fund managers? An empirical evaluation,” The Journal of Finance, 65(1), pp. 217-255.
Box 1: Hedge fund indices and their limitations
There are several sources of data for hedge fund performances. However, none is official given that
the industry does not have a public organisation that collects comprehensive information. Market
participants rely on diverse sources that receive information on a voluntary basis, with significant
shortcomings. The usual biases are i) selection bias (hedge funds have no obligation to report
their performance and weak performing funds may not report), ii) survivorship bias (the tendency
to exclude “dead funds”), iii) backfill bias (when a hedge fund is added to a database, its manager
can choose whether or not to report its returns prior to the date of submission) and iv) liquidity
bias (some hedge fund strategies invest in illiquid assets for which market prices are not readily
available)1.
The most popular databases are all exposed to these well-known biases. As a result, the use of
these benchmarks is being increasingly challenged given that they allegedly overstate hedge fund
performance. Some market participants have adopted patchy solutions, such as shaving off hedge
fund indices by several percentage points a year. One study suggests that taking into account the
biases in the TASS database would reduce the reported returns of hedge funds between 1995 and
2006 from 16.5% to 9%2.
In spite of these biases, the alternatives are very limited here. In our report, we have decided to
use the HFR database, which is the most frequently referenced by investors and practitioners3. The
following is a brief description of the main hedge fund databases:
– Hedge Fund Research has reported the performance net of fees of nearly 7,000 funds and funds
of funds since 1990. It has also created 32 equally weighted monthly HFRI indices. These HFRI
indices are the most popular indices, with over 2,000 funds at present.
– The TASS or Lipper database contains the performance of 7,500 live funds and funds of funds
along with more than 11,000 dead funds. 14 value-weighted CSFB/Tremont indices have been
created, resulting from the joint venture between Credit Suisse First Boston and Tremont Advisor.
– The Morningstar Center for International Securities and Derivatives Markets (CISDM) database
has reported the performance of more than 5,000 live hedge funds, funds of funds and CTAs since
1994. Eleven indices have been created from this database.
– The EurekaHedge database was created by ABN Amro and Eurekahedge Fund Advisor. It covers
about 6,700 funds and 2,800 funds of funds and offers an equally-weighted benchmark along with
geographical indices and indices for UCITS hedge funds.
715812_228195 White Paper.indd 11715812_228195 White Paper.indd 11 02/07/15 15:0802/07/15 15:08
A N E W E R A F O R H E D G E F U N D S ?
J U LY 2 0 1 5L Y X O R R E S E A R C H
<< 12
Why Hedge Funds Have Underperformed
Recently
The debate concerning the extent of the underperformance of hedge funds has much to do with the benchmark
against which the asset class is compared. However, as shown above, hedge funds have underperformed a
traditional 60/40 diversified portfolio on a risk-adjusted basis since February 2009. Consequently, we will not
discuss the particularities of which benchmark we should adopt to compare the performance of hedge funds.
Instead, we will accept the recent underperformance as a fact and focus on its causes.
In our view, there are five main reasons why hedge funds have underperformed traditional asset classes. Some
factors appear to be cyclical, such as the equity market rally that took place in the wake of the global financial
crisis and the market distortions caused by the Fed’s QE in terms of bond yields. Other factors appear to be
structural, such as the institutionalisation of hedge funds and the increased regulatory pressure:
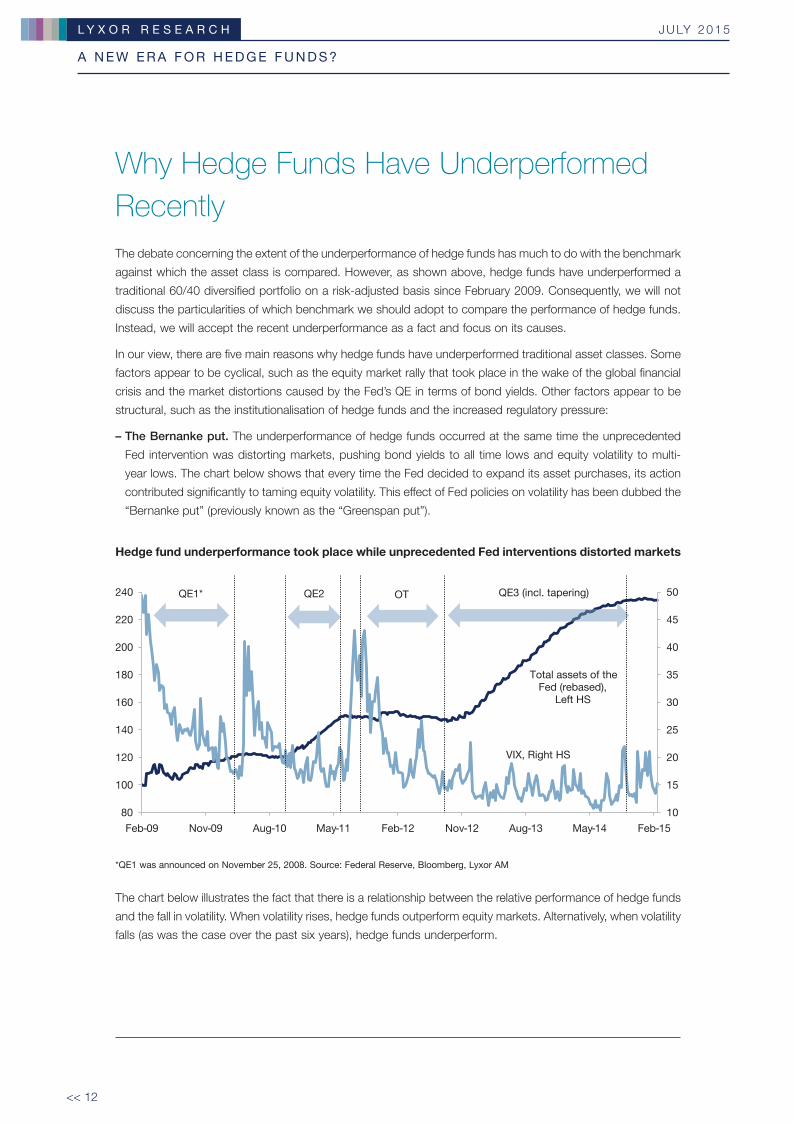
– The Bernanke put. The underperformance of hedge funds occurred at the same time the unprecedented
Fed intervention was distorting markets, pushing bond yields to all time lows and equity volatility to multi-
year lows. The chart below shows that every time the Fed decided to expand its asset purchases, its action
contributed significantly to taming equity volatility. This effect of Fed policies on volatility has been dubbed the
“Bernanke put” (previously known as the “Greenspan put”).
Hedge fund underperformance took place while unprecedented Fed interventions distorted markets
10
15
20
25
30
35
40
45
50
80
100
120
140
160
180
200
220
240
QE1* QE2 OT QE3 (incl. tapering)
Total assets of the Fed (rebased),
Left HS
VIX, Right HS
Feb-09 Nov-09 Aug-10 May-11 Feb-12 Nov-12 Aug-13 May-14 Feb-15
*QE1 was announced on November 25, 2008. Source: Federal Reserve, Bloomberg, Lyxor AM
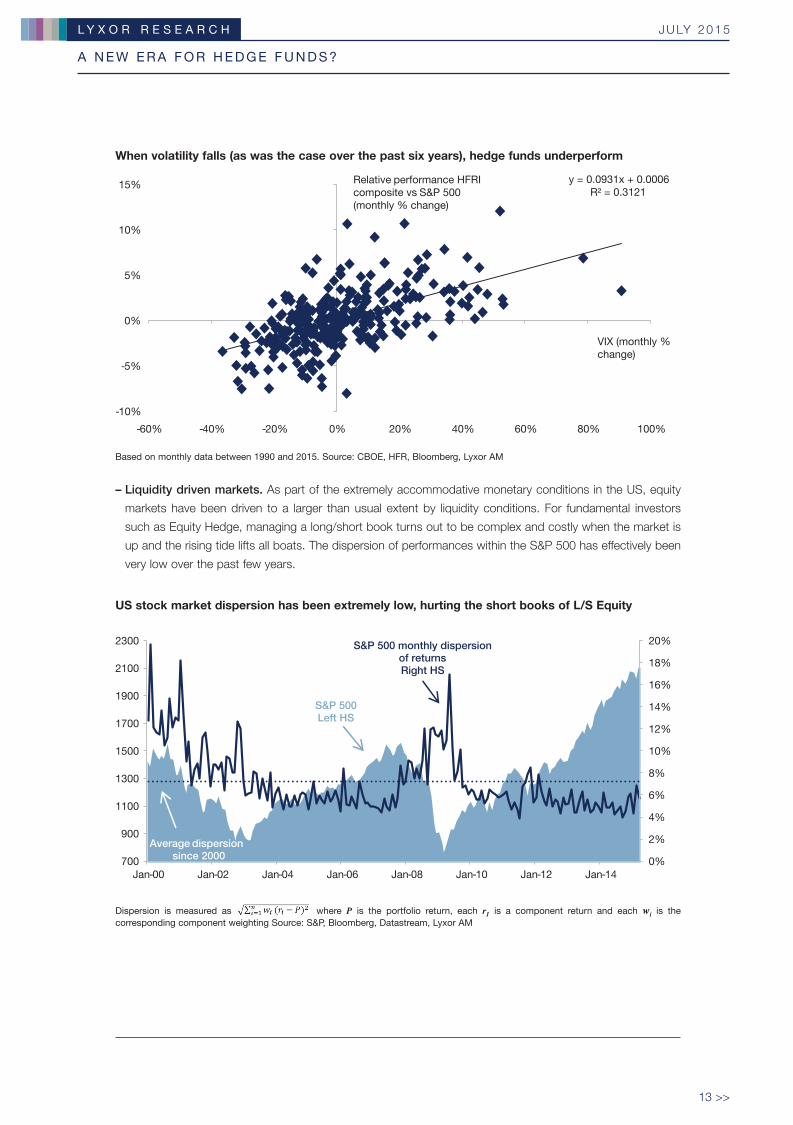
The chart below illustrates the fact that there is a relationship between the relative performance of hedge funds
and the fall in volatility. When volatility rises, hedge funds outperform equity markets. Alternatively, when volatility
falls (as was the case over the past six years), hedge funds underperform.
715812_228195 White Paper.indd 12715812_228195 White Paper.indd 12 02/07/15 15:0802/07/15 15:08
A N E W E R A F O R H E D G E F U N D S ?
J U LY 2 0 1 5L Y X O R R E S E A R C H
13 >>
When volatility falls (as was the case over the past six years), hedge funds underperform
y = 0.0931x + 0.0006 R² = 0.3121
-10%
-5%
0%
5%
10%
15%
-60% -40% -20% 0% 20% 40% 60% 80% 100%
VIX (monthly % change)
Relative performance HFRI composite vs S&P 500 (monthly % change)
Based on monthly data between 1990 and 2015. Source: CBOE, HFR, Bloomberg, Lyxor AM
– Liquidity driven markets. As part of the extremely accommodative monetary conditions in the US, equity
markets have been driven to a larger than usual extent by liquidity conditions. For fundamental investors
such as Equity Hedge, managing a long/short book turns out to be complex and costly when the market is
up and the rising tide lifts all boats. The dispersion of performances within the S&P 500 has effectively been
very low over the past few years.
US stock market dispersion has been extremely low, hurting the short books of L/S Equity
S&P 500 monthly dispersion of returns Right HS
Average dispersion since 2000
S&P 500 Left HS
0%
2%
4%
6%
8%
10%
12%
14%
16%
18%
20%
700
900
1100
1300
1500
1700
1900
2100
2300
Jan-00 Jan-02 Jan-04 Jan-06 Jan-08 Jan-10 Jan-12 Jan-14
Dispersion is measured as where P is the portfolio return, each r1 is a component return and each wi is the corresponding component weighting Source: S&P, Bloomberg, Datastream, Lyxor AM
715812_228195 White Paper.indd 13715812_228195 White Paper.indd 13 02/07/15 15:0802/07/15 15:08

A N E W E R A F O R H E D G E F U N D S ?
J U LY 2 0 1 5L Y X O R R E S E A R C H
<< 14
– The fall in bond yields has been particularly unprecedented in the context of the decline in potential output
in advanced economies, rising disinflationary pressures and central bank interventions. We will show in the
next section that the dramatic fall in bond yields has had a negative impact on hedge fund performance.
– The institutionalisation of hedge funds. The recent underperformance of hedge funds may also have
structural components. There are lingering questions regarding whether the sharp evolution of the hedge
fund investor base over the last decade has negatively impacted its performance. This refers to the fact that
institutional investors (particularly pension funds) have poured huge amounts of money into hedge funds.
Institutional investors now represent two-thirds of the hedge fund investor base, up from 20% a decade
earlier. While this has contributed to increasing financial stability and reduced leverage ratios, operating costs
have ballooned to meet demands for greater compliance and transparency and to implement tighter internal
controls2.
– The changing regulatory environment. The burgeoning of new financial regulations since 2008 (such as
FACTA and Dodd Frank in the US) may have impacted the hedge fund industry more than any other segment
of the financial industry. This is due to the fact that compliance with financial regulations predominantly affects
smaller firms. In a 2013 survey by KPMG, it was estimated that hedge funds had seen a 10% increase in
annual operating costs since 2008 attributable to compliance costs resulting from Dodd Frank reforms in
the US 3.
Going forward, we believe that several factors discussed above will probably be less important in influencing
hedge fund performance. The Fed’s QE is over and the US is on track for some form of monetary policy
normalisation. Meanwhile, stock market dispersion is converging towards its long-term average. Finally, based
on our interactions with the industry, there is anecdotal evidence that five years after the passage of the Dodd-
Frank bill, the marginal cost for hedge funds of implementing the new regulations is falling.
2 See Labosky C. (2012), “The Institutionalization of Hedge Funds and the Asymmetric Price of Reputation”, Yale Journal on Regulation.
3 See Mirsky R., A. Baker and R. H. Baker (2013), “The Cost of Compliance” – 2013 KPMG/AIMA/MFA Global Hedge Fund Survey.” See also Crain N. V. and W. M. Crain (2010), “The Impact of Regulatory Costs on Small Firms”, report prepared for the SBA Office of Advocacy.
715812_228195 White Paper.indd 14715812_228195 White Paper.indd 14 02/07/15 15:0802/07/15 15:08

A N E W E R A F O R H E D G E F U N D S ?
J U LY 2 0 1 5L Y X O R R E S E A R C H
15 >>
4 See Ibbotson et al. op. cit. p.6. See also Fung, W and, Hsieh, D. (2004), “Hedge fund benchmarks: A risk based approach.” Financial Analyst Journal (60): 65–80.
Estimating the Drivers of Hedge Fund Returns
In order to estimate the determinants of hedge fund returns, we ran a simplistic approach consisting of using
the returns of the S&P 500 (in total return) and the changes in 10y Treasury yields to explain the excess
returns of the HFRI Composite Index. We used data for US markets (and US Treasury yields) rather than global
markets (and bond prices) to make the projections in the next section easier to handle. Additionally, running the
regressions using the MSCI World and the JPM Global aggregate bond index did not change the magnitude,
the sign and the significativity of the coefficients (see tables 2 and 3 on pages 15 and 16).
We estimate the regressions using ordinary least squares with variables in monthly percentage changes in
order to deal with stationarity. We found no autocorrelation in the residuals. Technical details can be found in
the appendix. The main results are the following:
– Alpha generation has been significant at an average of 4.5% per year between 1990 and 2009. It has
nevertheless fallen since 2009 to 1.2% per year. At 3.7% for the full period, it is within the range of estimates
available in the academic literature4.
– The equity beta has been close to 35% for the full period and has fallen to 31% since 2009. This is also in
line with previous estimates.
– The bond yield beta has been around 60% and has increased since 2009 to 70%. This implies that the fall
in bond yields in the wake of the global financial crisis hampered hedge fund performance over the period.
– The fit of the regression suggests an important portion of hedge fund returns (55% for the period 1990-2015)
is explained by these two variables. Since 2009, these two variables have explained 73% of hedge fund
returns.
Alpha generation shrunk over the last six years The fall in bond yields had stronger implications
4.5%
3.7%
1.2%
0%
1%
2%
3%
4%
5%
Alpha
1990-2015
1990-2009 2009-2015
0.34
0.58
0.35
0.60
0.31
0.70
0
0.1
0.2
0.3
0.4
0.5
0.6
0.7
0.8
S&P 500 TR 10y Treasury yield
1990-2015
1990-2009
2009-2015
Annualized alpha of the HFRIComposite (excess returns)
Beta estimates
We used the Libor 3m as the risk free rate. Source : HFR, Bloomberg, Lyxor AM
715812_228195 White Paper.indd 15715812_228195 White Paper.indd 15 02/07/15 15:0802/07/15 15:08

A N E W E R A F O R H E D G E F U N D S ?
J U LY 2 0 1 5L Y X O R R E S E A R C H
<< 16
Extrapolating Hedge Fund Returns
Going forward and based on the coefficients estimated above and a few conservative assumptions, we
estimate that hedge funds could deliver excess returns above 5% per year (over the risk free rate) with low
volatility. We believe that our 5% estimate is a minimum and there is upside potential from here. In order to
estimate these expected returns, we made a few assumptions as described below.
ASSUMPTIONS REGARDING ALPHA GENERATION
According to the academic litterature, Alpha is a concept that measures scarce managerial talents5. It is defined
as the difference between a portfolio’s risk-adjusted return and the return for an appropriate benchmark. When
applied to hedge funds, the concept is particularly challenging given that it requires adopting a benchmark for
a heterogeneous asset class.
Additionally, the concept of alpha itself is being challenged by the discovery of new risk factors. John Cochrane
of the University of Chicago coined the term “zoo of factors” in his 2011 presidential address to the American
Finance Association6. According to this view, there is no alpha, just beta to be discovered.
Despite these academic debates, we used the conventional approach consisting of estimating alpha as
the constant of a regression. Regressing the HFRI monthly returns on the US equity and bond markets, we
estimate that a significant portion of hedge fund returns (2/3 to be precise since 1990) has been the result of
alpha generation.
However, the contribution of alpha to hedge fund returns is not constant over time. As shown by the table
below, it is highly influenced by the volatility / correlation / dispersion regimes. For instance, a high volatility
regime is usually associated with significant dispersion in asset returns, a key factor in generating alpha (below
signalled by ++). At the same time, sudden spikes of volatility or dispersion (usually occurring on macro shocks)
are detrimental (below signalled by --).
Impact of market conditions on alpha generation by hedge funds
IMPACT OF MARKET REGIMES ON ALPHA GENERATION
High Low Spiking Plunging
Volatility ++ - -- -
Correlation - + - +
Dispersion ++ - -- -
5 See Berk, J.B., Green, R.C. (2004), “Mutual fund flows and performance in rational markets.” Journal of Political Economy (112): 1269–1295.
6 Cochrane, John H. 2011. “Presidential Address: Discount Rates.” Journal of Finance, vol. 66, no. 4 (August):1047–1108
715812_228195 White Paper.indd 16715812_228195 White Paper.indd 16 02/07/15 15:0802/07/15 15:08

A N E W E R A F O R H E D G E F U N D S ?
J U LY 2 0 1 5L Y X O R R E S E A R C H
17 >>
In our projections, we assumed that alpha generation going forward will revert to the levels seen in the past.
Given the fact that alpha generation has in fact been lower since 2009, we applied a margin of safety. We
assumed that alpha generation will equal 3% per year over the next two years (below the 3.7% seen throughout
1990-2015) and 4% between 2017 and 2020 (below the 4.5% seen between 1990 and 2009). This is
consistent with our scenario for a gradual rise in volatility and dispersion as a result of the maturing economic
cycle, streched valuations and the normalisation of monetary policy in the US.
THREE MARKET SCENARIOS FOR THE US OVER THE NEXT FIVE YEARS
In addition to the above assumptions, we established three forecast scenarios for US equity performances
and US 10y Treasury yields over the next five years. We then applied the beta coefficients calculated above to
estimate hedge fund returns.
#1: Normalisation of policy rates in the US
Our first set of forecasts implies that the Fed will begin to normalise policy rates in the second half of 2015 at a
pace broadly expected by the market. As such, market disruptions would be limited and the rise in 10y bond
yields would also be moderate. However, as the economic cycle matures, the US would face a mild recession
by 2017. Overall, returns on US equities would average in the mid-single digits, in line with what their current
valuation suggests. Regarding bond yields, the normalisation of policy rates would push bond yields higher.
However, they would remain below 3% for the next three years, as the economic cycle is at an advanced stage.
By the end of the period considered here (the end of the decade), US 10y Treasury yields would approach 4%.
#2: Fed tightens faster than expected
Our second set of forecasts implies that the US economic recovery strengthens in the second half of 2015
and the Fed tightens faster than currently expected by the market. This would negatively impact US equities
over the next two years and push 10y Treasury yields above 4% in 2016. However, the strength of the US
economy would support risk assets. US equities would deliver high single-digit returns by the end of the period
considered here (2018-2020). 10-year US Treasury yields would be above 4%.
#3: Secular stagnation
In this scenario, the soft patch observed in the first half of 2015 would continue and lead to a delayed and
shorter policy rate hike cycle than currently discounted by the market. Risk assets would be somewhat
supported by the Fed, although returns would remain in mid-single digits due to streched valuations. However,
the Fed dovishness would tame volatility. Bond yields would remain slightly above 2%, the level seen at present.
This scenario is consistent with current views debated in US policy circles.
715812_228195 White Paper.indd 17715812_228195 White Paper.indd 17 02/07/15 15:0802/07/15 15:08

A N E W E R A F O R H E D G E F U N D S ?
J U LY 2 0 1 5L Y X O R R E S E A R C H
<< 18
Our three scenarios have different implications for US equities and bonds yields
S&P 500 TR (% change)Assumptions 10y Treasury yieldsAssumptions
-4%
-2%
0%
2%
4%
6%
8%
10%
0.0%
0.5%
1.0%
1.5%
2.0%
2.5%
3.0%
3.5%
4.0%
4.5%
5.0%
2015 2016 2017 2018 2019 2020 2015 2016 2017 2018 2019 2020
Scenario 1Scenario 2Scenario 3
Scenario 1Scenario 2Scenario 3
Source : Lyxor AM
IMPLICATIONS FOR HEDGE FUND RETURNS
We extract the beta equity and beta bond yield discussed in the previous section to estimate hedge fund
excess returns. The results suggest that the second scenario (Fed tightens faster than expected) would be
better for hedge fund returns to the extent that it would imply higher volatility. At the same time, the third
scenario (secular stagnation) would be the worst. Overall, hedge fund excess returns would be above 5% per
year. We believe that our 5% estimate is a minimum and there is upside potential from here.
Hedge funds set to deliver (excess) returns over 5%
#3
#2
#1
-10%
-5%
0%
5%
10%
15%
2010 2012 2014 2016 2018 2020
Historical Excess Returns of hedge funds over Libor 3m
Expected (excess) returns according to the different scenarios
715812_228195 White Paper.indd 18715812_228195 White Paper.indd 18 02/07/15 15:0802/07/15 15:08

A N E W E R A F O R H E D G E F U N D S ?
J U LY 2 0 1 5L Y X O R R E S E A R C H
19 >>
Technical Appendix
In this section, we provide details on the data used in the regressions and provide descriptive statistics. We
also discuss the econometric specification.
DATA
In order to estimate the determinants of hedge fund returns, we used the Hedge Fund Research database
with data from December 1989 to February 2015. All indices are computed on monthly percentage changes
in order to deal with potential stationarity issues. We used the HFRI Fund Weighted Composite Index (HFRI).
To the extent that our objective was to make projections on hedge fund returns while limiting the number of
assumptions, we focused on the explanatory power of US equities and US Treasuries. We used monthly returns
of the S&P 500 (in total return) and the monthly difference of the 10-year Treasury yield as explanatory variables.
It is important to note that we also tested global benchmarks for equity and bond markets (respectively the
MSCI World in total return and the J.P. Morgan Global Aggregate Bond Index (in total return unhedged USD)
but found no significant differences with regards to the magnitude, the sign and significativity of the coefficients.
Finally, we tested the serial autocorrelation of the residuals using the Ljung-Box test (Box-Pierce). The results
suggested that we could not reject the null hypothesis that the residuals were independently distributed at the
95% threshold. Hence we proceeded with the Ordinary Least Squares method.
DESCRIPTIVE STATISTICS
In this section, we provide descriptive statistics concerning the variables used in this report from January 1990
to February 2015. We can see some significant differences. In particular, hedge funds deliver monthly returns
on par with equities on average over the long term (0.9%), while volatility is comparable to bonds (2%).
Variable Mean STD Median Skewness Kurtosis Min Max
ΔHFRI 0.9% 2% 1.0% -0.7 2.6 -8.7% 7.7%
ΔSPX500 0.9% 4.2% 1.3% -0.6 1.2 -16.8% 11.4%
ΔUST10Y(price) 0.1% 2.1% 0.2% 0.1 1.45 -7.4% 9.6%
All statistics are computed on a monthly basis; in percentage change for equities and percentage points for bond yields. HFRI refers to the HFRI Fund weighted Composite Index).
ECONOMETRIC SPECIFICATION
As stated above, we tested the explanatory robustness of two variables (equities and bonds), using respectively
two benchmarks for each asset class (US benchmarks and global benchmarks). The specification is as follows:
where Rt represents the returns of Hedge Fund strategies at time t, α is a constant that measures alpha,
ΔEQTYt represents the monthly percentage change of equities in total return at time t, ΔBONDSt represents
the monthly variation in bond yields at time t, in percentage change, εt is a mean zero error term that captures
unobserved heterogeneity.
715812_228195 White Paper.indd 19715812_228195 White Paper.indd 19 02/07/15 15:0802/07/15 15:08

A N E W E R A F O R H E D G E F U N D S ?
J U LY 2 0 1 5L Y X O R R E S E A R C H
<< 20
RESULTS
Table 1:
HFRI Composite excess returns over Libor 3m
(1)
Feb 1990- Feb 2015
(2)
Feb 1990- Jan 2009
(3)
Feb 2009-Feb 2015
Intercept 0.0030*** 0.0037*** 0.0010
(0.0008) (0.0010) (0.0011)
S&P 500 TR 0.3374*** 0.3480*** 0.3109***
(0.0180) (0.0222) (0.0261)
10y Treasury yield 0.5797** 0.6026* 0.7010*
(0.2809) (0.3380) (0.4464)
Observations 301 228 73
Adjusted R2 55% 52% 73%
Annualized Alpha 3.7% 4.5% 1.2%
Standard errors in parentheses. ***, **, * indicate statistical significance at 1%, 5% and 10% respectively. Source: Lyxor AM.
Table 2 (with US bond prices instead of US bond yields)
HFRI Composite excessreturns over Libor 3m
(1)
Feb 1990- Feb 2015
(2)
Feb 1990- Jan 2009
(3)
Feb 2009-Feb 2015
Intercept 0.0030*** 0.0037*** 0.0010
(0.0008) (0.0009) (0.0011)
S&P 500 TR 0.3354*** 0.3470*** 0.3073***
(0.0180) (0.022) (0.0262)
10y Treasury price -0.0794*** -0.0826*** -0.090*
(0.0360) (0.0444) (0.0519)
Observations 301 228 73
Adjusted R2 55% 52% 74%
Annualized Alpha 3.6% 4.5% 1.2%
Standard errors in parentheses. ***, **, * indicate statistical significance at 1%, 5% and 10% respectively. Source: Lyxor AM
Table 3 (with global equities and global bond prices)
HFRI Composite excessreturns over Libor 3m
(1)
Feb 1990- Feb 2015
(2)
Feb 1990- Jan 2009
(3)
Feb 2009-Feb 2015
Intercept 0.0044*** 0.0055*** 0.0016**
(0.0008) (0.0009) (0.0009)
MSCI World TR 0.3473*** 0.3559*** 0.3244***
(0.0174) (0.0219) (0.0212)
JPM Global Aggregate Bond Index total return
-0.1362** -0.1665*** -0.0275
(0.0455) (0.0547) (0.0648)
Observations 301 228 73
Adjusted R2 57% 54% 81%
Annualized Alpha 5.3% 6.6% 1.9%
Standard errors in parentheses. ***, **, * indicate statistical significance at 1%, 5% and 10% respectively. Source: Lyxor AM.
715812_228195 White Paper.indd 20715812_228195 White Paper.indd 20 02/07/15 15:0802/07/15 15:08

A N E W E R A F O R H E D G E F U N D S ?
J U LY 2 0 1 5L Y X O R R E S E A R C H
21 >>
Disclaimer
Each of this material and its content is confidential and may not be reproduced or provided to others without
the express written permission of Lyxor Asset Management S.A.S. (“Lyxor AM”). This material has been
prepared solely for informational purposes only and it is not intended to be and should not be considered as
an offer, or a solicitation of an offer, or an invitation or a personal recommendation to buy or sell participating
shares in any Lyxor Fund, or any security or financial instrument, or to participate in any investment strategy,
directly or indirectly.
It is intended for use only by those recipients to whom it is made directly available by Lyxor AM. Lyxor AM will
not treat recipients of this material as its clients by virtue of their receiving this material.
This material reflects the views and opinions of the individual authors at this date and in no way the official
position or advices of any kind of these authors or of Lyxor AM and thus does not engage the responsibility
of Lyxor AM nor of any of its officers or employees. All performance information set forth herein is based on
historical data and, in some cases, hypothetical data, and may reflect certain assumptions with respect to fees,
expenses, taxes, capital charges, allocations and other factors that affect the computation of the returns. Past
performance is not necessarily a guide to future performance. While the information (including any historical
or hypothetical returns) in this material has been obtained from external sources deemed reliable, neither
Societe Generale (“SG”), Lyxor AM, nor their affiliates, officers employees guarantee its accuracy, timeliness or
completeness. Any opinions expressed herein are statements of our judgement on this date and are subject
to change without notice. SG, Lyxor AM and their affiliates assume no fiduciary responsibility or liability for
any consequences, financial or otherwise, arising from, an investment in any security or financial instrument
described herein or in any other security, or from the implementation of any investment strategy.
Lyxor AM and its affiliates may from time to time deal in, profit from the trading of, hold, have positions in,
or act as market makers, advisers, brokers or otherwise in relation to the securities and financial instruments
described herein.
Service marks appearing herein are the exclusive property of SG and its affiliates, as the case may be.
This material is communicated by Lyxor Asset Management S.A.S., which is authorized and regulated in
France by the “Autorité des Marchés Financiers” (French Financial Markets Authority) and is a Commodity Pool
Operator and Commodity Trading Advisor registered with the U.S. Commodity Futures Trading Commission.
© 2015 LYXOR ASSET MANAGEMENT ALL RIGHTS RESERVED
715812_228195 White Paper.indd 21715812_228195 White Paper.indd 21 02/07/15 15:0802/07/15 15:08

A N E W E R A F O R H E D G E F U N D S ?
J U LY 2 0 1 5L Y X O R R E S E A R C H
<< 22
715812_228195 White Paper.indd 22715812_228195 White Paper.indd 22 02/07/15 15:0802/07/15 15:08

A N E W E R A F O R H E D G E F U N D S ?
J U LY 2 0 1 5L Y X O R R E S E A R C H
23 >>
715812_228195 White Paper.indd 23715812_228195 White Paper.indd 23 02/07/15 15:0802/07/15 15:08

Lyxor Asset Management
Tours Société Générale - 17 Cours Valmy
92987 Paris La Défense Cedex - France
www.lyxor.com
Lyxor Asset Management
Tours Société Générale - 17 Cours Valmy
92987 Paris La Défense Cedex - France
www.lyxor.com
RÉF
. 715
812
- ©
MA
RTI
N B
AR
RA
UD
/OJO
IMA
GES
/GR
AP
HIC
OB
SES
SIO
N -
07/
2015
715812_228195 White Paper.indd 24715812_228195 White Paper.indd 24 02/07/15 15:0802/07/15 15:08