a new technology for the combined production of … new technology for...a new technology for the...
TRANSCRIPT

ww.sciencedirect.com
b i om a s s a n d b i o e n e r g y 6 9 ( 2 0 1 4 ) 2 2 2e2 4 0
Available online at w
ScienceDirect
ht tp: / /www.elsevier .com/locate/biombioe
A new technology for the combined production ofcharcoal and electricity through cogeneration
Adriana de Oliveira Vilela a,*,1, Electo Silva Lora b,Quelbis Roman Quintero b, Ricardo Antonio Vicintin a,1,Thalis Pacceli da Silva e Souza a,1
a Rima Industrial S/A, Departamento de Pesquisa e Desenvolvimento, Anel Rodovi�ario, km 4,5,
Belo Horizonte 30622-910, MG, Brazilb NEST e Nucleo de Excelencia em Gerac~ao Termel�etrica e Distribuıda, Instituto de Engenharia Mecanica,
Universidade Federal de Itajub�a, Av. BPS 1303, CP 50, Itajub�a 37500-083, MG, Brazil
a r t i c l e i n f o
Article history:
Received 17 February 2014
Received in revised form
16 June 2014
Accepted 27 June 2014
Available online
Keywords:
Charcoal
Pyrolysis gas
Cogeneration
Electricity
Biomass energy
* Corresponding author. Tel.: þ55 31 3329 44E-mail addresses: [email protected] (A. d
1 Tel.: þ55 31 3329 4000.http://dx.doi.org/10.1016/j.biombioe.2014.06.00961-9534/© 2014 Elsevier Ltd. All rights rese
a b s t r a c t
This paper presents an historical approach on the development of the existing biomass
carbonization technologies in industrial operation in Brazil, the biggest charcoal producing
country in the world. The gravimetric yield of charcoal from wood does not usually surpass
25%; the time of each operation cycle is more than seven days; and less than 50% of the
energy contained in the feedstock is transformed into charcoal e the rest is discharged into
the environment. The electricity generation associated with charcoal production is
nowadays inexistent in Brazil. This paper presents the development of an industrial
technology of semi-continuous pyrolysis process, characterized by using metallic kilns
with forced exhaust system: the Rima Container Kiln (RCK). The results of the test runs are
related to 5 m3 and 40 m3 kilns, with a thermal power of 200 kW (pilot scale: 5 m3) and
3000 kW (industrial scale: 40 m3). The low heating value of the pyrolysis gases is 670 and
1470 kJ/m3, respectively.
The main results are: a 3 h carbonization time; an average productivity per kiln of 1 ton
of charcoal per hour; and a gravimetric yield of 35%. In this paper, four scenarios for the
conversion of exhaust gases and tar into electricity were evaluated: the Conventional
Rankine Cycle (CRC) and the Organic Rankine Cycle (ORC), each one with and without
forest residues utilization. It is shown that the best economic indicators correspond to the
scenario where ORC technology is used. The electricity generation cost is around U$30/
MWhe for ORC and US$40/MWhe for CRC.
© 2014 Elsevier Ltd. All rights reserved.
83.e Oliveira Vilela), [email protected] (E.S. Lora).
19rved.

Table 1 e Products of carbonization.
Products of carbonization % Dry base
Charcoal (80% fixed carbon) 33.0
Pyroligneous acid 35.5
(Acetic acid) (0.5)
(Methanol) (0.2)
(Soluble tar) (5.0)
(Water and others) (23.5)
Insoluble tar 6.5
Non condensable gases (NCG) 25.0
(Hydrogen e 0.63%) (0.16)
(CO e 34%) (8.5)
(CO2 e 62%) (15.5)
(Methane e 2.43%) (0.61)
(Ethane e 0.13%) (0.03)
(Others e 0.81%) (0.20)
Total 100
b i om a s s a n d b i o e n e r g y 6 9 ( 2 0 1 4 ) 2 2 2e2 4 0 223
1. Introduction
1.1. The relevance of charcoal production in brazil
Some reports indicate that around the year 500 A.C. the
Macedonians used wood to produce charcoal and tar. Even
before that, the carbonization ofwoodwas already known and
utilized by the Egyptians, the Persians and the Chinese. The
process used by these ancient civilizations remains almost
unchanged today, especially from the energy loss point of
view, which can reach more than 50% of the biomass energy
content.
Fig. 1 shows the share of the total energy produced from
charcoal and the respective energy loss in the State of Minas
Gerais, Brazil from 1978 to 2010 [1]. Energy losses reduction, as
observed in recent years, was only possible through process
improvement, leading to increase in charcoal yield and more
efficient forest handling.
According to the National Energy Balance [2], Brazil has
44% of its energy matrix supplied by renewable sources. From
this total, around 10% correspond to wood and charcoal, 15%
to hydraulic electric generation, 16% to sugarcane, and 3%
corresponds to wind and solar energy based generation.
Around 4% of the total installed capacity for electricity gen-
eration in Brazil corresponds to thermal power stations,
which burn coal, gas, oil and biomass (such as bagasse and
wood dust). Nevertheless, there is not a single thermal power
installation that uses exhaust energy from carbonization
processes.
1.2. Wood carbonization
Wood carbonization involves a complex phenomenon that
allows the generation of awide range of chemical compounds,
which can be grouped as: charcoal, tar, pyroligneous acid and
gases [3].
Table 1, adapted from Refs. [4] and [5], shows the mass
fraction content, dry basis, of the main products derived from
wood pyrolysis. These results were obtained at laboratory
scale without oxygen supply and by using external heating.
Fig. 1 e Share of the total energy produced from charcoal in
the Minas Gerais State, Brazil from 1978 to 2010, as
granulated charcoal, other products (dust, tar and losses
(smoke).
The phenomena that occur during carbonization are
grouped differently depending on the author. For example,
Refs. [3] and [6], divide them in four stages as follows:
� A: Up to 200 �C, there is production of gases, such as water
vapor, CO2, formic and acetic acid.
� B: from 200 to 280 �C, the same gases from zone A are
released; but the emission of CO begins and there is a
substantial decrease in water vapor emission. The re-
actions in this zone are endothermic.
� C: from 280 to 500 �C. Carbonization occurs through
exothermic reactions. The products obtained in this stage
are influenced by secondary reactions, including formation
of fuel gases, tar, CO and CH4.
� D: over 500 �C. All wood has been converted into charcoal.
Various secondary reactions take place, catalyzed by the
carbonization layer.
According to Ref. [7], sugarcane bagasse and wood pyroly-
sis can be divided by stages in a similar way based on thermal
analysis results. Stage B corresponds to hemicelluloses
destruction and stage C to cellulose and lignin conversion into
charcoal.
Table 2, shows the main products generated in each stage
of carbonization, according to the temperature evolution of
the process. The values found in Table 2 correspond to tests
performed at laboratory scale as show in Ref. [8].
Fig. 2 presents the photos of wood pieces at different
carbonizationstagesaspreviouslydescribed. Fromleft to right:
in the first stage, the wood is dried and the released gases
contain only water vapor. In the second stage, the product is a
partially carbonizedwood, or toastedwood. This toastedwood
has the highest energy content per weight and also a great
content of volatile matters. In the third stage, hydrocarbons
start to be released and carbonization pushes forward to the
center of the wood piece, reducing its volume in the radial di-
rection. Finally, in the last stage, when the temperature rea-
ches 500 �C in the center of thewood piece, carbonizationmay
be interrupted. The charcoal at this final temperature has a
fixed carbon content of around 75%. Above 500 �C, the charcoalstructure and composition continues changing and the fixed
carbon content can reach more than 90%.

Table
2e
Evolutionofca
rbonizationasafu
nctionoftem
pera
ture.
Carb
onizationstage
Waterrem
oval
Oxyge
natedgase
spro
duction
Beginningofhydro
carb
ons
release
Hydro
carb
ons
release
CnH
m
Disso
ciation
ofch
arcoal
Hydro
genphase
Temperatu
re[�C]
150e200
200e280
280e380
380e500
500e700
700e900
Carb
onco
ntent(%
ofth
ech
arcoal)
60
68
78
84
89
91
Non
conden
sable
gases(%
)
CO
268.0
66.5
35.5
31.5
12.2
0.5
CO
30.0
30.0
20.5
12.3
24.6
9.7
H2
0.0
0.2
6.5
7.5
42.7
80.9
Hydro
carb
ons
2.0
3.3
37.5
48.7
20.5
8.9
Heatingvalue[kJ/m
3]
4.61
5.07
16.41
20.01
15.20
13.23
Condensa
ble
constituents
inth
egas
Watervapor
Watervaporand
ace
ticacid
Ace
ticacidmeth
ylalcohol
Lots
ofheavytar
Tar
Low
condensa
tion
Amountofgas
Very
small
Small
Important
Important
Small
Very
small
b i om a s s a n d b i o e n e r g y 6 9 ( 2 0 1 4 ) 2 2 2e2 4 0224
1.3. Traditional wood carbonization technologies
The “Hot Tail” kilns are the most widespread kilns within
Brazil, due to its simplicity and low cost, especially for small
producers. They are recommended for flat sites and, in gen-
eral, are built with baked bricks, clay and sand mortar. Nor-
mally, more than one kiln is used and they are disposed as
batteries or tandems.
The operation of the kiln starts with the firewood loading,
followed by carbonization and unloading of charcoal. The use
of dry firewood is essential for good carbonization, because
the firewood moisture directly influences the yield of the kiln
as show in Ref. [9].
There is an ideal temperature, around 60 �C, for unloadingthe kiln because the contact of air and charcoal at superior
temperatures can lead to fires. A standard kiln operation
consists of three to six days for carbonization, five days for
cooling and one day to unload/load the kiln [9].
In addition to the “Hot Tail” kiln there are other carbon-
ization technologies in Brazil, with similar productivity,
gravimetric yield and energy efficiency, such as: slope kiln,
surface kiln, rectangular kiln, beehive kiln, JG kiln, all made of
hewn stone and without forced exhaust system. The names
presented on this paragraph are a free translation from Por-
tuguese to English.
Table 3 and Table 4 present the results of studies [10] about
charcoal production from the main types of kilns in Brazil.
To ensure the economic and operational viability of the
mechanized charcoaling process, it was necessary to build
rectangular kilns, which can reach a production capacity
equivalent to five (5) surface kilns [11]. Today it is possible to
find rectangular kilns in operation with and without external
combustion. Their firewood capacity is higher than 700 m3
and they possess equipment for tar recovering, which is
usually released into the atmosphere in conventional hewing
stone kilns [12].
Table 5 presents the main charcoal production technolo-
gies, now in operation in the world, visited in 2007, with the
indication of capacity.
Vital et al. [13], made a comparative analysis of the pres-
ently used carbonization technologies. The results are pre-
sented in Table 6.
There is a technology, under development at laboratory
scale, based on the conversion of wood into charcoal by mi-
crowaves. According to Ref. [14], it is possible to attain a high
productivity conversion, with a specific energy consumption
of around 1000 kWh/(ton of wood).
The constraints of the traditional technologies for charcoal
production include:
� Difficulty in the mechanization of firewood loading and
charcoal unloading.
� Fragmentation of charcoal during unloading.
� Difficulty in automation due to the lack of instrumentation,
in particular: weight, flow rates and temperature
monitoring.
� Impossibility to use wood chips, which favors the gravi-
metric yield and productivity e an exception is the
continuous retort.

Fig. 2 e Wood pieces at different stages of the carbonization process. Source: Author.
Table 3 e Performance of the carbonization kilns in Brazil.
Type of construction Operation cycle (hours) Capacity Volumetric yield (st/CMC)
Firewood (st) Charcoal (CMC)
Hewing stone with internal heat source
Slope 240 20 8.7 2.3
Hot tail 144e168 20 8.0 2.5
JG surface 144 10e11 4e5 2.2
Rectangular V&M 264e312 180e240 95e130 1.8
Rectangular ACESITA 264 110 65 1.8
Metallic with internal heat source
Semi-continuous JG NA NA NA NA
Metallic with external heat source
DPC semi-continuous 72 80 53.3 1.5
NA ¼ Not available.
st ¼ cubic meter of stacked wood.
CMC ¼ cubic meters of charcoal.
b i om a s s a n d b i o e n e r g y 6 9 ( 2 0 1 4 ) 2 2 2e2 4 0 225
� High heterogeneity in the drying, pre-pyrolysis and the
pyrolysis profiles inside the kiln.
� High rate of partially carbonized wood formation due to
heterogeneous thermal distribution in the kiln.
� Large operation time, with low productivity.
� Difficulty in gas collection and in sealing the kiln.
1.4. Constraints of by-products utilization forcogeneration in conventional carbonization kilns
According to Ref. [15], companies that produce charcoal have
been developing alternatives to use the energy from gases
generated during the carbonization process. Some trials, at
the beginning of the 80's decade of the 20th century, allowed
obtaining tar, which was successfully used as fuel in
Table 4 e Constructive and operational characteristics ofthe hewing stone kilns.
Kilns Slope(3 m)
Hot tail(3 m)
Beehive(5 m)
JG(3 m)
Diameter [m] 3.0e4.0 2.9e3.8 3.0e8.0 3.0
Maximum
height [m]
2.5e2.8 2.3 max. 3.2e5.0 2.3 max.
Loaded firewood 20.0 st 8 st 5.0e200.0 t 14 st
Charcoal
[m3/months]
24.0 16.0e20.0 50.0e60.0 22
Cycle [days] 7e8 5e7 8e9 5e6
Useful life [years] 3 2e3 3e5 2e3
substitution of oil. Recently, there has been an evident in-
crease of interest in the use of gases from charcoal produc-
tion in burners and kilns, thus reducing gas emissions and
possibly obtaining thermal energy in a first stage (gases
burners) and electricity in a more advanced phase of
development.
According to Ref. [15], it is also important to mention the
technological barriers linked to the quality of the gases, whose
composition and heating values are not homogeneous
throughout the phases of the carbonization process. Such
barriers are present in the highly variable heating values of
the gases; especially in the initial phase of wood drying, when
the produced gases are difficult to combust, due to their high
water vapor content.
Among themain barriers that limit the use of gases and tar
from charcoal production for thermal power generation are:
a) Low heating value of the gases.
b) Variable composition and temperature of the gases in
different carbonization stages.
c) Variable moisture content of the tar generated during the
carbonization process.
d) Difficulties in developing a project of an adequate burner
for the combustion of the pyrolysis gases with high and
variable content of particulates, moisture and condens-
ables, which would require the installation of pre-filters.
e) The dilution and partial burning of the gases due to
admission of undesired air.
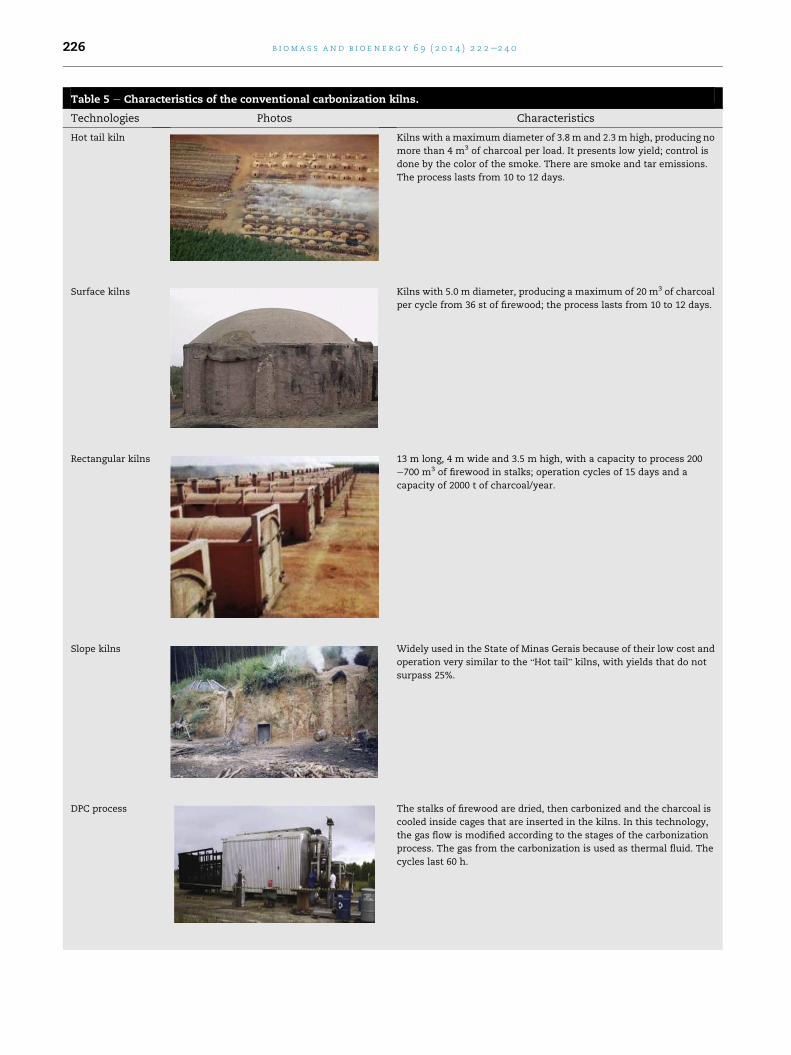
Table 5 e Characteristics of the conventional carbonization kilns.
Technologies Photos Characteristics
Hot tail kiln Kilns with amaximum diameter of 3.8 m and 2.3 m high, producing no
more than 4 m3 of charcoal per load. It presents low yield; control is
done by the color of the smoke. There are smoke and tar emissions.
The process lasts from 10 to 12 days.
Surface kilns Kilns with 5.0 m diameter, producing a maximum of 20 m3 of charcoal
per cycle from 36 st of firewood; the process lasts from 10 to 12 days.
Rectangular kilns 13 m long, 4 m wide and 3.5 m high, with a capacity to process 200
e700 m3 of firewood in stalks; operation cycles of 15 days and a
capacity of 2000 t of charcoal/year.
Slope kilns Widely used in the State of Minas Gerais because of their low cost and
operation very similar to the “Hot tail” kilns, with yields that do not
surpass 25%.
DPC process The stalks of firewood are dried, then carbonized and the charcoal is
cooled inside cages that are inserted in the kilns. In this technology,
the gas flow is modified according to the stages of the carbonization
process. The gas from the carbonization is used as thermal fluid. The
cycles last 60 h.
b i om a s s a n d b i o e n e r g y 6 9 ( 2 0 1 4 ) 2 2 2e2 4 0226

Table 5 e (continued )
Technologies Photos Characteristics
CML France Batteries of 12 fixed kilns; a charcoal production of 2500 t/year, with a
yield of 20e25%. Each load of 5th residual firewood produces 2 m3 of
charcoal per cycle. The cycle lasts 24 h.
Continuous retort The carbonization is carried out by the hot gases from the combustion,
and part of the gases from the pyrolysis. The firewood is fed, in pieces,
with 20% humidity, at the top of the retort, the cold charcoal is
discharged at the bottom, with tar recovering. The capacity of the
equipment is from 2000 to 10,000 t/year.
b i om a s s a n d b i o e n e r g y 6 9 ( 2 0 1 4 ) 2 2 2e2 4 0 227
It should be emphasized that there is an emission of 50 kg
of methane for each ton of produced charcoal. This is the
main environmental impact of the charcoal industry: it is well
known that methane has 25 times more global warming po-
tential than CO2 in a 100 years timeframe [16]. As methane is
not captured during photosynthesis, it is necessary to find a
way to mitigate its emissions. A possible alternative is the
combustion of the gases generated during the carbonization
process for heat recovery and electricity production. Other
possibility is to increase the gravimetric yield of charcoal,
because it would imply in less gas emissions.
This article intends to present a technology that can solve
the above listed challenges, providing a possible true fruitful
association between the charcoal production and the elec-
tricity cogeneration through by-products utilization,
reducing altogether the environmental impact of wood
carbonization.
Table 6 e Comparison of the performance of the kilns at use to
Kiln Capacity per kiln Investment Grav
Hot Tail 5 ton per month R$14/ton.year
Circular 8 ton per month R$27/ton.year
Rectangular 42 ton per month R$237/ton.year
Continuous Retort 450 ton per month R$648/ton.year
DPC 57 ton per month R$250/ton.year
2. Material and methods
2.1. Materials
In this work, three reactors with different design, sizes and
operation, were tested and used to improve the industrial
container reactor project, or Rima Container Kiln (RCK). In
order to combine the slow pyrolysis furnace with electric
power generation, the following reactors or kilns were used:
� laboratory scale reactor (5 L)
� pilot scale reactor (5 m3)
� industrial scale reactor (40 m3)
All of those reactors were designed, manufactured, tested
and evaluated during this study. The lab scale reactor, with
day in Brazil.
imetric yield Bio-mass based carbochemicals production
25% Very low
25% Low
30% 70e120 kg/t of charcoal
33% 250 kg/t of charcoal
35% 250 kg/t of charcoal

Fig. 3 e Scheme of gases analyzer and thermocouples in RCK.
b i om a s s a n d b i o e n e r g y 6 9 ( 2 0 1 4 ) 2 2 2e2 4 0228
electrical heating, was used to obtain the reference results.
Next, the project, construction and operation of the pilot
container were the basis for the definition of drying, carbon-
ization and cooling behaviors. Finally, the industrial reactor
was projected maintaining the same structural proportions
from the pilot kiln, but with structural, mechanical and
operational improvements.
For modeling and geometric definition of the pyrolysis re-
actors (pilot and industrial ones), a finite volume softwarewas
used (Ansys CFX, R.13). Pressure gauge, flow meter, thermo-
couples, infra-red temperature sensor, gas analyzer, wind
speed meter, precise weighbridge scales, weighing load cell
system and anemometer were used as instrumentation. Fig. 3
is a scheme of the rig and its instrumentation.
The wood used in the experiment was urograndis, a hybrid
between eucalyptus grandis and eucalyptus urophylla. The wood
pieces tested in the experiments had the following di-
mensions: (100 ± 20) cm in length; (60 ± 20) cm in width and
(40 ± 10) cm in thickness.
2.2. Local and procedures
All experimental data were taken from the pilot plant in
operation in the RimaGroup Forest Unit, located in Buritizeiro,
Minas Gerais.
Rima Industrial S/A is a metallurgy enterprise founded in
1975, located in Belo Horizonte, with factories in the northern
part of the State of Minas Gerais, Brazil. The ferro-alloys,
silicon and magnesium production from Rima Industrial S/A
requires an average consumption of 50,000 m3 of charcoal per
month.
The initial input values for energetic, economic, environ-
mental and thermodynamic calculations were taken from
theoretical and real data, measured on a pilot plant.
The designed system is able to provide real-time, accurate
measurement of mass flow rate of themain gas stream on the
furnace exhaust. This value is obtained indirectly by
measuring temperature, pressure and gas content. The mea-
surement and calculation are based on the stoichiometric
definitions, given by Fig. 4.
A program was specifically developed in MS Excel Solver
for the calculation of physical and chemical properties. Fig. 5
provides a block diagram of this program with the specific
inputs and outputs:
The entries in the program are:
� Weight loss of loaded firewood, internal temperature of the
kiln, flow rate and composition of the gases generated in
carbonization.
And the outputs are:
� Composition, temperature, volumetric and mass flow of
the outlet gas
� Heating value of the outlet gas
� Thermal power of the process

b i om a s s a n d b i o e n e r g y 6 9 ( 2 0 1 4 ) 2 2 2e2 4 0 229
� Percentage of tar, pyroligneous acid, carbonization gas and
charcoal which must be burned to sustain the carboniza-
tion process.
� Oxygen excess content
� Air flow inlet
� Percentage or rate of complete combustion
� Heat losses by gases
� Heat loss from the kiln
The MS Excel Solver provides these responses when the
difference between the mass content of non-condensable gas
components measured and the theoretical values derived
from the reaction is less than 2%. The final results presented
in the next sections are derived from the conduction of 10
tests in industrial model Rima Container Kiln (RCK).
For the evaluation of the electricity generation potential,
the following scenarios were considered:
� 1A: a CRC (conventional Rankine Cycle) using only the
pyrolysis gas as fuel.
� 1B: an ORC (Organic Rankine Cycle) using only the pyrolysis
gas as fuel.
� 2A: a CRC using the pyrolysis gas and fines (forest residues)
as fuel.
� 2B: an ORC using the pyrolysis gas and (fine forest residues)
as fuel.
General data for all the considered scenarios are as follows:
� Gas flow from each kiln: 6500 m3/h
� Number of kilns: 6
� Gas heating value: 1470 kJ/m3
� Gas thermal power: 15.8 MW
� Boiler efficiency in CRC: 80%
� Steam turbine efficiency in CRC: 75%
� Boiler efficiency in ORC: 90%
� Turbine efficiency in ORC: 80%
� Pump efficiency: 75%
3. RCK tests results
3.1. Development of a semi-continuous kiln: theindustrial Rima container kiln (RCK)
Ferreira [5] developed a container kiln and evaluated its
performance. The results indicated that the container kilns
have some advantages such as a higher productivity, gravi-
metric yield and durability; faster cooling, loading and
unloading operations, which can also be mechanized [12].
The first patent referred to this technology was granted by
INPI, the agency for industrial property in Brazil, to Rima
Industrial S/A in 2011. The technology developed by Rima
consists in the use of firewood pieces in metallic cylindrical
kilns, with lateral fissures, connected to an exhaust system,
as shown in Fig. 6.
The carbonization process in the Pilot RCK has the
following parameters:
� Yield: 33% of charcoal, with 81% of fixed carbon.
� 25% of non condensable gases, with a mean composition
of: 8% CO2, 12% CO, 2% of CH4, 1.5% H2, 2.5% O2 e 74% N2.
� 35% of pyroligneous acid solution, with 88% water, 5% of
acetic acid, 5% of tar and 2% of methanol.
� 6% of tar.
The gases composition was determined by chemical anal-
ysis carried out during the monitoring of the carbonization
process in the Pilot RCK.
Based on the results from the pilot reactor and with the
expectation of achieving better results in an industrial scale
reactor, the company decided to project, install and operate
an industrial unit (Industrial RCK) for the production of
charcoal. A schematic picture of this technology can be seen
in Fig. 7, that also shows the firewood loading, the carbon-
ization process and the unloading of charcoal.
This project startedwith the operation of a single kiln, with
sequential test runs. The tests in this kiln (Fig. 8) supplied
necessary information to evaluate the viability of energy
cogeneration, based on the pyrolysis gases. The information
included:
� Thermal and fluid dynamic simulations using a finite vol-
ume software to optimize the geometry of the industrial
kiln, as well as the exhaust system and the flow of the
gases during carbonization.
� Evaluation of the carbonization gases' circulation pattern
inside the kiln, from the hottest to the coldest section, in
order to homogenize temperature distribution. This would
avoid firewood burning in the hot section and the forma-
tion of partially carbonizedwood in the cold section, which
result in a low gravimetric yield.
� The implementation of a continuous and on-line data
attainment system.
� Instrumentation and automation of the process.
� Improvement in the utilization factor of the kilns and the
increase of their productive capacity.
� Development of a project for energy recovery from
exhausted carbonization gases for wood drying and elec-
tricity generation.
3.2. RCK development through modeling
From the studies of existing technologies, it was possible to
elaborate flow profiles, which identify the pathways of
generated gases according to the process conditions. Table 7
shows the possible configurations of the gases pathways.
The ignition procedure consists in the introduction/injec-
tion of energy into the kiln through the addition of burning
pieces of charcoal in the ignition valves. Next, the carbon-
ization takes place by gradually opening and closing other
valves according to local thermal needs.
When the 40 m3 RCK was built and the tests were run with
type A ignition, as it can be seen in Table 7, different problems
aroused. Explosions were frequent due to accumulation of
gases inside the kiln, and also due to formation of reflux zones
and gas pockets. Different pathway effects were analyzed
with the help of finite elements software, as it can be seen in
Fig. 9. This studywas based in the following premises: the kiln
is unloaded, the valves are open, the pressure inside the kiln is

Fig. 4 e Block diagram for the gas LHV calculation.
b i om a s s a n d b i o e n e r g y 6 9 ( 2 0 1 4 ) 2 2 2e2 4 0230

Fig. 5 e Block diagram for calculation of physical and chemical properties.
Fig. 6 e Top and lateral view of the Pilot RCK.
Fig. 7 e Industrial RCK loading, c
b i om a s s a n d b i o e n e r g y 6 9 ( 2 0 1 4 ) 2 2 2e2 4 0 231
equal to the atmospheric pressure and the gas flow is
6.500 m3/hr.
The problems were eliminated by varying the ignition
procedure and the pathway of gases. A continuous carbon-
ization cycle was ensured, with a mean duration of 3 h,
without throttling and/or internal blows or explosions. The
developed RCK technology took in consideration that the best
configuration for the gases flow pattern was the one with
ignition at the bottom and with central and bottom forced
exhaustion (type E in Table 7), keeping a continuous gas flow
along the whole height of the kiln, vertically and radially, as
shown in Fig. 10 and Fig. 11.
Based on the flow pathway analysis, the ignition was
changed to type E, meaning amodification from top to bottom
ignition. This change leads to:
� Homogenization of the internal temperature inside the
kiln.
� Substitution of a linear carbonization front for a volumetric
one.
arbonization and unloading.

Fig. 8 e Industrial RCK kiln with a capacity of 40 m3 of
firewood.
Topignition,ce
ntralexhaustion
byth
etop
Topignition,lateralexhaustion
byth
etop
austion
Ignitionatth
ebottom,ce
ntralexhaustion
byth
etop
Ignitionatth
ebottom,lateralexhaustion
byth
etop
b i om a s s a n d b i o e n e r g y 6 9 ( 2 0 1 4 ) 2 2 2e2 4 0232
� Reduction in the theoretical carbonization time in an in-
dustrial kiln.
� Increase of pyroligneous vapor fraction.
� A partial process of gasification, with the formation of
synthesis gas (Syngas) composed by CO and H2.
� The elimination of dead zones (gas stagnation), specially in
the case of hydrogen.
� Safe runs, without the formation of static pockets, mini-
mizing the possibility of combustion that induces blows
and explosions.
� Optimization of the RCK productivity with individual ca-
pacities similar to the Continuous Retort.
� A charcoal gravimetric yield equals to (34 ± 1) %. This value
is similar to the theoretical gravimetric yield, which was
determined to be 35%.
Table 8 shows the calculation of the theoretical gravimetric
yield. The calculation was based on the average content of
wood [17] and the conversion of each component into char-
coal [18]. The sum of the individual yields leads to the esti-
mated total gravimetric yield of carbonization.
Table
7e
Poss
ible
path
waysofth
egase
sfrom
theca
rbonization.
Topignition,ce
ntralexhaustion
byth
ebottom
Topignition,lateralexhaustion
byth
ebottom
Ignitionatth
ebottom,ce
ntralexhaustion
byth
ebottom
Ignitionatth
ebottom,lateralexh
byth
ebottom
3.3. Temperature vs. time relationship for ignition at thetop of the kiln
By monitoring internal temperatures in the industrial 40 m3
RCK, it was possible to obtain a thermal profile of the kiln. The
temperature monitoring system includes 28 points of tem-
perature measurement near the wall of the kiln and 42 points
in its internal part, as it is shown in Fig. 3. Moreover, there are
4 thermocouples located on the conical section of the kiln (at
the very bottom of the kiln).
As results of a series of tests with top ignition, the behavior
of the mean temperatures along the height of the kiln was
obtained. Fig. 12 shows the mean temperature for each height
level, calculated from the values of 10 thermocouples in each
level: 6 of them located in the middle of the reactor and 4 near
the wall (Fig. 3). The mean temperature for the conical part of
the kiln was calculated from the values obtainedwith the four
thermocouples located in this section. The level sequence is
descendent, with Level A being the top of the kiln and Level H
being the bottom (conical section). Fig. 13 shows the three
dimensional temperature profile of the kiln in the beginning,
middle and end of carbonization.
It is possible to infer that when ignition is done at the top of
the kiln, there is a highly heterogeneous temperature profile
during the carbonization process. At certain time intervals, if

Fig. 9 e Gas flow simulation in the empty RCK using
computational fluid dynamics program.
Fig. 11 e Flow of gases in a set of RCK.
Table 8 e Calculation of theoretical gravimetric yield ofcarbonization.
b i om a s s a n d b i o e n e r g y 6 9 ( 2 0 1 4 ) 2 2 2e2 4 0 233
comparing the top and the bottom of the kiln on Fig. 12, the
temperature difference is as high as 500 �C. A carbonization
kiln with this temperature profile has a carbonization time
superior to 8 h. In addition, the very humid gases generated
during carbonization show a descending pattern, going from
the hot region to the cold region; leading the vapors, which
also contain tar and pyroligneous acid, to condensate over the
non carbonized wood, significantly limiting heat transfer.
Another problem with the ignition at the top is the low tem-
perature in the bottom part of the kiln, which prevents the
complete carbonization of the wood. This is also observed in
Fig. 13, which shows the regions of the kiln with temperatures
Fig. 10 e Gas flow pattern in the RCK.
above 200 �C. It is possible to see that the hot regions are
restricted to the superior part of the kiln, moving next to the
center and then returning to the top (passing briefly through
the bottom).
These problems are aggravated due to the low thermal
conductivities of wood, partially carbonized wood and char-
coal. In the individual wood pieces, as carbonization proceeds
from the outside to the center (Fig. 14), the very low thermal
conductivities are themselves responsible for blocking the
carbonization front in the core of the piece [19], especially if
this piece is impregnated with tar.
By using the top ignition, there is also formation of gas
pockets, corresponding to dead zones of stagnant gases and/
or reflux. Hydrogen, being lighter, concentrates in the angles
and edges of the kiln, where it remains, not able to follow the
turbulent flow of the gases. These regions are potentially
explosive and, with favorable conditions, may cause explo-
sions with pressure waves so powerful that could lift a 40 ton
kiln.
Component Average contentin wood
Conversion ofcomponentinto charcoal
Finalyield
Cellulose 50% 34% 17%
Hemicelluloses 20% 10% 2%
Lignin 30% 55% 16%
Total yield 35%
Fig. 12 e Distribution of the temperature along the RCK for
top ignition procedure.

Fig. 13 e Three dimensional temperature profile for ignition at the top of the kiln.
b i om a s s a n d b i o e n e r g y 6 9 ( 2 0 1 4 ) 2 2 2e2 4 0234
3.4. Temperature vs. time relationship for ignition at thebottom of the kiln
By using 74 thermocouples, it was possible to obtain a tem-
perature distribution along the height of the kiln for the
carbonization process with ignition at the bottom. The tem-
perature profile is shown in Fig. 15, in which the height level is
descendent, with Level A representing the top of the kiln and
Level H, the bottom (conical section) of the kiln. Fig. 16 shows
the Three Dimensional Temperature Profile for the kiln in
different moments of carbonization.
When ignition of the kiln is done at the bottom, it is
possible to obtain improvements in kiln's performance in
comparison to top ignition. The first improvement is the ho-
mogeneity of temperature distribution, verified on Fig. 15 by
temperature differences from top to bottom of the kiln not
superior to 250 �C. This guarantees that materials in different
levels of the kiln are undergoing the same carbonization step
Fig. 14 e Wood pyrolysis mechanism.
virtually at the same time. This thermal homogeneity of the
kiln also allowed reducing the carbonization time to 3 h in a
kiln with 40 m3 capacity. Another advantage of this system is
the temperature increase at the bottom of the kiln, which now
makes possible a complete carbonization of the entire load
inside the reactor. This is observable on Fig. 16, in which the
regions above 200 �C extend throughout the entire volume of
the kiln e a clear difference from Fig. 13.
3.5. Curves of weight loss for bottom and top kilnignition
The industrial 40 m3 RCK is equipped with a weighing system,
which continuously monitors the weight loss during the
carbonization process. This systemallowed the comparison of
effects from bottom ignition and top ignition in carbonization.
Fig. 17 shows the curves of average weight loss registered
for carbonization with bottom and top ignition. Each curve is
represented by the mean of 10 runs and the standard devia-
tion is represented by error bars.
It is possible to observe in Fig. 17 that, when carbonization
is conducted with bottom ignition, the weight loss proceeds
more rapidly and the end of carbonization happens 5 h earlier.
3.6. Mass and energy balance
The main results obtained with carbonization in the 40 m3
RCK can be summarized as follows:
Fig. 15 e Temperature distribution from top to bottom of
the container kiln with the ignition at the bottom.

Fig. 16 e Three dimensional temperature profile for ignition at the bottom of the kiln.
0
2000
4000
6000
8000
10000
12000
14000
0 100 200 300 400 500 600
Time [min]
Wei
ght [
kg]
Ignition done by the Top Ignition done by the Base
Fig. 17 e Comparison of the mean weight loss curves when
ignition for the cases of top and bottom ignition.
b i om a s s a n d b i o e n e r g y 6 9 ( 2 0 1 4 ) 2 2 2e2 4 0 235
� Average gravimetric yield of (34 ± 1)% (the gravimetric yield
is defined as the ratio between the weight of produced
charcoal and the weight of dry firewood fed to the kiln).
� Volumetric conversion index of around 1.5 (this index is
defined as the ratio between the volume of firewood loaded
into the kiln and the volume of charcoal, in m3).
� Carbonization time: fluctuating from 3 to 5 h, depending on
the moisture of the firewood and on the final properties of
the charcoal i.e., the fixed carbon content, the density and
the mechanical resistance.
Table 9 provides information on the charcoal quality from
the industrial kiln (40 m3 RCK) with ignition at the bottom.
Table 9 e Charcoal quality.
Spin testa Drop testb Chem
Mean Deviation Mean Deviation %H2O %
53% 9% 34% 10% 6% 1
a Done according to ABNT MB 1375-80.b Done according to ABNT 7416-84.c Done according to NBR 8112 ABNT-D176264.d Done according to ABNT NBR 9165.e Done according to ASTM D 167-73.
The evolution in time of heating value and total thermal
power of the released gases in the 40 m3 kiln with bottom
ignition are shown in Fig. 18 and Fig. 19. Each curve corre-
sponds to one of the 10 tests done with the industrial kiln.
When comparing the 10 runs, it is possible to infer that the
curves show a stable behavior and a relatively low standard
deviation, especially when it is considered that the tests pre-
sented variation in the initial properties. As already
mentioned, the size of the wood pieces was (100 ± 20) cm in
length; (60 ± 20) cm inwidth and (40 ± 10) cm in thickness. The
humidity of thesewood pieces varied in the range of (19 ± 5) %.
The oscillations in Figs. 18 and 19 are the result of the
process time scale. The measurement or analysis of the gas is
done at 5 Hz, recording a moving mean of 10 s, which makes
the sampling interval shorter than the plotting interval. The
oscillations are represented as plateaus in Fig. 19 because of
the reduced time scale (many points and small area).
The results obtained in the industrial kiln were different
from the results previously obtained in the pilot kiln, mainly
the composition of the produced gas, as shown in Table 10.
The mean values presented on Table 10 are the results from 3
replicates conducted with the pilot kiln and 10 replicates with
the industrial one.
The performance of the industrial kiln was better than the
5 m3 pilot one, considering that the released gas was less
diluted. Another significant difference is that tar and pyro-
ligneous acid remained in the gas flow of the industrial kiln,
without condensation, as occurred in the pilot kiln.
Table 11 shows average gas composition results of test
runs carried out with the pilot and industrial kilns. Fig. 20
shows the energy distribution in carbonization products
ical analysisc Density
VM %ash %FC Bulkd (kg/m3) Truee (kg/m3)
8% 2% 81% 280 1500
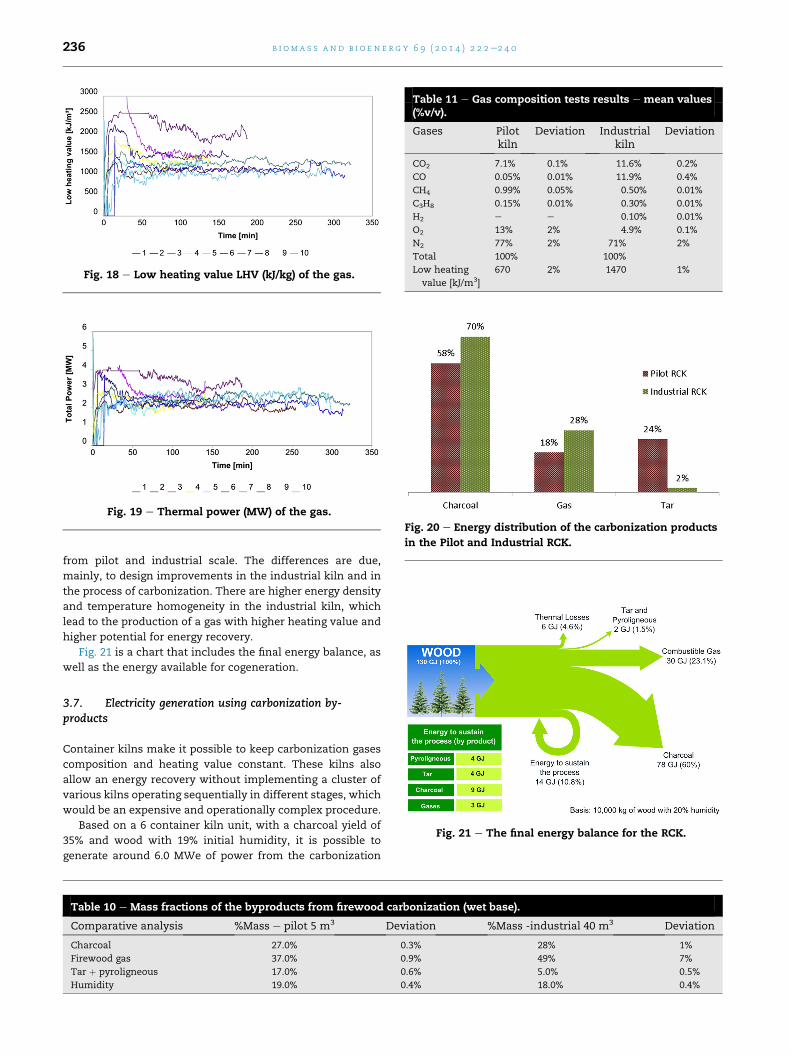
Fig. 18 e Low heating value LHV (kJ/kg) of the gas.
Fig. 19 e Thermal power (MW) of the gas.
Table 11 e Gas composition tests results e mean values(%v/v).
Gases Pilotkiln
Deviation Industrialkiln
Deviation
CO2 7.1% 0.1% 11.6% 0.2%
CO 0.05% 0.01% 11.9% 0.4%
CH4 0.99% 0.05% 0.50% 0.01%
C3H8 0.15% 0.01% 0.30% 0.01%
H2 e e 0.10% 0.01%
O2 13% 2% 4.9% 0.1%
N2 77% 2% 71% 2%
Total 100% 100%
Low heating
value [kJ/m3]
670 2% 1470 1%
Fig. 20 e Energy distribution of the carbonization products
in the Pilot and Industrial RCK.
b i om a s s a n d b i o e n e r g y 6 9 ( 2 0 1 4 ) 2 2 2e2 4 0236
from pilot and industrial scale. The differences are due,
mainly, to design improvements in the industrial kiln and in
the process of carbonization. There are higher energy density
and temperature homogeneity in the industrial kiln, which
lead to the production of a gas with higher heating value and
higher potential for energy recovery.
Fig. 21 is a chart that includes the final energy balance, as
well as the energy available for cogeneration.
Fig. 21 e The final energy balance for the RCK.
3.7. Electricity generation using carbonization by-products
Container kilns make it possible to keep carbonization gases
composition and heating value constant. These kilns also
allow an energy recovery without implementing a cluster of
various kilns operating sequentially in different stages, which
would be an expensive and operationally complex procedure.
Based on a 6 container kiln unit, with a charcoal yield of
35% and wood with 19% initial humidity, it is possible to
generate around 6.0 MWe of power from the carbonization
Table 10 e Mass fractions of the byproducts from firewood carbonization (wet base).
Comparative analysis %Mass e pilot 5 m3 Deviation %Mass -industrial 40 m3 Deviation
Charcoal 27.0% 0.3% 28% 1%
Firewood gas 37.0% 0.9% 49% 7%
Tar þ pyroligneous 17.0% 0.6% 5.0% 0.5%
Humidity 19.0% 0.4% 18.0% 0.4%

Fig. 22 e Flow of the productive process and energy
recovery of the Rima Container Kilns.
Fig. 23 e Scheme of a conventional Rankine cycle.
Fig. 24 e A CRC for pyrolysis gases mo
b i om a s s a n d b i o e n e r g y 6 9 ( 2 0 1 4 ) 2 2 2e2 4 0 237
gas. This calculation assumes that the carbonization gas has a
heating value of 1470 kJ/m3 and the efficiency of the electricity
generation unit is 20%. The use of tar and forest residues as
complementary fuel would make energy generation increase
notably. Fig. 22 shows the productive process and energy re-
covery of the RCK plant.
The calculation of the installed power, when using
commercially available generation technologies, must be
preceded by its selection. For the conversion of energy from
the carbonization gas into electricity, external combustion
technologies were selected, as the gas contains tar, particles
and other compounds that may affect the operation of inter-
nal combustion devices. External combustion technologies
also allow the use of forest residues as complementary fuel.
Among external combustion technologies, the only one at
commercial stage is the Conventional Rankine Cycle (CRC),
which uses water as working fluid. The Organic Rankine
Cycle, known as ORC, which uses an organic fluid instead of
water, is at the early stages of commercialization, with few
hundred units in operation, mainly in Europe. One option to
increase the efficiency of such systems is the use of prime
movers as alternative to axial turbines systems in Conven-
tional Rankine Cycles, such as screw expanders, steam en-
gines and radial turbines. However, all these technologies
are in developing stage and demand a high investment cost.
The available power in a charcoal unit is of a few MWs e in
this power range, Conventional Rankine Cycles are techni-
cally feasible, although their efficiency could be low and the
investment cost high due to the low efficiency of axial tur-
bines. ORC systems have a higher efficiency in this power
range.
For modeling studies, related to energy recovery in RCK,
both the Conventional Rankine and ORC technologies were
considered. It was also assumed that eucalyptus biomass is
deled using cycle Tempo software.

Pyrolysis gas
Pump
Electricgenerator
Turbine CoolingTower
BoilerCondenser
Thermal Oil
Pump
Condenser
Pump
Organic
Fig. 25 e Scheme of an ORC system using pyrolysis gases.
b i om a s s a n d b i o e n e r g y 6 9 ( 2 0 1 4 ) 2 2 2e2 4 0238
chopped in the field and fines, not feasible for charcoal pro-
duction, are separately transported to the charcoal unit. The
fraction of fines is considered to be 3e5% and the average
transport distance 5e10 km.
Schemes and results for the four (4) evaluated scenarios
are presented in Figs. 23e26 and Tables 12e15.
Scenario 1A: CRC using only pyrolysis gases:
Scenario 1B: an ORC cycle using only the pyrolysis gas as
fuel.
Scenario 2A: CRC using the pyrolysis gas and fines (forest
residues) as fuel.
For scenarios 2A and 2B, the available fuel's thermal power
must include both the pyrolysis gases from the 6 kilns and the
fine forest residues, achieving a final value of 21.42 MW.
Scenario 2B: Pyrolysis gases and fines utilization in an ORC
system.
3.8. Investment and electricity generation costscalculations
An economic evaluation of each scenario was carried out to
determine the generation cost and the minimum commer-
cialization cost. In this calculation, the life of the generation
Fig. 26 e A conventional Rankine cycle for scenario
unit was assumed to be 18 years and the operation and
maintenance costs assumed to be 5% of the total investment.
Table 16 shows the results of the economic evaluation. The
lowest generation cost corresponds to scenario 2B, which
reached a value of 29.71 USD/MWh. The greatest NPV (Net
Present Value) corresponds also to scenario 2A. Theminimum
commercialization price for attaining economic feasibility, for
a corresponding IRR (internal rate of return) of 14%, was also
calculated for each scenario.
In Brazil, renewable energy sources represent 44% of the
total energy source, while in the world this ratio is only 14%
and in developed economies it is 6%. From the renewable
energy sources in Brazil, 33% correspond to hydraulic energy
and 58% to biomass energy. Approximately 22% of renewable
energy are forest based (firewood and charcoal). When it
comes to the generation of electricity, the most important
energy source is hydraulic, which represents 81% of the total
generation (MME, 2012).
Considering an average production of charcoal in Brazil
equal to 10 million ton/year, and based on the results of the
present work, it is possible to generate more than 800 MWe of
electric energy in the country from the use of pyrolysis gases.
Nevertheless, today, this contribution is null due to the lack of
consolidated technology.
Therefore, the generation of energy from all charcoal units
in Brazil could supply 5% of the electric demand of the coun-
try, considering altogether the use of biomass residues,
generated during firewood cutting.
There is great heterogeneity of costs in the electric sector,
which range from R$84.58/MWh for large hydroelectric plants
and R$956.70/MWh for thermoelectric plants based on diesel
oil. It is then possible to infer that the estimated costs in this
work for the generation of electric energy from pyrolysis gases
are highly competitive, especially if considering the current
stage of energy recession in Brazil, fundamentally dependent
on the inconstant rainfall regime.
2A, modeled using the software cycle Tempo.

Table 12 e Main results obtained from the modeling ofscenario 1A.
Parameters Unit Value
Fuel thermal power MW 15.8
Work fluid e Water
Net power MW 2.10
Efficiency % 13.36
Table 13 e Main results obtained from scenario 1B.
Parameters Unit Value
Fuel thermal power MW 15.8
Work fluid e Benzene
Thermal oil e DyPhenyl C2
Net power MW 3.04
Efficiency % 18.1
Table 14 e Main results obtained from scenario 2A.
Parameters Unit Value
Fuel thermal power MW 21.425
Working fluid e Water
Net power MW 2.9
Efficiency % 13.37
Table 15 e Main results obtained from scenario 2B.
Parameters Unit Value
Fuel thermal power MW 21.45
Working fluid e Benzene
Thermal oil e DyPhenyl C2
Net power MW 4.1
Efficiency % 18.2
b i om a s s a n d b i o e n e r g y 6 9 ( 2 0 1 4 ) 2 2 2e2 4 0 239
4. Conclusions
There is an enormous potential in the State of Minas Gerais
and in the entire Brazil for electricity generation using pyrol-
ysis gases and other byproducts from wood carbonization.
The reduction of the environmental impact related to gases
released into atmosphere must be also considered. For con-
ventional carbonization technologies, the energy recovery
from exhaust gases is complex because of the variation in its
composition during the different carbonization stages. Some
Table 16 e Results of the economical evaluation of scenarios 1
Parameters CRC e gas O
Fuel cost, USD$/(5e10 km) 0
Electric power, MW 2.1
Investment, USD$ 5,813,234
Levelized cost, USD$/MWh electric 51.65
Specific investment, USD$/MWe 2768.2
NPV, USD$ 353115.6
TIR, % 14.0
Minimum commercialization price, USD$
MWh�1
108.6
solutions as operation in synchronized clusters of kilns and
the built-up of a system of ducts is required. Another solution
is the implementation of a technology of semi-continuous or
continuous kilns.
The project development and tests results of a continuous
kiln e The Rima Container Kiln (RCM) were described and
discussed. Also, a technical and economical evaluation of
cogeneration options, based on a charcoal unit using RCK, was
performed.
The pilot RCKwas improved and it resulted in an industrial
unit, with an increased capacity, an instrumentation
arrangement, a control system, a mechanized operation and
improved thermal capacity.
During the tests, the load, the gas flow, the gas composi-
tion, the pressure and temperature values, the inlet air flow,
the firewood temperature in 74 points and the volume of
generated pyroligneous acid were monitored parameters. All
the data were continuously registered in real time. The tests
lead to a stabilized operational regime with the following
characteristics: volumetric yield: 1.3 st of firewood per m3 of
firewood; gravimetric yield: 34%; carbonization time: 3 h; gas
generation: 6500 m3/h in each kiln, with a heating value of
1470 kJ/m3; thermal power in each kiln: 3 MW; pyroligneous
acid production: 150 kg in each cycle and approximately 1 ton
of charcoal per hour, per kiln.
The RCK semi-continuous kiln allows solving the problems
present in conventional kilns for cogeneration based on py-
rolysis gases and other carbonization products. The gas
composition and its heating value are constant in time. The
average gas composition in the industrial prototypewas: CO2 -
11.2%, CO - 11.9%, CH4 - 0.50, C3H 8- 0.3, H2 - 0.1%, O2 -4.90, N2 -
70.7%.
The industrial kilns present higher productivity and po-
tential for utilization of carbonization by-products because
the composition and heating value of the pyrolysis gases are
constant. This avoids the necessity of building up ducts for
gases transportation and synchronizing kilns operation in a
pre-defined sequence.
Conventional Rankine Cycle (CRC) and Organic Rankine
Cycle (ORC) are the most suitable technologies for cogenera-
tion, using RCK by-products.
Four scenarios were evaluated: CRC and ORC technologies
with and without utilization of forest fines residues. From the
point of view of the economic indicators used in the feasibility
study (generation costs and NPV), the best scenarios are 1B
and 2A respectively. The best result is: ORC technology, which
has an electricity generation cost of 29.71 and 29.50 US$/MWh,
A, 1B, 2A and 2B.
RC e gas CRC e gas þ fines ORC e gas þ fines
0 1.36 1.36
3.0 2.9 4.1
4,602,433 6,214,207 6,288,781
29.50 39.74 29.71
1534.2 2142.83 1533.9
184121.7 392895.9 249167.9
14.0 14.0 14.0
61.2 82.5 61.4

b i om a s s a n d b i o e n e r g y 6 9 ( 2 0 1 4 ) 2 2 2e2 4 0240
for the cases with and without use of the forest residues
respectively.
The results obtained in this study lead to the conclusion
that the RCK presents not only a better carbonization perfor-
mance but it may also be an efficient and easier way to use
exhaust gases, tars and forest residues for electricity genera-
tion in a cogeneration arrangement.
Acknowledgment
The authors would especially like to thank the company Rima
Industrial S/A for believing, investing and providing human,
technical and financial resources for development, contin-
uous improvement and completion of this project. Special
thanks are also given to FINEP (a Brazilian Public Agency for
the promotion of Science, Technology and Innovation in
companies, universities and research institutions) for
believing and investing in this Project.
r e f e r e n c e s
[1] BEEMG. 26o Balanco Energ�etico do Estado de Minas Gerais,Ano base 2011. CEMIG; 2011.
[2] EPE. Balanco Energ�etico Nacional. E. d. P. Energ�etica. Rio deJaneiro: Minist�erio de Minas e Energia e MME; 2011. 267,from, https://ben.epe.gov.br/BENRelatorioFinal2011.aspx.
[3] Medeiros CA, Rezende MEA. Alcatr~ao Vegetal: Perspectivasde uso e produc~ao. Fundac~ao Jo~ao Pinheiro 1983;13(9a10):42e8.
[4] Gomes PA, Oliveira JB. Teoria da carbonizac~ao da madeira.In: Penedo WR, editor. Uso da madeira para fins energ�eticos.Belo Horizonte: CETEC; 1980. p. 158 [S�erie Publicac~oesT�ecnicas, n. 1].
[5] Ferreira OC. O futuro do carv~ao vegetal na siderurgia:emiss~ao de gases de efeito estufa na produc~ao e consumo docarv~ao vegetal. Revista Economia & Energia 2000;4(21).
[6] Mendes MG, Gomes PA, Oliveira JB. Propriedades e controleda qualidade do carv~ao vegetal. In: Produc~ao e utilizac~ao de
carv~ao vegetal. Belo Horizonte: Fundac~ao Centro Tecnol�ogicode Minas Gerais e CETEC; 1982. p. 77e89.
[7] Silva E, Nogueira L. Dendroenergia, Fundamentos eAplicac~oes. 2nd ed. Interciencia; 2003.
[8] Brito JO, e Barrichelo LEG. Considerac~oes sobre a produc~ao decarv~ao vegetal com madeiras da Amazonia. IPEF-ESALQ.S�erie T�ecnica, vol. 2; 1981. p. 1e25. #5.
[9] Fundac~ao Centro Tecnol�ogico de Minas Gerais e CETEC.Produc~ao e utilizac~ao de Carv~ao Vegetal, 1 v. Belo Horizonte:CETEC; 1982 [S�erie de Publicac~oes T�ecnicas].
[10] Pinheiros PCC, Sampaio RS, Rezende MEA. A produc~ao decarv~ao vegetal: teoria e pr�atica. Belo Horizonte; 2006.
[11] Nogueira CP, Franca GAC, Souza Junior L. Otimizac~ao daproduc~ao de carv~ao vegetal em escala industrial. In:Semin�ario De Balancos Energ�eticos Globais E Utilidades, 21.,1999, Vit�oria. Anais. Vit�oria: ABM; 1999. p. 1e10[Mimeografado].
[12] Baer RF. Avaliac~ao Economica, Ambiental e T�ecnica deQuatro Fornos para produc~ao de Carv~ao Vegetal. Monografia.UFV; 2008.
[13] Vital MHF, Pinto MAC. Condic~oes para a Sustentabilidade daProduc~ao de Carv~ao Vegetal para Fabricac~ao de Ferro-Gusano Brasil. BNDES Setorial 2009;30:237e97.
[14] Leal TE. Produc~ao de Carv~ao Vegetal atrav�es de micro-ondas.Monografia. Universidade Federal de Ouro Preto; 2012.
[15] Moura LF, Brito JO, Silva Junior FG. Effect of thermaltreatment on the chemical characteristics of wood fromEucalyptus grandis W. Hill ex Maiden under differentatmospheric conditions. CERNE (UFLA) 2012;18:449e55.
[16] United States Environmental Protection Agency. Methaneand nitrous oxide emissions from natural sources; April2010.
[17] Santos ID. Influencia dos teores de lignina, holocelulose eextrativos na densidade b�asica e contrac~ao da madeira e nosrendimentos e densidade do carv~ao vegetal de cinco esp�ecieslenhosas do cerrado. Departamento de Engenharia Florestale Universidade de Brasılia; Fevereiro 2008.
[18] Sinha S, Jhalani A. Modeling of pyrolysis in wood: a review.New Delhi e 110016-India: Department of MechanicalEngineering. Indian Institute of Technology.
[19] Di Blasi C. Analysis of convection and secondary reactioneffects within porous solid fuels undergoing pyrolysis.Combust Sci Technol 1993;90:315e39.