a novel change detection method based on statistical
TRANSCRIPT

Sensors 2020, 20, 1508; doi:10.3390/s20051508 www.mdpi.com/journal/sensors
Article
A Novel Change Detection Method Based on
Statistical Distribution Characteristics Using Multi‐
Temporal PolSAR Data
Jinqi Zhao 1,2, Yonglei Chang 3,*, Jie Yang 1, Yufen Niu 4, Zhong Lu 5 and Pingxiang Li 1
1 State Key Laboratory of Information Engineering in Surveying, Mapping and Remote Sensing,
Wuhan University, Wuhan 430079, China; [email protected] (J.Z.); [email protected] (J.Y.);
[email protected] (P.L.) 2 Jiangsu Key Laboratory of Resources and Environmental Information Engineering, China University of
Mining and Technology, Xuzhou 221116, China 3 Faculty of Geomatics, East China University of Technology; Nanchang 330013, China 4 College of Geology Engineering and Geomatics, Chang’an University, Xian 710054, China 5 Huffington Department of Earth Sciences, Southern Methodist University, Dallas, TX 75275, USA
* Correspondence: [email protected] ; Tel.: +86‐15623037628
Received: 7 February 2020; Accepted: 4 March 2020; Published: 9 March 2020
Abstract: Unsupervised change detection approaches, which are relatively straightforward and
easy to implement and interpret, and which require no human intervention, are widely used in
change detection. Polarimetric synthetic aperture radar (PolSAR), which has an all‐weather
response capability with increased polarimetric information, is a key tool for change detection.
However, for PolSAR data, inadequate evaluation of the difference image (DI) map makes the
threshold‐based algorithms incompatible with the true distribution model, which causes the change
detection results to be ineffective and inaccurate. In this paper, to solve these problems, we focus on
the generation of the DI map and the selection of the optimal threshold. An omnibus test statistic is
used to generate the DI map from multi‐temporal PolSAR images, and an improved Kittler and
Illingworth algorithm based on either Weibull or gamma distribution is used to obtain the optimal
threshold for generating the change detection map. Multi‐temporal PolSAR data obtained by the
Radarsat‐2 sensor over Wuhan in China are used to verify the efficiency of the proposed method.
The experimental results using our approach obtained the best performance in East Lake and Yanxi
Lake regions with false alarm rates of 1.59% and 1.80%, total errors of 2.73% and 4.33%, overall
accuracy of 97.27% and 95.67%, and Kappa coefficients of 0.6486 and 0.6275, respectively. Our
results demonstrated that the proposed method is more suitable than the other compared methods
for multi‐temporal PolSAR data, and it can obtain both effective and accurate results.
Keywords: change detection; omnibus test statistic; Kittler and Illingworth (K&I); Weibull
distribution; gamma distribution; PolSAR
1. Introduction
Change detection is an important remote sensing technology that is used to identify the changes
of the Earth’s surface through multi‐temporal images of the same geographical area observed at
different times [1]. On the one hand, due to the impact of environmental factors and social
development, changes occur all the time. On the other hand, as a result of the development of satellite
systems, a huge number of remote sensing images can now be acquired to detect these changes.
Owing to the explosive increase in remote sensing data, how to detect changes accurately is an active
research topic [2]. In this context, multi‐temporal remote sensing images of the same region proved

Sensors 2020, 20, 1508 2 of 20
particularly useful in the applications of change detection, including urban planning [3,4],
agricultural research [5,6], disaster detection [7,8], and wetland detection [9,10]. As one of the
effective means in change detection, synthetic aperture radar (SAR) systems have more advantages
than optical sensors, due to their ability to acquire periodic images, regardless of weather or daylight.
Unsupervised change detection methods [11,12] have the advantage of a simple design, and they
involve the following steps: (1) data preprocessing, (2) production of the difference image (DI), and
(3) analysis of the DI. The main techniques used in the first step are radiometric calibration, image
co‐registration [13], and speckle filtering [14]. Precise preprocessing is vital to improve the accuracy
of the change detection results. After the preprocessing, the quality of the DI map and the choice of
threshold algorithm are closely linked to the results of the unsupervised change detection. In the
second step, many different approaches, both pixel‐based and object‐based, can be used to produce
a DI map, and they each have their own respective advantages and disadvantages [15]. The pixel‐
based approaches are easy to design and quick to process. As such, they are widely used in generating
DI maps [16]. In contrast, the object‐based approaches combine the pixels of homogeneous regions,
which can preserve the detailed information [17,18]. However, these methods require many
parameters to be set. Parameter testing is a key factor that influences the performance of DI maps,
and it results in the object‐based approaches being inefficient. In order to design a suitable and
efficient approach, pixel‐based methods are the focus in our research. To date, many different
approaches were developed for producing DI maps, such as the log‐ratio technique [19,20], the
neighborhood‐based ratio technique [21], feature fusion [22,23], Markov random field‐based models
[24,25], principal component analysis [26], Kullback–Leibler divergence method [27], and time‐series
analysis on Google Earth Engine [28,29]. However, these methods only use single/dual polarization
SAR data. In consideration of the special distribution of SAR backscattering [30] and using more
channel information, the test statistic method with maximum likelihood estimation (MLE) [31],
change detection matrices with Wishart distance [32], Kennaugh element framework [33], and the
Hotelling–Lawley trace statistic [11] can apply the covariance (or coherence) matrix to obtain DI maps
and fit for detecting the abrupt changes. As an extension of the test statistic, the omnibus likelihood
ratio test statistic approach, which can be applied in dual‐/quad‐pol acquisitions [34,35], proved
particularly useful in multi‐temporal change detection, and it can detect both abrupt changes and
steady increased changes [35]. In this paper, multi‐temporal covariance (or coherence) matrices are
still satisfied with a Wishart distribution and used by the omnibus likelihood ratio test statistic
approach to produce an accurate DI map. Finally, in order to choose the threshold accurately and
efficiently, a number of methods were developed based on automatic threshold selection [31,36,37].
Compared with these methods, the Kittler and Illingworth (K&I) algorithm is based on Bayesian
theory, and it determines the optimal threshold by minimizing the classification error. This approach
has a solid mathematical foundation and is widely used in image processing. However, one problem
that should be noted is that the pre‐assumed distribution model for the DI has a great impact on the
effectiveness of the K&I algorithm. In the previous studies of change detection, the DIs were usually
generated from single‐channel SAR images, and Gaussian, generalized Gaussian, Rayleigh, or
exponential distribution models were assumed for the statistical property of the DI [38‐40]. However,
as soon as a DI map is generated by the omnibus likelihood ratio test statistic method with four
channels of polarimetric synthetic aperture radar (PolSAR) data, the statistical property of the DI is
changed. In order to obtain accurate change detection results, a more appropriate distribution model
should be adopted and, consequently, new versions of the K&I algorithm need to be developed.
Weibull and gamma distributions are widely used in analyzing the statistical characterization of SAR
data [41], and they are applied in image segmentation [42], texture analysis [43], deformation
modeling [44], classification [45], and target detection [46]. However, to our knowledge, Weibull or
gamma distribution was not previously applied to describe the statistical behaviors of a change
detection DI map. Therefore, in order to obtain a precise threshold, Weibull or gamma distribution is
used to modify the K&I algorithm.
Above all, we propose a novel change detection method based on the omnibus likelihood ratio
test statistic and improved K&I algorithm using the Weibull or gamma distribution in this paper. The

Sensors 2020, 20, 1508 3 of 20
appropriate DI map is generated by an omnibus likelihood ratio test statistic from the multi‐temporal
covariance (or coherency) matrix. Moreover, to estimate the distribution properties of the DI map,
statistical histogram curve‐fitting is utilized to determine the distribution model. Furthermore,
Weibull or gamma distribution is used to improve the K&I algorithm, as well as obtain the optimal
threshold. Finally, an accurate change detection map is generated using the DI map and the optimal
threshold.
The rest of this paper is organized as follows: the principle and detailed procedures of the
proposed method are described in Section 2. Section 3 introduces the case study. Section 4 provides
the experimental results and analyses. Potentials and limitations of the proposed method are briefly
discussed in Section 5. Finally, our conclusions are drawn in Section 6.
2. Materials and Methods
2.1. The Model of PolSAR Data
Fully polarimetric information is used in the proposed method, which can be expressed by
Equation (1) when the target reciprocity condition is satisfied.
[ , 2 , ]Thh hv vvS S S , (1)
where h and v represent horizontal and vertical polarization, respectively. The scattering vector Shv
represents the vertical transmitting and horizontal receiving polarizations. T denotes the transpose
operation.
After multi‐look processing, as an example of a covariance matrix, the backscattered information
matrix of the ground target follows a Wishart distribution and can be expressed as follows:
2
2
2
hh hh hv hh vv
Thv hh hv hv vv
vv hh vv hv vv
S S S S S
X S S S S S
S S S S S
. (2)
After image preprocessing, the co‐registered and equal‐sized PolSAR images from the same
geographical region can be represented by Xt1 (i, j), Xt2 (i, j), …, Xtn (i, j) at time t1, t2, …, tn, respectively. Because of the different data obtained over a long time interval, we can assume that the temporal
PolSAR measurements (Xt1, Xt2 …Xtn) are independent and can be expressed as follows:
1
2
1 1
2 2
( , , )
( , , )
( , , )
t
t
tn
t X
t X
tn n X
X W p m
X W p m
X W p m
, (3)
where p represents the matrix dimension of Xt1, Xt2, …, Xtn, and m1, m2, …, mn represents the number of
looks of Xt1, Xt2, …, Xtn, respectively. The probability density function (PDF) of the Xti is expressed by Equation (4). ΣXti denotes the dispersion matrix of the i‐th PolSAR image and is calculated by
Equation (5).
11( ) exp
i i
ti
m m p
ti X ti tip i
f X X tr Xm
, (4)
where ( 1)/ 2
1
( 1)p
p pp i i
j
m m j
.
1=
tiX tii
Xm
. (5)

Sensors 2020, 20, 1508 4 of 20
2.2. The Proposed Method
2.2.1. Omnibus Test Statistic
When a change occurs in the time interval [t1, tn], we need to check these changes by comparing
the PolSAR measurements. The omnibus test statistic [35], which has proved useful in detecting both
discontinuous jump and steady increased changes, is introduced in this section.
Comparing Xt1, Xt2, …, Xtn, when these dispersion matrices satisfy ΣXt1 = ΣXt2 = … = ΣXtn, this means
that the ground targets in these regions at different dates show the characteristic of being unchanged,
and they can be defined by the null hypothesis (H0). In contrast, when these dispersion matrices
satisfy ΣXti ≠ ΣXtj and i, j denote the arbitrary time, this means that at least one change happened in
these regions, and it can be defined by the alternative hypothesis (H1).
The joint densities of omnibus test statistics based on MLE can be expressed by f (ΣXt1, ΣXt2, …, ΣXti, ε), where the parameter ε is the set of the probability function. Furthermore, the omnibus test statistic
(Q) using the likelihood ratio is expressed by Equation (6).
0
1
ˆmax ( )= =
max ( )ti ti
H
n
X Xi
LLQ
LL
,
(6)
where L(▪) and f(▪) are the likelihood function and frequency function, respectively, and Ω = H0∪H1.
When combined with Equations (3) and (5), ̂ can be expressed as follows:
1
1
1ˆn
tini
ii
Xm
. (7)
If we assume that ΣXt1 = ΣXt2 = … =ΣXtn =Σ, and Equation (4) is input into Equation (6), then Q can be expressed as follows:
11
11
1
1
1
ˆexp
1exp
n
ii
i
i i
ti
mn n
m p
ti tinii
p ii
n m m p
X ti tii p i
X tr Xm
Q
X tr Xm
. (8)
When combined with Equation (7) and assuming m1 = m2 = … = mn = m, Equation (8) can be simplified as follows:
1=
mn
tipn in
ti
XQ n
X
. (9)
After a logarithm operation, the DI map (d) with the omnibus test statistic can be denoted by
Equation (10).
2
1 1
2 4 1( ln ln ln )
2
n n
ti tii i
p pmd pn n X n X
p
. (10)
2.2.2. The K&I Algorithm Based on Weibull or Gamma Distribution
(a) Statistical Distribution Model of the DI Map
After generating the DI map from the multi‐temporal PolSAR images, an automatic thresholding
method is introduced. To obtain good change detection results, an appropriate thresholding
algorithm is needed to separate the DI into the changed and unchanged classes. We recommend the
K&I algorithm, which obtains the optimal threshold value by minimizing the classification error [38].
Sensors 2020, 20, 1508 5 of 20
As the statistical distribution function is considered in this algorithm, it is best to establish which
distribution model is most compatible with the DI map. Typically, Gaussian and generalized
Gaussian distribution models are used in remote sensing imagery. Due to the impact of speckle noise,
the negative exponential model is widely used in SAR imagery [47]. Furthermore, the Weibull
distribution can be compatible with PolSAR data over a wide resolution range, and the PDF involves
a scale parameter θ and a shape parameter γ, as follows:
1 0X
p X X exp , X
. (11)
The gamma distribution is also a two‐parameter distribution model, which can degenerate to an
exponential or chi‐squared distribution in some circumstances. Moreover, this distribution model is
fit for PolSAR imagery with a medium resolution. The PDF of the gamma distribution involves a rate
parameter θ, a shape parameter γ, and a gamma function Г(γ), as follows:
1
0XX e
p X , X
. (12)
A visual way to determine if the distribution model is suitable or not is distribution function
fitting. After we make the distribution function fit in some homogeneous areas via MLE operation,
we can observe the goodness of fit by comparing it with the statistical histogram. The homogeneous
areas can be lakes or vegetation areas. Moreover, as one of important types of surface coverage, urban
area was also selected to analyze its distribution property.
(b) The K&I Algorithm Based on Weibull or Gamma Distribution
In order to obtain a precise threshold, both Weibull and gamma distributions are separately
used to modify the K&I algorithm. As an extension of Bayesian theory, the traditional K&I
thresholding method can be expressed as shown in Equation (13),
1
0
( ) ( ) ( , )l
L
l ld
J T h d c d T
where
2ln | , ,( , )=
2ln | , ,
u l l
l
c l l
P d T d Tc d T
P d T d T
(13)
where L, T, and h(dl) denote the numbers of possible gray levels, the threshold, and the histogram of
the DI map, respectively. J(▪) and c(▪) denote the criterion function and cost function, respectively. Under the condition of dl and the threshold T, P(ωi|dl,T) (i = u,c) denotes the posterior probability of unchanged (u) and changed (c) classes, respectively.
The traditional K&I method assumes that the class‐conditional distribution follows a Gaussian,
generalized Gaussian, Rayleigh, or exponential distribution, but this assumption cannot accurately
reflect the distribution of the DI map. After we analyzed the statistical property of the DI, we found
that it was more compatible with the two‐parameter distribution models, i.e., Weibull or gamma
distributions, which is later confirmed in the experimental part. In order to improve the threshold
selection, an improved model based on Weibull or gamma distribution is used to describe the
statistical behaviors of the changed and unchanged classes in the DI. We, therefore, propose a new
and improved version of the K&I algorithm. If we assume that the distribution model is a Weibull
distribution, by combining Equations (11) and (13), the new criterion function can be shown as
follows:
1
0
11
1
u
u
l
c
c
l
Tu l
l ld u u
Lc l
l ld T c c
u
c
dJ T h d d exp
dh
lnP ln
ln P lnd d exp
.
(14)

Sensors 2020, 20, 1508 6 of 20
The symbols θu,γu, θc and γc are the scale and shape parameters of Pu(dl| u, T) and Pc(dl| c, T), respectively, which are the Weibull distribution functions estimated with the pixels in the DI map by
MLE. After expanding the above equation, the criterion is changed to
1
0 0
1 11
1 1
u u
l l
c c
l l
T T
l l u l l u ud d
L L
u
l l c l c cd T d
c cT
uJ T h d d h d ln d
h d
P ln P
Pd h d ln Pln d
. (15)
When the gamma distribution is considered, we can generate another criterion function by
combining Equations (12) and (13). Following the same operation as above, the K&I algorithm based
on a gamma distribution is as follows:
1
0
11
1
u u
l
c c
l
T
l u l l u ud
L
l c
u u
l l c cd
cT
c
J T h d d ln d
h d d ln d
P ln P
P ln P
. (16)
In the application of this algorithm, we firstly calculate the statistical histogram of the DI. We
then compute criterion J(T) at each histogram level. Finally, we choose the histogram level where
criterion J(T) is the minimum as the optimal threshold, i.e., T*= argmin{J(T): T = 0, 1, …, L − 1}. In
change detection, the area is marked as a changed one if its pixel value is higher than the optimal
threshold in the DI.
2.2.3. The Workflow of the Proposed Method
The entire steps in the proposed approach can be demonstrated as follows:
Step (1): The preprocessing that involves co‐registration and removal of speckle noise for the
test data is firstly conducted. In this study, the precision of the co‐registration was less than
one pixel, and the refined Lee filter [47] was used to suppress the speckle noise.
Step (2): The omnibus test statistic method is used to generate the DI map from PolSAR
images at different dates.
Step (3): Statistical histogram curve‐fitting is utilized to determine the function distribution
model in homogeneous and unchanged regions. Weibull and gamma distributions are
separately applied to improve the K&I algorithm.
Step (4): The pixels in position (i, j) at different dates should be determined as unchanged or
changed. If dij < T, the index of this pixel is equal to zero, which denotes that the pixels in this
position are similar or unchanged. Otherwise, the corresponding pixels are deemed as
different or changed, and the index is equal to one. After completing the indexes of all the
pixels in the multi‐temporal images, the change detection map is produced. Figure 1 shows
the detailed algorithm flowchart.

Sensors 2020, 20, 1508 7 of 20
Original image X1 (time t1)
Original image X2 (time t2)
Filtered for X1 Filtered for X2
Generate DI map (d) using Omnibus Test Statistics
Obtain the threshold T using K&I based on Weibull or Gamma distribution
dij < T
Unchanged
YES
Changed
NO
Obtain the change detection map
Co‐registered
Figure 1. Flowchart of the proposed method.
2.3. Evaluation Criterion
For the quantitative evaluation, the false alarm (FA) rate, the total errors (TE), the overall
accuracy (OA), and the Kappa coefficient are used to verify the performance of the proposed method.
When the ground truth is available, these indicators can be expressed as follows:
2
1( )( ) ( )( )
u
c u
FP FP FNFA TE
N N
TP TN OA PeOA Kappa
N PeTP FN TP FP FP TN FN TN
PeN
N N N
,
,, (17)
where true positives (TP) denote the number of changed points which are detected correctly, true
negative (TN) denotes the number of unchanged points which are detected correctly, false positives
(FP) denote the number of unchanged points which are detected incorrectly, and false negatives (FN)
denote the number of changed points which are detected incorrectly. Moreover, the numbers of
changed points and unchanged points are denoted by Nc and Nu, respectively.
3. Case Study
3.1. Study Area and Background
As a central city in China, the city of Wuhan is located in the eastern part of Hubei province and
lies in the middle reaches of the Yangtze River (Figure 2). It belongs to the north subtropical monsoon
climate zone, and it has abundant rainfall. There are many rivers and lakes in Wuhan, which account
for one‐quarter of the total city area. Due to urbanization and population growth, Wuhan is one of
the most rapidly developing cities in China. As a result, how to detect changes accurately is important
for both regional economic development planning and dynamic monitoring. Because of the
construction of the East Lake Greenway and the 50‐year return period rainfall that occurred between
2015 and 2016, changes in urban facilities and inundation detection are the emphasis of this research.

Sensors 2020, 20, 1508 8 of 20
Compared with optical sensors, SAR sensors are a better solution to detect these changes in the
scenario of constant rainfall. Two PolSAR images of Wuhan from this period were, thus, used to
monitor the changes in urban facilities and those caused by inundation.
Figure 2. Location of the research area.
3.2. Datasets and Image Preprocessing
Because this flooding event happened suddenly and receded rapidly, the timing of SAR data
acquisition is extremely critical. Thanks to the C‐band Radarsat‐2 sensor (with a repeat cycle of 24
days), we acquired near‐real‐time PolSAR data on 6 July 2016. Furthermore, the archived pre‐event
PolSAR data were used to detect changes caused by urbanization and inundation in Wuhan. Table 1
shows the parameters of the experimental datasets.
Table 1. Detailed parameters of the test datasets.
Date of Observation Beam Mode Pixel Spacing (m)
Azimuth × Range Incidence Angle (°) Swath Width (km)
25 June 2015 FQ21 5.12 × 4.73 40.16–41.58 25 × 25
6 July 2016 FQ27 4.86 × 4.73 45.23–46.69 25 × 25
In order to ensure the precision of the change detection results, the preprocessing of the
experimental datasets included radiometric calibration, image co‐registration, and speckle filtering,
all of which were completed using two free open‐source software packages (NEST and PolSARpro).
After the preprocessing, the pixel values at the different dates were directly related to the radar
backscattering coefficients and had the same original resolution. Moreover, for the co‐registered
images, speckle noise was removed by refined Lee filtering based on a 7 × 7 window.
4. Results and Analyses
The Pauli‐RGB images (|Shh – Svv| for red (R), |Shv| for green (G), and |Shh + Svv| for blue (B)) of
Wuhan in 2015 and 2016 are shown in Figure 3. In order to verify the efficiency of the proposed
method, the regions labeled by the two red boxes (region 1 is East Lake and region 2 is Yanxi Lake)
in Figure 3a were selected to provide a detailed assessment. These regions cover urban areas, water
bodies, forest, and other urban facilities.

Sensors 2020, 20, 1508 9 of 20
(a) (b)
Figure 3. Radarsat‐2 polarimetric synthetic aperture radar (PolSAR) images acquired on (a) 25 June
2015, and (b) 6 July 2016.
To establish which distribution model is most compatible with the data, three typical surface
features were chosen to analyze the statistical distribution of the DI map: water, a vegetated area, and
an urban area. The exact regions are shown in Figure 3b. The statistical histograms of the chosen
regions in the DI map are shown in Figure 4. In addition, distribution models based on Rayleigh,
exponential, Gaussian, Weibull, and gamma distributions are denoted by the different color curves
in Figure 4, and these curves were fitted by the MLE method with pixels in these regions. In Figure
4, it is apparent that the Weibull distribution (red curve) and gamma distribution (green curve) are
more suitable than the other function distributions in the water region (Figure 4a), urban region
(Figure 4b), and vegetated region (Figure 4c).
(a) (b) (c)
Figure 4. The statistical histograms and distribution function fitting in (a) a water area, (b) an urban
area, and (c) a vegetated area.
4.1. Analysis of the Urban Facilities Changes for East Lake from 2015 to 2016
The first research region was East Lake, for which the image size was 800 × 500 pixels. The land
cover of this region is mainly greenway, urban areas, water bodies, and grassland. Due to the
greenway re‐construction that took place in this period, we focus on a detailed assessment of this
area. The Pauli‐RGB images at the different dates and the reference data are shown in Figure 5.
Furthermore, the reference map was produced by field surveys conducted and visual interpretation
from Google Earth.
Sensors 2020, 20, 1508 10 of 20
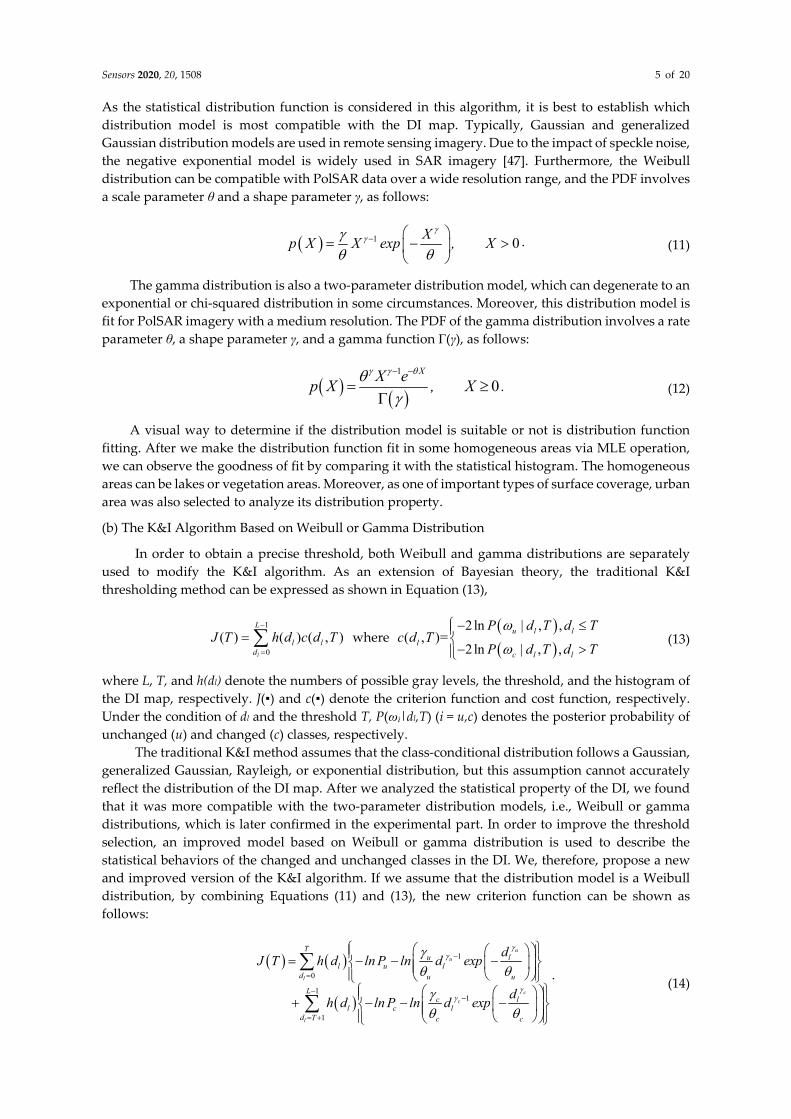
(a) (b) (c)
Figure 5. Radarsat‐2 PolSAR images of East Lake (region 1) acquired on (a) 25 June 2015, and (b) 6
July 2016. (c) The ground reference map (white denotes change and black denotes non‐change).
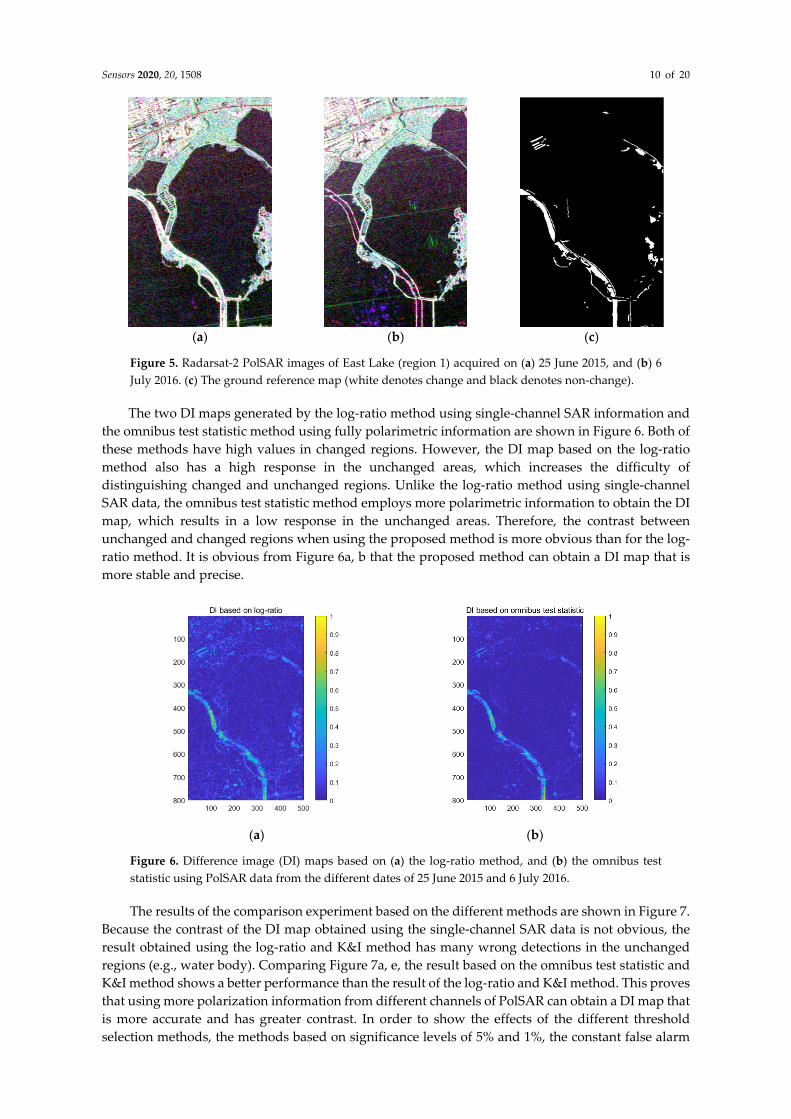
The two DI maps generated by the log‐ratio method using single‐channel SAR information and
the omnibus test statistic method using fully polarimetric information are shown in Figure 6. Both of
these methods have high values in changed regions. However, the DI map based on the log‐ratio
method also has a high response in the unchanged areas, which increases the difficulty of
distinguishing changed and unchanged regions. Unlike the log‐ratio method using single‐channel
SAR data, the omnibus test statistic method employs more polarimetric information to obtain the DI
map, which results in a low response in the unchanged areas. Therefore, the contrast between
unchanged and changed regions when using the proposed method is more obvious than for the log‐
ratio method. It is obvious from Figure 6a, b that the proposed method can obtain a DI map that is
more stable and precise.
(a) (b)
Figure 6. Difference image (DI) maps based on (a) the log‐ratio method, and (b) the omnibus test
statistic using PolSAR data from the different dates of 25 June 2015 and 6 July 2016.
The results of the comparison experiment based on the different methods are shown in Figure 7.
Because the contrast of the DI map obtained using the single‐channel SAR data is not obvious, the
result obtained using the log‐ratio and K&I method has many wrong detections in the unchanged
regions (e.g., water body). Comparing Figure 7a, e, the result based on the omnibus test statistic and
K&I method shows a better performance than the result of the log‐ratio and K&I method. This proves
that using more polarization information from different channels of PolSAR can obtain a DI map that
is more accurate and has greater contrast. In order to show the effects of the different threshold
selection methods, the methods based on significance levels of 5% and 1%, the constant false alarm

Sensors 2020, 20, 1508 11 of 20
rate (CFAR) algorithm, and the traditional K&I algorithm were used in the contrast experiment. The
results of the change detection (Figure 7b, c, d, e) demonstrate that using the traditional K&I method
results in fewer false alarms than the other methods. Although the traditional K&I method shows a
better performance, the Gaussian assumption only fits a symmetric distribution, and the DI map
obtained using the fully polarimetric information and omnibus test statistic method does not fit the
symmetric distribution assumption. The change detection maps based on the different distribution
fitting methods for K&I are shown in Figures 7e, f, g, h. Comparing Figure 7e, f, due to one more
parameter being used, the K&I method based on a generalized Gaussian distribution obtains fewer
false detections in the East Lake area, and it obtains more detail information in the greenway area
than the K&I method based on a Gaussian distribution. This proves that adding one more parameter
in the Gaussian model can improve the accuracy and efficiency of the change detection results.
However, the generalized Gaussian assumption, as an extension of the Gaussian distribution, is still
designed for a symmetric distribution. Due to this drawback, both the Gaussian and the generalized
Gaussian distributions are not a good fit for the DIs from PolSAR images. This results in the K&I
method being unable to accurately extract the optimal threshold. Comparing Figure 7f a, g, the result
for the gamma distribution shown in Figure 7h shows the best performance, with fewer false alarms
and wrong detections than the other function distributions. Moreover, the K&I method based on a
Weibull distribution also performs better than the Gaussian and generalized Gaussian distributions.
This proves that, to generate a change detection result with more accuracy and efficiency, choosing a
suitable function distribution is more important than adding more parameters. The quantitative
evaluation of these different methods is given in Table 2, where the proposed method shows the best
performance in all four indicators (FA (%), TE (%), OA (%), Kappa). This confirms that our method
is superior to the other methods.
(a) (b) (c) (d)
(e) (f) (g) (h)
Figure 7. Change detection results: (a) log‐ratio and Kittler and Illingworth (K&I) algorithm; omnibus
test statistic with (b) a 5% significance level, and (c) a 1% significance level; (d) omnibus test statistic
and constant false alarm rate (CFAR) algorithm; omnibus test statistic and K&I based on (e) a
Sensors 2020, 20, 1508 12 of 20
Gaussian distribution, (f) a generalized Gaussian distribution, (g) a Weibull distribution, and (h) a
gamma distribution.
Table 2. Performance evaluation of the change detection for East Lake. FA—false alarm; TE—total
error; OA—overall accuracy.
Method FA (%) TE (%) OA (%) Kappa
Log‐ratio and traditional K&I 6.55 7.03 92.96 0.4413
Omnibus test statistic with a 5% significance level 6.17 6.42 93.58 0.4857
Omnibus test statistic with a 1% significance level 4.59 5.04 94.96 0.5398
Omnibus test statistic and CFAR 6.53 6.84 93.16 0.4630
Omnibus test statistic and traditional K&I 3.96 4.51 95.49 0.5629
Omnibus test statistic and K&I based on a generalized Gaussian distribution 3.00 3.77 96.23 0.5953
Omnibus test statistic and K&I based on a Weibull distribution 2.25 3.18 96.82 0.6271
Omnibus test statistic and K&I based on a gamma distribution 1.59 2.73 97.27 0.6486
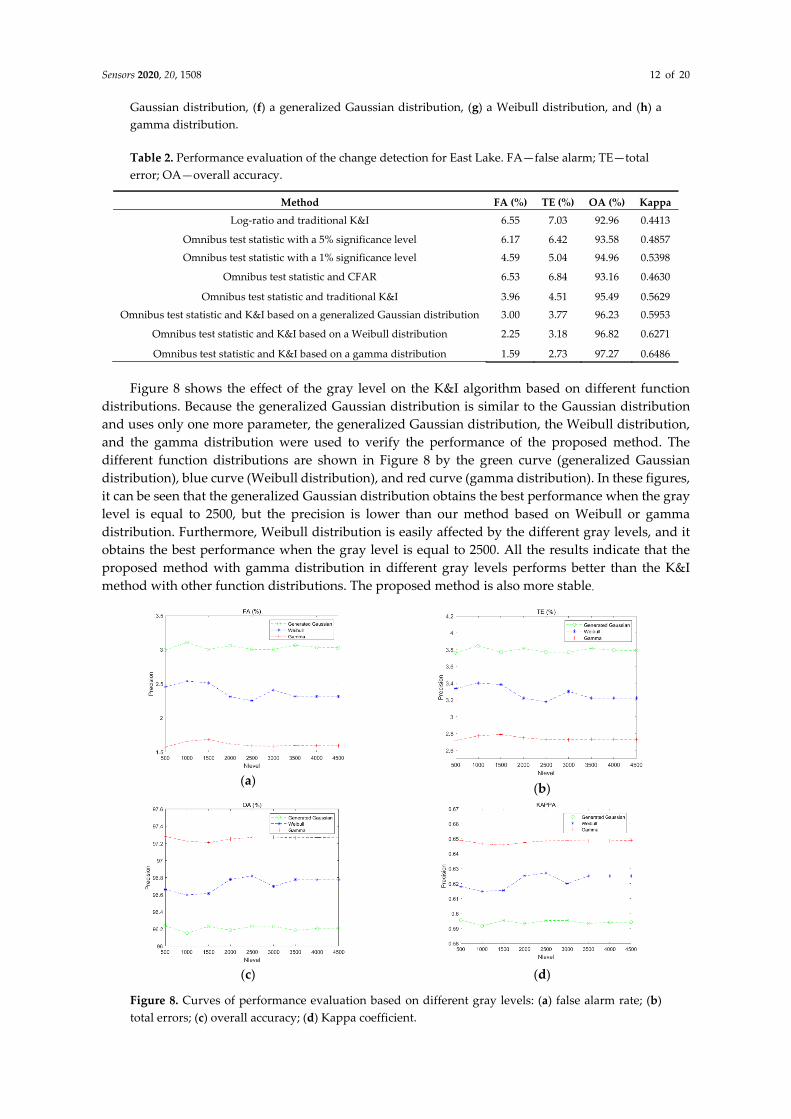
Figure 8 shows the effect of the gray level on the K&I algorithm based on different function
distributions. Because the generalized Gaussian distribution is similar to the Gaussian distribution
and uses only one more parameter, the generalized Gaussian distribution, the Weibull distribution,
and the gamma distribution were used to verify the performance of the proposed method. The
different function distributions are shown in Figure 8 by the green curve (generalized Gaussian
distribution), blue curve (Weibull distribution), and red curve (gamma distribution). In these figures,
it can be seen that the generalized Gaussian distribution obtains the best performance when the gray
level is equal to 2500, but the precision is lower than our method based on Weibull or gamma
distribution. Furthermore, Weibull distribution is easily affected by the different gray levels, and it
obtains the best performance when the gray level is equal to 2500. All the results indicate that the
proposed method with gamma distribution in different gray levels performs better than the K&I
method with other function distributions. The proposed method is also more stable.
(a)
(b)
(c) (d)
Figure 8. Curves of performance evaluation based on different gray levels: (a) false alarm rate; (b)
total errors; (c) overall accuracy; (d) Kappa coefficient.
Sensors 2020, 20, 1508 13 of 20
4.2. Analysis of Inundation and Urban Facilities Changes for Yanxi Lake from 2015 to 2016
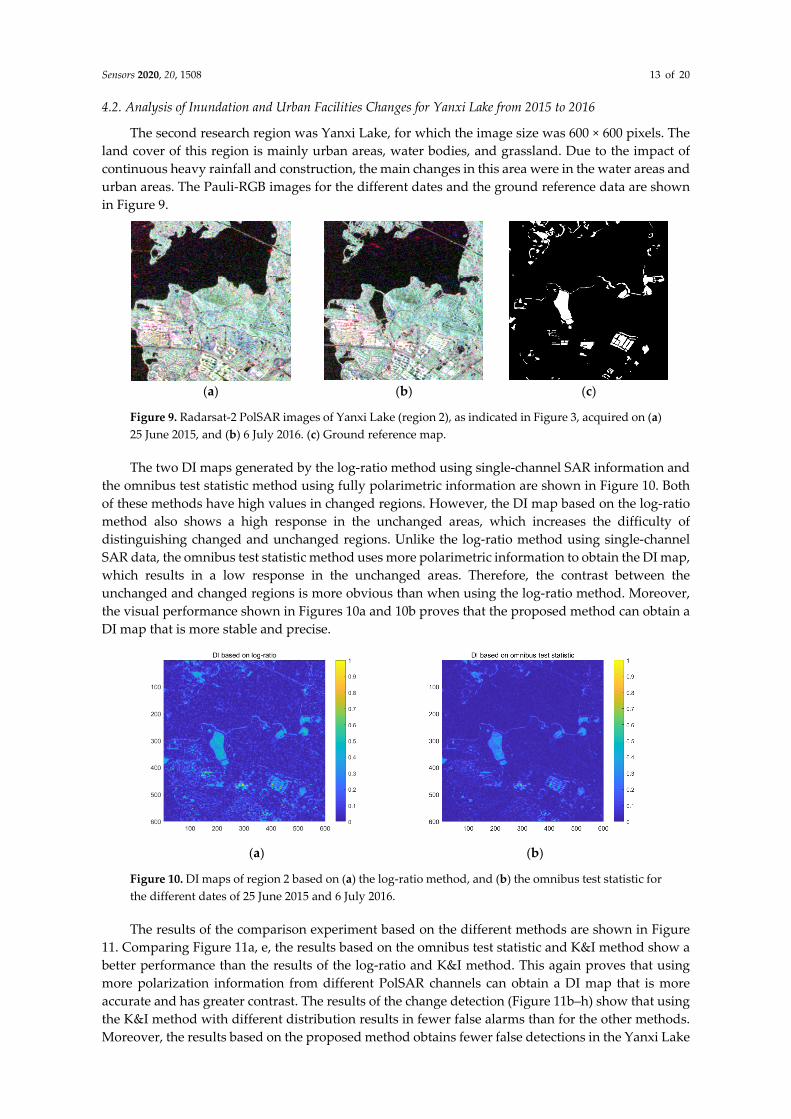
The second research region was Yanxi Lake, for which the image size was 600 × 600 pixels. The
land cover of this region is mainly urban areas, water bodies, and grassland. Due to the impact of
continuous heavy rainfall and construction, the main changes in this area were in the water areas and
urban areas. The Pauli‐RGB images for the different dates and the ground reference data are shown
in Figure 9.
(a) (b) (c)
Figure 9. Radarsat‐2 PolSAR images of Yanxi Lake (region 2), as indicated in Figure 3, acquired on (a)
25 June 2015, and (b) 6 July 2016. (c) Ground reference map.
The two DI maps generated by the log‐ratio method using single‐channel SAR information and
the omnibus test statistic method using fully polarimetric information are shown in Figure 10. Both
of these methods have high values in changed regions. However, the DI map based on the log‐ratio
method also shows a high response in the unchanged areas, which increases the difficulty of
distinguishing changed and unchanged regions. Unlike the log‐ratio method using single‐channel
SAR data, the omnibus test statistic method uses more polarimetric information to obtain the DI map,
which results in a low response in the unchanged areas. Therefore, the contrast between the
unchanged and changed regions is more obvious than when using the log‐ratio method. Moreover,
the visual performance shown in Figures 10a and 10b proves that the proposed method can obtain a
DI map that is more stable and precise.
(a) (b)
Figure 10. DI maps of region 2 based on (a) the log‐ratio method, and (b) the omnibus test statistic for
the different dates of 25 June 2015 and 6 July 2016.
The results of the comparison experiment based on the different methods are shown in Figure
11. Comparing Figure 11a, e, the results based on the omnibus test statistic and K&I method show a
better performance than the results of the log‐ratio and K&I method. This again proves that using
more polarization information from different PolSAR channels can obtain a DI map that is more
accurate and has greater contrast. The results of the change detection (Figure 11b–h) show that using
the K&I method with different distribution results in fewer false alarms than for the other methods.
Moreover, the results based on the proposed method obtains fewer false detections in the Yanxi Lake

Sensors 2020, 20, 1508 14 of 20
area, and it obtains more detailed information in the urban area. This again proves that, to produce a
change detection result with more accuracy and efficiency, choosing a suitable function distribution
is more important than adding more parameters. The quantitative evaluation for the different
methods is provided in Table 3, where the proposed method based on gamma distribution shows the
best performance in all four indicators (FA (%), TE (%), OA (%), Kappa). Moreover, Weibull
distribution also shows a better performance than the Gaussian and generalized Gaussian
distributions. This confirms that the proposed method is effective and shows a significant
improvement in detecting the changes caused by urbanization and inundation over the other
methods.
(a) (b) (c) (d)
(e) (f) (g) (h)
Figure 11. Change detection results: (a) log‐ratio and K&I; omnibus test statistic with (b) a 5%
significance level, and (c) a 1% significance level; (d) omnibus test statistic and CFAR; omnibus test
statistic and K&I based on (e) a Gaussian distribution, (f) a generalized Gaussian distribution, (g) a
Weibull distribution, and (h) a gamma distribution.
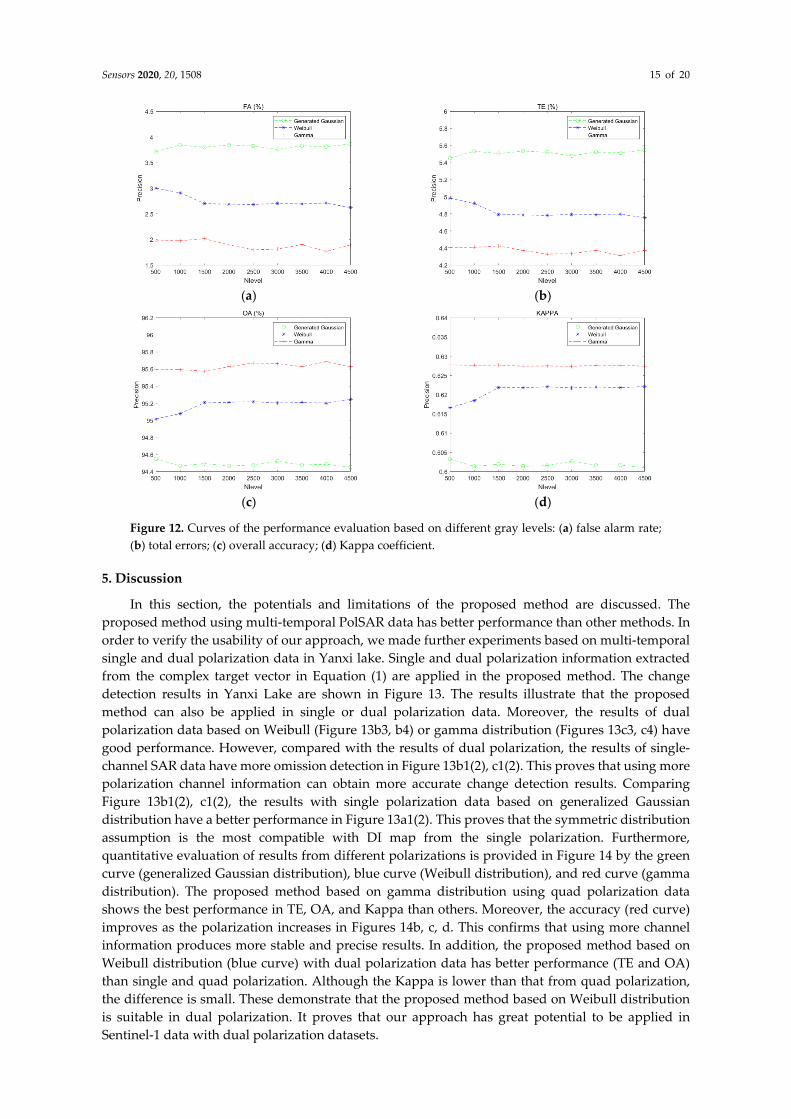
Figure 12 shows the effect of the gray level on the K&I algorithm based on the different function
distributions. In the figures, it can be seen that the generalized Gaussian distribution obtains the best
performance when the gray level is equal to 3000, but the precision is lower than the other function
distributions. The Weibull distribution is stable when the gray levels are above 1500. These results
indicate that the proposed method with gamma distribution performs better than the K&I method
with other function distributions for the case of different gray levels. Again, the proposed method is
also more stable than the other methods.
Table 3. Performance evaluation of the change detection for Yanxi Lake.
Method FA
(%)
TE
(%)
OA
(%) Kappa
Log‐ratio and traditional K&I 6.69 7.97 92.03 0.5135
Omnibus test statistic with a 5% significance level 7.22 7.99 92.01 0.5358
Omnibus test statistic with a 1% significance level 5.37 6.57 93.43 0.5749
Omnibus test statistic and CFAR 6.70 7.92 92.08 0.5179
Omnibus test statistic and traditional K&I 4.86 6.19 93.81 0.5862
Omnibus test statistic and K&I based on a generalized Gaussian
distribution 3.82 5.52 94.48 0.6016
Omnibus test statistic and K&I based on a Weibull distribution 2.68 4.78 95.22 0.6220
Omnibus test statistic and K&I based on a gamma distribution 1.80 4.33 95.67 0.6275
Sensors 2020, 20, 1508 15 of 20
(a)
(b)
(c) (d)
Figure 12. Curves of the performance evaluation based on different gray levels: (a) false alarm rate;
(b) total errors; (c) overall accuracy; (d) Kappa coefficient.
5. Discussion
In this section, the potentials and limitations of the proposed method are discussed. The
proposed method using multi‐temporal PolSAR data has better performance than other methods. In
order to verify the usability of our approach, we made further experiments based on multi‐temporal
single and dual polarization data in Yanxi lake. Single and dual polarization information extracted
from the complex target vector in Equation (1) are applied in the proposed method. The change
detection results in Yanxi Lake are shown in Figure 13. The results illustrate that the proposed
method can also be applied in single or dual polarization data. Moreover, the results of dual
polarization data based on Weibull (Figure 13b3, b4) or gamma distribution (Figures 13c3, c4) have
good performance. However, compared with the results of dual polarization, the results of single‐
channel SAR data have more omission detection in Figure 13b1(2), c1(2). This proves that using more
polarization channel information can obtain more accurate change detection results. Comparing
Figure 13b1(2), c1(2), the results with single polarization data based on generalized Gaussian
distribution have a better performance in Figure 13a1(2). This proves that the symmetric distribution
assumption is the most compatible with DI map from the single polarization. Furthermore,
quantitative evaluation of results from different polarizations is provided in Figure 14 by the green
curve (generalized Gaussian distribution), blue curve (Weibull distribution), and red curve (gamma
distribution). The proposed method based on gamma distribution using quad polarization data
shows the best performance in TE, OA, and Kappa than others. Moreover, the accuracy (red curve)
improves as the polarization increases in Figures 14b, c, d. This confirms that using more channel
information produces more stable and precise results. In addition, the proposed method based on
Weibull distribution (blue curve) with dual polarization data has better performance (TE and OA)
than single and quad polarization. Although the Kappa is lower than that from quad polarization,
the difference is small. These demonstrate that the proposed method based on Weibull distribution
is suitable in dual polarization. It proves that our approach has great potential to be applied in
Sentinel‐1 data with dual polarization datasets.

Sensors 2020, 20, 1508 16 of 20
(a1) (b1) (c1)
(a2) (b2) (c2)
(a3) (b3) (c3)
(a4) (b4) (c4)
Figure 13. Change detection results using the HH polarization based on omnibus test statistic and
K&I based on (a1) a generalized Gaussian distribution, (b1) a Weibull distribution, and (c1) a gamma
distribution; the VV polarization based on omnibus test statistic and K&I based on (a2) a generalized
Gaussian distribution, (b2) a Weibull distribution, and (c2) a gamma distribution; the (HH, HV)
polarization based on omnibus test statistic and K&I based on (a3) a generalized Gaussian
distribution, (b3) a Weibull distribution, and (c3) a gamma distribution; the (VV, VH) polarization
based on omnibus test statistic and K&I based on (a4) a generalized Gaussian distribution, (b4) a
Weibull distribution, and (c4) a gamma distribution.
Although the proposed method has a good performance in change detection and can be applied
in both single and dual polarization data, it still has some limitations. Firstly, the proposed method
can detect the water changes in two dimensions, but it cannot detect the water‐level changes. To solve

Sensors 2020, 20, 1508 17 of 20
this problem, external data are applied to improve the change detection accuracy. Secondly, the
proposed method can obtain the unchanged and changed information, but it cannot obtain the types
of land‐cover changes. To solve this problem, classification techniques can be combined with our
method to get the types of land‐cover changes. Thirdly, multi‐temporal time‐series observations are
ideal for detecting changes accurately. Because of limited data, our research only uses the bi‐temporal
PolSAR data to detect the changes in urban facility and inundation. The application of the proposed
method based on time‐series observations from different sensors (e.g., Sentinel‐1) will be explored in
further work.
(a) (b)
(c) (d)
Figure 14. Quantitative evaluation of results from different polarizations: (a) false alarm rate; (b) total
errors; (c) overall accuracy; (d) Kappa coefficient.
6. Conclusions
In this paper, we showed that the combination of an omnibus test statistic using a covariance
matrix and the K&I method based on Weibull or gamma distribution can improve the performance
of change detection for multi‐temporal PolSAR images. The proposed method for generating DI maps
is appropriate for PolSAR images, and it can obtain an accurate intermediate result. Due to the solid
mathematical fundamentals of Bayesian theory, the traditional K&I method shows better
performance than the other methods. This illustrates that the threshold selection method based on
K&I is stable and effective in change detection. After analyzing three typical land covers, i.e., water,
vegetation, and urban areas, in the difference image, we find that the variable in the difference image
more likely follows the Weibull or gamma distribution. Thus, we proposed the K&I change detection
algorithm based on Weibull or gamma distribution. Moreover, the proposed method can be applied
to single/dual/quad polarization data, while the different polarization data with different
distributions can generate stable and precise change detection results. Based on the proposed method,
the changes caused by urban development and inundation between 2015 and 2016 in Wuhan, China,
were detected accurately. Over the East Lake and Yanxi Lake regions where the reference map was
available, our proposed method obtained the best performance with FA of 1.59% and 1.80%, TE of
2.73% and 4.33%, OA of 97.27% and 95.67%, and Kappa of 0.6486 and 0.6275, respectively. These
confirmed that the proposed method is superior to the other methods, and it is effective in detecting
changes caused by urbanization and inundation.

Sensors 2020, 20, 1508 18 of 20
Author Contributions: J.Z. identified the difficulties addressed in this research, proposed the new approach,
and wrote and revised the paper. Y.C. completed the partial equation derivation. J.Y. provided the multi‐
temporal Radarsat‐2 data. Y.F.N helped to preprocess the datasets. Z. L. revised the paper and gave some useful
advice. P.X.L. gave some key advice. All authors contributed to the writing of this manuscript.
Funding: This research was funded by the Natural Science Foundation of China (NSFC) (grant numbers
41901286, 61971318, 41771377, 41901284), the Key Laboratory of Surveying and Mapping Science and Geospatial
Information Technology of Ministry of Natural Resources (grant number 201906), the Open Research Fund of
Jiangsu Key Laboratory of Resources and Environmental Information Engineering, CUMT (grant number
JS201909), the Joint Fund of the Ministry of Education (grant number 6141A02022420), and the PhD Research Startup Fund of East China University of Technology (grant number DHBK2019197).
Acknowledgments: The authors would like to thank the Hubei Province Postdoctoral Science and Technology
Preferred Project for funding his study. The numerical calculations in this paper were completed on the
supercomputing system in the Supercomputing Center of Wuhan University. The authors would also like to
thank the anonymous reviewers for the useful advice.
Conflicts of Interest: The authors declare no conflicts of interest.
References
1. Lu, D.; Mausel, P.; Brondizio, E.; Moran, E. Change detection techniques. Int. J. Remote Sens. 2004, 25, 2365–
2401.
2. Liu, W.; Yang, J.; Zhao, J.; Shi, H.; Yang, L. An Unsupervised Change Detection Method Using Time‐Series
of PolSAR Images from Radarsat‐2 and GaoFen‐3. Sensors 2018, 18, doi:10.3390/s18020559.
3. Ban, Y.; Yousif, O.A. Multitemporal spaceborne SAR data for urban change detection in China. IEEE J. Sel.
Top. Appl. Earth Observ. Remote Sens. 2012, 5, 1087–1094.
4. Dominguez, E.M.; Magnard, C.; Meier, E.; Small, D.; Schaepman, M.E.; Henke, D.A. Back‐Projection
Tomographic Framework for VHR SAR Image Change Detection. IEEE Trans. Geosci. Remote Sens. 2019, 57,
4470–4484, doi:10.1109/tgrs.2019.2891308.
5. Zhao, L.; Yang, J.; Li, P.; Zhang, L. Characteristics analysis and classification of crop harvest patterns by
exploiting high‐frequency multipolarization SAR data. IEEE J. Sel. Top. Appl. Earth Observ. Remote Sens.
2014, 7, 3773–3783.
6. Shi, H.T.; Yang, J.; Li, P.X.; Zhao, L.L.; Liu, Z.Q.; Zhao, J.Q.; Liu, W.S. Soil moisture estimation using two‐
component decomposition and a hybrid X‐Bragg/Fresnel scattering model. J. Hydrol. 2019, 574, 646–659,
doi:10.1016/j.jhydrol.2019.04.049.
7. Lu, Z.; Dzurisin, D. InSAR imaging of Aleutian volcanoes. In InSAR Imaging of Aleutian Volcanoes, Springer:
Berlin, Germany, 2014; pp. 87–345.
8. Zhao, J.; Yang, J.; Lu, Z.; Li, P.; Liu, W.; Yang, L. A Novel Method of Change Detection in Bi‐Temporal
PolSAR Data Using a Joint‐Classification Classifier Based on a Similarity Measure. Int. J. Remote Sens. 2017,
9, 846.
9. Zhao, L.; Yang, J.; Li, P.; Zhang, L. Seasonal inundation monitoring and vegetation pattern mapping of the
Erguna floodplain by means of a RADARSAT‐2 fully polarimetric time series. Remote Sens. Environ. 2014,
152, 426–440.
10. Mohammadimanesh, F.; Salehi, B.; Mahdianpari, M.; Brisco, B.; Gill, E. Full and Simulated Compact
Polarimetry SAR Responses to Canadian Wetlands: Separability Analysis and Classification. Int. J. Remote
Sens. 2019, 11, 516, doi:10.3390/rs11050516.
11. Akbari, V.; Anfinsen, S.N.; Doulgeris, A.P.; Eltoft, T.; Moser, G.; Serpico, S.B. Polarimetric SAR Change
Detection With the Complex Hotelling–Lawley Trace Statistic. IEEE Trans. Geosci. Remote Sens. 2016, 54,
3953–3966.
12. Zhao, J.; Yang, J.; Lu, Z.; Li, P.; Liu, W.; Yang, L. An Unsupervised Method of Change Detection in Multi‐
Temporal PolSAR Data Using a Test Statistic and an Improved K&I Algorithm. Applied Sciences 2017, 7,
1297.
13. Inglada, J.; Giros, A. On the possibility of automatic multisensor image registration. IEEE Trans. Geosci.
Remote Sens. 2004, 42, 2104–2120.

Sensors 2020, 20, 1508 19 of 20
14. Dekker, R.J. Speckle filtering in satellite SAR change detection imagery. Int. J. Remote Sens. 1998, 19, 1133–
1146, doi:10.1080/014311698215649.
15. Hussain, M.; Chen, D.; Cheng, A.; Wei, H.; Stanley, D. Change detection from remotely sensed images:
From pixel‐based to object‐based approaches. ISPRS J. Photogramm. Remote Sens. 2013, 80, 91–106.
16. Yu, L.; Martinis, S.; Plank, S.; Ludwig, R. An automatic change detection approach for rapid flood mapping
in Sentinel‐1 SAR data. International Journal of Applied Earth Observation and Geoinformation 2018, 73, 123–
135.
17. Alonso‐González, A.; López‐Martínez, C.; Salembier, P. PolSAR time series processing with binary
partition trees. IEEE Trans. Geosci. Remote Sens. 2014, 52, 3553–3567.
18. Yang, W.; Yang, X.; Yan, T.; Song, H.; Xia, G.‐S. Region‐Based Change Detection for Polarimetric SAR
Images Using Wishart Mixture Models. IEEE Trans. Geosci. Remote Sens. 2016, 54, 6746–6756.
19. Gong, M.; Cao, Y.; Wu, Q. A neighborhood‐based ratio approach for change detection in SAR images. IEEE
Geosci. Remote Sens. Lett. 2012, 9, 307–311.
20. Sumaiya, M.; Kumari, R.S.S. Logarithmic Mean‐Based Thresholding for SAR Image Change Detection.
IEEE Geosci. Remote Sens. Lett. 2016, 13, 1726–1728.
21. Cui, B.; Zhang, Y.; Yan, L.; Wei, J.; Huang, Q. A SAR change detection method based on the consistency of
single‐pixel difference and neighbourhood difference. IEEE Geosci. Remote Sens. Lett. 2019, 10, 488–495.
22. Gong, M.G.; Zhou, Z.Q.; Ma, J.J. Change Detection in Synthetic Aperture Radar Images based on Image
Fusion and Fuzzy Clustering. IEEE Trans. Image Process. 2012, 21, 2141–2151, doi:10.1109/tip.2011.2170702.
23. Reiche, J.; Verbesselt, J.; Hoekman, D.; Herold, M. Fusing Landsat and SAR time series to detect
deforestation in the tropics. Remote Sens. Environ. 2015, 156, 276–293, doi:10.1016/j.rse.2014.10.001.
24. Carincotte, C.; Derrode, S.; Bourennane, S. Unsupervised change detection on SAR images using fuzzy
hidden Markov chains. IEEE Trans. Geosci. Remote Sens. 2006, 44, 432–441.
25. Martinis, S.; Twele, A.; Voigt, S. Unsupervised Extraction of Flood‐Induced Backscatter Changes in SAR
Data Using Markov Image Modeling on Irregular Graphs. IEEE Trans. Geosci. Remote Sens. 2011, 49, 251–
263, doi:10.1109/tgrs.2010.2052816.
26. Yousif, O.; Ban, Y. Improving urban change detection from multitemporal SAR images using PCA‐NLM.
IEEE Trans. Geosci. Remote Sens. 2013, 51, 2032–2041.
27. Inglada, J.; Mercier, G. A new statistical similarity measure for change detection in multitemporal SAR
images and its extension to multiscale change analysis. IEEE Trans. Geosci. Remote Sens. 2007, 45, 1432–1445,
doi:10.1109/tgrs.2007.893568.
28. Muro, J.; Strauch, A.; Fitoka, E.; Tompoulidou, M.; Thonfeld, F. Mapping wetland dynamics with SAR‐
based change detection in the cloud. IEEE Geosci. Remote Sens. Lett. 2019, 16, 1536–1539.
29. Canty, M.J.; Nielsen, A.A.; Conradsen, K.; Skriver, H. Statistical Analysis of Changes in Sentinel‐1 Time
Series on the Google Earth Engine. Int. J. Remote Sens. 2020, 12, 46.
30. Anfinsen, S.N.; Doulgeris, A.P.; Eltoft, T. Estimation of the equivalent number of looks in polarimetric
synthetic aperture radar imagery. IEEE Trans. Geosci. Remote Sens. 2009, 47, 3795–3809.
31. Conradsen, K.; Nielsen, A.A.; Sehou, J.; Skriver, H. A test statistic in the complex Wishart distribution and
its application to change detection in polarimetric SAR data. IEEE Trans. Geosci. Remote Sens. 2003, 41, 4–19,
doi:10.1109/tgrs.2002.808066.
32. Lê, T.T.; Atto, A.M.; Trouvé, E.; Solikhin, A.; Pinel, V. Change detection matrix for multitemporal filtering
and change analysis of SAR and PolSAR image time series. ISPRS J. Photogramm. Remote Sens. 2015, 107,
64–76.
33. Schmitt, A.; Wendleder, A.; Hinz, S. The Kennaugh element framework for multi‐scale, multi‐polarized,
multi‐temporal and multi‐frequency SAR image preparation. ISPRS J. Photogramm. Remote Sens. 2015, 102,
122–139.
34. Muro, J.; Canty, M.; Conradsen, K.; Hüttich, C.; Nielsen, A.A.; Skriver, H.; Remy, F.; Strauch, A.; Thonfeld,
F.; Menz, G. Short‐term change detection in wetlands using Sentinel‐1 time series. Int. J. Remote Sens. 2016,
8, 795.
35. Conradsen, K.; Nielsen, A.A.; Skriver, H. Determining the points of change in time series of polarimetric
SAR data. IEEE Trans. Geosci. Remote Sens. 2016, 54, 3007–3024.
36. Kapur, J.N.; Sahoo, P.K.; Wong, A.K. A new method for gray‐level picture thresholding using the entropy
of the histogram. Comput. Vision Image Understanding 1985, 29, 273–285.
Sensors 2020, 20, 1508 20 of 20
37. Jung, C.H.; Song, W.Y.; Rho, S.H.; Kim, J.; Park, J.T.; Kwag, Y.K. Double‐step fast CFAR scheme for multiple
target detection in high resolution SAR images. In Proceedings of IEEE Radar Conference, Washington,
DC, USA, 10‐14 May 2010; pp. 1172‐1175.
38. Kittler, J.; Illingworth, J. Minimum error thresholding. Pattern Recognit. 1986, 19, 41–47.
39. Bazi, Y.; Bruzzone, L.; Melgani, F. An unsupervised approach based on the generalized Gaussian model to
automatic change detection in multitemporal SAR images. IEEE Trans. Geosci. Remote Sens. 2005, 43, 874–
887, doi:10.1109/tgrs.2004.842441.
40. Moser, G.; Serpico, S.B. Generalized minimum‐error thresholding for unsupervised change detection from
SAR amplitude imagery. IEEE Trans. Geosci. Remote Sens. 2006, 44, 2972–2982.
41. Chitroub, S.; Houacine, A.; Sansal, B. Statistical characterisation and modelling of SAR images. Signal
Process. 2002, 82, 69–92.
42. Qin, X.; Zhou, S.; Zou, H. SAR image segmentation via hierarchical region merging and edge evolving with
generalized gamma distribution. IEEE Geosci. Remote Sens. Lett. 2014, 11, 1742–1746.
43. Bucciarelli, T.; Lombardo, P.; Oliver, C.; Perrotta, M. A compound Weibull model for SAR texture analysis.
International Geoscience and Remote Sensing Symposium, Quantitative Remote Sensing for Science and
Applications, Firenze, Italy, 10‐14 July 1995; pp. 181–183.
44. Lu, Z.; Wicks Jr, C. Characterizing 6 August 2007 Crandall Canyon mine collapse from ALOS PALSAR
InSAR. Geomatics, Natural Hazards and Risk 2010, 1, 85–93.
45. Qin, X.; Zou, H.; Zhou, S.; Ji, K. Region‐based classification of SAR images using Kullback–Leibler distance
between generalized gamma distributions. IEEE Geosci. Remote Sens. Lett. 2015, 12, 1655–1659.
46. Gao, G.; Ouyang, K.; Luo, Y.; Liang, S.; Zhou, S. Scheme of parameter estimation for generalized gamma
distribution and its application to ship detection in SAR images. IEEE Trans. Geosci. Remote Sens. 2016, 55,
1812–1832.
47. Lee, J.‐S.; Pottier, E. Polarimetric radar imaging: from basics to applications; CRC press: Boca Raton, FL, USA, 2009.
© 2020 by the authors. Licensee MDPI, Basel, Switzerland. This article is an open access
article distributed under the terms and conditions of the Creative Commons Attribution
(CC BY) license (http://creativecommons.org/licenses/by/4.0/).