a novel statistical analysis method to improve the detection of
TRANSCRIPT
ORIGINAL RESEARCH Open Access
A novel statistical analysis method toimprove the detection of hepatic foci of111In-octreotide in SPECT/CT imagingTobias Magnander1,5, E. Wikberg5, J. Svensson2, P. Gjertsson3, B. Wängberg4, M. Båth1,5 and Peter Bernhardt1,5*
* Correspondence: [email protected] Magnander is the firstauthor.1Department of Radiation Physics,Institute of Clinical Sciences atSahlgrenska Academy, University ofGothenburg, Gothenburg, Sweden5Department of Medical Physicsand Biomedical Engineering,Sahlgrenska University Hospital,Gothenburg, SwedenFull list of author information isavailable at the end of the article
Abstract
Background: Low uptake ratios, high noise, poor resolution, and low contrast allcombine to make the detection of neuroendocrine liver tumours by 111In-octreotidesingle photon emission tomography (SPECT) imaging a challenge. The aim of thisstudy was to develop a segmentation analysis method that could improve theaccuracy of hepatic neuroendocrine tumour detection.
Methods: Our novel segmentation was benchmarked by a retrospective analysis ofpatients categorized as either 111In-octreotide positive (111In-octreotide(+)) or 111In-octreotide negative (111In-octreotide(−)) for liver tumours. Following a 3-year follow-up period, involving multiple imaging modalities, we further segregated 111In-octreotide-negative patients into two groups: one with no confirmed liver tumours(111In-octreotide(−)/radtech(−)) and the other, now diagnosed with liver tumours(111In-octreotide(−)/radtech(+)). We retrospectively applied our segmentation analysisto see if it could have detected these previously missed tumours using 111In-octreotide. Our methodology subdivided the liver and determined normalizednumbers of uptake foci (nNUF), at various threshold values, using a connected-component labelling algorithm. Plots of nNUF against the threshold index (ThI) weregenerated. ThI was defined as follows: ThI = (cmax − cthr)/cmax, where cmax is themaximal threshold value for obtaining at least one, two voxel sized, uptake focus; cthris the voxel threshold value. The maximal divergence between the nNUF values for111In-octreotide(−)/radtech(−), and 111In-octreotide(+) livers, was used as the optimalnNUF value for tumour detection. We also corrected for any influence of the meanactivity concentration on ThI. The nNUF versus ThI method (nNUFTI) was then usedto reanalyze the 111In-octreotide(−)/radtech(−) and 111In-octreotide(−)/radtech(+)groups.
Results: Of a total of 53 111In-octreotide(−) patients, 40 were categorized as 111In-octreotide(−)/radtech(−) and 13 as 111In-octreotide(−)/radtech(+) group. Optimalseparation of the nNUF values for 111In-octreotide(−)/radtech(−) and 111In-octreotide(+) groups was defined at the nNUF value of 0.25, to the right of the bellshaped nNUFTI curve. ThIs at this nNUF value were dependent on the mean activityconcentration and therefore normalized to generate nThI; a significant difference innThI values was found between the 111In-octreotide(−)/radtech(−) and the 111In-octreotide(−)/radtech(+) groups (P < 0.01). As a result, four of the 13 111In-octreotide(−)/radtech(+) livers were redesigned as 111In-octreotide(+).(Continued on next page)
© 2016 Magnander et al. Open Access This article is distributed under the terms of the Creative Commons Attribution 4.0International License (http://creativecommons.org/licenses/by/4.0/), which permits unrestricted use, distribution, and reproduction inany medium, provided you give appropriate credit to the original author(s) and the source, provide a link to the Creative Commonslicense, and indicate if changes were made.
Magnander et al. EJNMMI Physics (2016) 3:1 DOI 10.1186/s40658-016-0137-4
(Continued from previous page)
Conclusions: The nNUFTI method has the potential to improve the diagnosis of livertumours using 111In-octreotide.
Keywords: SPECT/CT, 111In-octreotide, Diagnosis, Liver tumours, Neuroendocrine
BackgroundTimely and precise detection of metastatic colonies in the liver of a cancer patient is
crucial if we are to make the best treatment choices [1]. Metastatic disease may indicate
that a different curative regimen, or perhaps a palliative option, is now the best course
of action [2–5]. Unfortunately, our ability to make these decisions is hampered by the
difficulty that we face in detecting small masses, with low contrast and noise [6].
Single photon emission tomography (SPECT), using a radiolabelled mimic of somato-
statin, 111In-octreotide, has become the established methodology with which to image
somatostatin receptor (sstr)-positive tumours [7, 8] in patients with neuroendocrine tu-
mours. Together with morphological imaging techniques, such as computed tomog-
raphy (CT) and magnetic resonance imaging (MRI), it has become an important tool
for tumour visualization, staging, and evaluation of somatostatin receptor status [9]. In
addition, one of the major eligibility criteria for patients undergoing therapy with either177Lu- or 90Y-labelled somatostatin analogues is that their tumour should bind more111In-octreotide than normal liver [10–12]. The purpose of this study was to develop a
complementary method that could help the physician in reaching their diagnosis of
sstr-tumour involvement using SPECT images of the liver.
Despite significant observer variability, nuclear medicine still, to a large extent, de-
pends on the subjective decision-making of a single physician [13, 14]. Unfortunately,
quantitative analyses that are simple to use, and easy to understand for the observer,
are rarely implemented in this field. Nevertheless, recent success with computer-
assisted diagnosis in the detection of bone metastases [15, 16] may prompt a rethink
for neuroendocrine tumours. A key aspect of these systems is their necessity for a ‘li-
brary’ of patient data; in essence, the algorithm needs to be taught how to recognize
the tumour. With this input, it should be possible to develop more straightforward, and
objective methodologies, with which to guide decision-making.
Due to the limited spatial resolution of the gamma camera, small tumours, with only
a modest uptake of the radiolabel, will fall beneath the limit of detection. A second
problem that limits resolution is noise in the system. Voxel clustering may give a false
impression of a mass that has bound the radiolabel, i.e. a false positive signal is gener-
ated. The inherent loss in specificity that this generates further diminishes the chances
of authentically locating a metastatic focus. Our experimental methodology is based on
a statistical approach with the assumption that the distributions of uptake foci differ
between healthy livers and livers with tumour involvements. Starting with the max-
imum voxel value within the liver, and successively calculating the number of seg-
mented uptake foci at decreasing threshold values, a graph of the number of uptake
foci, versus threshold value, is obtained. We will, in this study, demonstrate that the
number of disjointed segmented uptake foci, as a function of decreasing threshold
value for normal liver (with no true uptake foci), can be displayed as a symmetrical
bell-shaped curve. When authentic foci are present, this curve is shifted and/or
Magnander et al. EJNMMI Physics (2016) 3:1 Page 2 of 12

compressed towards decreased threshold values. This shift can be exploited to discrim-
inate between authentic and artifactual foci. We then apply this method in a retrospect-
ive analysis of 53 randomly selected patients, previously diagnosed by 111In-octreotide
SPECT to be clear of liver metastases. Within this group are a number of patients that,
during a 3-year follow-up, were confirmed by other methods to display liver metastases.
For these patients, we used our experimental methodology to address whether it would
have helped the clinician to reach a positive 111In-octreotide diagnosis for liver involve-
ment, rather than the negative diagnoses that were reported.
MethodsPatient cohort
This retrospective study was approved by the Regional Ethical Review Board in
Gothenburg and performed in accordance with the Declaration of Helsinki and na-
tional regulations. For evaluation of the segmentation analysis method, 80 111In-octreo-
tide-negative (111In-octreotide(−)) liver patients were retrospectively selected from the
examination years 2004–2011 (Fig. 1). For these years, the patient data were arranged
in alphabetical order by the patient name, and a consecutive alphabetical selection was
applied. In addition, 10 111In-octreotide-positive (111In-octreotide(+)) liver patients
were recruited based on tumour burden; for five, this was high; for the remaining five
patients, their tumour burden was designated as minor by a qualified observer. The111In-octreotide(+) livers were chosen to demonstrate the robustness of our method,
and were critically important in helping us to benchmark the parameters used in our
subsequent analyses. As our method is designed to guide the observer towards im-
proved tumour detection, we retrospectively followed up the 111In-octreotide(−) patientcohort over 3 years, using a combination of radiological techniques (radtech), MRI,
SPECT, positron emission tomography (PET)/CT, ultrasound, and CT. This screening
Fig. 1 Patient flow of the 111In-octreotide investigations
Magnander et al. EJNMMI Physics (2016) 3:1 Page 3 of 12
was used to separate the 111In-octreotide(−) patients into two groups: one with no con-
firmed liver tumours (111In-octreotide(−)/radtech(−)) and one with confirmed liver tu-
mours (111In-octreotide(−)/radtech(+)).
Segmentation of uptake foci
Automatic segmentation of uptake foci in liver tissue at different voxel threshold values
is a methodology developed for the analysis of SPECT/CT data using 111In-octreotide.
Raw image data (128 × 128, 120 projections) were reconstructed according to the stand-
ard clinical protocol, i.e. using ordered subset expectation maximum (OSEM) recon-
struction, with two iterations and ten subsets. In a departure to this protocol, the
resulting volume was then unfiltered; the justification for this was to improve our
chances of finding small lesions. The liver volume of interest (VOI) was segmented
from SPECT, but in some SPECT investigation, the high uptake in surrounding tissues
hampered the automatic segmentation. In these situations, the segmentations were per-
formed in the CTs. The segmentations performed from the SPECT, or CT, used either
an isosurface, a region growing, or a graphics processing unit (GPU) accelerated level
set algorithm. Manual editing was used to refine the segmentation. The liver VOI was
then thresholded at values between 0 and the maximum voxel value. At each threshold
value, the number of uptake foci (NUF), i.e. the number of connected regions unlinked
to other regions, was determined using a technique known as connective-component
labelling [17]. Connective-component labelling is an algorithm where subsets of con-
nected components (here, regions of connected voxels) are uniquely labelled, enabling
calculation of the number of subsets, i.e. the NUF in our method.
The normalized number of uptake foci versus threshold index (nNUFTI) method
The number of unlinked uptake foci was calculated at each threshold value, generating
a distribution of NUF versus a threshold index (ThI):
ThI ¼ Cmax−Cthr
Cmaxð1Þ
where Cmax is the maximal voxel value in the VOI and Cthr is the voxel threshold
value. The NUF can therefore be described as a function of ThI, ranging from 0 to 1.
By normalizing the NUF (nNUF) to the maximal NUF in a liver VOI, it is possible to
display and then compare individual 111In-octreotide SPECT data (by comparing nNUF
versus ThI (nNUFTI)).
Creation of a visualization tool for the observer
A parallel aim was to integrate the nNUFTI method with a visualization tool for the
observer. This was performed by incorporating a slider along the ThI-axis, which pro-
vides a real-time visual representation of the corresponding uptake foci in the 3D liver
VOI. Unconnected uptake foci were assigned different colours, from a palette of 256.
This enabled the observer to pinpoint suspicious lesions by closely studying their noise
structure and the clustering of uptake foci. Additionally, the displayed 3D volume of
disconnected uptake foci can be analysed contemporaneously with CT and MRI data.
The nNUFTI programme was written in c++ and implemented into PhONSAi (the
medical Physics, Oncology and Nuclear medicine image research platform at
Magnander et al. EJNMMI Physics (2016) 3:1 Page 4 of 12
Sahlgrenska Academy). Using the PhONSAi platform, the segmentation of the liver, to-
gether with CT data processing, was performed in parallel on the graphic card (CUDA)
to obtain a rapid segmentation performance. An experienced clinical observer oversaw
the graphical layout of the nNUFTI programme.
Determination of optimal value for the normalized number of uptake foci
To determine the optimal value of the nNUF that allows the greatest separation of ThI
between the 111In-octreotide(−)/radtech(−), and 111In-octreotide(+) groups, the t score
in Student’s t test was used. The nNUF with the highest t score was used to determine
the ThI values in further 111In-octreotide analyses using the nNUFTI method.
Analysis of the 111In-octreotide-negative patients with the nNUFTI method
Using the nNUFTI method, the ThI was determined for all patients using the value of
nNUF as previously described. For the 111In-octreotide(−)/radtech(−) group, it was con-firmed that ThI was dependent on the mean activity concentration; therefore, ThI was
normalized (nThI) by the function that best describes this dependency. Comparison of
the nThI for the 111In-octreotide(−)/radtech(−) and 111In-octreotide(−)/radtech(+)groups was conducted by Student’s t test. P < 0.05 was considered significant. Lastly,
the positive predictive value (PPV) for the individual nTHI values in the 111In-octreo-
tide(−)/radtech(+) group was calculated.
ResultsOf the first 80 selected 111In-octreotide(−) patients, 27 had to be excluded due to in-
complete follow-up data. Forty of the remaining 53 patients were diagnosed as having
no sign of liver tumours within their follow-up time. These were designated the 111In-
octreotide(−)/radtech(−) group. The remaining 13 patients had their liver tumours de-
tected by either CT or ultra sound, designated as the 111In-octreotide(−)/radtech(+)group.
The nNUFTI programme, for the quantification of disjointed NUF, performed well in
consistently quantifying, and visualizing, NUF. Visualization analyses for our two pa-
tient groups, 111In-octreotide(−)/radtech(−) and 111In-octreotide(+), revealed a qualita-
tive difference in the representation of their uptake foci on the graphical interface.
Figure 2 shows a representative 111In-octreotide(−)/radtech(−) liver, with several foci
simultaneously appearing on the screen. Initially, the nNUF increases continuously, in
parallel with ThI. However, at a particular ThI threshold, the nNUF then decreases as
the shrinkage of the inter-focus distance causes foci to merge (Fig. 2d).
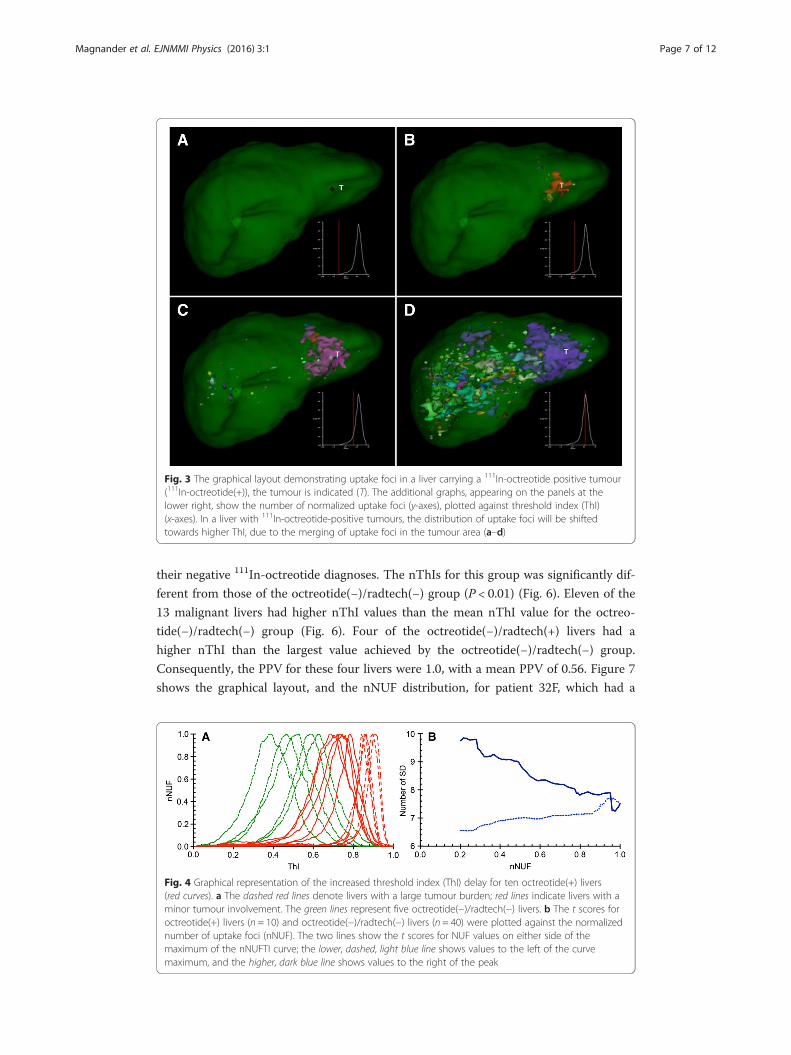
In a patient confirmed to have liver tumours, and displaying a higher uptake of 111In-
octreotide in the tumour versus normal liver tissue, the nNUF remained low, despite a
prolonged increase in ThI (Figs. 2 and 3). The high radiolabel intensities in the tumour
volume will result in those voxels merging into a single uptake focus, or a few uptake foci,
around the tumour volume (A–B). No uptake foci aligned to ‘noise’ will appear at this
level of ThI. As the maximal number of uptake foci are detected, noise correlated foci
begin to appear, but to a lower degree than those in a healthy liver (Figs. 2d and 3d).
The nNUF versus ThI values were then plotted for five selected octreotide(−)/rad-tech(−) livers and ten octreotide(+) livers (Fig. 4a). For the five patients with substantial
Magnander et al. EJNMMI Physics (2016) 3:1 Page 5 of 12

tumour involvement, there was a pronounced compression of the nNUFTI curve, in
favour of increased ThI values. The remaining five, octreotide(+) livers, represent pa-
tients diagnosed with minimal detectable tumour involvement. The nNUFTI data for
these patients were used to define an optimal ThI for tumour detection, i.e. the optimal
separation between the ThI values for octreotide(−)/radtech(−) and octreotide(+) livers.
It was demonstrated that the highest t scores were obtained using a threshold on the
right side of the maximal nNUF value (Fig. 4b). The t score increased until a nNUF
value of approximately 0.25. Similar results were obtained when the analysis of the
octreotide(+) livers was restricted to five livers with either minor or significant tumour
involvement (data not shown). The nNUF = 0.25 value, at the right side of the distribu-
tion curve, was used in further analyses of tumour detection in individual patients.
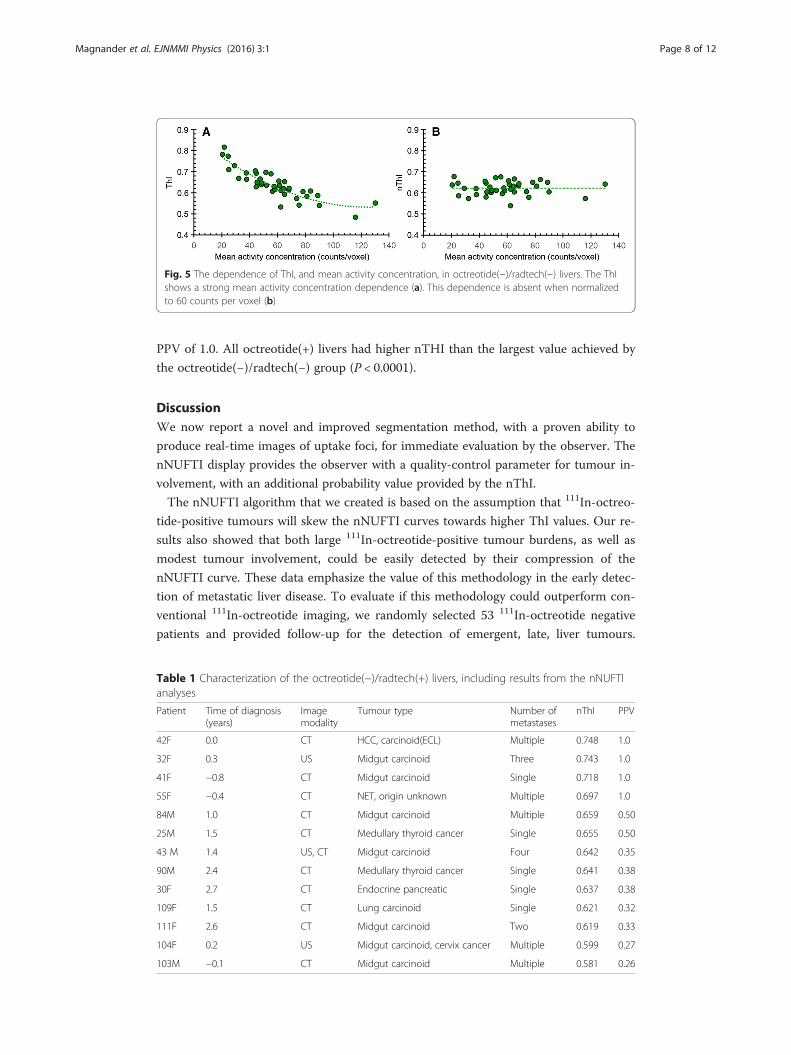
For the octreotide(−)/radtech(−) livers, it was noted that ThI decreased with increas-
ing mean activity concentration (Fig. 5a). As the parameter setting for a second-degree
polynomial function best described this relationship (r2 = 0.80), we used this function to
correct ThI to a mean activity concentration of 60 counts per voxel (Fig. 5b). This gen-
erated a normalized activity concentration ThI (nThI). The nThI had a mean and
standard deviation of 0.623 and 0.032, respectively.
A total of 13 patients in the 53 111In-octreotide patient cohort were diagnosed with
liver tumours during their 3-year follow-up (Table 1). The tumour involvement was di-
agnosed either with CT or ultrasound and arose from 0.8 years prior, to 2.6 years post,
Fig. 2 An example of the graphical layout, showing the distribution of uptake foci in a liver with noconfirmed metastases (octreotide(−)/radtech(−)). The observer can freely rotate the image in all planes,allowing the precise interrogation of focal uptake. The entire liver (indicated by the transparent green colour)is segmented. The additional graphs, appearing at the lower right of each panel, show nNUF (y-axis),plotted against threshold index (ThI) (x-axis). Radiolabelled foci are shown coloured. In panel a, the ThI is setfor the inspection of high intensity areas. As the ThI is increased (panels b, c, and d), more foci arecaptured, until foci begin to merge
Magnander et al. EJNMMI Physics (2016) 3:1 Page 6 of 12
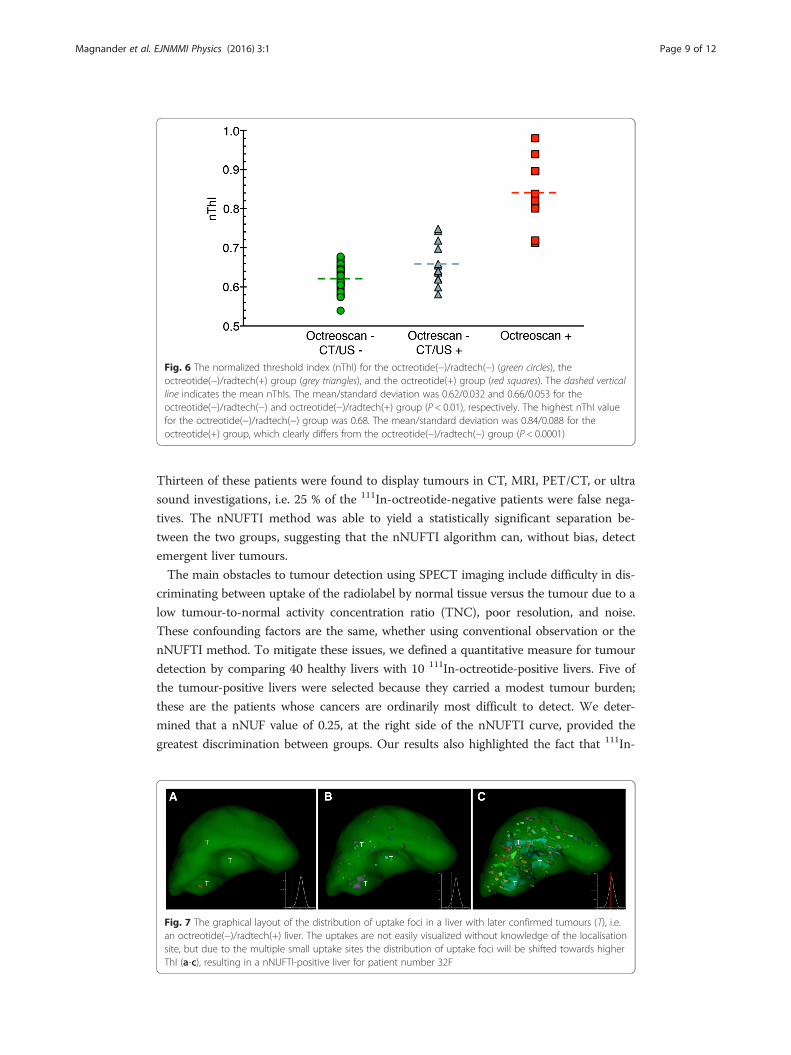
their negative 111In-octreotide diagnoses. The nThIs for this group was significantly dif-
ferent from those of the octreotide(−)/radtech(−) group (P < 0.01) (Fig. 6). Eleven of the
13 malignant livers had higher nThI values than the mean nThI value for the octreo-
tide(−)/radtech(−) group (Fig. 6). Four of the octreotide(−)/radtech(+) livers had a
higher nThI than the largest value achieved by the octreotide(−)/radtech(−) group.
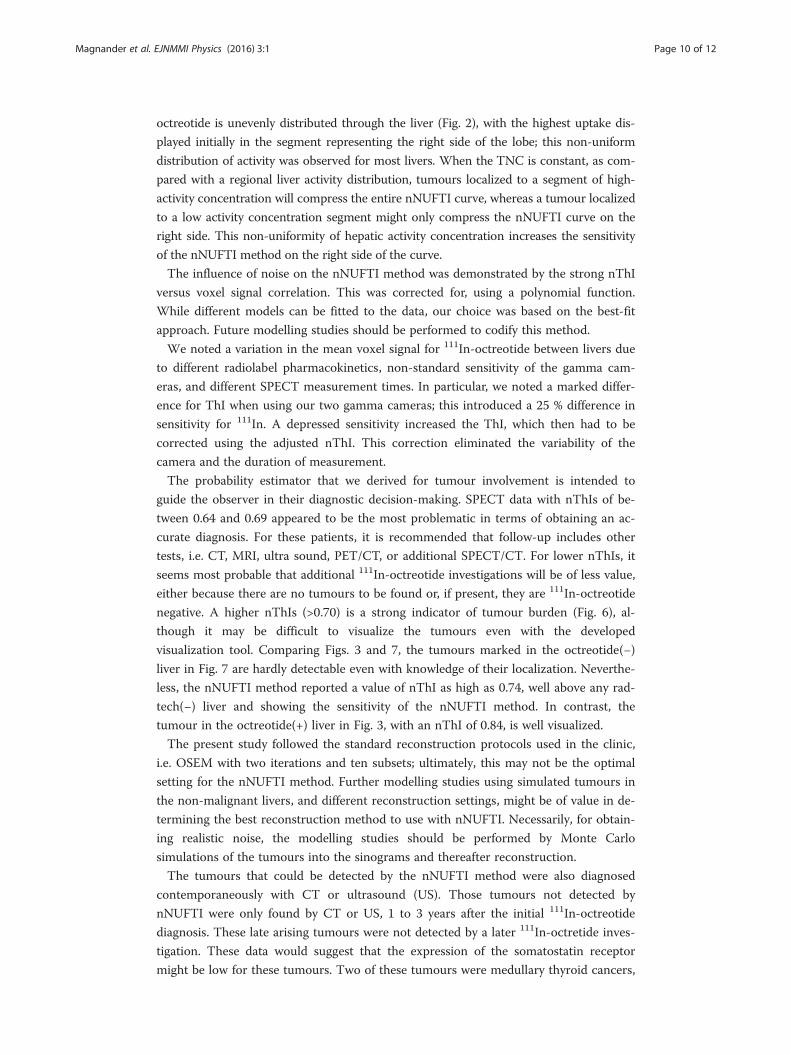
Consequently, the PPV for these four livers were 1.0, with a mean PPV of 0.56. Figure 7
shows the graphical layout, and the nNUF distribution, for patient 32F, which had a
Fig. 4 Graphical representation of the increased threshold index (ThI) delay for ten octreotide(+) livers(red curves). a The dashed red lines denote livers with a large tumour burden; red lines indicate livers with aminor tumour involvement. The green lines represent five octreotide(−)/radtech(−) livers. b The t scores foroctreotide(+) livers (n = 10) and octreotide(−)/radtech(−) livers (n = 40) were plotted against the normalizednumber of uptake foci (nNUF). The two lines show the t scores for NUF values on either side of themaximum of the nNUFTI curve; the lower, dashed, light blue line shows values to the left of the curvemaximum, and the higher, dark blue line shows values to the right of the peak
Fig. 3 The graphical layout demonstrating uptake foci in a liver carrying a 111In-octreotide positive tumour(111In-octreotide(+)), the tumour is indicated (T). The additional graphs, appearing on the panels at thelower right, show the number of normalized uptake foci (y-axes), plotted against threshold index (ThI)(x-axes). In a liver with 111In-octreotide-positive tumours, the distribution of uptake foci will be shiftedtowards higher ThI, due to the merging of uptake foci in the tumour area (a–d)
Magnander et al. EJNMMI Physics (2016) 3:1 Page 7 of 12
PPV of 1.0. All octreotide(+) livers had higher nTHI than the largest value achieved by
the octreotide(−)/radtech(−) group (P < 0.0001).
DiscussionWe now report a novel and improved segmentation method, with a proven ability to
produce real-time images of uptake foci, for immediate evaluation by the observer. The
nNUFTI display provides the observer with a quality-control parameter for tumour in-
volvement, with an additional probability value provided by the nThI.
The nNUFTI algorithm that we created is based on the assumption that 111In-octreo-
tide-positive tumours will skew the nNUFTI curves towards higher ThI values. Our re-
sults also showed that both large 111In-octreotide-positive tumour burdens, as well as
modest tumour involvement, could be easily detected by their compression of the
nNUFTI curve. These data emphasize the value of this methodology in the early detec-
tion of metastatic liver disease. To evaluate if this methodology could outperform con-
ventional 111In-octreotide imaging, we randomly selected 53 111In-octreotide negative
patients and provided follow-up for the detection of emergent, late, liver tumours.
Fig. 5 The dependence of ThI, and mean activity concentration, in octreotide(−)/radtech(−) livers. The ThIshows a strong mean activity concentration dependence (a). This dependence is absent when normalizedto 60 counts per voxel (b)
Table 1 Characterization of the octreotide(−)/radtech(+) livers, including results from the nNUFTIanalyses
Patient Time of diagnosis(years)
Imagemodality
Tumour type Number ofmetastases
nThI PPV
42F 0.0 CT HCC, carcinoid(ECL) Multiple 0.748 1.0
32F 0.3 US Midgut carcinoid Three 0.743 1.0
41F −0.8 CT Midgut carcinoid Single 0.718 1.0
55F −0.4 CT NET, origin unknown Multiple 0.697 1.0
84M 1.0 CT Midgut carcinoid Multiple 0.659 0.50
25M 1.5 CT Medullary thyroid cancer Single 0.655 0.50
43 M 1.4 US, CT Midgut carcinoid Four 0.642 0.35
90M 2.4 CT Medullary thyroid cancer Single 0.641 0.38
30F 2.7 CT Endocrine pancreatic Single 0.637 0.38
109F 1.5 CT Lung carcinoid Single 0.621 0.32
111F 2.6 CT Midgut carcinoid Two 0.619 0.33
104F 0.2 US Midgut carcinoid, cervix cancer Multiple 0.599 0.27
103M −0.1 CT Midgut carcinoid Multiple 0.581 0.26
Magnander et al. EJNMMI Physics (2016) 3:1 Page 8 of 12
Thirteen of these patients were found to display tumours in CT, MRI, PET/CT, or ultra
sound investigations, i.e. 25 % of the 111In-octreotide-negative patients were false nega-
tives. The nNUFTI method was able to yield a statistically significant separation be-
tween the two groups, suggesting that the nNUFTI algorithm can, without bias, detect
emergent liver tumours.
The main obstacles to tumour detection using SPECT imaging include difficulty in dis-
criminating between uptake of the radiolabel by normal tissue versus the tumour due to a
low tumour-to-normal activity concentration ratio (TNC), poor resolution, and noise.
These confounding factors are the same, whether using conventional observation or the
nNUFTI method. To mitigate these issues, we defined a quantitative measure for tumour
detection by comparing 40 healthy livers with 10 111In-octreotide-positive livers. Five of
the tumour-positive livers were selected because they carried a modest tumour burden;
these are the patients whose cancers are ordinarily most difficult to detect. We deter-
mined that a nNUF value of 0.25, at the right side of the nNUFTI curve, provided the
greatest discrimination between groups. Our results also highlighted the fact that 111In-
Fig. 6 The normalized threshold index (nThI) for the octreotide(−)/radtech(−) (green circles), theoctreotide(−)/radtech(+) group (grey triangles), and the octreotide(+) group (red squares). The dashed verticalline indicates the mean nThIs. The mean/standard deviation was 0.62/0.032 and 0.66/0.053 for theoctreotide(−)/radtech(−) and octreotide(−)/radtech(+) group (P < 0.01), respectively. The highest nThI valuefor the octreotide(−)/radtech(−) group was 0.68. The mean/standard deviation was 0.84/0.088 for theoctreotide(+) group, which clearly differs from the octreotide(−)/radtech(−) group (P < 0.0001)
Fig. 7 The graphical layout of the distribution of uptake foci in a liver with later confirmed tumours (T), i.e.an octreotide(−)/radtech(+) liver. The uptakes are not easily visualized without knowledge of the localisationsite, but due to the multiple small uptake sites the distribution of uptake foci will be shifted towards higherThI (a-c), resulting in a nNUFTI-positive liver for patient number 32F
Magnander et al. EJNMMI Physics (2016) 3:1 Page 9 of 12
octreotide is unevenly distributed through the liver (Fig. 2), with the highest uptake dis-
played initially in the segment representing the right side of the lobe; this non-uniform
distribution of activity was observed for most livers. When the TNC is constant, as com-
pared with a regional liver activity distribution, tumours localized to a segment of high-
activity concentration will compress the entire nNUFTI curve, whereas a tumour localized
to a low activity concentration segment might only compress the nNUFTI curve on the
right side. This non-uniformity of hepatic activity concentration increases the sensitivity
of the nNUFTI method on the right side of the curve.
The influence of noise on the nNUFTI method was demonstrated by the strong nThI
versus voxel signal correlation. This was corrected for, using a polynomial function.
While different models can be fitted to the data, our choice was based on the best-fit
approach. Future modelling studies should be performed to codify this method.
We noted a variation in the mean voxel signal for 111In-octreotide between livers due
to different radiolabel pharmacokinetics, non-standard sensitivity of the gamma cam-
eras, and different SPECT measurement times. In particular, we noted a marked differ-
ence for ThI when using our two gamma cameras; this introduced a 25 % difference in
sensitivity for 111In. A depressed sensitivity increased the ThI, which then had to be
corrected using the adjusted nThI. This correction eliminated the variability of the
camera and the duration of measurement.
The probability estimator that we derived for tumour involvement is intended to
guide the observer in their diagnostic decision-making. SPECT data with nThIs of be-
tween 0.64 and 0.69 appeared to be the most problematic in terms of obtaining an ac-
curate diagnosis. For these patients, it is recommended that follow-up includes other
tests, i.e. CT, MRI, ultra sound, PET/CT, or additional SPECT/CT. For lower nThIs, it
seems most probable that additional 111In-octreotide investigations will be of less value,
either because there are no tumours to be found or, if present, they are 111In-octreotide
negative. A higher nThIs (>0.70) is a strong indicator of tumour burden (Fig. 6), al-
though it may be difficult to visualize the tumours even with the developed
visualization tool. Comparing Figs. 3 and 7, the tumours marked in the octreotide(−)liver in Fig. 7 are hardly detectable even with knowledge of their localization. Neverthe-
less, the nNUFTI method reported a value of nThI as high as 0.74, well above any rad-
tech(−) liver and showing the sensitivity of the nNUFTI method. In contrast, the
tumour in the octreotide(+) liver in Fig. 3, with an nThI of 0.84, is well visualized.
The present study followed the standard reconstruction protocols used in the clinic,
i.e. OSEM with two iterations and ten subsets; ultimately, this may not be the optimal
setting for the nNUFTI method. Further modelling studies using simulated tumours in
the non-malignant livers, and different reconstruction settings, might be of value in de-
termining the best reconstruction method to use with nNUFTI. Necessarily, for obtain-
ing realistic noise, the modelling studies should be performed by Monte Carlo
simulations of the tumours into the sinograms and thereafter reconstruction.
The tumours that could be detected by the nNUFTI method were also diagnosed
contemporaneously with CT or ultrasound (US). Those tumours not detected by
nNUFTI were only found by CT or US, 1 to 3 years after the initial 111In-octreotide
diagnosis. These late arising tumours were not detected by a later 111In-octretide inves-
tigation. These data would suggest that the expression of the somatostatin receptor
might be low for these tumours. Two of these tumours were medullary thyroid cancers,
Magnander et al. EJNMMI Physics (2016) 3:1 Page 10 of 12
and one was a lung carcinoid, both known to have a lower uptake of 111In-octreotide
[18], i.e. they were poor candidates for detection by 111In-octreotide.
Early detection of liver tumours is of huge benefit to the patient in terms of man-
aging their treatment options. Current treatment for neuroendocrine tumours com-
prises different regimens. One used alternative, that has achieved some attention, is
treatment with the radionuclide-labelled somatostatin analogues, 177Lu-DOTATATE
and 90Y-DOTATOC [10, 19, 20]. One criterion for selecting patients for these treat-
ments is that the uptake of the radionuclide is higher in the tumours than in normal
liver tissue. However, this estimation is difficult to ascertain for small tumours, and
therefore, these treatments tend to be biased towards patients with more advanced dis-
ease. However, it would be preferable to use these radionuclides to treat the disease at
an earlier stage [21]. Future studies will also be performed to analyse whether this
method can be used to follow treatment response in all NUF regions, thereby estimat-
ing the metastatic cure probabilities for liver tumours [21, 22].
While the present work focused on SPECT data of 111In-labelled somatostatin ana-
logues in the liver, the method that we developed might be applicable to other volumes
of interest in the patient and is also practicable for all diagnostic radionuclides, and in
extension, to PET-imaging.
ConclusionsWe verified the utility of a novel method (nNUFTI) with which to convincingly detect
observer defined 111In-octreotide-positive tumours, as well as non-visualized tumours,
in SPECT images. Our data indicates that the nNUFTI algorithm has the potential to
become a useful analytical tool with which to complement, and improve, the conven-
tional diagnosis of liver tumours using 111In-octreotide.
Compliance with ethical standardsThis work was funded by the Swedish Cancer Society, the Swedish Radiation Safety
Authority, the King Gustav V Jubilee Clinic Cancer Research Foundation, and the
Swedish Federal Government under ALF agreement. This retrospective study was ap-
proved by the Regional Ethical Review Board in Gothenburg and performed in accord-
ance with the Declaration of Helsinki and national regulations. The need for written
informed consent was waived.
Competing interestsThe authors report no conflicts of interest.
Authors’ contributionsTM participated in the study design and method development, created the programme script, and drafted themanuscript. EW participated in the design of the study and method development and revised the manuscriptcritically. JS supervised the selection of patients and the analysis and revised the manuscript critically. PG supervisedthe imaging procedures for the patients and the design of the programme and revised the manuscript critically. BWsupervised the selection of patients and the analysis and revised the manuscript critically. MB participated in themethod development, helped to draft the manuscript, and revised it critically. PB conceived of the study, participatedin its design, method development, and coordination, and co-drafted the manuscript. All authors read and approvedthe final manuscript.
Author details1Department of Radiation Physics, Institute of Clinical Sciences at Sahlgrenska Academy, University of Gothenburg,Gothenburg, Sweden. 2Department of Oncology, The Sahlgrenska Academy, University of Gothenburg, Gothenburg,Sweden. 3Department of Clinical Physiology, The Sahlgrenska Academy, University of Gothenburg, Gothenburg,Sweden. 4Department of Surgery, The Sahlgrenska Academy, University of Gothenburg, Gothenburg, Sweden.5Department of Medical Physics and Biomedical Engineering, Sahlgrenska University Hospital, Gothenburg, Sweden.
Magnander et al. EJNMMI Physics (2016) 3:1 Page 11 of 12

Received: 12 November 2015 Accepted: 12 January 2016
References1. Elias D, Lefevre JH, Duvillard P, Goere D, Dromain C, Dumont F, et al. Hepatic metastases from neuroendocrine tumors
with a “thin slice” pathological examination: they are many more than you think. Ann Surg. 2010;251:307–10.2. Wong KK, Cahill JM, Frey KA, Avram AM. Incremental value of 111-in-pentetreotide SPECT/CT fusion imaging of
neuroendocrine tumors. Acad Radiol. 2010;17(3):291–7.3. Castaldi P, Rufini V, Treglia G, Bruno I, Perotti G, Stifano G, et al. Impact of 111In-DTPA-octreotide SPECT/CT fusion
images in the management of neuroendocrine tumours. Radiol Med. 2008;113(7):1056–67.4. Krausz Y, Keidar Z, Kogan I, Even-Sapir E, Bar-Shalom R, Engel A, et al. SPECT/CT hybrid imaging with 111In-
pentetreotide in assessment of neuroendocrine tumours. Clin Endocrinol. 2003;59(5):565–73.5. Hillel PG, van Beek EJ, Taylor C, Lorenz E, Bax ND, Prakash V, et al. The clinical impact of a combined gamma camera/
CT imaging system on somatostatin receptor imaging of neuroendocrine tumours. Clin Radiol. 2006;61(7):579–87.6. Rahmim A, Zaidi H. PET versus SPECT: strengths, limitations and challenges. Nucl Med Commun. 2008;29(3):193–207.7. Krenning EP, Kwekkeboom DJ, Bakker WH, Breeman WA, Kooij PP, Oei HY, et al. Somatostatin receptor
scintigraphy with [111In-DTPA-D-Phe1]- and [123I-Tyr3]-octreotide: the Rotterdam experience with more than1000 patients. Eur J Nucl Med. 1993;20(8):716–31.
8. Lu SJ, Gnanasegaran G, Buscombe J, Navalkissoor S. Single photon emission computed tomography/computedtomography in the evaluation of neuroendocrine tumours: a review of the literature. Nucl Med Commun. 2013;34(2):98–107.
9. van Essen M, Sundin A, Krenning EP, Kwekkeboom DJ. Neuroendocrine tumours: the role of imaging for diagnosisand therapy. Nat Rev Endocrinol. 2014;10(2):102–14.
10. Kwekkeboom DJ, de Herder WW, Kam BL, van Eijck CH, van Essen M, Kooij PP, et al. Treatment with theradiolabeled somatostatin analog [177 Lu-DOTA 0, Tyr3]octreotate: toxicity, efficacy, and survival. J Clin Oncol.2008;26(13):2124–30.
11. Balon HR, Brown TL, Goldsmith SJ, Silberstein EB, Krenning EP, Lang O, et al. The SNM practice guideline forsomatostatin receptor scintigraphy 2.0. J Nucl Med Technol. 2011;39(4):317–24.
12. Bombardieri E, Ambrosini V, Aktolun C, Baum RP, Bishof-Delaloye A, Del Vecchio S, et al. 111In-pentetreotidescintigraphy: procedure guidelines for tumour imaging. Eur J Nucl Med Mol Imaging. 2010;37(7):1441–8.
13. Sadik M, Suurkula M, Höglund P, Järund A, Edenbrandt L. Quality of planar whole-body bone scaninterpretations—a nationwide survey. Eur J Nucl Med Mol Imaging. 2008;35(8):1464–72.
14. Koopmans KP, Neels ON, Kema IP, Elsinga PH, Links TP, de Vries EG, et al. Molecular imaging in neuroendocrinetumors: molecular uptake mechanisms and clinical results. Crit Rev Oncol Hematol. 2009;71(3):199–213.
15. Sadik M, Hamadeh I, Nordblom P, Suurkula M, Höglund P, Ohlsson M, et al. Computer-assisted interpretation ofplanar whole-body bone scans. J Nucl Med. 2008;49(12):1958–65.
16. Ulmert D, Kaboteh R, Fox JJ, Savage C, Evans MJ, Lilja H, et al. A novel automated platform for quantifying the extentof skeletal tumour involvement in prostate cancer patients using the bone scan index. Eur Urol. 2012;62(1):78–84.
17. Chang WY, Chiu CC, Yang JH. Block-based connected-component labeling algorithm using binary decision trees.Sensors (Basel). 2015;15(9):23763–87.
18. Forssell-Aronsson E, Bernhardt P, Nilsson O, Tisell LE, Wangberg B, Ahlman H. Biodistribution data from 100patients i.v. injected with 111In-DTPA-D-Phe1-octreotide. Acta Oncol. 2004;43(5):436–42.
19. Bodei L, Cremonesi M, Grana CM, Fazio N, Iodice S, Baio SM, et al. Peptide receptor radionuclide therapy with(1)(7)(7)Lu-DOTATATE: the IEO phase I-II study. Eur J Nucl Med Mol Imaging. 2011;38(12):2125–35.
20. Svensson J, Berg G, Wängberg B, Larsson M, Forssell-Aronsson E, Bernhardt P. Renal function affects absorbeddose to the kidneys and haematological toxicity during (177)Lu DOTATATE treatment. Eur J Nucl Med MolImaging. 2015;42(6):947–55.
21 Bernhardt P, Ahlman H, Forssell-Aronsson E. Model of metastatic growth valuable for radionuclide therapy. MedPhys. 2003;30(12):3227–32.
22 Bernhardt P, Ahlman H, Forssell-Aronsson E. Modelling of metastatic cure after radionuclide therapy: influence oftumor distribution, cross-irradiation, and variable activity concentration. Med Phys. 2004;31(9):2628–35.
Submit your manuscript to a journal and benefi t from:
7 Convenient online submission
7 Rigorous peer review
7 Immediate publication on acceptance
7 Open access: articles freely available online
7 High visibility within the fi eld
7 Retaining the copyright to your article
Submit your next manuscript at 7 springeropen.com
Magnander et al. EJNMMI Physics (2016) 3:1 Page 12 of 12