a nual report acou2010, and is the most modular device in our industry by far. the psion workabout...
TRANSCRIPT

Registered in England. No. 1520131. VAT No. GB 393 8220 35
Registered Office. 48 Charlotte Street, London W1T 2NS
Additional resources available online:
www.psion.com
www.IngenuityWorking.com
psion annual report & accounts 2010
ingenuity is working
we are now ready for growth
Psio
n Annual Report & Accounts
2010

INTRODUCTION 02 / CHAIRMAN’S STATEMENT 04 / FINANCIAL HIGHLIGHTS 2010 07 / DELIVERING AGAINST COMMITMENTS 08 / CHIEFEXECUTIVE OFFICER’S REVIEW 10 / CUSTOMERS 14 / PARTNERS 15 / INDUSTRIES 16 / SOLUTIONS 17 / INGENUITYWORKING 18 /OPERATIONAL REVIEW 2010 20 / FINANCIAL REVIEW 2010 22 / RISKS AND UNCERTAINTIES 32 / BOARD OF DIRECTORS 38 / DIRECTORS’REPORT 40 / CORPORATE SOCIAL RESPONSIBILITY REPORT 43 / REPORT ON CORPORATE GOVERNANCE 46 / DIRECTORS’ REMUNERATIONREPORT 50 / STATEMENT OF DIRECTORS’ RESPONSIBILITIES 56 / INDEPENDENT AUDITOR’S REPORT 57 / CONSOLIDATED STATEMENT OFCOMPREHENSIVE INCOME 59 / CONSOLIDATED AND COMPANY BALANCE SHEETS 60 / CONSOLIDATED AND COMPANY CASH FLOW STATEMENTS 61 /CONSOLIDATED AND COMPANY STATEMENT OF CHANGES IN EQUITY 62 / NOTES TO THE CONSOLIDATED FINANCIAL STATEMENTS 63 / FIVE YEARSUMMARY 91 / SHAREHOLDER ESSENTIALS, ADVISERS AND FINANCIAL CALENDAR 92 / PSION WORLDWIDE 93
ValueS
VISION
OPENNESS
– We are easy to do business with– We are courageous and transparent in our way of working– We create choice for our customers
TRUST
– We all play a role in the success of our business and brand– We work as a team with partners and not as a competitor– Our decisions will earn us trust from our partners and customers
COLLECTIVE INGENUITY
– We are inventive, clever and resourceful in solving problems– We nurture ingenuity from all quarters of the world– We continually listen to, and learn from, our customers and partners
PUTTING INGENUITY BACK TO WORK

PSION ANNUAL REPORT & ACCOUNTS 2010
01
OUR BRAND WAS FULLY REFRESHED IN JANUARY 2011
TO REFLECT THE MODERN, CUTTING-EDGE BUSINESS WE
AIM TO BECOME. ALSO INSTEAD OF TRADING AS ‘PSION
TEKLOGIX’, WE ARE NOW SIMPLY KNOWN AS ‘PSION’.
THE DIGITAL ERA HAS FUNDAMENTALLY REDUCED THE
COST OF REBRANDING, WHILST GREATLY IMPROVING
REACH AND IMPACT. TODAY, IMAGERY, ANIMATION AND
SEARCH ARE COMBINED WITH A NEW KIND OF GLOBAL
COLLABORATION AND PUBLIC DIALOGUE. THIS IS ALSO
AT THE HEART OF OUR NEW BUSINESS MODEL.
braNd
The new trading name and logo will be easier to see,easier to say and easier to search for online, giving thewhole company greater visibility.
MODULAR
INGENIOUS
ADAPTABLE

IN
TRO
DU
CTIO
N
abOuT uS
We design, manufacture, supply and service rugged, handheld andvehicle-mounted computing devices. Operating in business-to-businessmarkets, we improve efficiency and productivity for leading enterprisesaround the world.
Our devices are used by warehouse, campus and field-based/mobileoperatives – often in physically hostile environments. Delivering real-timeaccess to enterprise information, they optimise management of coreassets, inventory and other resources – extending visibility and controlover resources.
Our devices feature multiple communication technologies, with arange of accessories and supporting services. Communications betweena Psion rugged mobile device and an enterprise system may include Wi-Fi,Bluetooth, narrow-band radio and wide-area radio technologies suchas General Packet Radio Service (GPRS) and Universal MobileTelecommunications System (UMTS). Some devices also include GlobalPositioning System (GPS) capability.
Data is recorded using keyboards, touch-screens, laser scanners,imagers, cameras and radio frequency identification readers. For specificapplications, fingerprint readers and magnetic stripe readers areincluded.
With extensive and often highly complex business processes, ourindustry has historically struggled to meet diverse customer needs.Identifying requirements through direct sales operations has alsocreated unsustainable cost structures.
The Psion group operates in three main geographical markets: Europe,Middle East and Africa; the Americas and Asia Pacific. We have officesin 15 countries and a strong focus on working through third partyresellers, distributors and system integrators – extending our globalmarket reach. Our products are available in more than 50 countries.
LEADING THROUGH OPEN SOURCE MOBILITY…

PSION ANNUAL REPORT & ACCOUNTS 2010
02 / 03
In answer to these challenges, we have introduced Open SourceMobility (OSM). Within this new business model, we are nowdesigning products around a modular technology platform – reducingthe time it takes to launch new products and enabling economies ofscale. This new level of modularity is best illustrated by the new PsionOmnii™ platform, which delivered the Psion Omnii XT10 in September2010, and is the most modular device in our industry by far. The PsionWorkabout Pro family also continues to deliver class leadingmodularity, configurability and after-market add-ons. In this way, wecan provide customers with comprehensive, customised solutionseither directly or through our business partners.
As part of our OSM model, we are also encouraging OpenInnovation – supporting our partners in the development ofhardware, software and service add-ons. Our modular architectureand open innovation initiatives enable us to offer a wider variety ofsolutions – helping us to meet customer requirements and extendingproduct life to reduce total cost of ownership.
Along with an increased focus on indirect distribution, webelieve OSM will enable us to grow our market share. It will help usincrease gross profits and recurring revenues, while maintainingtight control on operating expenses and delivering enhanced returnsto shareholders.
DRIVING GROWTH WITH… PARTNERS
CUSTOMERS
SHAREHOLDERS
EMPLOYEES
OPEN INNOVATION IS A KEY COMPONENT OUR NEW BUSINESS MODEL, WHICH
SUPPORTS OUR PARTNERS IN THE DEVELOPMENT OF HARDWARE, SOFTWARE AND
SERVICE ADD-ONS. THE UNIQUE COMBINATION OF OUR MODULAR ARCHITECTURE
AND OPEN INNOVATION, ENABLES US TO OFFER OUR CUSTOMERS AND RESELLERS
THE WIDEST RANGE OF FLEXIBLE SOLUTIONS.

Ch
AIRm
AN
’S
S
TATEm
EN
T Introduction
Much of the work commenced in 2009 and 2010 to improve processesand operational efficiency across the organisation has finally come tofruition. We have successfully and fundamentally changed our businessin order to build a stronger, more profitable company.
In 2008, we set ourselves a medium-term objective to becomeeasier to do business with, enhance partner loyalty and deliver betterfinancial results. The feedback received is that we have largely achievedthat goal. During 2010, we held partner conferences in Rome, Dallas,Singapore and Shanghai and took the opportunity to ask partners aboutour performance. The overwhelming response was positive. Ourincreased openness and commitment to building strong and lastingrelationships is making a real difference to our business with channelpartners.
Financial results
Revenues in 2010 were £174.5 million (2009 – £170.0 million). Sales inEurope, Middle East and Africa were ¤120.6 million (2009 – ¤117.1 million).Sales in the Americas were US$87.1 million (2009 – US$83.3 million),while sales in Asia were US$22.4 million (2009 – US$18.6 million).
Normalised operating loss for the year was £1.9 million (2009 – profit£4.0 million). Profit before tax was £5.7 million (2009 – loss £3.0 million).
This Group has maintained a strong Balance Sheet. The Group’s cashbalance at the end of the year was £36.9 million (2009 – £45.3 million).We remain confident in our ability to generate significant operating cashin future.
The Group has limited debt, with finance leases of £2.0 million(2009 – £1.2 million). Total equity at the year end was £178.5 million(2009 – £177.6 million). The Board has declared a final dividend of 2.7p(2009 – 2.6p) making a total of 4.0p for the year (2009 – 3.8p).
The company’s reported financial performance was impacted byexchange rate movements. Most of the Group’s trading occurs in Euroand the US Dollar. To help shareholders to compare our performance,year-on-year, we present our results on a constant currency basis in theOperational Review.
John Hawkins
Chairman

PSION ANNUAL REPORT & ACCOUNTS 2010
04 / 05
Board
In May 2010, we announced the appointment of Toby Redshaw as anon-executive director. Toby is currently Executive VP and ChiefInformation Officer at American Express, having held the position ofCIO at insurance group Aviva.
In November 2010, Psion announced that Fraser Park, thecurrent Chief Financial Officer, intended to take a career sabbaticalto deal with the illness of a close family member. On behalf of theBoard I would like to thank Fraser for his significant contribution sincebecoming Chief Financial Officer of Psion Plc in 2009. We are verygrateful to Fraser for his support and we wish him well for the future.
Fraser will be replaced by Adrian Colman who is currently ChiefFinancial Officer of London City Airport.
I would like to add my thanks and best wishes to everyone in theGroup who has contributed to our progress in 2010. I am confidentthat the real benefits of their hard work will be seen in 2011.
Objectives
In 2009, we decided to take steps to improve our competitive positionby differentiating ourselves more obviously in the marketplace.Through our Open Source Mobility (OSM) strategy, we aimed tocombine a modular platform with an open and collaborative approach,to achieve innovative and customisable solutions for our customers.
We believe that we are now well on our way to achieving ourgoals and this will differentiate us from the competition. Launchedin September 2010, our modular Omnii™ platform has beenenthusiastically received by partners and customers alike. As well asensuring that Psion solutions offer more flexibility and lower cost ofownership for customers, our modular development model alsosignificantly reduces the time it takes to bring new products tomarket. Two derivative products have already been announced in thelast nine months and more are scheduled for release in 2011 and2012. We will increasingly be able to compete with a substantiallyrefreshed portfolio of products which have a longer life, a lower totalcost of ownership and better meet customer needs.
2010 has been a year of significant strategic and operational progress for Psion, but withno evident improvement in financial performance, as we have invested heavily in newproduct development. In 2011 we expect to deliver an improving operating margin anddemonstrate further growth in our revenues.
A YEAR OF SIGNIFICANT STRATEGIC AND OPERATIONAL PROGRESS…
chaNge

Ch
AIRm
AN
’S
S
TATEm
EN
TCO
NTIN
UED
Also launched last year, the innovativeIngenuityWorking.com community is playing a key role inturning the OSM vision into reality. Here, partners, customersand Psion employees can come together to share ideas andcreate ingenious solutions to meet specific customer needs.
Another key objective last year was to increase ouraddressable markets without significant investment inoverhead costs, through increased channel sales activity.A drive to recruit new partners in key strategic markets hasproved a success and we are now well placed to increaseindirect sales in 2011.
Outlook
In 2011, we aim to grow market share in established marketssuch as Western Europe and the United States, as well asexpanding into new geographies that hold substantial growthpotential for Psion. These include exciting opportunities inIndia, Latin America and China. Here, our OSM initiatives willenable us to unlock a vast number of new addressablemarkets. At the same time, the modularity of the Omniiplatform will allow us to assemble products in-country, withoutbeing penalised by local tax regimes.
While looking to grow revenue in 2011, we are also keenlyaware of the need to control costs, given the potential forforeign exchange movements to materially impact ourfinancial performance. In 2011 and beyond, we aim to increaserevenue growth faster than costs, resulting in improvedoperating margins.
Over the last few years, Psion has taken many specificactions to become more efficient in the way we conduct ourbusiness and more relevant in the products and services weoffer to partners and customers – and the way that wecommunicate them. I believe that by reaching out to new andestablished markets with a clear and differentiated offering,communicated in a vibrant and open way, we can now beconfident of growing market share and changing thecompetitive landscape in 2011.
John HawkinsChairman

PSION ANNUAL REPORT & ACCOUNTS 2010
06 / 07
Financial highlights 2010
2010 2009 2009Reported Reported Constant
Currency————————————————— ————————————————— —————————————————
Revenue £174.5m £170.0m £167.8mGross margin 38.2% 37.5% 35.9%Adjusted operating margin1 3.4% 1 .1% (2.1)%Normalised operating margin2 (1.1)% 2.4% (0.6)%Dividend per share 4.0p 3.8p—— —— ——1) Based on operating profit from continuing operations before exceptional operating costs and share-based payments costs
or credits.
2) Based on adjusted operating profit from continuing operations as in (1) before the 2009 one off inventory provision, afterdeducting capitalised development costs and before amortisation on capitalised development costs.
For the purposes of internal reporting and to aid understanding of the underlying performance of the business, theGroup’s internal management reporting presents adjusted operating profit and normalised operating profit, which arereconciled to operating profit / (loss) from continuing operations as shown below. Adjusted operating profit removes theimpact of share-based payments and exceptional operating costs. In the past two years the group has invested heavily inthe development of new products, which has resulted in significant development expenditure, both expensed and capitalised.Normalised operating profit adjusts to remove the net impact of capitalisation to aid period on period comparisons. Additionally,a one-off material movement in inventory provisions in 2009 is also adjusted for as this does not reflect underlyingperformance but was not classified as an exceptional cost.
Adjusted operating profit reconciles to operating profit / (loss) from continuing operations as follows:
2010 2009£m £m
————————————————— —————————————————
Operating profit / (loss) from continuing operations 5.7 (3.1)
Deduct share-based payments credit (0.1) (0.4)
Add back exceptional operating costs 0.3 5.5
Adjusted operating profit from continuing operations 5.9 2.0
Normalised operating (loss) / profit reconciles to adjusted operating profit as follows:
Adjusted operating profit from continuing operations 5.9 2.0
Add back inventory provision – 5.6
Deduct capitalised development costs, net of amortisation (7.8) (3.6)
Normalised operating (loss) / profit (1.9) 4.0—— ——
fINaNcIalS
MUCH OF THE WORK COMMENCED IN 2009 AND 2010 TO IMPROVE
PROCESSES AND OPERATIONAL EFFICIENCY ACROSS THE ORGANISATION
HAS FINALLY COME TO FRUITION.

1WhAT WE SAID WE’D DO
Be recognised for giving customers what they really need
WhAT WE DID
Through the combination of our newmodular Omnii™ Platform, coupled withOpen Innovation, and delivered viaIngenuityWorking we have establisheda full and open dialogue with our globalcustomer and reseller community. Realcustomer solutions are now beingdeveloped in this way.”
“
“
“
“
2WhAT WE SAID WE’D DO
Deliver the lowest total cost of ownership in our industry
WhAT WE DID
We have used Gartner’s Total Cost of Ownership model for mobile deviceswith a number of our existing customers. This has confirmed that utilisingour modular Omnii™ platform will yield significant cost savings over thecourse of the mobile device lifecycle; typically over 30% for hardware andsoftware and 15% in overall total cost of ownership. This means that overits usage life the savings made will cover the full cost of the product.”
3WhAT WE SAID WE’D DO
Be the vendor who is most trusted by resellers and distributors
WhAT WE DID
After thoroughly researching competitor programmes and exploringwhat our Partners really valued, we launched a new Partner Programmein early 2010. In September 2010, we ran Partner Conferences in Romeand Dallas as well as Singapore and Shanghai. Attendees were surveyedand on average 95% agreed or strongly agreed that Psion’s newstrategy will improve the way the company does business with them.”
4WhAT WE SAID WE’D DO
Be famous for our Openness, Modularity and Ingenuity
WhAT WE DID
Our September 2010 Rome and DallasPartner Conference surveys showedstrong support for Psion’s strategyand an average of 89% agreed with thestatement ‘Psion’s OSM strategy couldfundamentally change the industry’.”
DELIvERIN
g Ag
AIN
ST CO
mm
ITm
EN
TS

PSION ANNUAL REPORT & ACCOUNTS 2010
08 / 09
“
“
5
6
WhAT WE SAID WE’D DO
Become a great place to work for great people
WhAT WE DID
In September 2010 Psion’s annualemployee survey established that job andorganisational satisfaction had increasedsignificantly, and that morale was goodthough with room for more improvement.Almost all scores were up relative to the2009 survey, with 64% of question scoresimproved by more than 10% and morethan 70% of employees agreeing thatPsion is now a ‘great place to work’.”
WhAT WE SAID WE’D DO
Look like a leader in 2010 and in 2011 we will be a leader
WhAT WE DID
In 2010 we executed transformational activities in all key areas. We nowhave arguably the best channel programme, and the most modular productplatform delivering the lowest total cost of ownership in the market. Withover 60,000 visitors a month we also have the largest social network in theindustry. In 2011 we will continue to drive this to higher levels.
Our resellers and developers, and our employees, have all signalled thatthey support the strategy, direction and implementation to date.”
delIVered
Ch
IEF ExECU
TIvE O
FFICER’S
REvIEW
Introduction
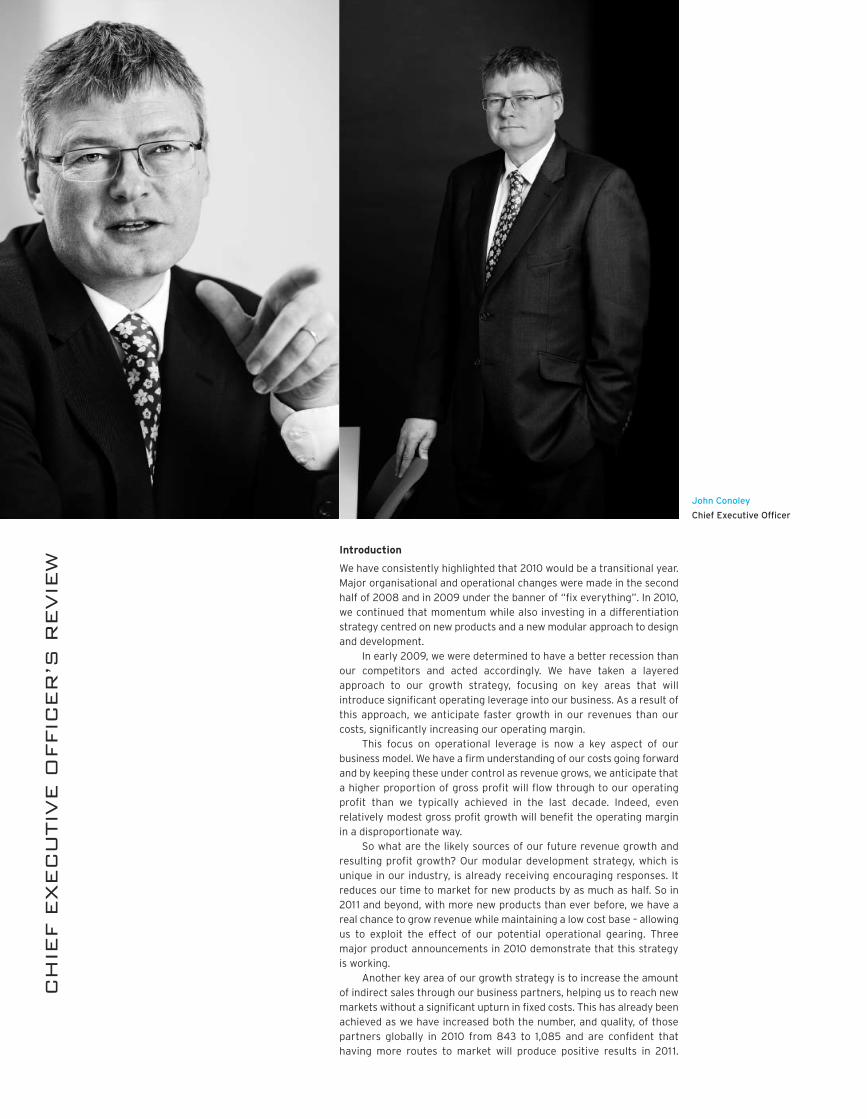
We have consistently highlighted that 2010 would be a transitional year.Major organisational and operational changes were made in the secondhalf of 2008 and in 2009 under the banner of “fix everything”. In 2010,we continued that momentum while also investing in a differentiationstrategy centred on new products and a new modular approach to designand development.
In early 2009, we were determined to have a better recession thanour competitors and acted accordingly. We have taken a layeredapproach to our growth strategy, focusing on key areas that willintroduce significant operating leverage into our business. As a result ofthis approach, we anticipate faster growth in our revenues than ourcosts, significantly increasing our operating margin.
This focus on operational leverage is now a key aspect of ourbusiness model. We have a firm understanding of our costs going forwardand by keeping these under control as revenue grows, we anticipate thata higher proportion of gross profit will flow through to our operatingprofit than we typically achieved in the last decade. Indeed, evenrelatively modest gross profit growth will benefit the operating marginin a disproportionate way.
So what are the likely sources of our future revenue growth andresulting profit growth? Our modular development strategy, which isunique in our industry, is already receiving encouraging responses. Itreduces our time to market for new products by as much as half. So in2011 and beyond, with more new products than ever before, we have areal chance to grow revenue while maintaining a low cost base – allowingus to exploit the effect of our potential operational gearing. Threemajor product announcements in 2010 demonstrate that this strategyis working.
Another key area of our growth strategy is to increase the amountof indirect sales through our business partners, helping us to reach newmarkets without a significant upturn in fixed costs. This has already beenachieved as we have increased both the number, and quality, of thosepartners globally in 2010 from 843 to 1,085 and are confident thathaving more routes to market will produce positive results in 2011.
John Conoley
Chief Executive Officer

Partner conferences in Dallas, Rome and Singapore in late 2010 werean outstanding success and position us well to further increase indirectsales revenue. Better distribution with more partners selling more ofour products and services, bodes well for future revenue growth.
We anticipate significant growth from emerging markets suchas China, Brazil and India in 2011. As an early indicator of ourcommitment to those markets, in December 2010 we held a newproduct announcement event in Shanghai for the EP10, our leadingenterprise class PDA device. This was an outstanding success, and itwas a major change for us to position China at the centre of such amilestone in our company’s journey.
A further opportunity for growth comes through our strongBalance Sheet, which was even more vital during the recession, andwill continue to be important during our growth phase. We have thebalance sheet flexibility to look for appropriate add-on acquisitionsand partnerships to help expand our addressable markets, where wecan invest money in additional technical or strategic capabilities.This, in turn, will support our growth.
Finally, we are once again becoming recognised as‘thought leaders’. Our unique open collaborative communityIngenuityWorking.com is causing a lot of positive ripples both insideand outside our industry. We expect interesting collaborativeopportunities through this Web 2.0 approach, which will help usfurther exploit other opportunities.
In short, we are generating more layers of growth opportunity inrelation to our cost base than at any time in the past decade. Themodel of operational leverage supports progressive operating margingrowth. With the commitment and hard work of a team that is nowre-energised and better integrated than ever before, we haveprogressed well given the backdrop of difficult economic conditions.We are confident that our actions this year will see the company growand continue to position ourselves to become a market leader in theforeseeable future. More than just a hardware company, Psion providesa modular platform, enabling organisations to adapt and upgradehardware and software over the course of an extended lifetime.
Psion has made significant operational progress. Now we need to achieve our goal ofsubstantial growth. The business transformation we have seen over the last two yearshas brought rewards both in terms of operational effectiveness and competitivedifferentiation. Our new product developments remain on track and on budget. We aretherefore confident in our ability to grow revenues more quickly than our costs in 2011and beyond. The Operational Review provides an elaboration of the business modelgoing forward.
A YEAR OF SIGNIFICANT PROGRESS, NOW WE MUST GROW…
grOwTh
PSION ANNUAL REPORT & ACCOUNTS 2010
10 / 11

Ch
IEF ExECU
TIvE O
FFICER’S
REvIEW
CO
NTIN
UED
Market overview
Competitive pressures and shifting global demographics haveforced many organisations to challenge their current supplychain capabilities by expanding their supply networks andforging global new supplier and transportation/logisticrelationships. These market dynamics are seen in Psion’s coretarget markets such as manufacturing, warehousing, logisticsand transport of people and goods, as well as ports, airportsand rail yards.
Customers seeking greater visibility throughout thesupply value chain are looking to mobile technologies toimprove the effectiveness of distributed supply chains,logistics and distribution-related processes. The need forrugged mobile computing solutions continues to be drivenby the increasing complexity and cost of global logistics,particularly rising fuel costs, combined with the need to manageinternational operations in the most cost-effective way.
The interest in mobile computing solutions continues togrow as companies recognise that for many supply chainsthere are as many, if not more, users outside the enterprise asthere are internally. As the pervasiveness of consumer-oriented mobile technologies has grown, mobile businessusers have also started requesting mobile technologies toreplace paper, improve productivity and provide real-timecommunication and decision making. However, the mobilesolution market remains highly fragmented, characterised bymonolithic devices, which have previously limited all markets.
Financial and operating performance
In 2010, we faced a perfect storm of currency movements.However, the investment in products to date and the focus ofmarketing going forward will provide a strategic answer bygrowing revenues and more closely aligning revenuecurrencies with cost currencies.
Although trading conditions were challenging, weachieved notable contract wins across numerous marketsectors. In France, jewellery retailer Cleor implemented anRFID solution using Workabout Pro terminals to improve theefficiency of its inventory management, winning SupplyChain magazine’s “King of the Supply Chain 2010” award.Additionally, vehicle inspection company DEKRA Automotiveinvested in 700 Ikôn PDAs to enable effective communicationsacross its network.
United Kingdom-based PJH Group, a leading Europeansupplier of bathrooms, kitchens and appliances, installedWorkabout Pro units to improve production and accuracy inits warehouse processes. In Germany, glass transportationcompany Gestellpool Europe invested in 480 Workabout ProG2 devices to enable the efficient management and trackingof 45,000 glass transportation cradles.
Another key contract win was with US-based SignatureBrands – a leading manufacturer of cake decorations. Thecompany deployed Psion’s Mobile Integration Suite (MIS),including Vocollect Voice, to improve accuracy and efficiencywithin its distribution centre.
As well as winning customer contracts directly, Psion alsoentered into new channel partnerships with a number ofresellers including Twiister, Opal, Steria, Brain Corp andVodafone Spain.
We made significant progress on a range of operationalmetrics. Delivery lead times on orders under $10,000 reducedby 50%; by 43% on orders between $10,000 and $100,000;and, by 34% on orders over $100,000. This enabled us to bemore competitive. Even with faster shipping of orders, ourorder books remained stable at £27.6m (the same asDecember 2009). Our sales pipeline continues to grow. Wehave increased the volume of our products delivered throughour channel partners from 48% in 2009 to 54% in 2010.
We have increased the number of partners with whomwe work from 843 in 2009 to 1,085 in 2010. We met ourcommitments in launching products on time, something weintend to continue in 2011. We will end 2011 with a substantiallyrefreshed product portfolio, with further enhancements tofollow in 2012.
These are just a few indicators that the operations of thebusiness continue to improve, and I would refer you to theOperational Review for further information.
New approach to mobile solutions
Early in 2010, we announced our OSM strategy, which hasalready delivered significant wins for the company. Focusingon modularity, open innovation and customisation, it hasbegun to differentiate us in the marketplace and hasrevolutionised the way we communicate with our partners andcustomers.
The September launch of our new modular platform,Omnii™, was well received across the industry. This flexibleapproach to mobile solutions enables customers to upgradeand interchange modules to meet changing needs, adaptingto dynamic market conditions.
Instead of having to purchase an entirely new producteach time requirements change, Omnii allows customers tochange just one or two modules. Companies can easily andcost-effectively upgrade or even repurpose equipment – anddo this in the field, if necessary.
By providing this adaptability, we are confident we candeliver the lowest total cost of ownership in our industry,meeting a key objective that we set ourselves in 2009. Andthanks to reduced complexity in manufacture, productioncosts and timescales are also much reduced. This has beenseen in the early release of our first product built on the newplatform, the Omnii XT10. Initial customer reaction has beenvery encouraging.
We quickly followed up the shipment of Omnii with theannouncement of the new EP10 durable PDA device, whichexpands our addressable market. Consistent with our growingfocus on emerging markets, the announcement event was heldbefore press and partners in Shanghai, China. Indeed, we tookour first order for this product even before the announcementevent and we are confident of a continued positive marketreaction.
Tapping into ingenuity
We are not alone in developing solutions based on our newmodular platform. With IngenuityWorking.com, we arereaching out to hundreds of partners worldwide, offeringopen, honest dialogue and information on our open mobilityconcept.
Through this innovative website – a first in our sector, andperhaps unique at the moment in any sector – we supportcompanies who are developing customised solutions acrossnumerous industries and niche sectors. Even though it hasonly been live since March 2010, IngenuityWorking.com hasalready created a buzz of excitement across the industry. Inless than a year we have gone from 0 to almost 60,000visitors per month and have registered over 12,000 members.We currently have over 4,500 discussions and well over 800distinct technology articles covering a wide range of topics.

PSION ANNUAL REPORT & ACCOUNTS 2010
12 / 13
This unique online community gives us something thatnone of our competitors have: a real insight into the everydayneeds and challenges that partners and customers are facing,and a clearer idea of how they want us to help. Whilecustomers are now able to find products that fit their preciseneeds, this approach is also opening up many new addressablemarkets for us.
And it isn’t all about us. IngenuityWorking.com is a hubthrough which we are facilitating both partner-to-partner andpartner-to-customer collaboration, enabling the airing of keyissues, highlighting business opportunities and encouragingingenious ideas.
Open innovation is working
Early feedback is that our strategy of open innovation,supported by ingenuity.working.com, is working. As a keypartner, Ryzex was part of the beta testing program for thenew Omnii platform. Eric Kennedy, Director of ProfessionalServices at Ryzex commented on his experience:
“The process for refining a good design leveraged theIngenuityWorking.com collaborative web environment. Wewere encouraged to post our thoughts on the beta device onforums that were read by the staff working on the devicedesign. We noted a few things – most of them more aboutusability than being any sort of major design flaw. These weretaken seriously and fixed. I’m looking forward to working withthe Omnii platform for a long time.”
New Psion – new brand
After two years of comprehensive – and essential –transformation at every level of our business, we also hadcollected evidence that our brand was no longer in tune withthe ingenious, adaptive and dynamic company we are in theprocess of becoming. The complexity of our logo and ourtrading name of Psion Teklogix – difficult to say in manylanguages – failed to convey a sense of who we now are, andour promise of straightforward openness to our partners andcustomers. There were also some indications that the ‘old’logo in the new digital world was in fact costing us growthopportunities.
For this reason, we have undertaken a significant but costeffective rebrand. As of 31 January 2011 we are known simplyas Psion. We believe that our new logo, and its treatment in allkinds of media (and especially digital & social media) andmarketing activity, will convey more effectively the core valuesthat now permeate our organisation. We are now ingenious,flexible and open.
We see the rebrand as a key part of our competitivestrategy. However, we also recognise that many investors willbe familiar with rebrands that have taken too much time andmoney for too little return. Well, such things are just so muchmore cost effective with digital media in mind than in the past– especially if you remain cost and value conscious, as I believewe have. With this in mind, budgets have been tightlycontrolled and our overriding priority remains our objectiveto improve operating margins with an interim goal of 10%.
Building strong relationships
Trust in our brand starts with people having trust in us. To buildstrong, mutually rewarding relationships with partners andcustomers, we know we need to listen as well as communicate.And our new open innovation culture, supported byIngenuityWorking.com, is helping us to do just that.
Our partners have been quick to notice the difference. Ata recent partner conference, Kevin Rowe, of Synnex Canadawas one of many to comment on this:
“It’s very refreshing to see a manufacturer being openand sharing. We’re loving the partnership with Psion.”
A great place to work
However, strong external relationships cannot be sustainedwithout strong internal relationships. Two years ago, thecompany was fragmented and employees were disillusioned.
Now, all that has changed. Individuals have a voice andteams have a purpose. Our newly centralised structure isproviding direction and cohesion, while a culture ofcooperation and trust is nurturing innovative thinking. We aretruly on track to achieve the goal of being a great place towork for great people.
Our recent employee satisfaction survey reflects this.Almost all scores are up relative to the 2009 survey, with 64%of question scores improving by more than 10%.
Management
The management team for 2011 is as follows:> Ron Caines, President Sales and Service> Constance Crosby, VP and General Counsel> Mike Doyle, Chief Technology Officer> Nick Eades, Chief Marketing Officer> Rob Gayson, VP Operations and Quality> Maija Michell, VP Human Resources> Dan Pearce, VP Finance
Fraser Park steps down as previously announced. He hasdone three years work in only two and we wish him well withhis future plans. Adrian Colman will replace Fraser before theend of April 2011.
Conclusion
The business transformation we have seen over the last twoyears is beginning to bring rewards both in terms ofoperational effectiveness and competitive differentiation. Wehave not yet achieved our medium term goal of generating anormalised operating margin of 10%. However, we remainfocused on achieving this target.
We are on track to realise our strategic goals, and Psionis now well placed to grow to its full potential in existingmarkets while expanding into new markets.
John ConoleyChief Executive Officer

OUR UNIQUE BETA
TRIAL PROGRAMME
ON IN
GENUITYWORKING IN
VOLV
ED MORE
THAN 40 CUSTOMERS AND PARTNERS IN
FIELD TRIALS OF THE OMNII™
XT10 PRIOR
TO IT
S LAUNCH.
working more closely than ever before
cuSTOmerS
Our customers include:
Vattenfall AB Värme Nordic
L’Oreal
MEDITECH – Medical Information Technology, Inc.
Adidas
Lego
Yangshan Deep Water Port
Hertz
MGPS (Marseilles-Fos)
Toyota
Port of Miami Terminal Operating Company
Aeroporti di Roma
Copenhagen Airports A/S
Düsseldorf International Airport
Continental Airlines
United States Department of Defense
BMW
AK Steel
Volkswagen
Brabant Water
Conair
French Traffic Police
Raben Group
Clinton Cards
Signature Brands
Jordache
Clear Channel France
NetMotion Wireless
National Security Agency of Argentina
Pharmacy Plus
The PJH Group
Cleor
DEKRA Automotive
Gestellpool Europe

PSION ANNUAL REPORT & ACCOUNTS 2010
14 / 15
PSION COLLABORATES W
ITH LEADING-EDGE PARTNERS,
DISTRIBUTORS AND SYSTEM IN
TEGRATORS THAT
PROVIDE COMPLEMENTA
RY TECHNOLO
GY, EXPERTISE,
SERVICES AND SALES CAPABILITIES.
a collaborative approach to solution development
parTNerS
We have a strategy of growing our business through an expanding network of partners,distributors and system integrators. This gives us a wider addressable market, globally.In total our products are available in more than 50 countries.

THE W
IDE RANGE OF INDUSTRIES THAT W
E SUPPORT
BENEFIT FROM ADDED VISIBILITY AND VALU
E THROUGH
OUR NEW ONLINE MARKETPLACE “INGENUITYLIVE!”.
innovative expertise in mobile computing solutions
Airports
Automotive
Cold Chain
Field Service
Government
Passenger Management
Ports and Container Yards
Postal and Courier
Retail
Warehouse and Distribution
INduSTrIeS

OUR SOLUTIONS ARE BUILT AROUND A COMPLETE RANGE OF HIGH-QUALITY,
INNOVATIVE MOBILE COMPUTERS DESIGNED FOR DEMANDING ENVIRONMENTS.
OUR STRATEGY OF MODULAR PRODUCT DESIGN GIVES US A UNIQUE PLATFORM
TO GROW AND TO GAIN COMPETITIVE ADVANTAGE.
Modular, Ingenious and Adaptable
SOluTIONSHand-held computers
Vehicle-mount computers
Connectivity
Service and Support
PSION ANNUAL REPORT & ACCOUNTS 2010
16 / 17

INGENUITYWORKING IS
CORE TO OUR BUSINESS
STRATEGY IN
BRINGING TOGETHER CUSTOMERS,
PARTNERS AND PSION EMPLO
YEES IN
AN OPEN,
COLLABORATIVE DIALO
GUE.
the industry’s largest online community
> 1 year old
> 60,000 visitors a month
> Over 12,000 registered members
> More than 5,000 active discussions
> More than 2.5 million page views
INgeNuITywOrkINg

PSION ANNUAL REPORT & ACCOUNTS 2010
18 / 19
With 500 billion minutes spent on Facebook each month,24 hours of YouTube video uploaded every minute, and27 million Tweets per day on Twitter, social media hasreached a scale that the business world cannot ignore.
The reason is simple: social media engages peoplein a dialogue – whereas traditional websites simply pushinformation at people, with no interaction.
We launched our online communityIngenuityWorking.com in early March 2010, an industryfirst, to create a relevant real-time dialogue within ourmarket. A key element of our open innovation strategy,our customers, developers, partners and employees cannow collaborate openly on all manner of industrychallenges and mutual business opportunities.
The results have been extremely positive. Since itslaunch in early March 2010, monthly visitor numbershave grown from zero to almost 60,000, with over12,000 registered members. The average visitor stays onthe site for over 6 minutes, more than double the time atypical user spends on www.psion.com. Approximately14,000 monthly visitors find the site via search enginessuch as Google, and supporting this are 5,500discussions and well over 800 distinct technologyarticles. As a result, we passed the 2 million page viewthreshold in November 2010, a mere 9 months after thesite launched.
By combining social media with our modularOmnii™ platform, we can create adaptable mobilecomputing solutions that delivers more value tocustomers, partners, and ultimately, to Psion.
The market insight that IngenuityWorking gives usnow guides our development of new offerings basedon the direct customer and partner dialogue, whichhappens every day.
Our partners can now communicate with a globalaudience on IngenuityWorking via the new marketplace“IngenuityLive!” which we added in October 2010. Thisdramatically expands our partners market reach.
Customers and partners also have unprecedentedaccess to technical experts across all fields throughoutthe ecosystem for real time problem solving.
Building trust with the marketplace may be themost important role of IngenuityWorking. By enablingunfiltered dialogue between customers, partners,developers and Psion, all parties will get to understandeach other as individuals discussing relevant, market-determined topics as opposed to corporate entitiesdriving a PR agenda. Trust then drives decisions on whoto collaborate with and who to buy from. By extension,trust also creates real opportunities to utilise ourmodular Omnii platform and its associated developmenttools, providing exciting market opportunities for us andour partners.
BUILDING TRUST WITH THE MARKETPLACE MAY BE THE MOST IMPORTANT ROLE OF
INGENUITYWORKING. BY ENABLING UNFILTERED DIALOGUE BETWEEN CUSTOMERS, PARTNERS,
DEVELOPERS AND PSION, ALL PARTIES WILL GET TO UNDERSTAND EACH OTHER AS INDIVIDUALS
DISCUSSING RELEVANT, MARKET-DETERMINED TOPICS. TRUST THEN DRIVES DECISIONS ON WHO TO
COLLABORATE WITH AND WHO TO BUY FROM.

OPERATIO
NAL REvIEW
2010
Our objectives
Our overriding objective is to create sustainable growthin shareholder value through delivering an enhancedoperating margin performance. Our stated financialtarget is to increase our normalised operating marginsto at least 10% of revenues in the reasonably near term.
We will do this by improving our gross profits,increasing our recurring revenues and maintaining tightoperational cost control, while investing in future growthof our products and services increasingly throughresellers, distributors and systems integrators.
We are confident that we can compete on adifferentiated basis to deliver these goals through:> Open Source Mobility – delivering customised
solutions through modular product design and openrelationships with partners to encourage innovationand widen addressable markets.
> Ensuring that we have the right organisationalcapabilities deployed at the right time.
> Continuing to enhance our operating culture with afocus on executional excellence.
We previously highlighted that 2010 would be atransitional year and have made demonstrable progresson key elements of our strategy. While financialperformance in 2010 was somewhat disappointing, weremain confident of our ability to substantially growrevenue, gross profits and operating margins in 2011and beyond.
Operational achievements
The benefits of our new business model, Open SourceMobility, will only be realised through alignment of ouremployees, capabilities and functions to this new way ofworking, and by developing our partner network and therange of products and services we can offer to thosepartners. During 2010, we have achieved a number ofimportant operational goals towards this alignment:
New product development and product pipeline
We spent £17.0 million (2009 – £11.9 million) on researchand development activities. £7.2 million of this (2009 –£3.5 million) was invested in the successful developmentof our Omnii™ family of modular products andaccessories. This development will enable us to meetmarket needs more effectively and quickly. We releasedthe first of these modular products, the Omnii XT10, ontime and within budget, involving key partners andcustomers in extensive design and testing activities.Further modular products will be released through2011. An amortisation charge of £0.6 million wasrecorded following completion of the development ofthe Omnii XT10.
We invested a further £1.2 million (2009 – £nil) innew products which are nearing completion and willbegin shipping in 2011. These include a low cost personaldigital assistant (PDA) family, and enhanced connectivitythrough Code Division Multiple Access (CDMA)technology that opens up a sizeable market in NorthAmerica. These products will allow us to compete for thefirst time in the markets with the most attractive sizeand growth rates. The remaining £8.6 million (2009 –£8.4 million) was incurred on activities relating to ourexisting product portfolio.
Expanding our channels
We launched our open collaborative communityIngenuityWorking.com in March 2010, enabling us towork more closely with our technology and distributionpartners. We grew our partner base by 27% in theAmericas and 37% in EMEA. Our partner base wasreduced by 24% in Asia-Pacific, as we rationalised ourdistribution strategy in that region, resulting in a globaltotal increase of 29%.
We made substantial changes to our customer andpartner propositions, creating a differentiated offer thathas been well received. Revenues through indirectchannels accounted for 53.7% of total product revenuein the year (2009 – 47.6%). This was driven by theactions we took in 2009 and 2010 targeting around threequarters of product revenues through indirect channels.
Cautionary statement
This Operational Review has been prepared solely to provide additional information to shareholders to assess theGroup’s strategies and the potential for those strategies to succeed.
The Operational Review should be considered part of the Directors’ Report and contains certain forward-lookingstatements. These statements are made by the directors in good faith based on the information available to them upto the time of their approval of this report and such statements should be treated with caution due to the inherentuncertainties, including both economic and business risk factors underlying any such forward-looking information.
reVIew

PSION ANNUAL REPORT & ACCOUNTS 2010
20 / 21
Operational efficiency
We took a number of important actions towards ourobjective of optimising our organisational capability andoperating efficiency:> We reduced our delivery lead times through the
course of the year by an average of 42%.> We continued to reorganise our service business to
create a platform to create growth in recurringrevenue, along with commencing discussions withpotential managed service outsource providers.
> We continued to make substantial progress onproduct quality through coordinated effortsbetween sales, supply and engineering personnel.
> We implemented new sales management toolsacross the business to deliver furtherimprovements in sales and operations planning.
> We are planning the launch of a managed serviceproposition.
> We worked extensively to improve our organisationalculture and capabilities. An employee surveyconducted in the third quarter indicated asubstantial improvement in staff engagement andmotivation when compared with 2009.
> We completed our “European Streamlining Project”,restructuring our European legal entities consistentwith our simplified operating structure and go-to-market approach.
> In addition, we have been diligent in controlling ouroperating and supply chain costs, succeeding indelivering the targeted level of expense reductions.
In short, Psion made notable progress towards itsstated objectives in 2010 and we remain confident of ourability to substantially grow revenue, gross profitsand operating margins in 2011 and beyond. By growingour gross profits, we will benefit from the positiveoperational leverage introduced to the business throughactions taken in 2008 and 2009 under our ChangeProgramme. The significant majority of our operatingexpenses are either fixed or semi-fixed. While there willremain a need to grow our operating cost base to delivernew products and services, and penetrate newgeographical markets, we are increasingly working withour partners to deliver this growth. Consequently, ourbusiness model is designed to ensure that incrementalgross profit grows at a higher rate than incrementaloperating expense. It is this growth we believe willdeliver enhanced operating margins. To illustrate this,analyst consensus forecasts for 2011 and 2012 predict agrowth in gross profit of 8.4%. This results in a 79%increase in normalised operating profit.
PSION MADE NOTABLE PROGRESS TOWARDS ITS STATED OBJECTIVES IN 2010 AND WE REMAIN
CONFIDENT OF OUR ABILITY TO SUBSTANTIALLY GROW REVENUE, GROSS PROFITS AND OPERATING
MARGINS IN 2011 AND BEYOND.

FIN
AN
CIAL REvIEW
2010
Group normalised operating performanceReported Constant currency*
2010 2009 +/- 2009 +/-————————————— ————————————— ——————— ————————————— ———————
Revenue 174.5 170.0 4.5 167.8 6.7Gross profit 66.7 69.3 (2.6) 66.4 0.3Gross margin % 38.2% 40.8% 39.6%R&D expenses (17.0) (1 1.9) (5.1) (13.2) (3.8)Other operating expenses (51.6) (53.4) 1.8 (54.3) 2.7Total operating expenses (68.6) (65.3) (3.3) (67.5) (1.1)Normalised operating profit (1.9) 4.0 (5.9) (1.1) (0.8)Normalised operating margin (1.1)% 2.4% (0.6)%Exceptional inventory adjustment – (5.6) 5.6 (6.2) 6.2Net capitalisation of R&D 7.8 3.6 4.2 3.8 4.0Adjusted operating profit 5.9 2.0 3.9 (3.5) 9.4Restructuring and share-based expenses (0.2) (5.1) 4.9 (5.3) 5.1Reported operating profit 5.7 (3.1) 8.8 (8.8) 14.5
————————————— ————————————— ——————— ————————————— ———————
* Constant currency comparisons are made between 2010 reported income statement items and those of 2009by applying the average exchange rates for 2010 to the local currency amounts for the corresponding periodin 2009.
Fraser Park
Chief Financial Officer

Group revenue, as reported for the year, was £174.5 million, up 2.6%on 2009 (£170.0 million.) This was equivalent to constant currencygrowth of 4.0%. In local currency, the Americas grew by 4.6%, EMEAby 3.0% and Asia Pacific by 20.5%.
Of our three biggest contributing products (in revenue terms),the Workabout Pro delivered 4.6% sales growth for the year, withthe 7535 delivering 2.4% growth, and revenues from the Ikonreducing by 22.6%.
Gross margins in the year were 38.2% (2009 – 40.8% excludingan exceptional inventory provision of £5.6 million). Of this reductionin gross margin percentages, 1.1% arose from the effects of currency,while cost reductions materially offset slight reductions in averageselling prices. The balance of the reduction in gross margin arosefrom a shortfall in the performance of our service business.
Total operating expenses charged in calculating the normalisedoperating loss for the year were £68.6 million (2009 – £65.3 million asreported and £67.5 million as retranslated at constant currency rates).
As noted previously, we spent £17.0 million on research anddevelopment activities in the year (2009 – £11.9 million as reportedand £13.2 million at constant currency rates).
Other operating expenses were £51.6 million in 2010 (2009 –£53.4 million as reported and £54.3 million at constant currencyrates). This was comprised of:> Distribution expenses of £34.4 million (2009 – £36.4 million as
reported and £37.0m as retranslated at constant currency);> Administrative expenses (including marketing, legal, human
resources, information systems, finance and management) of£17.9 million (2009 – £17.8 million and £18.0 million asretranslated at constant currency); and
> Currency gains on hedging activities and transactions of£0.7 million (2009 – £0.8 million).
The Group’s 2010 financial performance has continued to be greatly impacted by volatilityin underlying trading currencies, more information on which is set out below. We woulddraw the reader’s attention to the table on page 22 where we set out both reported andconstant currency comparisons. All comparisons hereafter compare reported 2010 withreported 2009 performance unless specifically noted otherwise.
LOOKING TO THE FUTURE WITH CONFIDENCE…
perfOrmaNce
PSION ANNUAL REPORT & ACCOUNTS 2010
22 / 23

FIN
AN
CIAL REvIEW
2010
CO
NTIN
UED
Regional normalised operating performanceAmericas EMEA Asia Pacific Corporate Total
————————————— ————————————— ————————————— ————————————— —————————————Revenue £m:2010 reported 56.2 103.8 14.5 – 174.52009 reported 53.0 104.9 12.1 – 170.02009 constant currency 53.8 102.0 12.0 – 167.8Gross profit £m:2010 reported 22.4 45.8 6.1 (7.6) 66.72009 reported1 21.7 47.3 4.7 (4.4) 69.32009 constant currency1 21.9 44.5 4.6 (4.6) 66.4Normalised operating profit £m2:2010 reported 11.6 26.4 4.4 (44.3) (1.9)2009 reported 10.3 26.7 2.2 (35.2) 4.02009 constant currency 10.5 24.5 2.0 (38.1) (1.1)
————————————— ————————————— ————————————— ————————————— —————————————
1 Gross profit calculated excluding exceptional inventory provision of £5.6 million at reported exchange rates and £6.2 million at2010 exchange rates respectively.
2 Normalised operating profit is operating profit before capitalisation and amortisation of development costs, share basedpayments and exceptional items.
The reduction in distribution expense was drivenby the ongoing benefits of actions undertaken in 2008and 2009 to move increasingly to a channel-drivendistribution model. The aim of this change is to widenour addressable market and reduce our distributionexpense albeit partially offset by reductions in the grossmargins on distributor revenues.
The reduction in sundry administrative cost wasdriven by the ongoing benefits of Change Programmeactions taken in 2008 and 2009 offset by investmentsthat were made in marketing activities, including therebrand of Psion.
Normalised operating loss for the year was £1.9million, £5.9m lower than 2009 normalised operatingprofits of £4.0 million.
Net capitalisation of research and developmentexpense, which is covered in more detail at page 26 was£7.8 million compared with £3.5 million in 2009.
Adjusted operating profit for the year was £5.9 millioncompared with £2.0 million in 2009.
Exceptional operating costs were £0.3 million (2009– £5.4 million). The last part of the major restructuringprogramme which began in 2008 was substantiallycompleted in the year at a cost of £0.2 million (2009 –£4.5 million). In the continuing Japanese litigation, costsincurred in the year were offset by insurance recoveriesagainst costs incurred to date resulting in a net creditof £0.1 million (2009 – cost £0.4 million). Changesannounced to the Psion PLC Board incurred costscharged to exceptional items of £0.3 million (2009 –£0.5 million). Other items amounted to a gain of£0.1 million.
We are organised around three regional segmentssupported by the group global functions. Each regionhas a Vice President who is primarily responsible forgrowing revenue and gross profit, while also providingoversight on the day to day functional managementactivities of the region to meet the key targets set forthe region by the Board.
The Americas
The Americas is the largest geographic market forrugged computing solutions, estimated at US$890 millionin 2010. Our products currently have an estimated 5%share of the Americas market, contributing 32.2% ofour total Group revenues for 2010 (2009 – 31.2%). Ourmain products in the Americas are the Workabout Prorugged handheld computer (used by mobile workersacross a range of industries, including mobile fieldservices, logistics, warehousing, transportation,manufacturing and more); the 7535 rugged handheldcomputer (used predominantly for warehousingapplications); and, the 8525 rugged vehicle mountedcomputer (used in warehousing applications whereextremes of temperature and humidity are faced).
The launch of the low cost EP10 PDA family and theCDMA product is expected to occur towards the end ofthe first half of 2011.
The Americas achieved revenues of £56.2 million(2009 – £53.0 million) despite a competitive environmentdriven by larger competitors. Normalised operatingprofits were £11.6 million (2009 – £10.3 million).
Revenue growth was largely a result of an increasein widening our distribution channels. We had 491 channelpartners at 31 December 2010 (2009 – 386 partners).
We will continue to experience competitive pressurebut expect that we will maintain, if not grow, marketshare through further execution of our strategy and thelaunch of new products during 2011.
The Group’s operations in the Americas are basedin Mississauga, Ontario (manufacturing, back office anddevelopment office), and Hebron, Kentucky (sales andback office functions) with smaller sales offices in SouthAmerica.

PSION ANNUAL REPORT & ACCOUNTS 2010
24 / 25
EMEA
The EMEA market is estimated at US$760 million in2010. Our products currently have an estimated 13%market share of the EMEA market. It was our largestregion contributing 59.5% of our total Group revenuesfor 2010 (2009 – 61.7%). Our main products in EMEA arethe Workabout Pro rugged handheld computer, the 7535rugged handheld computer and our Ikôn rugged PDA(used by mobile workers in business process automationapplications). During the year we signed a partnershipagreement with major systems integrator BT GlobalServices, and won notable contracts through our channelpartners with Atos Origin, Heavey, Vodafone Spain andCoppernic. We signed an EMEA-wide business partneragreement with IBM Global Services in February 2011.
The EMEA region achieved revenues of £103.8million (2009 – £104.9 million) despite a competitiveenvironment driven by larger competitors and currency-related pricing pressures. Normalised operating profitswere £26.4 million (2009 – £26.7 million).
Revenue growth in underlying euros was largely aresult of improved sales and marketing of existingproducts and through the growth in the number ofchannel partners with whom we work. We had 552channel partners at 31 December 2010 (2009 – 402partners).
Adverse currency movements impacted grossmargins in EMEA in the second half of 2010. We willcontinue to experience pressure on margins but expectthat we will maintain if not grow market share throughfurther execution of our strategy and the launch of newproducts during 2011.
Asia Pacific
The Asia Pacific region is our newest, but fastestgrowing, region and we now have operations in Australia,India, Singapore and China. The Asia Pacific market isestimated at $430 million in 2010, and our productscurrently have an estimated 5% market share.
The Asia Pacific region achieved revenues of £14.5million (2009 – £12.1 million) largely through largecontract wins in China. Normalised operating profitswere £4.4 million (2009 – £2.2 million).
Overall, 2010 was an excellent year for the AsiaPacific region, with very strong growth continuingthroughout the year. Constant currency sales growth of20.8% was driven by the Workabout Pro and 7535rugged handheld computers and the 8525 ruggedvehicle mounted computer. We have rationalised ourdistribution network in the Asia Pacific region to focusin 2011 on partners that will deliver profitable growth.We had 42 channel partners at 31 December 2010 (2009– 55 partners).
Group operating performance – other
Exchange rates in 2010 and their impact on financialperformance
Each category of our comprehensive income statementis affected by a different mix of currencies. Furthermore,we operate worldwide in multiple currencies and seek tomatch our currency exposures on an economic basis. AsSterling is our reporting currency, differences arise whenfunctional currencies are translated into our reportingcurrency. Consequently, given exchange rate volatility in2010 and the break-even nature of current financialperformance, small changes in exchange rates can havea marked effect on reported results. We continue to seekexpansion of operating margins, and to generate growththat will enable us to better match our currencyexposure on an economic basis.
The Group purchases the majority of itscomponents and supplies in US Dollars as is customarypractice in the electronics industry. Although the Groupgenerates US Dollars from revenue transactions theseare not sufficient to cover the requirement for US Dollarsin aggregate or as they fall due. It should be noted that,as the Group generates a substantial portion of itsrevenue in Euros, and generates the majority of its costsof sale in US Dollars, we are particularly exposed to Euroweakness against the US Dollar. While the Group usesforward currency contracts to hedge short-termexpected net positions, any prolonged weakness in theEuro against the US Dollar will have a detrimental impacton our reported results.
THE REDUCTION IN DISTRIBUTION EXPENSE TO £34.4 MILLION FROM £37.0 MILLION
(CONSTANT CURRENCY) WAS DRIVEN BY THE ONGOING BENEFITS OF ACTIONS
UNDERTAKEN IN 2008 AND 2009 TO MOVE INCREASINGLY TO A CHANNEL-DRIVEN
DISTRIBUTION MODEL. THE AIM OF THIS CHANGE IS TO WIDEN OUR ADDRESSABLE
MARKET AND REDUCE OUR DISTRIBUTION EXPENSE, PARTIALLY OFFSET BY REDUCTIONS
IN THE GROSS MARGINS ON DISTRIBUTOR REVENUES.

In 2010, average rates between the Euro and theUS Dollar were 4.9% lower than average rates in 2009,adversely impacting the gross margins we experiencedon our Euro-denominated revenues.
We seek to mitigate the effect of this exposurethrough currency hedging activities. As at 31 December,as part of the programme of hedging a proportion offorecast cash flows one quarter ahead the group hadsold forward Euro 5.7 million against US Dollar at anaverage rate of 1.3206, compared with the rate on31 December of 1.3406 and had sold forward Euro 2.55million against Canadian Dollar at an average rate of1.3377, compared with the rate on 31 December of 1.3336.These hedges were more than at the December 2009year end as the Group took out hedges in early January2010 rather than ahead of the year end.
The reported results of the Group are also impactedby translational effects. During 2010 material movementsin the exchange rate of Sterling (the Group’s reportingcurrency) to the Euro, the US Dollar and the CanadianDollar continued. Generally, these movements had anoverall adverse effect on our reported operating results.
These trends affect the comparison of theStatement of Comprehensive Income and Balance Sheetto prior years as they consolidate transactions, assetsand liabilities predominantly recorded in currenciesother than Sterling. An average rate is used to translateitems in the Statement of Comprehensive Income butthe Balance Sheet is translated at year-end rates.
In assessing the average rates for the year appliedto the Statement of Comprehensive Income, Sterling hasappreciated by 3.9% versus the Euro, depreciated 1.2%versus the US Dollar, and depreciated by 10.0% againstthe Canadian Dollar when compared to average rates in2009. Year-end exchange rates were markedly worsethan the rates at 31 December 2009, but had generallyimproved versus the rates at 30 June 2010.
A further assessment of the effect of currency mixand translation and transaction exposures is consideredin a detailed appendix to the Operational Review onpages 30 and 31.
Research and development and capital expenditure
As noted at ‘New product development and pipeline’ onpage 20, the Group invested £17.0 million (2009 – £11.9million) on research and development. Of this, £8.4 million(2009 – £3.5 million) of development expenditure wascapitalised under IAS 38 “Intangible Assets”.
The research and development expenditure wasfocused on two main areas. The first was furtherinvestment in our modular technology platformamounting to £7.2 million which was capitalised (2009 –£3.5 million). This investment is intended to enable thebusiness to launch new products at a faster rate than hashistorically been the case. It is estimated thatdevelopment lead times will reduce to 6-12 months fromthe historical norm of 18-24 months. An amortisationcharge of £0.6 million was recorded followingcompletion of the development of the Omnii™ XT10.
FIN
AN
CIAL REvIEW
2010
CO
NTIN
UED
Secondly, we invested in accessories for modular products and a new non-modular product, specifically a low costPDA that will begin to ship in the first half of 2011. £1.2 million was invested in the year (2009 – £nil) which wascapitalised (2009 – £nil). A summary of capitalised costs is as follows:
2010 2009 2009 Constant CurrencyExpenses Labour Total Expenses Labour Total Expenses Labour Total
Project £m £m £m £m £m £m £m £m £m———————————— ———————————— ———————————— ———————————— ———————————— ———————————— ———————————— ———————————— ————————————
Platform 0.6 0.9 1.5 0.9 1.9 2.8 1.0 2.1 3.1Accessories 0.5 0.3 0.8 0.2 0.1 0.3 0.2 0.1 0.3HardwareOmnii 2.2 2.7 4.9 0.1 0.3 0.4 0.1 0.3 0.4EP 10 0.9 0.3 1.2 – – – – – –
———————————— ———————————— ———————————— ———————————— ———————————— ———————————— ———————————— ———————————— ————————————4.2 4.2 8.4 1.2 2.3 3.5 1.3 2.5 3.8—— —— —— —— —— —— —— —— ——
In addition to capitalised development expenditure,£6.4 million (2009 – £3.8 million) was spent on property,plant and equipment and other intangible assets.
Investment income
Investment income in the year was £0.1 million (2009 –£0.2 million) reflecting the low interest rates availableand the Group’s continued adoption of a cautiousinvestment strategy (see ‘Liquidity and investments’ onpage 29).

PSION ANNUAL REPORT & ACCOUNTS 2010
26 / 27
Finance costs
Finance costs in the year were £0.1 million (2009 –£0.1 million) arising mainly from interest on obligationsunder finance leases.
Profit before tax
Group profit before tax from continuing operations forthe year was £5.7 million, an £8.7 million improvementon the 2009 loss before tax of £3.0 million.
Taxation
Taxation was £3.0 million for the year, £1.8 million lowerthan last year. Whilst the Group generated profit beforetax, including discontinued operations, of £5.6 millioncompared to a loss before tax of £2.4 million in the prioryear, the reduction in the overall tax charge reflects higherutilisation of losses and a reversal of a provision foroverseas withholding tax. A deferred tax asset previouslyrecognised in the USA was written off in the year, leadingto a headline effective tax rate for the Group of 54.3%.The losses continue to be available to the Group and willbe reassessed for recognition as visibility into futuretaxable profits in the US entity improves.
Earnings (loss) per share
Basic earnings per share in 2010 was 1.81p (2009 – loss5.09p) and diluted earnings per share was 1.81p (2009 –loss 5.09p). For continuing operations only, basicearnings per share in 2010 was 1.90p (2009 – loss 5.52p)and diluted earnings per share was 1.90p (2009 – loss5.52p). The Board believes that a better appreciation ofthe continuing operations of the Group is given byadjusting for the charge for share-based payments, andexceptional operating costs. Adjusted basic earnings pershare on this basis was 2.07p (2009 – loss 3.18p).
Dividend and dividend policy
The Group’s dividend policy is progressive subject toalternative uses for capital. In line with this policy, theBoard has recommended a final dividend of 2.7p, to bringthe total dividend for 2010 to 4.0p (2009 – 3.8p), anincrease of 5.3%
Net assets increased by 0.5% to £178.5 million(2009 – £177.6 million) and net assets per share by0.4% to 126.8 pence (2009 – 126.3 pence). The mainmovements in the Balance Sheet items were principallydue to additional capitalised development expenditure –see ‘Research and development and capital expenditure’on page 26 – and the impact of foreign exchangemovements, and the change in net cash (see ‘Capitalstructure’ and ‘Cash flow’ on page 28).
The Group owns its facility and adjacent land inMississauga, Ontario. While there is currently nointention to sell this asset, it was valued by local propertyexperts in late 2010, and successful disposal at the statedlevel would generate a valuation upside of approximately£6 million compared with its net book value.
THE GROUP INCREASED INVESTMENT IN RESEARCH AND DEVELOPMENT TO £17.0 MILLION
(2009 – £11.9 MILLION). OF THIS, £8.4 MILLION (2009 – £3.5 MILLION) OF DEVELOPMENT
EXPENDITURE WAS CAPITALISED.
Financial position
Our Balance Sheet at 31 December 2010 can be summarised as set out in the table below:
2010 2009 Change£m £m £m
————————————— ————————————— —————————————Property, plant and equipment 11.5 9.9 1.6Goodwill and intangible assets 118.5 105.4 13.1Other non-current assets and liabilities (1.2) (2.4) 1.2Current assets and liabilities 11.1 14.6 (3.5)Deferred tax 3.7 6.0 (2.3)
————————————— ————————————— —————————————Total excluding net cash 143.6 133.5 10.1Cash and cash equivalents 36.9 45.3 (8.4)Finance lease obligations (2.0) (1.2) (0.8)
————————————— ————————————— —————————————178.5 177.6 0.9—— —— ——

Capital structure
The Group has no bank debt or other borrowings, savefor limited finance lease liabilities of £2.0 million (2009– £1.2 million). These liabilities relate entirely to theleasing of plant and equipment.
The Group held cash balances at the end of the yearof £36.9 million (2009 – £45.3 million). These balancesare invested according to the Group’s treasury policy(see ‘Liquidity and Investments’ on page 29). The directorsbelieve that maintaining a sound capital structure basedon access to liquid assets provides support to theGroup’s share price and the ability to make anynecessary investments to fulfil the Group’s objectives.
Working capital
2010 saw a mixed performance in the management ofworking capital relative to 2009. The tables belowhighlight the performance on trade debtors expressed indays sales outstanding (DSO) and inventory expressedin US Dollars and days sales inventory (DSI).
The improvement in EMEA arose throughimplementation of enhanced credit collection processesand systems. The increase in Americas DSO is driven bya higher proportion of revenues arising from distributorswho tend to be granted better credit terms than value-added resellers. Further, a higher proportion of the
Americas region revenues arose outside of the USA,tending to increase the credit period taken. The increasein DSO in Asia Pacific arises due to granting extendedterms to a large customer and delays in payment. We arecontinuing to monitor this situation closely, but have noindication that a bad debt provision is required.
The Group measures its inventory in US Dollars asthis is the major currency in which its component andassembly contracts are denominated.
Gross inventory has continued to decrease as aconsequence of improved sales and operations planningprocesses and increased efforts to utilise slower-movinginventory. These efforts have enabled a reduction in thelevels of inventory provision required.
Cash flow
Net cash generated by operations for 2010 was £8.4million (2009 – £21.8 million). Higher trading profit forthe Group was offset by a reduced cash inflow fromworking capital movements, and inventory in particular.The net of tax recovered, tax paid and interest paid wasan inflow of £1.5 million which was £4.9 million betterthan in 2009. Investing activities for 2010 resulted in anoutflow of £12.5 million which was £5.8 million higherthan the corresponding outflow last year. This wasprimarily due to higher investment on intangible assets(including product development costs) of £10.2 million,up from £4.7 million last year. Net cash used in financingactivities, principally dividend payments and repaymentof the capital element of finance leases, was an outflowof £6.1 million (2009 – £5.7 million).
FIN
AN
CIAL REvIEW
2010
CO
NTIN
UED
Average AverageDSO Dec 09 March 10 June 10 Sept 10 Dec 10 2010* 2009*
————————————— ————————————— ————————————— ————————————— ————————————— ————————————— —————————————EMEA 65 71 70 76 66 71 75Americas 52 54 61 59 49 56 43Asia Pacific 79 92 80 106 106 96 81
————————————— ————————————— ————————————— ————————————— ————————————— ————————————— —————————————Group 63 72 78 72 65 72 69—— —— —— —— —— —— ——* Calculated as an average of month-end DSO.
Average AverageInventory in US$ million and DSI Dec 09 March 10 June 10 Sept 10 Dec 10 2010* 2009*
————————————— ————————————— ————————————— ————————————— ————————————— ————————————— —————————————Gross 46.9 44.6 42.7 44.4 42.5 43.6 53.2Provisions 17.1 15.6 14.0 14.3 14.1 14.5 19.9Net 29.8 29.0 28.7 30.1 28.4 29.0 33.3DSI 74 88 91 92 73 86 103—— —— —— —— —— —— ——* Calculated as an average of quarter-end numbers.

PSION ANNUAL REPORT & ACCOUNTS 2010
28 / 29
Liquidity and investments
At 31 December 2010 the Group had £36.9 million cashinvested in accordance with the Group’s treasury policy.
Cash in excess of the day to day working needs ofsubsidiary undertakings is held by Psion PLC anddeposited in Liquidity Funds managed by HSBC plc. Useof these funds spreads the counterparty risk across agreater number of banks than would be manageable ifthe Group was making deposits with individual banks.During the year a proportion of the deposited cash wasswitched from Sterling to US and Canadian Dollarsas a part of the hedging policy of the Group. As at31 December the amounts deposited in Liquidity Fundswere:
2010 2009£m £m
————————————— —————————————
Sterling 7.7 31.5US Dollar denominated 9.7 –Canadian Dollar denominated 3.8 –
————————————— —————————————
21.2 31.5—— ——Pensions
The Group operates defined contribution schemes,where it contributes a pre-determined amountproportionate to the salaries of the participatingemployees to the schemes.
Accounting policies
The Group’s accounting policies are set out in note 2 tothe financial statements. Note 1 highlights thoseaccounting policies that are critical to an understandingof the Group’s performance and financial position,focusing on those which have required the particularexercise of judgement in their application and to whichthe results are most sensitive.
The impact of the adoption of new accountingstandards are detailed in note 1 to the financialstatements. Other than those arising from the adoptionof new accounting standards, no changes in accountingpolicies have occurred in the year.
Please refer to the section on risks and uncertaintiesfor an overview on treasury management activities.
Future developments
While the external commercial environment is expectedto continue to be affected by macro-economic andfinancial conditions in 2011, we have good momentumacross the Group.
We believe that we have an advantage in our OpenSource Mobility business model, enabling us to offer adifferentiated proposition to our customers and partners.
We have invested heavily in our modular technologyplatform, enabling us to meet customer needs better andlaunch products more rapidly than previously. We planto launch a number of modular products throughout2011, refreshing our product portfolio and offering areduced total cost of ownership to our customers.
With the planned launch of a low cost PDA deviceand a CDMA variant for the US market, we arepositioning ourselves in the more attractive, growingmarket segments. Furthermore, we are increasing ourfocus and resources in higher-growth emerging marketssuch as South America, India, China and Eastern EMEA.
A significant and growing portion of our productand service portfolio is sold through distributionchannels. This enables us to widen our addressablemarket without increasing the operational complexity ofour business.
We have a strong management team committed towinning in the market place and have clear goals andpriorities which focus the business on deliveringimprovements in growth and efficiency. Implementedacross the business in 2009 and 2010, our efficiencyprogrammes are now providing the additional funds toenable us to invest in our commercial programmes andcapabilities. In this way, we can exploit the full potentialof the solution portfolio we are building.
These factors should enable us to deliver superiorbusiness performance in the medium term, drivingenhanced shareholder returns. We now enjoy a businessmodel with positive operational leverage. We remaincommitted to generating growth in gross profits andrecurring revenues while retaining tight control onoperating expenses. We remain convinced that this willenable us to make substantial progress against ouroperating margin goals in 2011 and beyond.
WE PLAN TO LAUNCH A NUMBER OF MODULAR PRODUCTS THROUGHOUT 2011,
REFRESHING OUR PRODUCT PORTFOLIO AND OFFERING A REDUCED TOTAL COST OF
OWNERSHIP TO OUR CUSTOMERS. WITH THE PLANNED LAUNCH OF A LOW COST PDA
DEVICE AND A CDMA VARIANT FOR THE US MARKET, WE ARE POSITIONING OURSELVES
IN THE MORE ATTRACTIVE, GROWING MARKET SEGMENTS.

APPENDIX
Assessment of the effect of currency
As noted in the Operational Review, the impact ofcurrency exchange rate movements on the financialstatements can be pronounced. The purpose of thissection is to provide a more detailed assessment of this.
Currency mix
As can be seen in the above chart, the Grouppurchases the majority of its components and suppliesin US Dollars as is customary practice in the electronicsindustry. Although the Group generates US Dollars fromrevenue transactions these are not sufficient to coverthe requirement for US Dollars in aggregate or as theyfall due. It should be noted that, as the Group generatesa substantial portion of its revenue in Euros, andgenerates the majority of its costs of sale in US Dollars,we are particularly exposed to Euro weakness againstthe US Dollar. Throughout the year the exchange rate ofthe Euro against the US Dollar continued to fluctuate:
EUR USD
The US Dollar strengthened against the Euro in thefirst half of 2010, a trend that continued in the secondhalf. The average rate for the year was 4.9% lower thanthe average rate for 2009. While this currencymovement also affected our major competitors, theincrease in cost of sales that arose adversely impactedthe gross margins we experienced on our Eurodenominated revenues. We elected not to increase Eurolist prices, but sought to reduce discounts offered tomitigate the effect of this currency movement. Further,we sought opportunities to invoice European customersin US Dollars to hedge the impact on our gross profits,but with limited success in the year.
Differences between actual overseas currenciesreceived and paid and the amount that was originallybooked for the transactions results in differences whichare booked as an expense net of related hedgingtransactions. In 2010 the total recognised in thestatement of comprehensive income was £0.7 million(2009 – £0.8 million). As noted in the section on ‘NewProduct Development and Product Pipeline’ in theOperational Review on page 20, we are targeting growthin US Dollar markets that will enable us to better offsetthe current imbalance between US Dollar costs andrevenues in the medium term future. Please refer to thesection on ‘Risks and Uncertainties’ on page 33 forfurther information on foreign currency risks andactions taken to mitigate their impact.
Translation and transaction exposures
During 2010 material movements in the exchange rateof Sterling (the Group’s reporting currency) to the Euro,the US Dollar and the Canadian Dollar continued.Generally, these movements had an overall adverseeffect on our reported operating results.
These trends affect the comparison of theStatement of Comprehensive Income and Balance Sheetto prior years as they consolidate transactions, assetsand liabilities predominantly recorded in currenciesother than Sterling. An average rate is used to translateitems in the Statement of Comprehensive Income butthe Balance Sheet is translated at year-end rates.
In assessing the average rates for the year appliedto the Statement of Comprehensive Income, Sterling hasappreciated by 3.9% versus the Euro, depreciated 1.2%versus the US Dollar, and depreciated by 10.0% againstthe Canadian Dollar when compared to average rates in2009. Year-end exchange rates were markedly worsethan the rates at 31 December 2009, but had generallyimproved versus the rates at 30 June 2010.
Dealing with each in turn:
GBP EUR
Sterling appreciated against the Euro over the year,with the average rate for the year 3.9% higher than theaverage rate for 2009, a negative on our reportedresults given the weighting of ¤ denominated revenue.This appreciation was particularly marked in the secondhalf of 2010, adversely impacting our reported financialperformance for that period.
FIN
AN
CIAL REvIEW
2010
CO
NTIN
UED
100%
0% 6% 14%42%
2% 81% 6%1%10%
46% 16% 9% 7%22%
Revenue
COGS
OPEX
EUR CAD USD GBP Other
-11.0
%
-9.0
%
-7.0
%
-5.0
%
-3.0
%
-1.0
%
1.0%
3.0
%
5.0
%
H1 2010 vs H2 2009
H2 2010 vs H1 2010
FY 2010 vs FY 2009
-7.0%
-2.7%
-4.9%
-11.0
%
-9.0
%
-7.0
%
-5.0
%
-3.0
%
-1.0
%
1.0%
3.0
%
5.0
%
H1 2010 vs H2 2009
H2 2010 vs H1 2010
FY 2010 vs FY 2009
0.8%
4.0%
3.9%

PSION ANNUAL REPORT & ACCOUNTS 2010
30 / 31
GBP USD
Sterling marginally depreciated against the USDollar over the year with the average rate for the year1.2% lower than the average rate for 2009, a negativeon our reported results given the majority of cost ofsales is US Dollar denominated, as are a large part ofoperating expenses.
GBP CAD
Sterling depreciated markedly against the CanadianDollar over the year with the average rate for the year10.0% lower than 2009, a negative on our reportedresults given the weighting of Canadian Dollar operatingexpenses.
Most assets and liabilities in the 2010 Balance Sheetinclude items denominated in overseas currencies.Goodwill is entirely recorded in US Dollars and themovement in goodwill between balance sheet dates hasbeen caused by exchange rate movements. Themovement in assets and liabilities over 2009 includes asignificant element attributable to exchange ratemovements.
As an indication of the impact on the Balance Sheetthe table below shows actual 2010 working capitalcomponents, 2009 equivalent figures at 2010 rates ofexchange, and the reported 2009 figures.
The average rates and year end rates of the major currencies in 2009 and 2010 have been as follows:
Average Year End2010 2009 % change 2010 2009 % change
————————————— ————————————— ————————————— ————————————— ————————————— —————————————Euro / US Dollar 1.3263 1.3941 -4.9% 1.3406 1.4348 -6.6%Euro / Sterling 1.1656 1.1215 3.9% 1.1646 1.1255 3.5%US Dollar / Sterling 1.5448 1.5638 -1.2% 1.5613 1.6149 -3.3%Canadian Dollar / Sterling 1.6033 1.7821 -10.0% 1.5531 1.6930 -8.3%—— —— —— —— —— ——
The differences between these average and year end exchange rates should be noted when reviewing the Group’sfinancial statements.
2009at 2010
2010 exchange 2009£ million Reported rates Reported
————————————— ————————————— —————————————Inventories 18.2 19.5 18.4Trade and other receivables 48.3 47.4 46.3Trade and other payables (52.2) (50.8) (48.7)
————————————— ————————————— —————————————Net 14.3 16.1 16.0—— —— ——
In the consolidated cash flow statement movements in the reporting currency of the subsidiary businesses areconverted to Sterling at average rates.
-11.0
%
-9.0
%
-7.0
%
-5.0
%
-3.0
%
-1.0
%
1.0%
3.0
%
5.0
%
H1 2010 vs H2 2009
H2 2010 vs H1 2010
FY 2010 vs FY 2009
-6.2%
1.1%
-1.2%
-11.0
%
-9.0
%
-7.0
%
-5.0
%
-3.0
%
-1.0
%
1.0%
3.0
%
5.0
%
H1 2010 vs H2 2009
H2 2010 vs H1 2010
FY 2010 vs FY 2009
-10.4%
0.8%
-10.0%
RIS
kS
AN
D U
NCERTAIN
TIES
The Group is subject to risks and uncertaintiesrelating to future business which might affect itsfinancial performance and position. Not all of these risksare within our control. As reported last year, weimplemented an enhanced enterprise risk managementprocess in 2009. This has continued to be iterated in2010, with a view to embedding risk managementthroughout the business. The process is designed tomanage risks associated with physical, financial,customer, employee, supplier and organisational assets.
Progress on its implementation is regularlyreviewed by operational management and by executivedirectors. The Audit Committee is updated regularly andprovides guidance on areas of concern, enabling aprompt and effective response.
The Group maintains a register of all risks identifiedacross the business. These have been prioritised, basedon operational and Board assessment of the likelihoodand impact of each. Mitigating actions and controls havebeen implemented in line with the risk appetite andtolerance that has been agreed by the Board.
The principal risks (assessed by likelihood andpotential impact) faced by the Group, which might leadto shortfalls against market share and financialperformance goals, are:> An inability to offer a differentiated proposition to
customers and partners in established and newmarkets.
> Our Open Source Mobility approach, founded onmodular technology development and openinnovation to deliver customised solutions, may notbe accepted by the market or enable us to establishthought leadership over our competitors.
> A failure to adequately protect or expand ourintellectual property portfolio or claims from otherparties alleging patent infringement.
> Any failure or inability of outsourced electronicmanufacturing companies to supply us.
A detailed assessment of these principal risks andother risks is provided below:
Principal risks
Differentiation risks
The Group faces strong competition in the markets inwhich it operates, and in markets into which it intends toexpand. Our ability to compete effectively depends onthe pricing of equipment and services, the quality of ourproducts and customer service, development of new andenhanced products and services, the reach and qualityof our sales and distribution channels and our capitalresources.
Furthermore, our products may becomecommoditised over time, reducing margins, and ourefforts to develop and differentiate our products andservices may not be successful. We assessed the likelihoodof this risk as medium (having fallen over the year) andthe potential impact as high. We have taken a number ofmitigating actions, including, but not limited to:> Launch of increasingly differentiated offers to
customers and partners based on our Open SourceMobility strategy and superior total cost ofownership.
> An enhanced product quality programme ensuringthat new products are launched at improved qualitylevels, and issues with legacy products are resolvedfaster.
> Deployment of modular products with technologyfrom our partners, meeting customers’ needs betterand limiting the risk of commoditisation.
> Recruitment of more and better quality value-addedresellers, distribution, integration and technologypartners to widen our addressable market bothgeographically and in terms of the solutions weoffer (including hardware, software and services).
> Enhanced sales and operations planning processesand resources to provide better visibility of markettrends and coordination between the supply chainand sales.
IMPLEMENTATION OF OUR OPEN SOURCE MOBILITY MODEL, WILL ENSURE THAT WE ESTABLISH
THOUGHT LEADERSHIP, AND REMAIN INFORMED OF EMERGING TECHNOLOGY TRENDS, CUSTOMER
REQUIREMENTS AND OPPORTUNITIES TO EXTEND OUR OFFER INTO PROFITABLE MARKET SEGMENTS.

PSION ANNUAL REPORT & ACCOUNTS 2010
32 / 33
Technology and thought leadership risks
We operate in a sector characterised by rapidly changingtechnology. If we do not anticipate and respond to suchchanges in technology and to changes in customerdemands as a result of technological advance, we maylose market share and our competitiveness may reduce.
We have implemented a change programme, whichincludes restructuring our operations and changing theway in which the Group develops its products. If ourmodular approach to product development fails to work,or we fail to meet development timescales or wegenerate too narrow a product portfolio to addressgrowing and profitable market niches, the expectedbenefits from our change programme may not berealised. We assessed the likelihood and the potentialimpact of this risk as medium. Mitigating actions include,but are not limited to:> Implementation of our Open Source Mobility model,
ensuring that we establish thought leadership andremain informed of emerging technology trends,customer requirements and opportunities to extendour offer into profitable market segments.
> Successful development of a modular technologyplatform within expected timescales and budgets,allowing us to expand the volume of productvariants that can be offered to our customers tomeet their requirements better.
> Deployment of IngenuityWorking.com, enabling usto gain insight into customer and technology trendsfaster than previously.
Intellectual property and patent infringement risks
We operate in an industry where intellectual property is akey asset. A failure to adequately protect our intellectualproperty or expand our intellectual property portfoliocould damage our revenues and limit our growthprospects. Additionally, we may face claims from otherparties alleging patent infringement. If successful, this mayrequire us to pay royalties or stop selling our products.We assessed the likelihood and impact of this riskas medium. Mitigating actions include, but are notlimited to:> Recruitment of a highly experienced internal
resource to improve the protection of ourintellectual property.
> Increased focus on intellectual property protectionin our research and development activities,especially around our modular design process –resulting in a substantial increase in patent andtrade-mark applications relative to historical norms.
> Participation in industry joint defence groups tomitigate the risk and cost of defending actionsagainst “patent trolls”.
Supply chain risks
We are dependent on outsourced electronicmanufacturing companies for the manufacture ofsubstantially all of our current products and on a smallnumber of suppliers for key components. Any failure orinability of these companies to supply us could adverselyaffect our business.
Our supply chain is complex, and use of third-partysuppliers and service providers could adversely affectour product quality, delivery schedules or customersatisfaction. Any of these could have an adverse effecton our financial results. We assessed the likelihood ofthis risk as medium (a reduction over the year) and itsimpact as high (but falling). Mitigating actions include,but are not limited to:> Regular interaction with outsourced manufacturing
suppliers, including site visits at their premises andour own to ensure quality levels are improved.
> Enhancement of product specificationdocumentation to improve outsourcemanufacturing accuracy and quality.
> Enhanced new product introduction processinvolving outsourced manufacturing suppliers,ensuring that our products are easier tomanufacture.
> Improved relationships with strategic componentsuppliers, including membership of their productdevelopment ecosystems.
> Concerted efforts to reduce delivery lead timesthrough a newly centralised order managementfunction in EMEA, and improved management ofinventory.
> Mitigation of risks relating to sole or limited sourcesof supply through the design and sourcing ofalternate components and sub-assemblies.

Other risks
Further risks that we face and mitigating actions that wehave taken include:
Environment risks
Our products are high value items which are capital innature for our customers. Continuing adverse macro-economic conditions may cause our customers to deferor cancel expenditure and as a result we may not achieveour revenue and earnings forecasts. We assessed thelikelihood of this risk as medium (a reduction over theyear), and the impact as high. We have taken a numberof mitigating actions through our change programme,and effective execution of our strategy. These include,but are not limited to:> Significant cost reduction activity in 2009 to reduce
our fixed cost base.> Use of third-party outsourcing providers to reduce
our fixed cost base.> Growing the portion of our revenue through indirect
distribution, to reduce our direct sales cost baseand increase our market coverage.
> Deployment of a modular technology platform toincrease the number of product variants we canoffer and reduce development lead time.
> Development of a number of new products torefresh our offering, including lower cost productsand new wireless variants to open up new markets.
> Enhanced sales and operations planning processesand resources to provide better visibility of markettrends and coordination between the supply chainand sales.
Foreign currency risks
As highlighted in the Operational Review, our cash flows,revenue and earnings are exposed to currency exchangerate fluctuations. International sales are typically quoted,billed and collected in the customer’s local currency, asignificant proportion of which is denominated in Euros.However, our product costs are largely denominated inUS Dollars, Canadian Dollars and Chinese Yuan.Therefore, our margins are exposed to changes inforeign exchange rates.
When appropriate, we limit our exposure toexchange rate changes by entering into short-termcurrency exchange contracts. There is no assurance thatany hedging activity will be successful in mitigating suchforeign currency exchange risk, especially given thelimited visibility we have on our competitors’ activitiesin this area. Additionally, we are exposed to translationrisk as we report in Sterling while the majority of ourrevenues and costs are denominated in currencies otherthan Sterling.
Consequently, our reported results are subject tovolatility as a result of foreign exchange movements. Weassessed the likelihood of this risk as high (but falling)and the impact as high (but falling). Mitigating actionsinclude, but are not limited to:> Active management through hedging of our foreign
currency exchange risk through forward contractsand cash holdings in multiple currencies.
> Cross-functional coordination to ensure thatexchange rate fluctuations are considered in thepricing of our products and services.
> Development of new products that will generate ahigher proportion of US Dollar-denominatedrevenues to mitigate the imbalance with US Dollarcosts.
> Improved processes to mitigate exchange risksinvolved in larger, longer-term contacts, includingseeking opportunities to invoice in non-localcurrencies.
> Provision of clearer information to enableassessment by management and investors of thepotential impact of exchange rate movements onreported results.
Liquidity risks
A material portion of the Group’s net assets isrepresented by its cash balances. Any material loss ofcash through ineffective investment of these resourceswould undermine our ability to generate growth inshareholder value. Similarly, an inability to accessliquidity would undermine the Group’s ability to meet itsfinancial obligations. We assessed the likelihood of thisrisk as low, but with a high potential impact. Mitigatingactions include, but are not limited to:> Investment of cash in Sterling, Canadian and US
Dollar liquidity funds, under the Group’s treasurypolicy. These are managed predominantly by HSBC,although we also invested with RBS during the year.These liquidity funds are ring-fenced from eachother.
In the unlikely event that one of the funds isimpacted by a catastrophic loss, the other fundswould be unaffected. Investment in such funds –whose underlying investments are in a combinationof government gilts, commercial paper and shortterm deposits with a wide array of counter-parties –ensures that the risk of the collapse of a singlecounter-party is greatly mitigated. All the liquidityfunds are rated AAAm by recognised credit ratingagencies.
Each fund provides prompt access to cash,enabling the business to maintain liquidity on a dailybasis. The Board is satisfied that such an investmentapproach materially mitigates the risk of a loss ofcash, but will continue to monitor the financialmarkets and take appropriate action if necessary.
RIS
kS
AN
D U
NCERTAIN
TIES
CO
NTIN
UED

PSION ANNUAL REPORT & ACCOUNTS 2010
34 / 35
> Implementation of a globally coordinated cashsweeping system. Providing better visibility of cashresources at subsidiary level, this speeds uptreasury actions and enables faster access to liquidfunds, as well as enhancing controls.
> We have almost completed the transition of allbanking relationships worldwide to HSBC from arange of local and international banks whichgenerally have lower credit ratings than HSBC.
Regulatory risks
Global regulation and regulatory compliance, includingenvironmental, technological and standards-settingregulations, may limit our sales or increase our costs,which could adversely impact our revenues and resultsof operations. We are subject to domestic andinternational technical and environmental standards andregulations that govern or influence the design,components or operation of our products. Suchstandards and regulations may also require us to pay forspecified collection, recycling, treatment and disposal ofpast and future covered products. Changes in standardsand regulations may be introduced at any time and withlittle or no time to bring products into compliance withthe revised technical standard or regulation. Weassessed the likelihood of this risk as low, with a mediumpotential impact. Mitigating actions include, but are notlimited to:> Instigation of a Technology Committee, for regular
review of the main technology developments facingthe Group along with planning related actions.
> Undertaking concerted efforts to continue toimprove our product quality building from theaward of ISO 9001 in 2009 at our Mississauga andFrench operations where final stage productconfiguration is conducted.
> Initial action plans prepared to target ISO 14000environmental management accreditation in theforeseeable future.
Process risks
Our operating culture and processes may fail to supportthe attainment of our goals and objectives. This iscompounded by the dispersed geographic nature of ourlocal operations, and the related differences in languageand local cultures. We assessed the likelihood of this riskas high (but falling) and the impact as medium.Mitigating actions include, but are not limited to:> An annual employee survey to monitor employee
perceptions of management performance on arange of issues. These include clarity of the Group’svision, quality of communication by management,understanding of the link between employee rolesand the Group’s stated objectives, and staff morale.Results from our 2010 staff survey are included atpage 41.
> An ongoing project to standardise companyprocesses and improve documentation ofprocedures.
> Leadership conferences to communicate Groupstrategy, attended by senior and middlemanagement from the Group’s global organisation.In addition, senior management hold regular “townhall” meetings when visiting the Group’s globaloffices, reiterating key messages and takingquestions from local staff.
> Regular communication with our global workforcethrough our collaborative online community,IngenuityWorking.com – effecting positive changein our operating culture.
WE ARE MAKING CONCERTED EFFORTS TO CONTINUE TO IMPROVE OUR PRODUCT
QUALITY BUILDING FROM THE AWARD OF ISO 9001 IN 2009 AT OUR MISSISSAUGA AND
FRENCH OPERATIONS WHERE FINAL STAGE PRODUCT CONFIGURATION IS CONDUCTED.

The Group undertook a change programmeentailing the loss of a significant portion of its workforcein late 2008 and 2009. Further, the Group’s supply chainis complex and distribution activities combine directsales, and sales through value-added resellers,distributors and other channel partners. These activitiesand complexities may result in the loss of customers,partners, key employees or our ability to effectivelycompete due to perceptions that we are difficult to dobusiness with. We assessed the likelihood and impact ofthis risk as medium. Mitigating actions include, but arenot limited to:> Regular communication and consultation with
employees on the changes affecting the Group. Thisensures that all employees understand our newways of working, targets and expectations ofemployees in delivering on our objectives.
> Implementation of standardised, market-basedremuneration policies, and a globally standardisedpartner programme. These actions are intended toreward behaviours consistent with the Group’s goalsand objectives and to retain key staff.
> Measures designed to improve our supply chainperformance. These include reduction of deliverylead times and an increase in order managementand shipment accuracy, ensuring that sufficientinventory of core products is more readily available.
> Coaching key management personnel to ensurethat our staff are better coordinated andsupervised, leading to an increase in morale and jobsatisfaction.
Information for decision-making risks
The objectives and performance measures utilised bythe business may not be aligned with the Group’s overallbusiness goals and strategy. We assessed the likelihoodand impact of this risk as medium. Mitigating actionsinclude, but are not limited to:> Enhancement of our financial planning and analysis
resource, improving the quality and timeliness ofmanagement and key performance indicatorreporting. This has generated an improvedunderstanding of our performance, enabling us toamend our tactical actions to deliver progressagainst the Group’s stated objectives.
> Implementation of additional reporting tools andcontrols to improve consistency between internalmanagement reporting and external statutoryreporting.
> Rollout of enhanced sales and operations planningprocesses and resources to increase visibility ofmarket trends and improve coordination betweenthe supply chain and sales.
> Preparation of a multi-year strategic and financialplan, in addition to shorter-term budgets andforecasts, assessing progress against the Group’sgoals and objectives. These are regularly reviewedby operational and executive management, inaddition to the Board, to take account of changes inour competitive and technological environment.
It remains the goal of the Board to initiate aseparate internal audit function that will report to theAudit Committee in the near future. The business wasnot of a size where this was perceived as economic in2010. Internal audit activities are undertaken by acombination of in-house finance personnel and externalresources where and when appropriate.
Such activities have been reviewed and extendedthroughout 2010. The scope of work performed isregularly reviewed by the Audit Committee and the ChiefFinancial Officer and improvements adopted in light offindings, specific risk assessments and changes inprocess and procedures. A formal report is prepared atthe end of each audit visit and is discussed with localmanagement before being presented to the AuditCommittee.
RIS
kS
AN
D U
NCERTAIN
TIES
CO
NTIN
UED
MEASURES DESIGNED TO IMPROVE OUR SUPPLY CHAIN PERFORMANCE INCLUDE
REDUCTION OF DELIVERY LEAD TIMES AND AN INCREASE IN ORDER MANAGEMENT AND
SHIPMENT ACCURACY.

PSION ANNUAL REPORT & ACCOUNTS 2010
36 / 37
Key performance indicators
We have set ourselves six key targets:> To grow gross profit by a minimum of 5% per
annum.> To grow recurring revenues at a higher rate per
annum than total revenues.> To earn approximately three-quarters of product
revenue from channel partner relationships eachyear.
> To attain a normalised operating margin of 10%per annum.
2009 2010 Target————————————— ————————————— ————————————————————————————————————————————————————————
Financial KPIsGrowth in gross profit (1) (19.8)% (3.8)% 5% compound annual growthGrowth in recurring revenues(2) 0% (6.0)% Higher than Group average revenue growthPercentage of revenue from indirect channels(3) 47.6% 53.7% Generate c. 75% of product revenue through
channel by end 2013Normalised operating profit margin(4) 2.4% (1.1)% 10%+
Non-financial KPIsMarket share(5) 7% 7% Become number two in our addressable
market by end 2014Employee satisfaction(6) 52% 65% Continuous year-on-year improvement
————————————— ————————————— ————————————————————————————————————————————————————————
These financial targets are supported by non-financialtargets: > To achieve a number two market share across our
addressable markets by 2014.> To continuously improve employee satisfaction
year-on-year.
These key performance indicators (KPIs) are appliedon a Group-wide basis. The same indicators are used inexecutive management appraisal on a global andregional basis.
Performance in 2010 against these targets is set outin the table below, together with the prior yearperformance data. No changes have been made to thesource of data or calculation methods used in the year.
(1) Gross profit = revenue less cost of salesRevenue and cost of sales as per the financial statementsexcluding exceptional inventory adjustments of £nil(2009 – £5.6 million).
The purpose of this measure is to show how well thegroup is growing the income generated from its sale ofproducts and services. It is a key measure in assessingthe Group’s ability to reach its operating margin targetdue to the semi-fixed nature of operating expenses.
(2) Recurring revenue = revenues generated from multi-year contracts with customersManagement use recurring revenue to monitor theperformance of the service business on a monthly basis.
(3) Percentage of revenue from indirect channels = productrevenue from channel activities as a percentage ofrevenueRevenue derived from channel activities is from internalcompany data.
Revenue as stated in the consolidated incomestatement in the financial statements.
One of our business objectives is to increaserevenue growth via the channel to widen addressablemarkets gaining market share by encouraging channelpartners to substitute competitor revenues with Groupproducts and services. This indirect sales approach alsoreduces overall distribution costs.
(4) Normalised operating profit marginAs calculated on page 22 of the ‘Operational Review’.
Our key business objective is to build a sustainableoperating margin, balancing short-term financialperformance with the investment required to generategrowth in gross profitability and market share.
(5) Market share = revenue as a percentage of marketrevenuesRevenue as stated in the consolidated income statementin the financial statements.
Limited external verifiable sources for market shareexist. Accordingly data for market revenues are internalestimates based on information available for each of ourcurrently addressable markets.
Management use this measure to see how well theGroup is performing relative to its competitors.
(6) Employee satisfactionSource: internal company data extracted from annualemployee survey
The Group seeks to ensure that all staff understandthe objectives of the business and are motivated toundertake their daily activities in alignment with thosegoals. The trend in employee satisfaction is a keymeasure of management’s success in communicatingeffectively, managing Group resources efficiently, andengendering a positive operating culture.

BO
ARD
O
F D
IRECTO
RS
John HawkinsChairman NC*, RCJohn Hawkins, aged 57, joined Psion in May2002 as a non-executive director and wasappointed as Chairman on 18 September2009. He was formerly Chief Executive ofAtex Media Comman Limited and Chairmanof Genus plc and prior to that was ChiefExecutive of Anite plc where he wasresponsible for taking the Group from a £68million loss to a £30 million profit. He spent25 years with Philips Electronics mostrecently as Global Head of Multimedia andwas instrumental in formulating the DVDstandard. He is a non-executive director andChairman-elect of Vislink plc.
John ConoleyChief Executive Officer, TCJohn Conoley, aged 50, joined the Companyin the role of Chief Executive Officer in April2008 and has 25 years experience in thetechnology industry. He began his careerwith IBM. In his 14 years there, he progressedthrough a range of technical, sales andmarketing roles to general management.His sales and marketing experience at IBMincluded working with both indirect anddirect sales channel models. John hashandled a number of change managementand performance improvement roles sinceIBM. He was recently head of energycompany EON’s Corporate BusinessDivision, where he was responsible forimproving the performance and profitabilityof a division with sales of £1.5 billion. Priorto this, John had a number of directorshipsin the technology industry. This includedthe successful turnaround as CEO ofConvergent Systems Limited, prior to itsdisposal to Azzurri Limited. John was also,until joining Psion, a non-executive directorof specialist systems integrator Vistorm.
Fraser Park C.A.Chief Financial OfficerFraser Park, aged 47, was previously CFO ofOslo-listed communications technologycompany Tandberg Television ASA, a positionhe held until its successful disposal toEricsson, the Swedish telecoms business. Hehas held similar leadership roles at NASDAQand London-listed technology businesses.A member of the Institute of CharteredAccountants of Scotland, he is a formerstrategy consultant at McKinsey & Co, Inc.
John Hawkins
John Conoley
Fraser Park

Ross Graham F.C.A.Senior Independent Director, AC*, RC, NCRoss Graham, aged 63, joined Psion in December 2005as Chairman of the Audit Committee and of theRemuneration Committee since when he has also beennominated as the Senior Independent Director. He hasextensive experience in the technology sector havingworked from 1987 to 2003, initially as Finance Directorand latterly as Corporate Development Director ofMisys plc, a leading global software product andsolutions provider. He is also a non-executive directorof Wolfson Microelectronics Plc, where he chairs theAudit Committee.
Mike O’LearyIndependent Non-executive Director, RC*, AC, NCMike O’Leary, aged 58, joined Psion in October 2006and became Chairman of the Remuneration Committeein January 2010. He spent 20 years in the IT industryincluding 15 years on the main Board at Misys PLCfollowed by CEO appointments at Huon Corporationand at Marlborough Stirling PLC. Mike is a non-executive director of Headlam PLC and the Stroud &Swindon Building Society. He is also Chairman of DigitalHealthcare Ltd.
Stuart CruickshankIndependent Non-executive Director, AC, RC, NCStuart Cruickshank, aged 57, joined Psion in June2009. He is a non-executive director and Chair of Auditat Barking, Havering and Redbridge University NHSTrust and has a consulting role with Ernst & Young LLP.He is Chairman of InternetQ Plc and a member of theAudit Committee of the British Medical Association.Previously, he was Director General and CFO at HMRevenue and Customs. He has served as the CFO oftechnology services group Morse and was the GroupFinance Director of the video games company Eidos.He worked at Kingfisher as Finance Director ofWoolworth PLC and had early career roles at UnitedBiscuits, Diageo and Whitbread.
Toby RedshawIndependent Non-executive Director, TCToby Redshaw , aged 48, joined Psion in May 2010. InJanuary 2011 he joined American Express as ChiefInformation Officer having previously been ChiefInformation Officer for Aviva plc. Prior to that he spentsix years at Motorola and his early career was spentat FedEx.
Key:AC – Audit CommitteeRC – Remuneration CommitteeNC – Nominations CommitteeTC – Technology Committee* Committee Chairman
Ross Graham Mike O’Leary
Stuart Cruickshank Toby Redshaw
38 / 39PSION ANNUAL REPORT & ACCOUNTS 2010

The directors present their annual report together with the financial statements and auditor’s report for the year ended 31 December 2010.
The Report on corporate governance set out on pages 46 to 49 forms part of this report.
principal activities
The principal activities of the Group are providing mobile computer hardware, integration services and product support and maintenance to
customers for their enterprise systems. The subsidiary undertakings principally affecting the profits and net assets of the Group in the year
are listed in note 16 to the financial statements.
Business review
The Company is required by the Companies Act to set out a fair review of the business of the Group during the reporting period (including an
analysis of the position of the Group at the end of the reporting period and the principal risks and uncertainties facing the business). Details of
this review are contained in this “Directors’ Report” and the following sections of the “Annual Report and Accounts”:
> Chairman’s Statement – pages 4 to 6
> Chief Executive Officer’s Review – pages 10 to 13
> Operational Review – pages 20 to 36
> Key Performance Indicators – page 37
> Corporate Social Responsibility Report – pages 43 to 45
Each of these sections is deemed to be part of this Directors’ Report.
results anD DiviDenDs
The audited financial statements for the year ended 31 December 2010 are set out on pages 59 to 90. The profit after tax from continuing
operations was £2.7 million (2009 – loss of £7.8 million). The directors recommend a final dividend of 2.7p per ordinary share (2009 – second
interim dividend 2.6p) to be paid, subject to shareholder approval, on 13 May 2011 to shareholders on the register on 15 April 2011. Together
with the interim dividend of 1.3p per share paid on 17 September 2010, this makes a total dividend for the year of 4.0p (2009 – 3.8p) per share.
research anD Development
The directors consider that research and development is vital to the Group’s success in the future. Research and development expenditure – which
includes the costs of the Group’s engineering staff, as well as approval costs and external contracts for specialist engineering such as design for
manufacture – of £8.6 million (2009 – £8.4 million) was charged to the income statement. As reported in the ‘Financial Review’ on page 26, the
development costs of the modular platform, which forms the basis of a number of new and replacement products over the coming years, together
with those other development projects identified on page 26, have been capitalised under the requirements of IAS 38 “Intangible Assets”. The
amount capitalised in 2010 was £8.4 million. The Board monitors major development projects during product development and after launch.
Directors
Full biographical details of the directors during the year ended 31 December 2010 and at the date of this report are set out on pages 38 and 39.
The Company announced on 4 November 2010 that Fraser Park would be leaving the Company on 31 March 2011. The Company announced on
2 February 2011 that Adrian Colman would be joining the Company as CFO during April 2011. Toby Redshaw joined the Board as a non-executive
Director on 10 May 2010 and a resolution proposing his re-election will be put to the forthcoming AGM. In accordance with the Company’s
Articles of Association, Ross Graham and John Hawkins will retire by rotation and will seek re-election to the Board at the forthcoming AGM.
In appointing or replacing directors, the Company is governed by its Articles of Association, the Combined Code, the Companies Acts and
related legislation. The Articles themselves may be amended by special resolution of the shareholders. The powers of directors are described
in the Main Board Terms of Reference, copies of which are available on request, and the Report on Corporate Governance on pages 46 to 49,
which is incorporated by reference into this Directors’ Report.
Directors’ conflicts of interest
Procedures are in place to ensure compliance with the directors’ conflict of interest duties set out in the Companies Act 2006. The Company
complied with these procedures during the year ended 31 December 2010 and the Board believes that these procedures operate effectively. No
new conflict or potential conflict matters were approved during the year.
share capital anD suBstantial shareholDers
Details of the authorised and issued share capital, together with details of the movements in the Company’s issued share capital during the
year are shown in note 26. The Company has one class of ordinary shares which carry no right to fixed income. Each share carries the right to
one vote at general meetings of the Company.
There are no specific restrictions on the size of a holding nor on the transfer of shares, which are both governed by the general provisions
of the Articles of Association and prevailing legislation. The directors are not aware of any agreements between holders of the Company’s
shares that may result in restrictions on the transfer of securities or on voting rights.
At the Annual General Meeting (“AGM”) held on 7 May 2010, shareholders approved a resolution giving the Company authority to purchase
up to 14,053,989 Ordinary Shares. No shares were purchased during the year under this authority which will expire at the forthcoming AGM.
Accordingly, at the 2011 AGM the directors will be seeking to renew the authority to make market purchases of up to a maximum of 10% of the
issued share capital of the Company. At the present time the Company has no plans to exercise this authority.
The issued share capital was increased by 175,895 Ordinary Shares during the year as a result of the issue of 175,895 new Ordinary Shares
on the exercise of share options under the Company’s share plans. At 31 December 2010 the issued Ordinary Share Capital totalled 140,748,422
shares (2009 – 140,572,827 shares).
No person has any special rights of control over the company’s share capital and all issued shares are fully paid.
Dir
ecto
rs
’ r
epo
rt

As at 3 March 2011, the Company has been notified of the following interests in its Ordinary Shares of 15p each, excluding directors’
interests, which represent 3% or more of the issued Ordinary Share Capital:
Number of % of shares shares held in issue ———————— ——————
Fidelity Investments (UK) 14,038,685 9.97
Schroder Investment Mgt 1 1,962,385 8.50
Sterling Strategic Value Ltd 1 1,521,484 8.19
David Potter Esq 9,072,972 6.45
J O Hambro Capital Mgt 8,044,288 5.72
UBS Global Asset Mgt 7,047,368 5.01
Aviva Investors 6,379,004 4.53
Legal & General Inv Mgt 6,073,472 4.32
M & G Investment Mgt 4,850,534 3.45 ———————— ——————
Directors’ interests
The directors’ interests in the Ordinary Shares of the Company at 31 December 2010 and details of directors’ share options are detailed in the
‘Directors’ Remuneration Report’ on pages 50 to 55.
Directors’ anD officers’ insurance
The Company maintains insurance cover for all directors and officers of Group companies against liability which may be incurred by them whilst
acting as directors and officers. The Company has provided qualifying third-party deeds of indemnity for the benefit of each director who held
office during the 2010 financial year and these remain in force at the date of this report.
charitaBle anD political Donations
No contributions have been made to political parties. Donations are made to charities close to our facilities or to which the Group has some
connection, for example, through the voluntary work of an employee. The total charitable donations in 2010 were £16,000 (2009 – £22,000).
change of control provisions
There are a limited number of agreements that take effect, alter or terminate upon a change of control of the company including employees’
share plans and supply contracts. None of these are considered to have a significant effect in terms of their likely impact on the business of the
group as a whole as, in the case of supply contracts, there are adequate notice periods before termination can be effected and alternatives for
supply exist. Furthermore, the directors are not aware of any agreements between the company and its directors or employees that provide for
compensation for loss of office or employment that occurs because of a takeover bid.
supplier payment policy
The Group’s policy for supplier payment is set out in the Operational Review on page 29.
employment policies anD employee relations
Our employment policies are developed to reflect local legal, cultural and employment requirements. We aim to be recognised as an employer
of choice and therefore seek to maintain high standards and good employee relations wherever we operate.
Diversity
Our objective is to create a supportive culture in which all employees can develop their skills, advance their careers and maximise their potential.
No one will be discriminated against on the grounds of gender, marital status, family status, sexual orientation, religious beliefs, age, disability,
race or culture. Psion will comply with any local laws related to non-discrimination in the workplace. The Group does not tolerate any sexual,
physical or mental harassment. The Group does not employ underage staff.
Applications for employment by disabled persons are always fully considered, bearing in mind the aptitudes of the applicant concerned.
In the event of members of staff becoming disabled every effort is made to ensure that their employment with the Group continues and that
appropriate training is arranged. It is the policy of the Group that the training, career development and promotion of disabled persons should,
as far as possible, be identical to that of other employees.
Employee engagement
The Group places considerable value on the involvement of its employees and has continued to keep them informed on matters affecting them
and the performance of the Group through regular email communications from the Chief Executive Officer, formal and informal meetings, and
through the Group intranet. Furthermore, communication and feedback on Group strategy and objectives is undertaken on the Group’s open
collaborative community IngenuityWorking.com. All employees, including directors, have access to this website and are encouraged to participate
in discussions on all matters relating to the business. A comprehensive all-employee survey is conducted annually to obtain employees’ views
on a wide range of matters affecting their current and future interests, the results of which are summarised below. 82% of group employees
participated in the survey.
> Overall job satisfaction increased by 13 percentage points to 65%;
> Overall organisation satisfaction with the Group’s strategic direction increased by 23 percentage points to 69%;
> Staff morale was reviewed by surveying employee perceptions of Psion as an employer with scoring on the underlying questions ranging
from 59% to 79%, in line with external benchmarks;
Dir
ecto
rs
’ r
epo
rt
40 / 41psion annual report & accounts 2010

employment policies anD employee relations (continueD)
Employee engagement (continued)
> 68% of employees provided a favourable assessment of the Group’s efforts to disseminate information and communicate effectively with
staff, an increase of 34 percentage points over the 2009 survey results; and
> Favourable progress was also seen on a range of other dimensions.
Development and training
We are committed to helping people reach their full potential through ongoing training and development. Employees have access to a range of
learning and development programmes including online learning programmes, local training events and other development programmes.
In 2010, we concentrated specifically on the area of management training and, through a series of internal face to face coaching sessions
and training courses, we have provided training to our managers in areas such as basic leadership skills, performance management, managing
discipline and effective communication.
Performance, reward and recognition
Annual performance dialogues are mandatory to enable each employee to receive a performance rating which is the basis for development
planning and reward decisions. We reward employees based on their performance, potential and contribution to the success of the business.
We want to ensure that our people feel their efforts are recognised. We aim to provide competitive and fair rates of pay and benefits.
We monitor employee views of the compensation packages we offer through our annual employee survey and through regular dialogue
with staff.
Health, safety and well being
The Company is committed to ensuring that our people can do their work safely, and believe all incidents and injuries are preventable. We also
aim to help employees balance work and family commitments, manage stress and have a healthy lifestyle.
auDitor anD Disclosure of information to auDitor
Deloitte LLP has expressed its willingness to continue in office as auditor and a resolution to reappoint Deloitte LLP will be proposed at the
forthcoming AGM. The Audit Committee confirms that it has conducted an assessment of the external auditor and determined that adequate
policies and safeguards are in place to ensure that their independence and objectivity has not been impaired.
Each of the directors at the date of approval of this report confirms that:
i) So far as the director is aware there is no relevant information of which the Company’s auditor is unaware.
ii) The director has taken all steps he is obliged to as a director to make himself aware of any relevant audit information, and to establish
that the Company’s auditor is aware of that information.
This confirmation is given and should be interpreted in accordance with the provisions of Section 418(2) of the Companies Act 2006.
annual general meeting (“agm”)
The AGM is to be held at 45 Moorfields, London, EC2Y 9AE on 6 May 2011 at 10am. The Notice of Meeting is contained in the circular
accompanying this Annual Report, together with an explanation of the resolutions to be considered at the meeting.
going concern
The Group’s business activities, together with the factors likely to affect its future development, performance and position are set out in the
‘Operational Review’ on pages 20 to 36. The financial position of the Group, its cash flows and liquidity position are described in the ‘Operational
Review’. In addition notes 19 and 21 to the financial statements include details of policies and processes for managing the Group’s capital, use
of financial instruments and exposures to credit risk, treasury risk and market risks.
The Group has £36.9 million of cash, a strong balance sheet, and its rigorous approach to operations and working capital management
will continue to provide sufficient sources of liquidity to fund its business risks. As a consequence, the directors believe that the Group is well
placed to manage its business risks successfully despite the current economic outlook, which remains uncertain.
After reviewing the forecast cash flow and working capital requirements for the period until March 2012 (including the most up-to-date
information available on the dispute in Japan at the time of approving the annual report and consolidated accounts as disclosed in note 31),
the directors have a reasonable expectation that the Group has adequate resources to continue in operational existence for the foreseeable
future. Accordingly, they continue to adopt the going concern basis in preparing the Annual Report and Accounts.
By order of the Board
Lynne Sanderson
Company Secretary
3 March 2011
Dir
ecto
rs
’ r
epo
rt


environmental matters
Activity/area Objective Target Status Comment———————————— —————————— ——————————————— —————————————————— ——————————————————————
Supply chain Optimise the flow Identify reduced traffic Product identified for launch in Other products will follow based upon
of materials and routes for one of our mid-2011 will be used as a pilot the outcome of this project.
finished goods high volume products project for in-region fulfilment.
This in turn will reduce the
travel distance and duration.———————————— —————————— ——————————————— —————————————————— ——————————————————————
Supply chain Heighten supplier Ensure that our supplier Presently this process is The period of 2011 through 2012 will
awareness and partners adopt and considered to be ongoing. focus on establishing auditable
adoption of demonstrate systems, One of our key supplier compliance for the majority of our
environmentally processes, controls and partners representing roughly suppliers. EMS (Electronics
responsible reporting that validates 30% of our supplied goods is Manufacturing Services) providers
processes and their contribution to a founding and active member form the focus and priority and is
practices environmentally of the EICC and has expected to conclude early in the
acceptable behaviours. demonstrated compliance with 2012 period.
Industry recognised all relevant requirements.
consortiums such as the Further activity is underway
EICC (Electronics Industry with the balance of our supply
Code of Conduct) will be chain to ensure effective
used to measure both the programmes are underway.
maturity and effectiveness
of the supplier’s efforts.———————————— —————————— ——————————————— —————————————————— ——————————————————————
Product Reduce the Reduce the level of Most notable to our latest As we continue to expand upon our
environmental environmental waste product offering is the use of a modular product architecture and use
impact of associated with the modular platform. This allows of social media we expect that our
deployed retirement and/or the customer to keep the ‘re-use and re-configure’ programme
hardware (focus consumption of hardware. primary device in service much will greatly reduce the impact of
on all new longer and perform upgrades at retired assets requiring disposal. This
products) a ‘module’ level as opposed to in turn contributes greatly towards our
complete device replacement. overall responsibility to globally
acceptable environmental behaviours.———————————— —————————— ——————————————— —————————————————— ——————————————————————
Product Reduce the Reduce the level of A number of initiatives have Significant progress has been made
environmental environmental waste been launched to minimise the and our new product designs will
impact of associated with the level of hardware disposal. continue to provide benefits in this
deployed retirement and/or Generically we have employed area.
hardware (focus consumption of design and fabrication methods
on batteries) hardware. to extend the life of batteries
used in our products. This
lowers the cycle of disposal
hence lowering the volume
of material requiring special
treatment at the point of
replacement. ———————————— —————————— ——————————————— —————————————————— ——————————————————————
Product Reduce the use of To ensure that at a Using REACH (Registration, The use of REACH is one of many
environmentally minimum we comply Evaluation, and Authorisation regionally imposed requirements that
‘unfriendly’ with the latest of Chemicals) as a guideline we have adopted to ensure acceptable
substances in the requirements as applied we are surveying all materials policy and practice.
manufacture of by applicable local and substances used in the
both materials government agencies. manufacture of our products
and finished and will continue to monitor
goods. manufacturing of our products
in order to maintain compliance.———————————— —————————— ——————————————— —————————————————— ——————————————————————
Site operations Enhance the use Electricity consumption Energy efficient lighting To be considered as the first phase as
of energy optimal reduction systems are planned for we employ similar initiative across
mechanisms and installation in the 2011 period all sites.
processes thus
improving site
efficiency.———————————— —————————— ——————————————— —————————————————— ——————————————————————
Site operations CO2 emission Achieve a measurable Building automation system To be considered as the first phase
reduction reduction by 2010 installed to optimise the use of as we employ similar initiative across
year-end systems. Estimated reduction all sites.
of 10% natural gas usage has
been achieved.———————————— —————————— ——————————————— —————————————————— ——————————————————————
co
rpo
rate s
ocial r
es
po
ns
iB
ility r
epo
rt

environmental matters (continueD)
Activity/area Objective Target Status Comment———————————— —————————— ——————————————— —————————————————— ——————————————————————
Site operations Implement Achieve ISO 14001 Formal implementation planned Present systems and process meet
a formal registration for the 2011 period the intent of the subject standard.
compliance and This next step will introduce a
control system formal/auditable system.———————————— —————————— ——————————————— —————————————————— ——————————————————————
Site operations Implementation Ensure a consistent Our corporate facility has an Programme alignment with other
of a robust waste programme is adopted active waste management sites in work.
management by all sites by the end system in place that addresses;
programme of 2011. e-waste and all recyclable
hence reducing materials.
the impact to
general disposal.———————————— —————————— ——————————————— —————————————————— ——————————————————————
Site operations Increase New idea generation Implementation of the Programme to begin training and
employee ISO 14001 Standard will be orientation by 2011-Q3
awareness used to broaden the exposure
and involvement of our
employee population.———————————— —————————— ——————————————— —————————————————— ——————————————————————
Our environmental policy is to meet the statutory obligations placed upon us and to encourage our employees to promote environmentally
sound working practices. The Group complies with the requirements of the Waste Electrical and Electronic Equipment Directive and the RoHS
Directive in the European Union, both of which promote environmentally sound business operations and help protect the environment.
Our two major outsourced manufacturing providers (representing approximately 90% of our outsourcing expenditure) are certified to
the ISO 14001 Environmental Standard.
The development of a Group global environmental initiative is in its early stages. Our office in Mississauga, Ontario, Canada has a variety
of programmes in place to limit the use of energy through building automation which reduces electricity usage in ‘off-hours’, as well as reducing
waste output through the use of recycled materials, biodegradable products, and recycling in accordance with local government programmes.
As these programmes mature and take hold, an effort to apply similar disciplines will be reviewed for other facilities. We have also installed
teleconferencing in our principal locations to reduce air travel and seek to maximise the use of electronic media rather than paper-based media
in our marketing and promotional materials.
co
rpo
rate s
ocial r
es
po
ns
iB
ility r
epo
rt
44 / 45psion annual report & accounts 2010

The Group is committed to high standards of corporate governance, which it considers are critical to business integrity and to maintaining
investors’ and other stakeholders’ trust in the Group. The Group expects all directors and employees to act with honesty, integrity and fairness.
With an international presence, the Group strives to act in accordance with the laws and customs of the countries in which it operates; adopt
proper standards of business practice and procedure; operate with integrity; and observe and respect the culture of every country in which it
does business.
statement of compliance with the comBineD coDe
As part of this commitment to maintaining high standards of corporate governance, the Board applies, where they are deemed appropriate,
the principles of corporate governance set out in the Combined Code (“the Code”) as issued by the FRC in June 2008. The directors confirm
that the Company was compliant with all relevant provisions of Section 1 of the Code throughout 2010 and up to the date of the Directors’
Report. The Combined Code can be found on the FRC website (www.frc.org.uk). Further explanation of how both the main provisions and the
supporting provisions have been applied is set out below and in the Directors’ Remuneration Report on pages 50 to 55.
Board Composition and Operation
The Board comprises the non-executive Chairman, two executive directors and four non-executive directors. Toby Redshaw was appointed as
an independent non-executive director on 10 May 2010. All of the non-executive directors are considered by the Board to be independent. Ross
Graham is the nominated Senior Independent Director (“SID”) and is available to shareholders if they have concerns that have not been resolved
through normal channels. Biographical details of the directors are set out on pages 38 and 39.
The division of responsibility between the Chairman and Chief Executive Officer is formally defined, set out in writing and reviewed by the
Board regularly. The Chairman’s principal responsibilities are to ensure the Board operates effectively and that it plays a full and constructive
part in the development and determination of the Group’s strategy and commercial objectives. The Chief Executive Officer’s primary
responsibility is leading and running the Group and formulating and implementing the Group’s strategic and commercial objectives.
The Board has approved a formal schedule of matters reserved for its decision which it reviews annually. The Board makes decisions and
reviews and approves key policies and decisions of the Group in particular relating to:
> Strategy and values;
> Corporate governance;
> Structure and capital;
> Financial reporting and external communications;
> Annual operating and expenditure budgets;
> Treasury policies;
> Significant capital and revenue projects;
> Risk management strategies including approach to/appetite for risk;
> Systems for internal control;
> Remuneration policies;
> Acquisitions and disposals; and
> Any other matter which has a material consequence for the Group.
The Board has delegated all authorities other than those contained in the schedule of matters reserved to the executive directors on the
understanding that they will at all times act in accordance with the best interests of the Group, its shareholders and staff and that their actions
will be consistent with the Group’s financial and strategic plans and objectives and in conformity with relevant legislation and best practice and
that they will report regularly to the Board on the execution of these responsibilities.
The Board met 1 1 times during the year, excluding ad hoc meetings convened solely to deal with procedural matters. Attendance at Board
and Committee meetings during 2010, expressed as the number of meetings attended compared to the number entitled to attend, was as
follows:
Audit Remuneration Board Committee Committee No. attended No. attended No. attended ———————————— ———————————— ————————————
Chairman
John Hawkins 1 1/1 1 5/5* 2/3
Executive Directors
John Conoley 1 1/1 1 5/5* 2/3*
Fraser Park 1 1/1 1 5/5* N/A
Non-executive Directors
Stuart Cruickshank 1 1/1 1 5/5 3/3
Ross Graham (SID) 1 1/1 1 5/5 3/3
Mike O’Leary 1 1/1 1 5/5 3/3
Toby Redshaw(1) 5/7 N/A N/A ———————————— ———————————— ————————————
* by invitation
(i) Toby Redshaw is not a member of the Audit Committee or the Remuneration Committee.
repo
rt o
n co
rpo
rate g
over
nan
ce

statement of compliance with the comBineD coDe (continueD)
Board Composition and Operation (continued)
At the invitation of the relevant committees, the Chief Financial Officer and Chief Executive Officer usually attend Audit Committee
meetings and the Chief Executive Officer sometimes attends Remuneration Committee meetings. Where directors are unable to attend Board
meetings they are advised of the matters to be discussed in advance of the meeting and given the opportunity to provide their views to the
Chairman or Senior Independent Director. The Chairman meets with the non-executive directors without the executives present at least annually
as well as at other times as necessary. Likewise, the Senior Independent Director meets at least annually with fellow non-executive directors
without the Chairman present. The Chairman ensures that the Board is supplied with timely information in a form and of a quality appropriate
to enable it to discharge its duties.
The terms of appointment for the non-executive directors are available for inspection at the Company’s registered office during normal
business hours and for 30 minutes prior to, and during, the AGM. All directors offer themselves for re-election at the first AGM subsequent to
their appointment and at least once every three years thereafter. Toby Redshaw was appointed during the year and a resolution proposing his
re-election will be put to the forthcoming AGM. In accordance with article 78 (ii), Ross Graham, who has not retired at the previous two annual
general meetings, retires from office by rotation and offers himself for re-appointment by shareholders. In accordance with article 78 (iii) John
Hawkins, who has held office with the Company for a continuous period of 9 years, retires from office and offers himself for re-appointment by
shareholders. Biographical information and terms of appointment for each of the directors are set out on pages 38 to 39 and 52 to 53. All other
directors have been re-elected within the last three years. The Chairman confirms that, having taken into consideration the results of the
performance evaluation undertaken in the year, the directors being proposed for re-election have demonstrated commitment to their
responsibilities and continue to perform effectively.
The directors confirm that they have conducted an evaluation of the performance and effectiveness of the Board for 2010. The directors
met with the Chairman on a one-to-one basis and discussed matters of performance, structure, objectives and process of the Board and its
individual members. The interview process was selected because it was felt that it offered a more in-depth exploration of performance than the
questionnaire used in former years. The results were then reported back to the Board. The Board identified and agreed actions where
appropriate. The directors addressed any comments on the Chairman’s performance to the Senior Independent Director. The evaluation of the
Chairman’s performance during the year was led by the Senior Independent Director.
New directors receive a formal induction on joining the Board appropriate to their level of knowledge and experience and are encouraged
to visit different areas of the Group as part of a familiarisation programme. A Board meeting is held at one of the Group’s overseas locations
at least once each year to allow all directors to meet with local senior management. All directors are encouraged to develop and update their
knowledge and capabilities at the Company’s expense as necessary.
Appropriate directors’ and officers’ liability insurance cover has been in place throughout the year and is approved by the Board as part
of the global insurance programme.
Executive Management
The executive directors, together with the executive management team consisting of President of Sales, VP Engineering, VP Finance, VP General
Counsel, VP Operations and Quality, VP Human Resources, and Chief Marketing Officer comprise the management team of the Group’s principal
operating business in Canada. They meet regularly under the chairmanship of the Chief Executive Officer. The executive management team is
responsible for implementing the strategic and operating decisions taken by the executive directors of the Group, with oversight and governance
provided by the full Board.
Details of the members of the executive management team are available on the Group’s website (www.psion.com).
The Company Secretary
The Company Secretary acts as Secretary to the Board and to the committees of the Board. She assists the Chairman in ensuring that all the
directors have full and timely access to all relevant information. The Company Secretary is responsible for ensuring that the correct Board
procedures are followed and advises the Board on corporate governance matters. All of the directors have access to the advice and services of
the Company Secretary. She also administers the procedure under which directors, where appropriate, obtain independent professional advice
at the Company’s expense. The appointment or removal of the Company Secretary is a matter for the Board as a whole.
Board Committees
The Board has established four standing committees, namely, the Audit, the Remuneration, the Nomination and Technology Committees.
Each committee has formal terms of reference approved by the Board which are available to view on the Company’s website
(www.psion.com/corporategovernance). The Board is satisfied that these terms of reference, which are internally reviewed on an ongoing basis,
are compliant with the requirements of the Combined Code.
Audit Committee
The Audit Committee comprises Ross Graham (Chairman), Mike O’Leary and Stuart Cruickshank. Ross Graham, who is a chartered accountant
(“FCA”), also serves as Audit Committee Chairman for one other listed company and is considered to have recent relevant financial experience.
The Audit Committee’s responsibilities include: making recommendations to the Board regarding the appointment of the external auditors
based on its review of the scope of work, cost effectiveness and independence of the external auditors; keeping under review the effectiveness
of the Group’s system of internal controls and risk management and reporting to the Board its findings; reviewing the internal audit programme;
monitoring the financial reporting process; reviewing and challenging the actions and judgements of management in relation to the interim
and annual financial statements before submission to the Board; reviewing the Company’s arrangements for its employees to raise concerns
in confidence about possible wrongdoing; and reviewing the Company’s procedures for detecting fraud.
repo
rt o
n co
rpo
rate g
over
nan
ce
46 / 47psion annual report & accounts 2010

statement of compliance with the comBineD coDe (continueD)
Board Committees (continued)
Audit Committee (continued)
The Audit Committee met four times during the year and once up to the date of this report in 2011 and reported its conclusions to the
Board. In these meetings the Audit Committee has:
> reviewed the accounting policies;
> reviewed the preliminary announcement of the financial results of the Group for the year ended 31 December 2010 and the 2010 interim
results prior to approval by the Board;
> considered and reviewed the 2010 annual report and financial statements and the 2010 interim report, paying particular attention to
critical areas of management judgement, together with the external auditor’s reports;
> considered and discussed the audit plan with the external auditor for the 2010 audit;
> considered and recommended to the Board the re-appointment of the auditor which will be put to shareholders for approval at the AGM;
> reviewed and considered reports from internal audit visits and the external auditor on the effectiveness of the system of internal control,
and reported to the Board on the results of the review;
> reviewed the reports from management on the Group’s main risks and the assessment and mitigation of those risks;
> reviewed the Group’s business continuity plans;
> reviewed the treasury management policy;
> reviewed and confirmed the effectiveness of the arrangements for internal audit visits in place of a formal internal audit function;
> approved the statutory audit fee for 2010, and reviewed non-audit fees paid to the external auditor to ensure they were in accordance
with the Group’s policy;
> monitored the independence and undertook an evaluation of the effectiveness of the external auditor;
> reviewed regularly the status of the ongoing litigation in Japan;
> reviewed the policy for capitalisation of development costs;
> reviewed the methodology for inventory provisioning;
> reviewed the Code of Conduct which sets out how the Group’s employees are able to raise concerns over financial or other irregularities
in confidence. This policy was in place throughout the year and includes provision for employees to raise such matters directly with the
VP Human Resources or the General Counsel; and
> reviewed the register of potential directors’ conflicts of interest.
There are certain areas in which the Committee considers that the external auditor can add value to the Group, without compromising
their independence. In accordance with the Group’s policy on non-audit services, the Group received non-audit services during the year related
to research and development tax credits, tax compliance and tax advice. As a policy, any potential engagement for non-audit services where
the fee would exceed £30,000 must be pre-approved by at least one member of the Audit Committee (normally the Chairman of the Audit
Committee) who assesses any effect on the auditor’s independence. The fees earned by the auditor in relation to 2010 complied with this policy.
Representatives of the Company’s external auditor’s meet with the Audit Committee at least once annually without the executive directors present.
The Audit Committee confirms that it has conducted an assessment of the external auditor and determined that adequate policies and
safeguards are in place to ensure that their independence and objectivity has not been impaired. Audit partners are rotated every five years.
The audit engagement partner changed during the 2010 financial year. Consideration would be given to carrying out an audit tender process
in circumstances where the external auditor’s performance has been called into question, or where, through the audit partner rotation process,
no suitable replacement was identified.
Remuneration Committee
Details of the Remuneration Committee are given in the Directors’ Remuneration Report on pages 50 to 55.
Nomination Committee
The Nomination Committee comprises John Hawkins (Chairman), Ross Graham, Mike O’Leary and Stuart Cruickshank. The Committee reviews
the structure, size and composition of the Board and is responsible for succession planning and for identifying and nominating candidates for
the approval of the Board, to fill Board vacancies as and when they arise.
There was one formal meeting of the Committee during the year to appoint directors as members of the Technology Committee. Otherwise,
relevant matters were considered by the Board as a whole. During the year, the Committee and the Board:
> reviewed the composition of the Board;
> prepared descriptions of the role and capabilities required for a new non-executive director;
> prepared descriptions of the role and capabilities required for a new Chief Financial Officer;
> approved the engagement of external agencies to identify candidates for the above roles;
> interviewed candidates for the above roles; and
> approved the appointment of Toby Redshaw as a non-executive director.
Technology Committee
The Technology Committee was formed during the year in order to review the main technology and developments in the world which could
present a risk, threat or opportunity to the Company. The Technology Committee comprises Toby Redshaw (Chairman), John Conoley and two
members of senior management.
repo
rt o
n co
rpo
rate g
over
nan
ce

internal control
The Board has overall responsibility for the Group’s system of internal control although it should be recognised that it can provide only
reasonable and not absolute assurance against material misstatement or loss. The effectiveness of the Group’s system of internal control has
been reviewed by the Board during the year having special regard to the structural and cultural changes implemented during the year. The
directors confirm that the internal control framework is consistent with the revised Turnbull Guidance, that there is an ongoing process for
identifying, evaluating and managing significant risks faced by the Group, which is regularly reviewed by the Board, and that this process was
in place throughout the year ended 31 December 2010 and up to the date of this report.
It is recognised that risks are associated with achieving the Company’s value-based objectives. The Board aims to take business risks in
an informed and proactive manner, such that the level of risk is aligned with the potential business rewards. Management regularly review risk
exposures against current business-risk level tolerances. The aim of risk management is to provide reasonable assurance that the risks
associated with achieving business objectives are understood and that these risks are being responded to appropriately at all levels within the
organisation.
Essential elements of the risk management framework are:
> A culture where balanced and well understood risk-taking are embedded throughout the business;
> A risk management policy and supporting documentation;
> A uniform risk management process;
> A common risk terminology/language;
> Clear responsibilities and accountabilities for risk management;
> A management review of risk exposure and a risk reporting process; and
> Common tools and methodologies to support the risk management process.
The risk management policy includes ensuring that:
> Risks are properly identified, assessed, managed and reported;
> Risk ownership is taken as a responsibility of all functional and geographical management and communicated;
> Resources are effectively and efficiently allocated to manage risks;
> Risks that could significantly affect our employees, the company, our partners, our suppliers or our clients are suitably managed; and
> The Group is compliant with regulatory and legal requirements.
Steps are continuing to embed internal control and risk management further into the operations of the business and to deal with areas of
improvement which come to management’s and the Board’s attention.
The Group’s programme of insurance covers the major risks to the Group’s assets and business and is reviewed annually by the Board.
The Audit Committee reviewed the requirement for an internal audit function during the year and have concluded that the existing internal
financial controls are sufficient for the scale of the Group’s operations. Whilst the Group does not have a formal internal audit function, regular
internal reviews of the Group’s material business functions are performed by senior members of the finance and legal team. The results of
these reviews are reported to the Audit Committee and the effectiveness of these arrangements is reviewed at least annually.
On 16 March 2010 the Group issued a revised annual report and revised financial statements for the year ended 31 December 2009 which
replaced the original financial statements which were authorised for issue on 4 March 2010. The revision related to the misclassification of
£3.1m of expenses between cost of sales and operating expenses. As a result, gross profit increased from £60.6m to £63.7m, distribution costs
decreased from £40.0m to £36.3m and administrative expenses increased from £18.2m to £20.5m. Certain consequential revisions were made
in the Operational Review. There was no change to reported operating loss, adjusted operating profit, or net assets. All other line items in the
primary statements and notes to the financial statements remained unchanged. Following this isolated incident a review was carried out and
additional policies and procedures were put in place.
relations with shareholDers
The Board acknowledges the importance of an open dialogue with its institutional shareholders and communicates regularly with them
throughout the year, usually by way of meetings with the Chairman, Senior Independent Director, Chief Executive Officer and Chief Financial
Officer and any feedback received is circulated to the Board as soon as practicable. Presentations are made by the Chairman, Chief Executive
Officer and Chief Financial Officer at the time of the announcement of the interim and final results. The Company’s brokers met with institutional
shareholders during the year and provided feedback from those meetings to the Board.
The Board welcomes the interest of private investors and believes that, in addition to the Annual Report and the Company’s website, the
AGM is an ideal forum at which to communicate with investors and encourage their participation. The chairmen of the Audit, Remuneration,
Nomination and Technology committees are available at the AGM to answer relevant questions from shareholders. Notice of the AGM is sent
to shareholders at least twenty working days before the date of the meeting. Separate resolutions are proposed on each substantially different
issue and the number of proxy votes cast for each resolution is disclosed by the Chairman. Shareholders have the option of submitting their
voting instructions electronically (via www.sharevote.co.uk) or by returning the personalised proxy form enclosed with the Annual Report.
The notice of meeting for the forthcoming AGM separately accompanies the Annual Report and may be viewed on the Company’s website
(www.psion.com/news).
Documents relating to the Company’s governance and the full terms of reference of its standing Committees are also available on the
Company’s website (www.psion.com/corporategovernance).
statement of compliance with the comBineD coDe
The directors consider that the Company, which is a smaller company as defined by the Combined Code, has complied with the provisions set
out in the Combined Code throughout the year and up to the date of this report.
This report was approved by the Board of directors on 3 March 2011 and signed on its behalf by:
Lynne Sanderson
Company Secretary
repo
rt o
n co
rpo
rate g
over
nan
ce
48 / 49psion annual report & accounts 2010

chairman’s introDuction
With the full authority of the Board, the Remuneration Committee has continued to adopt principles in decision making on executive
remuneration reflected by the following:
> Executives deserve a fair and proper reward for their skills, performance, commitment and level of responsibility.
> The remuneration structure should be designed to reinforce business strategy and the appropriate management of risk pursuant to
achieving longer term growth in shareholder value.
> Exceptional performance should be rewarded appropriately and have regard for the executive’s seniority and role.
> Basic salary should be competitive. All variable pay must be ‘earned’ and should not be seen as an entitlement.
> The quantum of potential reward made available for success in creating sustainable shareholder value should be sufficient to enable Psion
to retain a team of executives of high calibre.
> There should be no concept or expectation of reward for failure.
> Executives should be shareholders in the company to encourage alignment of interest with all shareholders.
These same principles are applied to the senior management team and to the Executive members of the Board. Application of these
principles represents our code of practice, capable of being flexed as circumstances demand.
> Senior executives receive a higher weighting of long-term rewards (for example performance shares or share options) within their overall
package. These individuals play a major part in establishing appropriate strategies to deliver long-term shareholder value.
> Short-term incentives reinforce and encourage the behaviour and commitment of other employees who have less influence on long-term
direction, but are crucial in shorter term operational execution. For these members of our team, performance related variable pay is more
heavily weighted to the short-term and is based on personal or departmental goals.
> Variable pay awards depend on an open and fair appraisal system so that everyone is aware of the basis for earnings achievement and
they properly reflect each individual’s contribution.
> Underlying all variable payments is the principle of the Company’s ability to pay. Not all are dependent upon financial targets, indeed many
are measured against non financial goals. However, overall variable pay and bonuses have to be affordable and in proportion to shareholder
returns. None of our variable payments should encourage inappropriate risk taking.
> Metrics for variable pay are consistent with success factors contained within the Company strategic plan. A balanced scorecard approach
is normally applied so that success is not defined by a single metric.
> All employees are encouraged to become shareholders in the Company. Senior executives in receipt of share options or long-term share awards
are encouraged to retain their holding after exercising those awards. Executive Directors are under an obligation to maintain at least 50% of
such shares that vest after exercise (after allowing for tax) with a view to building up a minimum shareholding of two times basic salary.
auDit notes
In accordance with Section 421 of the Companies Act 2006 and the Directors’ Remuneration Report Regulations 2002 (the “Regulations”), the
following sections of the Report have been audited: Directors’ Remuneration 2009/10 and Directors’ Interests under the Psion Plc Portfolio
Long Term Share Plan. The remaining sections are not subject to audit.
remuneration committee
The Remuneration Committee’s principal responsibilities are to determine the remuneration of the executive directors and to monitor and
recommend the structure and level of remuneration for the senior management team. The remuneration of the non-executive directors is a
matter for the Chairman and the executive members of the Board. The Chairman’s remuneration is a matter for the Chairman of the
Remuneration Committee and the Senior Independent Director. Full terms of reference for the Remuneration Committee can be found on the
Psion website www.psion.com/corporategovernance.
The Committee is chaired by Mike O’Leary and its members are Stuart Cruickshank, Ross Graham and John Hawkins. During 2010 the
Committee met three times and attendance by Committee members at these meetings is detailed on page 46.
The Company Secretary attends meetings as Secretary to the Committee and the CEO and the Vice President, Human Resources attend
meetings by invitation and provide advice to the Committee to enable it to make informed decisions. None of these individuals is present when
their own remuneration is being discussed.
During the year the Committee carried out a review to select external remuneration consultants, following which Kepler Associates were
appointed as remuneration advisers to the Committee in August 2010. Kepler Associates do not provide any other services to the Company.
Prior to August 2010, the Committee’s appointed adviser was Towers Watson.
executive Directors’ remuneration
The remuneration package for the executive directors’ comprises fixed and variable components. The fixed components are basic salary, taxable
benefits and pension contributions. The variable elements include the annual cash bonus and share awards made under the Psion Plc Portfolio
Long Term Share Plan (“PLTSP”).
As announced on 4 November 2010, Fraser Park will be leaving the Company on 31 March 2011. It has been agreed that a compensation
payment of £147,750 will be payable and that 750,000 share options granted on 31 March 2009, which are not subject to a performance
condition, will become exercisable. All other share option and performance share awards will lapse.
Basic Salary and Benefits
Salaries for the executive directors are determined by the Committee and reviewed annually. When determining salaries, the Committee takes
into account individual performance over the preceding 12 months, the responsibilities and challenges of the role, and pay and employment
conditions elsewhere in the Group. Executive directors’ salaries were reviewed at the beginning of 2010 and a decision was taken to freeze
them at their 2009 level. This policy was repeated at the beginning of 2011.
Benefits relate to the provision of a car or car allowance, life assurance and private medical cover.
Dir
ecto
rs
’ r
em
un
er
atio
n r
epo
rt

executive Directors’ remuneration (continueD)
Composition of Remuneration Package for Executive Directors for 2010
Remuneration packages for executive directors are structured to provide an appropriate balance between fixed and variable elements. The
charts below show the composition of executive directors reward package, highlighting the fixed (base salary, pension and benefits) and variable
elements (annual bonus and long term incentive award). The charts have been prepared for illustrative purposes and assume on target
performance, co-investment of the maximum 50% of annual bonus in shares and no movement in share price from the year end position of
95 pence.
John Conoley Fraser Park
Annual Cash Bonus
The maximum cash bonus payable to executive directors is 50% of base salary. The metrics for the achievement of the cash bonus for 2010
were weighted as follows:
Key Performance Indices (KPI) Weighting ————————————
Group Cash Generated from Operations 25%
Adjusted Operating Profit 55%
Cost of Quality 10%
Major Project Completion 10% ————————————
Total: 100% ———The Remuneration Committee has recommended that metrics used for determination of cash bonuses in 2010 be applied unchanged in
determining bonuses in 2011.
Executive directors may invest up to 50% of their bonus (net of income tax and national insurance contributions) in Psion shares (“the
investment shares”) for which the Company will grant an award over a number of shares with a value equal to the amount invested before
income tax and national insurance (“the matching shares”). The matching shares will be delivered via an award of performance shares under
the Psion Plc Portfolio Long Term Share Plan which will vest three years from the date of the award, subject to the continued employment of
the director, the continued ownership of the investment shares and achievement of a performance condition. Successful achievement of the
performance condition depends on Psion’s Total Shareholder Return (“TSR”) measured against the TSR of a Comparator Group over a three
year measurement period from the date of award. The matching shares will vest in full only if the Company’s TSR performance is ranked in the
top quartile of the Comparator Group. The award will vest pro-rata between 20% and 100% if Psion’s TSR over the measurement period is
between the median and seventy fifth percentile of the Comparator Group.
Based on performance over 2010, bonuses for the executive directors will not be payable.
Long-Term Incentives
The Psion Plc Portfolio Long Term Share Plan (“PLTSP”) was introduced in 2007 and provides for Performance Share Awards and Share Option
Awards. It is designed to reward and retain executives over the long-term whilst aligning their interests with those of shareholders.
PLTSP awards granted to executive directors and members of the senior management team in 2010 comprised an award of performance
shares and an award of share options. The policy in relation to executive Directors is to make awards equivalent in value to 150% of salary
based on 100% of basic salary awarded in Share Options and 50% of salary awarded in Performance Shares. Vesting of these awards is subject
to, respectively, a gross profit performance and a TSR condition, which were selected by the Committee because it believes that these conditions
best align the interests of executives with those of shareholders.
Performance Shares
The performance shares element was structured as nil cost awards options for UK-based participants, vests according to Psion’s TSR
performance condition, measured against a Comparator Group comprising technology companies in the FTSE All Share Index, excluding
pharmaceutical and biotech companies. The Committee will have the discretion to determine which companies in the index are deemed to be
technology companies for this purpose. TSR equals the growth (or reduction) in share price plus the amount per share of any dividend paid or
other return of capital or income made to shareholders. The measurement period will be from the date of the award to the third anniversary
of the date of the award.
The award will vest in full if Psion’s TSR over the measurement period is in the top quartile of the Comparator Group; 20% will vest if Psion’s
TSR is median of the Comparator Group; awards will vest pro rata between 20% and 100% for performance between median and top quartile.
Dir
ecto
rs
’ r
em
un
er
atio
n r
epo
rt
50 / 51psion annual report & accounts 2010
Fixed47%
Variable53%
Fixed53%
Variable47%

executive Directors’ remuneration (continueD)
Share Options
The share option element vests according to growth in gross profit over a measurement period covering three financial years starting with the
financial year in which the award is granted. Gross profit shall be calculated as the annual gross profit reported in the audited financial results
of the Company.
Option awards vest in full if the compound growth in gross profit exceeds 12.5% per annum; 25% will vest if the company growth in gross
profit is 5% per annum; awards will vest pro rata between 25% and 100% if the compound growth in gross profit is between 5% and 12.5%
per annum.
Pension Arrangements
The Company contributes £15,000 per annum towards Fraser Park’s nominated pension scheme. The Company does not make any contributions
towards a pension for John Conoley. The Company does not operate any defined benefit pension schemes. Pension contributions are not
dependent upon performance.
Other Benefits
Other benefits payable to the executive directors include permanent health insurance for John Conoley and a car allowance, life assurance and
permanent health insurance and private medical insurance for Fraser Park.
Dilution
The PLTSP rules require that the amount of newly issued Shares in respect of which Awards are granted on any date does not exceed a maximum
of 10% of the Company’s issued share capital in any 10 year period. Currently shares to be issued in respect of long-term incentives are equivalent
to 7.48% of shares in issue.
The Company’s intention is to satisfy the future exercise of options and vesting of awards under its share schemes by the issue of new
shares and market purchases of shares.
shareholDing guiDelines
Senior executives in receipt of share options or long-term share awards are encouraged to retain their holding after exercising those awards.
Executive Directors are under an obligation to maintain at least 50% of such shares that vest after exercise (after allowing for the payment of
tax) with a view to building up a minimum shareholding of two times basic salary.
Directors’ service agreements
Executive Directors
Service agreements are based on a corporate standard with individual variations influenced by local employment legislation and market practice.
The directors’ service agreements contain the following notice periods:
Date of Director Title Service Agreement Notice period
—————————————— ———————————— ————————————
John Conoley Chief Executive Officer 28 April 2008 Nine months
Fraser Park Chief Financial Officer 8 January 2009 Twelve months —————————————— ———————————— ————————————
The Company may, at its discretion, lawfully terminate executive directors’ employment by making a payment equal to the value of basic
salary and benefits for any unexpired notice period. In the event that employment terminates during any bonus year, bonus is calculated on a
pro rata basis to the start of the notice period, subject to the achievement of the associated performance criteria at the discretion of the
Committee. Executive directors are not normally entitled to a bonus whilst under notice of termination and bonus is not included in the
calculation of payment in lieu of notice.
Service agreements contain provisions whereby the executive director can be placed under a duty to actively seek a suitable alternative
remunerated position and monthly severance payments from the Company would be reduced by an amount corresponding to the alternative
remuneration.
There are no contractual obligations to pay directors any sum in lieu of notice or by way of compensation or damages.
None of the service agreements has a fixed term and all contracts will continue until terminated.
Non-executive Chairman
John Hawkins was appointed as non-executive Chairman pursuant to an agreement for services dated 18 September 2009. The appointment
was for an initial term of three years, subject to re-election by shareholders at the first AGM following appointment and then subsequently at
least once every three years. The appointment can be terminated at the discretion of either party upon three months’ notice. The agreement
does not contain provisions relating to compensation for any early termination of appointment.
Dir
ecto
rs
’ r
em
un
er
atio
n r
epo
rt

Directors’ service agreements (continueD)
Non-executive Directors
Non-executive directors serve under letters of appointment which continue until terminated by either party giving three months’ notice. They
are subject to election by shareholders at the first AGM following their appointment and to re-election at least once every three years thereafter.
None of the non-executive directors’ letters of appointment contain provisions relating to compensation for any early termination of appointment.
The remuneration of the non-executive directors is determined by the Chairman together with the executive members of the Board, taking
into account current practices in other similar companies. The level of fees was reviewed in 2009 and a new fee structure introduced which
reflected the varying levels of seniority and experience of the non-executive directors.
The Board reviews the fee levels on an annual basis and following the review in 2010 it was decided to leave fees unchanged.
Committee Chairmanship Total TotalDirector Basic fee fee 2010 2009
—————— —————— —————— ——————
John Hawkins
(Chairman) £100,000 n/a £100,000 £100,000
Ross Graham (SID) £40,000 £5,000 £45,000 £35,000
Mike O’Leary £35,000 £5,000 £40,000 £30,000
Stuart Cruickshank £30,000 n/a £30,000 £30,000
Toby Redshaw £30,000 £5,000 £35,000 – —————— —————— —————— ——————
With effect from 6 April 2010, Psion ceased to pay ad-hoc expenses to non-executive directors for itemised administrative costs. Instead,
a flat monthly allowance was introduced to reflect the average annual costs incurred. This is simpler to administer and allows the heavier
administrative burdens borne by the Chairman and the Audit Committee Chairman to be handled properly within HMRC guidelines. Allowances
paid per annum are as follows:
Administrative Director Allowance
——————
John Hawkins £12,000
Ross Graham £9,000
Mike O’Leary £6,400
Stuart Cruickshank £6,400
Toby Redshaw £6,400 ——————
Non-executive directors are not eligible to participate in the Company’s bonus or share-based incentive schemes, nor to receive any pension
contributions from the Company.
external appointments
It is the Company’s policy that its executive directors may be allowed to take a limited number of external directorships where it is considered
that the appointment would not impinge on their principal employment. Individuals may retain any remuneration received from such services.
None of the executive directors had external directorships during the year.
Directors’ remuneration 2009/10
The following table gives details of each director’s remuneration for the year.
Salary/ Fees Annual Cash Bonus Pension Allowance Benefits2 Total
2010 2009 2010 2009 2010 2009 2010 2009 2010 2009 —————— —————— —————— —————— —————— —————— —————— —————— —————— ——————
EXECUTIVE
John Conoley 340 340 – 85 – – 12 18 352 443
Fraser Park 230 226 – 95 1 15 15 13 12 258 348
NON-EXECUTIVE
Stuart Cruickshank 35 15 – – – – – – 35 15
Ross Graham 52 35 – – – – – – 52 35
John Hawkins 110 53 – – – – – – 110 53
Mike O’Leary 45 30 – – – – – – 45 30
Toby Redshaw
(appointed
10 May 2010) 24 – – – – – – – 24 –
Previous Directors – – – – – – – – – 624
1 As disclosed in the 2009 Report and Accounts, this figure includes a special bonus of £37,000 awarded by the Remuneration Committee
to rectify the failure to award Fraser Park shared options at the prevailing market price in accordance with the terms of his contract.
2 Benefits include the provision of permanent health insurance for John Conoley and Fraser Park and the provision of a car allowance,
life assurance and private medical insurance for Fraser Park.
Dir
ecto
rs
’ r
em
un
er
atio
n r
epo
rt
52 / 53psion annual report & accounts 2010

Directors’ remuneration 2009/10 (continueD)
Details of the share options of the directors who served during the year ended 31 December 2010 are as follows:
Granted Lapsed Exercised Normal date As at during during during As at Option from which 01/01/10 the year the year the year 31/12/2010 Price exercisable Expiry Date —————— —————— —————— —————— —————— —————— ————————— —————————
Fraser Park 900,000 – – – 900,000 1 0.68 31/03/2012 30/03/2019
– 268,7442 – – 268,744 0.883 25/03/2013 24/03/2020 —————— —————— —————— —————— —————— —————— ————————— —————————
John Conoley – 794,5472 – – 794,547 0.883 25/03/2013 24/03/2020 —————— —————— —————— —————— —————— —————— ————————— —————————
1 These options were granted at a premium of 50% to the share price on the five business days following the announcement of the financial
results for the year ended 31 December 2008. There are no further performance conditions attached to these options.
2 100% of the options will vest if the compound growth in gross profit over the measurement period exceeds 12.5% per annum; 25% will
vest if the compound growth in gross profit is 5% per annum; options will vest pro rata between 25% and 100% if the compound growth
in gross profit over the measurement period exceeds 5% per annum but is less than 12.5% per annum.
3 As disclosed in the 2009 Report and Accounts, the actual number of share options awarded in 2010 was based on the share price of 85.6p
in order to remove the effect of any share price volatility. The option price of 88p is the actual exercise price, being a mid-market price of
Psion shares over the five days following the revised announcement of results on 16 March 2010.
Details of the performance shares awarded to directors who served during the year ended 31 December 2010 are as follows:
Granted Lapsed As at during the during the As at Performance 01/01/10 year year 31/12/2010 Vesting Date Condition —————— —————— —————— —————— ————————————— ——————
Fraser Parkii – 268,744 – 268,744 25/03/2013 i
John Conoley – 595,910 – 595,910 25/03/2013 i —————— —————— —————— —————— ————————————— ——————
i. 100% of the award will vest if Psion’s TSR over the measurement period is in the top quartile of the Comparator Group; 20% will vest if
Psion’s TSR is median of the Comparator Group; awards will vest pro rata between 20% and 100% if Psion’s performance is between the
median and top quartile.
ii. On joining Psion in January 2009, Fraser Park was to be awarded 900,000 market share price options. These were actually granted at
68p, a premium of 50% to the prevailing market price on the date of grant, in contrast to the terms of his contract. Accordingly, the Remco
decided to rectify the situation by awarding Fraser Park a special bonus of £37,000 and an additional grant of performance shares
equivalent to 50% of basic salary.
In addition to the above a further incentive was conditionally awarded to John Conoley in prior years. On joining Psion in April 2008, John
Conoley was awarded a Special Incentive linked to absolute growth in TSR. This was extended by the Remuneration Committee in 2010 and
additional performance shares and share options were awarded so as to provide an overall total of LTIP awards to enable John Conoley to earn
an extra £1.8 million over the 3/4 year period if the share price were to approximately double to around 200p over the period.
Dir
ecto
rs
’ r
em
un
er
atio
n r
epo
rt

performance graph
The following graph shows the Company’s performance measured as total shareholder return over a five year period to 31 December 2010,
compared with the total return performance of the FTSE A/S Hardware & Equipment, the FTSE A/S Software & Computer Services indices and
a comparator group consisting of technology companies in the FTSE All Share Index, excluding pharmaceutical and biotech companies. The
first two indices provide comparisons to general technology indices and the latter group is the comparator group to be used in the performance
conditions attaching to directors long-term incentives.
The market price of the Company’s Ordinary Shares as at 31 December 2010 was 95 pence and the highest and lowest share price during
the year ended 31 December 2010 were 100 pence and 71.75 pence respectively.
Directors’ interests
The Directors in office at the end of the year, together with their interests in the Ordinary Shares of the Company were:
1 January 1 January 2010* 2011
—————— ——————
John Conoley 20,334 20,334
Stuart Cruickshank – 1 1,000
Ross Graham 29,683 88,037
John Hawkins 17,241 17,241
Mike O’Leary – 34,000
Fraser Park 156,987 156,987
Toby Redshaw – – —————— ——————
* or date of appointment if later.
There were no changes in the directors’ interests in the Ordinary Shares of the Company between the balance sheet date and the date of
approval of these financial statements.
approval
This report was approved by the Board of directors on 3 March 2011 and signed on its behalf by:
Mike O’Leary
Chairman, Remuneration Committee
Dir
ecto
rs
’ r
em
un
er
atio
n r
epo
rt
54 / 55psion annual report & accounts 2010
0
50
100
150
200
250
Psion (rebased)
The comparator group comprises the technology companies in the FTSE All Share, excluding pharma and biotech (27 companies). The comparator group for the purposesof the above chart excludes those companies that have not been trading continuously since 31 December 2005).
FTSE All Share Software & Computer Services (rebased)FTSE All Share Hardware & Equipment (rebased)Comparator peer group
2005 2006 2007 2008 2009 2010
The directors are responsible for preparing the Annual Report and the financial statements in accordance with applicable law and regulations.
Company law requires the directors to prepare financial statements for each financial year. Under that law the directors are required to
prepare the group financial statements in accordance with International Financial Reporting Standards (IFRSs) as adopted by the European
Union and Article 4 of the IAS Regulation and have also chosen to prepare the parent company financial statements under IFRSs as adopted
by the EU. Under company law the directors must not approve the accounts unless they are satisfied that they give a true and fair view of the
state of affairs of the Company and of the profit or loss of the Company for that period. In preparing these financial statements, International
Accounting Standard 1 requires that directors:
> properly select and apply accounting policies;
> present information, including accounting policies, in a manner that provides relevant, reliable, comparable and understandable information;
> provide additional disclosures when compliance with the specific requirements in IFRSs are insufficient to enable users to understand the
impact of particular transactions, other events and conditions on the entity’s financial position and financial performance; and
> make an assessment of the Company’s ability to continue as a going concern.
The directors are responsible for keeping adequate accounting records that are sufficient to show and explain the Company’s transactions
and disclose with reasonable accuracy at any time the financial position of the Company and enable them to ensure that the financial statements
comply with the Companies Act 2006. They are also responsible for safeguarding the assets of the Company and hence for taking reasonable
steps for the prevention and detection of fraud and other irregularities.
The directors are responsible for the maintenance and integrity of the corporate and financial information included on the company’s
website. Legislation in the United Kingdom governing the preparation and dissemination of financial statements may differ from legislation in
other jurisdictions.
responsiBility statement
We confirm that to the best of our knowledge:
> the financial statements, prepared in accordance with International Financial Reporting Standards, give a true and fair view of the assets,
liabilities, financial position and profit or loss of the Company and the undertakings included in the consolidation taken as a whole; and
> the Operational Review, which is incorporated into the directors’ report, includes a fair review of the development and performance of the
business and the position of the Company and the undertakings included in the consolidation taken as a whole, together with a description
of the principal risks and uncertainties that they face.
By order of the Board
John Conoley Fraser Park
Chief Executive Officer Chief Financial Officer
3 March 2011 3 March 2011
statem
en
t o
f D
ir
ecto
rs
’ r
es
po
ns
iB
ilities

We have audited the financial statements of Psion plc for the year ended 31 December 2010 which comprise the Consolidated Statement of
Comprehensive Income, the Consolidated and Company Balance Sheets, the Consolidated and Company Cash Flow Statements, the Consolidated
and Company Statement of Changes in Equity and the related notes 1 to 32. The financial reporting framework that has been applied in their
preparation is applicable law and International Financial Reporting Standards (IFRSs) as adopted by the European Union and, as regards the
parent company financial statements, as applied in accordance with the provisions of the Companies Act 2006.
This report is made solely to the company’s members, as a body, in accordance with Chapter 3 of Part 16 of the Companies Act 2006. Our
audit work has been undertaken so that we might state to the company’s members those matters we are required to state to them in an auditor’s
report and for no other purpose. To the fullest extent permitted by law, we do not accept or assume responsibility to anyone other than the
company and the company’s members as a body, for our audit work, for this report, or for the opinions we have formed.
respective responsiBilities of Directors anD auDitor
As explained more fully in the Directors’ Responsibilities Statement, the directors are responsible for the preparation of the financial statements
and for being satisfied that they give a true and fair view. Our responsibility is to audit and express an opinion on the financial statements in
accordance with applicable law and International Standards on Auditing (UK and Ireland). Those standards require us to comply with the Auditing
Practices Board’s Ethical Standards for Auditors.
scope of the auDit of the financial statements
An audit involves obtaining evidence about the amounts and disclosures in the financial statements sufficient to give reasonable assurance
that the financial statements are free from material misstatement, whether caused by fraud or error. This includes an assessment of: whether
the accounting policies are appropriate to the group’s and the parent company’s circumstances and have been consistently applied and
adequately disclosed; the reasonableness of significant accounting estimates made by the directors; and the overall presentation of the financial
statements. In addition, we read all the financial and non-financial information in the annual report to identify material inconsistencies with
the audited financial statements. If we become aware of any apparent material misstatements or inconsistencies we consider the implications
for our report.
opinion on financial statements
In our opinion:
> the financial statements give a true and fair view of the state of the group’s and of the parent company’s affairs as at 31 December 2010
and of the group’s profit for the year then ended;
> the group financial statements have been properly prepared in accordance with IFRSs as adopted by the European Union;
> the parent company financial statements have been properly prepared in accordance with IFRSs as adopted by the European Union and
as applied in accordance with the provisions of the Companies Act 2006; and
> the financial statements have been prepared in accordance with the requirements of the Companies Act 2006 and, as regards the group
financial statements, Article 4 of the IAS Regulation.
emphasis of matter – uncertainty relating to ongoing litigation in Japan
In forming our opinion on the financial statements, which is not modified, we have considered the adequacy of the disclosures made in note 31
to the financial statements concerning the uncertain outcome of legal claims totalling JPY 1.95 billion (£15.4 million at 31 December 2010
exchange rates) relating to unauthorised trades and a guarantee of third party trading obligations, where the Company’s Japanese subsidiary,
Psion Teklogix KK (“PTKK”), is the defendant. The Group has filed a number of counter actions. Discussions with the major claimant are at an
early stage. The ultimate outcome of these matters cannot presently be determined, and no provision for any liability that may result from
either future settlements or legal costs has been made in the financial statements.
opinion on other matters prescriBeD By the companies act 2006
In our opinion:
> the part of the Directors’ Remuneration Report to be audited has been properly prepared in accordance with the Companies Act 2006; and
> the information given in the Directors’ Report for the financial year for which the financial statements are prepared is consistent with the
financial statements.in
Depen
Den
t au
Dito
r’s
r
epo
rt to
th
e m
em
Ber
s o
f ps
io
n plc
56 / 57psion annual report & accounts 2010

matters on which we are requireD to report By exception
We have nothing to report in respect of the following:
Under the Companies Act 2006 we are required to report to you if, in our opinion:
> adequate accounting records have not been kept by the parent company, or returns adequate for our audit have not been received from
branches not visited by us; or
> the parent company financial statements and the part of the Directors’ Remuneration Report to be audited are not in agreement with the
accounting records and returns; or
> certain disclosures of directors’ remuneration specified by law are not made; or
> we have not received all the information and explanations we require for our audit.
Under the Listing Rules we are required to review:
> the directors’ statement, contained within the Directors’ Report, in relation to going concern;
> the part of the Corporate Governance Statement relating to the company’s compliance with the nine provisions of the June 2008 Combined
Code UK Corporate Governance Code specified for our review; and
> certain elements of the report to shareholders by the Board on directors’ remuneration.
Hadleigh Shekle ACA (Senior statutory auditor)
for and on behalf of Deloitte LLP
Chartered Accountants and Statutory Auditor
London, United Kingdom
3 March 2011
in
Depen
Den
t au
Dito
r’s
r
epo
rt to
th
e m
em
Ber
s o
f ps
io
n plc

2010 2009 Notes £000s £000s —————— ——————
CONTINUING OPERATIONS
Revenue 3 174,498 170,042
Cost of sales (107,791) (106,357) —————— ——————
GROSS PROFIT 66,707 63,685
Distribution costs (34,359) (36,354)
Administrative expenses (26,336) (24,966)
Exceptional operating costs 4 (316) (5,420)
Total administrative expenses (26,652) (30,386) —————— ——————
OPERATING PROFIT/(LOSS) 5 5,696 (3,055)
Investment income 7 118 207
Finance costs 8 (131) (138) —————— ——————
PROFIT/(LOSS) BEFORE TAX 5,683 (2,986)
Tax 9 (3,013) (4,769) —————— ——————
PROFIT/(LOSS) FOR THE YEAR FROM CONTINUING OPERATIONS 2,670 (7,755)
DISCONTINUED OPERATIONS
(Loss)/profit for the year from discontinued operations 10 (129) 603 —————— ——————
PROFIT/(LOSS) FOR THE YEAR ATTRIBUTABLE TO EQUITY HOLDERS OF THE PARENT 2,541 (7,152)
OTHER COMPREHENSIVE INCOME
Exchange gain/(loss) on translation of goodwill in foreign operations 3,529 (12,134)
Exchange gain/(loss) on translation of foreign operations 274 (7,937) —————— ——————
TOTAL COMPREHENSIVE INCOME 6,344 (27,223) ––– –––EARNINGS PER SHARE
From continuing operations
Basic 12 1.90p (5.52p) ––– –––Diluted 12 1.90p (5.52p) ––– –––From continuing and discontinued operations
Basic 12 1.81p (5.09p) ––– –––Diluted 12 1.81p (5.09p) ––– –––
co
ns
oliD
ateD
s
tatem
en
t o
f co
mpr
eh
en
sive in
co
me
For the year ended 31 Decem
ber 2010
58 / 59psion annual report & accounts 2010

Group Company 2010 2009 2010 2009 Notes £000s £000s £000s £000s —————— —————— —————— ——————
NON-CURRENT ASSETS
Goodwill 13 103,073 99,898 – –
Other intangible assets 14 15,407 5,527 – –
Property, plant and equipment 15 11,463 9,932 36 50
Investments in subsidiaries 16 – – 153,240 160,425
Prepayments 19 903 645 – –
Deferred tax assets 22 3,718 6,863 – – —————— —————— —————— ——————
134,564 122,865 153,276 160,475 —————— —————— —————— ——————
CURRENT ASSETS
Inventories 18 18,232 18,430 – –
Trade and other receivables 19 47,386 45,644 6,229 2,844
Current tax assets 599 3,653 150 159
Cash and cash equivalents 20 36,881 45,268 21,451 32,298 —————— —————— —————— ——————
103,098 1 12,995 27,830 35,301 —————— —————— —————— ——————
TOTAL ASSETS 237,662 235,860 181,106 195,776 —————— —————— —————— ——————
CURRENT LIABILITIES
Trade and other payables 24 (52,209) (48,718) (4,970) (17,520)
Retirement benefit obligation 29 (79) (7) – –
Tax liabilities (1,215) (2,167) – –
Obligations under finance leases 23 (583) (236) – –
Derivative financial instruments 21 (66) (14) – (14)
Provisions 25 (1,530) (2,227) (319) – —————— —————— —————— ——————
(55,682) (53,369) (5,289) (17,534) —————— —————— —————— ——————
NON-CURRENT LIABILITIES
Tax liabilities (202) (575) – –
Deferred tax liabilities 22 – (888) – –
Obligations under finance leases 23 (1,451) (946) – –
Provisions 25 (1,843) (2,496) (931) – —————— —————— —————— ——————
(3,496) (4,905) (931) – —————— —————— —————— ——————
TOTAL LIABILITIES (59,178) (58,274) (6,220) (17,534) —————— —————— —————— ——————
NET ASSETS 178,484 177,586 174,886 178,242 ––– ––– ––– –––EQUITY
Share capital 26 21,112 21,086 21,112 21,086
Share premium 15,689 15,597 15,689 15,597
Capital reserve 98,703 98,703 101,145 101,145
Translation reserve 22,459 18,656 (47) (47)
Retained earnings 20,521 23,544 36,987 40,461 —————— —————— —————— ——————
TOTAL EQUITY 178,484 177,586 174,886 178,242 ––– ––– ––– –––The financial statements of Psion PLC, registered number 1520131, were approved by the Board of Directors for issue on 3 March 2011.
They were signed on its behalf by:
Fraser Park
Chief Financial Officer
co
ns
oliD
ateD
an
D co
mpan
y B
alan
ce s
heets
As at 31 Decem
ber 2010

Group Company 2010 2009 2010 2009 £000s £000s £000s £000s —————— —————— —————— ——————
PROFIT/(LOSS) FOR THE YEAR 2,541 (7,152) 1,747 9,661
Adjustments for:
Investment income (118) (207) (111) (170)
Finance costs 131 325 9 4
Tax charge 3,013 4,769 307 1
Provision/(write back of provision) against loan to subsidiaries – – 7,185 (15,295)
Depreciation of property, plant and equipment 3,081 3,511 17 8
Amortisation of other intangible assets 1,730 1,270 – –
Share-based payment (credit)/expense (79) (411) 264 (262)
(Profit)/loss on disposal of property, plant and equipment (42) 210 – –
Loss on disposal of intangible assets – 10 – –
(Decrease)/increase in provisions (437) (1,399) 1,250 –
Cash impact of discontinued operations (913) (856) – – —————— —————— —————— ——————
Operating cash flows before movements in working capital 8,907 70 10,668 (6,053)
Decrease in inventories 191 16,741 – –
(Increase)/decrease in receivables (2,322) 5,149 (105) 9
(Increase)/decrease in intercompany receivables – – (3,280) 10,233
Increase/(decrease) in payables 1,674 (177) 219 356
Decrease in intercompany payables – – (12,782) (1,255) —————— —————— —————— ——————
Cash generated by operations 8,450 21,783 (5,280) 3,290
Tax received 3,843 829 6 –
Tax paid (2,250) (4,144) (304) (1)
Interest paid (119) (138) – (4) —————— —————— —————— ——————
NET CASH FROM/(USED IN) OPERATING ACTIVITIES 9,924 18,330 (5,578) 3,285 —————— —————— —————— ——————
INVESTING ACTIVITIES
Interest received 115 216 96 138
Repayment by subsidiary – – 6 15,327
Proceeds on disposal of property, plant and equipment 182 145 – –
Purchases of intangible assets (10,246) (4,739) – –
Purchases of property, plant and equipment (2,568) (2,352) (3) (16) —————— —————— —————— ——————
NET CASH (USED IN)/FROM INVESTING ACTIVITIES (12,517) (6,730) 99 15,449 —————— —————— —————— ——————
FINANCING ACTIVITIES
Dividends paid (5,485) (5,200) (5,485) (5,200)
Repayment of obligations under finance leases (711) (568) – –
Proceeds from issue of new shares 118 21 118 21 —————— —————— —————— ——————
NET CASH USED IN FINANCING ACTIVITIES (6,078) (5,747) (5,367) (5,179) —————— —————— —————— ——————
NET (DECREASE)/INCREASE IN CASH AND CASH EQUIVALENTS (8,671) 5,853 (10,846) 13,555
CASH AND CASH EQUIVALENTS AT BEGINNING OF YEAR 45,268 41,281 32,298 18,797
Effects of foreign exchange rate changes 284 (1,866) (1) (54) —————— —————— —————— ——————
CASH AND CASH EQUIVALENTS AT END OF YEAR 36,881 45,268 21,451 32,298 ––– ––– ––– –––co
ns
oliD
ateD
an
D co
mpan
y cas
h flo
w s
tatem
en
ts
For the year ended 31 Decem
ber 2010
60 / 61psion annual report & accounts 2010

Group Company 2010 2009 2010 2009 £000s £000s £000s £000s —————— —————— —————— ——————
SHARE CAPITAL
Balance at start of year 21,086 21,081 21,086 21,081
Exercise of equity share options 26 5 26 5 —————— —————— —————— ——————
Balance at end of year 21,112 21,086 21,112 21,086 ––– ––– ––– –––SHARE PREMIUM
Balance at start of year 15,597 15,581 15,597 15,581
Exercise of equity share options 92 16 92 16 —————— —————— —————— ——————
Balance at end of year 15,689 15,597 15,689 15,597 ––– ––– ––– –––CAPITAL RESERVE
Balance at start and end of year 98,703 98,703 101,145 101,145 ––– ––– ––– –––TRANSLATION RESERVE
Balance at start of year 18,656 38,727 (47) 7
Exchange gains/(losses) on translation of goodwill in foreign operations 3,529 (12,134) – –
Exchange gains/(losses) on translation of foreign operations 274 (7,937) – (54) —————— —————— —————— ——————
Balance at end of year 22,459 18,656 (47) (47) ––– ––– ––– –––RETAINED EARNINGS
Balance at start of year 23,544 36,307 40,461 36,262
Profit/(loss) for the year 2,541 (7,152) 1,747 9,661
Recognition of share based payment (credit)/expense (79) (411) 264 (262)
Dividends (note 1 1) (5,485) (5,200) (5,485) (5,200) —————— —————— —————— ——————
Balance at end of year 20,521 23,544 36,987 40,461 ––– ––– ––– –––TOTAL
Balance at start of year 177,586 210,399 178,242 174,076
Exercise of equity share options 118 21 118 21
Exchange gains/(losses) on translation of goodwill in foreign operations 3,529 (12,134) – –
Exchange gains/(losses) on translation of foreign operations 274 (7,937) – (54)
Profit/(loss) for the year 2,541 (7,152) 1,747 9,661
Recognition of share based payment (credit)/expense (79) (411) 264 (262)
Dividends (note 1 1) (5,485) (5,200) (5,485) (5,200) —————— —————— —————— ——————
Balance at end of year 178,484 177,586 174,886 178,242 ––– ––– ––– –––
co
ns
oliD
ateD
an
D co
mpan
y s
tatem
en
t o
f ch
an
ges
in
eq
uity
For the year ended 31 Decem
ber 2010

1. general information
Psion PLC is a company incorporated in Great Britain under the Companies Act 2006 (“the Act”). The principal activities of the Group are
providing enterprise mobile computing solutions, integration services and product support and maintenance to customers worldwide. The
Company’s registered office address is 48, Charlotte Street, London, W1T 2NS, United Kingdom.
The financial statements for the year ended 31 December 2010 have been prepared in accordance with International Financial
Reporting Standards (“IFRS”) adopted for use in the European Union and therefore comply with Article 4 of the EU IAS Regulation. The
transition date to IFRS for Psion PLC was 1 January 2004.
These financial statements are presented in pounds sterling because it is the currency of the primary economic environment of the
Company. Foreign operations are included in accordance with the policies set out in note 2.
The following new and revised Standards and Interpretations have been adopted in the current year. Their adoption has not had any
significant impact on the amounts reported in these financial statements but may impact the accounting for future transactions and
arrangements.
> IFRIC 17 Distributions of Non-cash Assets to Owners. The Interpretation provides guidance on when an entity should recognise
a non-cash dividend payable, how to measure the dividend payable and how to account for any difference between the carrying
amount of the assets distributed and the carrying amount of the dividend payable when the payable is settled.
> IFRS 2 (amended) Group Cash-settled Share-based Payment Transactions. The amendment clarifies the accounting for share-
based payment transactions between group entities.
> IFRS 3(2008) Business Combinations; IAS 27(2008) Consolidated and Separate Financial Statements and IAS 28(2008)
Investments in Associates. These standards have introduced a number of changes in the accounting for business combinations
when acquiring a subsidiary or an associate. IFRS 3(2008) has also introduced additional disclosure requirements for acquisitions.
The following amendments were made as part of Improvements to IFRSs (2009), but have not affected the financial statements:
> Amendment to IFRS 2 Share-based Payment. IFRS 2 has been amended, following the issue of IFRS 3(2008), to confirm that the
contribution of a business on the formation of a joint venture and common control transactions are not within the scope of IFRS 2.
> Amendment to IAS 17 Leases. IAS 17 has been amended such that it may be possible to classify a lease of land as a finance lease
if it meets the criteria for that classification under IAS 17.
> Amendment to IAS 39 Financial Instruments: Recognition and Measurement. IAS 39 has been amended to state that options
contracts between an acquirer and a selling shareholder to buy or sell an acquiree that will result in a business combination at
a future acquisition date are not excluded from the scope of the standard.
At the date of authorisation of these financial statements, the following Standards and Interpretations which have not been applied
in these financial statements were in issue but not yet effective (and in some cases had not yet been adopted by the EU):
> IFRS 9 – Financial Instruments
> IAS 24 (amended) – Related Party Disclosures
> IAS 32 (amended) – Classification of Rights Issues
> IFRIC 19 – Extinguishing Financial Liabilities with Equity Instruments
> IFRIC 14 (amended) – Prepayments of a Minimum Funding Requirement
Improvements to IFRSs (May 2010).
The adoption of IFRS 9 which the Group plans to adopt for the year beginning on 1 January 2013 will impact both the
measurement and disclosures of Financial Instruments. The directors do not expect that the adoption of the other standards
listed above will have a material impact on the financial statements of the Group in future periods.
Critical areas of management judgement
In the application of the Group’s accounting policies, the directors are required to make judgements, estimates and assumptions about
the carrying amounts of assets and liabilities that are not readily apparent from other sources. The estimates and associated assumptions
are based on historical experience and other factors that are considered to be relevant. Actual results may differ from these estimates.
The estimates and underlying assumptions are reviewed on an ongoing basis. Revisions to accounting estimates are recognised in
the period in which the estimate is revised if the revision affects only that period, or in the period of the revision and future periods if the
revision affects both current and future periods.
The following are the critical judgements, apart from those involving estimates (which are dealt with separately below) that the
directors have made in the process of applying the Group’s accounting policies and that have the most significant effect on the amounts
recognised in the financial statements.
Development expenditure
The Group is required to exercise judgement in the evaluation of whether development expenditure meets all of the conditions for
capitalisation. This will require an evaluation of whether the expenditure creates an asset that will lead to future economic benefit to the
Group, whether the Group has the intention and resources to complete the development project and whether the associated cost of
development can be measured reliably.
no
tes
to
th
e co
ns
oliD
ateD
fin
an
cial s
tatem
en
ts
For the year ended 31 Decem
ber 2010
62 / 63psion annual report & accounts 2010

1. general information (continueD)
Estimation of useful economic lives of long-lived assets
The economic life used to amortise intangible fixed assets and depreciate property, plant and equipment relates to the future performance
of the assets in question and management’s judgement of the period over which the economic benefit will be derived from the asset.
As at 31 December 2010, the amount of property, plant and equipment included in the Group Balance Sheet was £1 1,463,000
(2009 – £9,932,000).
As at 31 December 2010, the amount of intangible fixed assets included in the Group Balance Sheet was £15,407,000 (2009 – £5,527,000).
Taxation
Tax laws that apply to the Group’s businesses may be amended by the relevant authorities, for example as a result of changes in fiscal
circumstances or priorities. Such potential amendments and their application to the Group are regularly monitored and the requirement
for recognition of any liabilities assessed where necessary.
The Group is subject to income taxes and judgement is required in determining the appropriate provision for transactions where the
ultimate tax determination is uncertain. In such circumstances, the Group recognises liabilities for anticipated taxes due based on best
information available and where the anticipated liability is probable and estimable. Where the final outcome of such matters differs from
the amounts initially recorded, any differences will impact the income tax and deferred tax provisions in the period to which such
determination is made. Where the potential liabilities are not considered probable, the amount at risk is disclosed unless an adverse
outcome is considered remote.
Key sources of estimation uncertainty
The key assumptions concerning the future and other key sources of estimation uncertainty at the balance sheet date that have a
significant risk of causing a material adjustment to the carrying amounts of assets and liabilities within the next financial year, are
discussed below.
Provisions for slow-moving inventory
Judgement is required in evaluating the likelihood of inventory on hand becoming obsolete, and in the value to be realised for inventory,
including assessing whether the expected sales price exceeds the cost of the inventory, including relevant costs of sale. This evaluation
requires estimates to be made as to future demand for the products, and the price at which inventory can be sold. To the extent that
actual recovery experience differs significantly from the historical trends of the Group and the assumptions made on realisation, the
income statement of the Group in future periods may be materially affected. As at 31 December 2010, the amount provided for in the
Balance Sheet was £9,070,000 (2009 – £12,365,000).
Trade receivables
Judgement is required in evaluating the likelihood of collection of customer debt after revenue has been recognised. This evaluation
requires estimates to be made, including the level of provision to be made for amounts with uncertain recovery profiles. Provisions are
based on historical trends in the percentage of debts which are not recovered, or on more detailed reviews of individually significant
balances. To the extent that actual recovery experience differs significantly from the historical trends of the Group or from the assumptions
on recovery following the detailed reviews of individually significant balances, the income statement of the Group in future periods may
be materially affected. As at 31 December 2010, the amount provided for in the Balance Sheet was £2,597,000 (2009 – £3,138,000).
Onerous leases
Provisions are recognised when the Group has a present obligation as a result of a past event, and it is probable that the Group will be
required to settle that obligation. In determining the amount to be provided, the Directors are required to make estimates of the cost of
settlement, having regard to the facts and circumstances at each balance sheet date. The principal judgements in respect of the Group’s
provisions relate to properties vacated by the Group, and which require the Company to make certain estimates regarding the period over
which a property will remain vacant, the period of any sub-let including assumptions regarding renewal of existing sub-tenants and the
rent achievable from such sub-lets. As at 31 December 2010, the amount provided for in the Balance Sheet was £2,363,000 (2009 –
£3,436,000).
Warranty costs
Provisions are recognised for warranties granted at the time of sale of the Group’s products. In determining the amount to be provided,
the Directors are required to make estimates of the expected number of units that will be subject to warranty claims by customers, and
the average cost of warranty repair. These estimates reflect the Group’s historical warranty experience and other relevant industry
information. As at 31 December 2010, the amount provided for in the Balance Sheet was £1,010,000 (2009 – £1,287,000).
Recoverability of development costs
Where an indicator of impairment is identified, determining whether the carrying amount of capitalised development costs is impaired
requires judgement. This requires the Group to estimate the future cash flows expected to arise from the products to which the
development costs relate and a suitable discount rate in order to calculate present value. The carrying amount of development costs at
the balance sheet date was £12,067,000 (2009 – £3,701,000).
no
tes
to
th
e co
ns
oliD
ateD
fin
an
cial s
tatem
en
ts
For the year ended 31 Decem
ber 2010

1. general information (continueD)
Impairment of goodwill
Determining whether goodwill is impaired requires an estimation of value in use of the cash-generating unit to which goodwill has been
allocated. The value in use calculation requires the Group to estimate the future cash flows expected to arise from the cash-generating
unit and a suitable discount rate in order to calculate present value. The carrying amount of goodwill at the balance sheet date was
£103,073,000 (2009 – £99,898,000).
Deferred tax
The recognition of deferred tax assets requires judgement as to the probability of taxable profits being available in the future and the
quantum and location of taxable profits that are forecast to arise. This requires the directors to exercise judgement in forecasting future
results, including assumptions and estimates of growth in revenue and changes in operating margins. Changing the assumptions selected
by the directors could significantly affect the Group’s forecast results and the amount of deferred taxation included in the Group’s results.
See note 22 for further details.
Contingent liabilities
The Group exercises judgement in measuring the exposures to contingent liabilities related to pending litigation or other outstanding
claims (see notes 30 and 31 to the consolidated financial statements). Judgement is necessary in assessing the likelihood that a pending
claim will succeed, or a liability will arise, and to quantify the possible range of the financial settlement. Because of the inherent uncertainty
in this evaluation process, actual losses may be different from the Group’s assessment of the likelihood of a loss arising and its estimates
of amounts.
2. significant accounting policies
a) Basis of preparation
The financial statements of both the Group and the Company have been prepared in accordance with IFRS as adopted by the European
Union (EU). After due consideration by the directors, as set out in the Directors’ Report on page 42, the financial statements have
been prepared on a going concern basis.
The Company has elected under s408 of the Companies Act 2006 not to include its own Statement of Comprehensive Income
and related notes in these financial statements.
The financial statements of both the Group and the Company have been prepared under the historical cost convention, except
for the revaluation of certain financial instruments. The principal accounting policies adopted are shown below.
b) Basis of consolidation
The Group results include the results of the Company and all of its subsidiary undertakings made up to 31 December. A subsidiary
undertaking is an entity controlled by the Company. Control exists when the Company has the power, directly or indirectly, to govern
the financial and operating policies of the entity so as to derive benefits from its activities.
The results of subsidiary undertakings sold or acquired during the year are included up to, or from, the date of change of control.
Intra-group balances and transactions, including any unrealised profits from intra-group transactions, are eliminated on
consolidation.
c) Business combinations
Acquisitions are accounted for by applying the acquisition method. The cost of an acquisition is measured as the aggregate of the
fair values, at the acquisition date, of the assets given, liabilities incurred or assumed and equity instruments issued by the Group in
exchange for control of the acquiree. The identifiable assets, liabilities and contingent liabilities of the acquiree are measured at fair
value at the acquisition date. Acquisition related costs are recognised in profit or loss as incurred. Any excess of the cost of acquisition
over the fair value of the identifiable net assets acquired is recognised as goodwill in the Balance Sheet. Any excess of the fair value
of the net identifiable assets acquired over the cost of acquisition is credited immediately in profit or loss as a bargain purchase gain.
d) Foreign currencies
The financial statements of each subsidiary undertaking are prepared using its functional currency, being the currency of the primary
economic environment in which the undertaking operates. The presentation currency of the Group is Sterling which is the functional
currency of the Company.
Foreign currency transactions in the individual entities are translated into the functional currency using exchange rates prevailing
at the date of the transactions. Exchange differences arising from the settlement of such transactions, and from the translation at
the balance sheet date of monetary assets and liabilities denominated in currencies other than the functional currency, are recognised
in profit or loss except for exchange differences on monetary items receivable from or payable to a foreign operation for which
settlement is neither planned nor likely to occur (therefore forming part of the net investment in the foreign operation) which are
initially recognised in other comprehensive income and reclassified from equity to profit or loss on disposal, or partial disposal, of
the net investment.
On consolidation, the assets and liabilities of the Group’s overseas operations are translated at exchange rates prevailing on
the balance sheet date. Income and expense items are translated at average exchange rates for the period. Exchange differences
arising since 1 January 2004 are recognised in other comprehensive income and accumulated in equity. On disposal of a foreign
undertaking any cumulative exchange differences held in equity are reclassified to profit or loss.
no
tes
to
th
e co
ns
oliD
ateD
fin
an
cial s
tatem
en
ts
For the year ended 31 Decem
ber 2010
64 / 65psion annual report & accounts 2010

2. significant accounting policies (continueD)
e) Revenue recognition
Revenue for goods and services supplied in the normal course of business is measured at the fair value of the consideration received
or receivable, net of discounts, VAT and other sales taxes.
The Group’s revenue is generated from sales direct to customers or to its channel partners, including distributors and value
added resellers.
For both direct and indirect partner sales revenue is recognised on transfer of risks and rewards to the customer or channel
partner respectively, being either the point of shipment or on delivery to the customer or channel partner, depending on the
contractual terms applicable to the sale. Other than in respect of limited rights of return the Group does not retain risk or reward on
sales to distributors or value added resellers.
Where distributors have been granted limited rights of return, and it is possible reliably to estimate the expected returns, revenue
is reduced accordingly based on prior return experience and other relevant information. If it is not possible reliably to estimate the
expected returns revenue is not recognised until the rights of return have expired.
Revenue from maintenance or service agreements is recognised rateably over the term of the related contract. Revenue is
deferred when billings are made in advance of revenue recognition. Revenue from the sale of software is recognised on acceptance
of the software by the customer, unless there are other terms in the contract still to be fulfilled in which case the revenue is not
recognised until those other conditions have been met.
f) Share-based payments
In accordance with the transitional provisions, the Group has applied the requirements of IFRS 2 to all share option grants after 7
November 2002 that had not vested as at 1 January 2005 and to all share option grants after 1 January 2005. Under these
requirements, equity settled awards under share-based incentive plans are measured at fair value (excluding the effect of non market-
based vesting conditions) at the date of grant.
Fair value is measured using a Binomial model. The fair value calculation takes into consideration management’s best estimate
of the expected life of the option and the estimated number of shares that will vest.
The fair value determined at the date of grant of the equity-settled share-based payments is expensed on a straight-line basis
over the vesting period, based on the Group’s estimate of equity instruments that will eventually vest. At each balance sheet date
the Group revises its estimate of the number of equity instruments expected to vest as a result of the effect of non market-based
vesting conditions, including option lapses. The impact of the revision of the original estimates if any, is recognised in profit or loss
such that the cumulative expense reflects the revised estimate, with a corresponding adjustment to the profit and loss reserve.
g) Investment income and finance costs
Interest income and expense are credited or charged to the Statement of Comprehensive Income, using the effective interest method,
during the period in which they are earned or incurred.
h) Taxation
The tax expense represents the sum of tax currently payable and the deferred tax charge.
The tax currently payable is based on taxable profit for the year. Taxable profit differs from profit before taxation as reported in
the Statement of Comprehensive Income because it excludes items of income or expense that are taxable or deductible in other
years and it further excludes items that are never taxable or deductible. The Group’s liability for current tax is calculated using tax
rates that have been enacted or substantively enacted by the balance sheet date.
Deferred tax is provided in full, using the liability method, on temporary differences arising between the tax base of assets and
liabilities and their carrying amounts in the consolidated financial statements. Deferred tax arising from initial recognition of an asset
or liability in a transaction, other than an acquisition, that at the time of the transaction affects neither accounting nor taxable profit
or loss, is not recognised. Deferred tax is measured using tax rates that have been enacted or substantively enacted by the balance
sheet date and are expected to apply when the asset is realised or the liability settled.
Deferred tax assets are recognised to the extent that it is probable that future taxable profits will be available against which the
temporary differences can be utilised. Deferred tax is provided on temporary differences arising on investments in subsidiaries except
where the Group is able to control the timing of the reversal of the temporary difference and it is probable that the temporary
difference will not reverse in the foreseeable future. Tax is recognised in the Statement of Comprehensive Income, unless the tax
relates to items recognised directly in equity, in which case the tax is recognised directly in equity.
Deferred tax assets and liabilities are offset when there is a legally enforceable right to set off current tax assets against current
tax liabilities and when they relate to income taxes levied by the same taxation authority and the Group intends to settle its current
tax assets and liabilities on a net basis.
i) Goodwill
Goodwill arising on consolidation, as defined in the policy for business combinations, is initially measured at cost and is subsequently
measured at cost less any accumulated impairment losses. Impairment testing is carried out at least annually, or more frequently if
there is an indication that the asset may be impaired, by reference to the discounted future cash flows of the cash generating unit to
which the goodwill is attributed. Any impairment loss recognised is never written back. On disposal the attributable amount of goodwill
is included in the calculation of gain or loss on disposal.
Goodwill arising on acquisitions before transition to IFRS on 1 January 2004 has been retained at the previous UK GAAP amounts,
converted to US Dollars, subject to being tested for impairment. Goodwill written off to reserves under UK GAAP prior to 1998 has
not been reinstated and is not included in determining any subsequent profit or loss on disposal.
no
tes
to
th
e co
ns
oliD
ateD
fin
an
cial s
tatem
en
ts
For the year ended 31 Decem
ber 2010

2. significant accounting policies (continueD)
j) Other intangible assets
Development costs
Development costs are capitalised only if they meet all of the criteria set out in IAS 38 for capitalising such costs. Where no internally
generated intangible asset can be recognised development expenditure is recognised as an expense in the period in which it is
incurred. When developing new products, the costs directly attributable to the product development are capitalised, once the
conditions in IAS 38 are satisfied, up to the time the product is complete and available for sale and then amortised, on a straight line
basis, over the expected product life which is typically 4 years. Any further expenditure incurred after the development is completed
is expensed to profit or loss as such expenditure is not considered to meet the recognition criteria set out in IAS 38.
Computer software
Computer software comprises computer software purchased from third parties as well as the cost of internally developed software.
Computer software licences are capitalised on the basis of the costs incurred to acquire and bring into use the specified software.
Costs that are directly associated with the production of identifiable and unique software products controlled by the Group, and
which are capable of producing future economic benefits, are recognised as intangible assets. Internally developed software is
recognised only if an asset is created that can be separately recognised, it is probable the asset will create future economic benefit
and the development costs can be reliably measured. Amortisation is charged to profit or loss on a straight line basis over the
estimated useful life from the date the software is available for use, typically 3 to 7 years for both internally generated and acquired
software.
Other
Other acquired intangible assets are included at cost and depreciated on a straight-line basis over their estimated useful lives of 2.5
to 7 years.
k) Property, plant and equipment
Property, plant and equipment are stated at cost less accumulated depreciation and any recognised impairment loss.
Depreciation is charged so as to write off the cost of assets, other than freehold land, over their estimated useful lives, using
the straight-line method, on the following bases:
Freehold buildings 2% per annum
Leasehold buildings and improvements shorter of term of the lease and estimated useful economic life
Computers and equipment 14% – 33% per annum
Office furniture and equipment 20% per annum
Motor vehicles 25% per annum
Production and test equipment 25% – 33% per annum
Production line machinery 16.67% per annum
Production and test equipment developed and constructed by the Group’s own personnel is capitalised on the basis of the cost
of materials, labour and other directly attributable costs.
Residual values and estimated useful lives are reviewed annually.
l) Impairment of tangible and intangible assets excluding goodwill
At each balance sheet date the Group assesses whether there is any indication that its intangible and tangible assets may be impaired.
Where an indicator of impairment exists the Group makes an estimate of the recoverable amount. Where the carrying amount of an
asset exceeds its recoverable amount, the asset is written down to its recoverable amount. Where it is not possible to estimate the
recoverable amount of an individual asset, the Group estimates the recoverable amount of the cash-generating unit to which the
asset belongs.
Recoverable amount is the higher of fair value less costs to sell and value in use and is determined for an individual asset. In
assessing value in use, the estimated future cash flows are discounted to their present value using a pre-tax discount rate that reflects
current market assessments of the time value of money and the risks specific to the asset.
Impairment losses are recognised as expenses in profit or loss immediately. If an impairment loss subsequently reverses the
carrying amount of the asset, or cash generating unit, is increased to the lower of the recoverable amount and the original carrying
value before it was impaired less the amortisation which would have been charged in the period between the impairment recognition
and subsequent reversal. A reversal of an impairment loss is recognised in profit or loss immediately.
m) Inventories
Inventories are stated at the lower of cost, using the weighted average method, and net realisable value. Cost comprises direct
materials and, where applicable, direct labour costs and those overheads that have been incurred in bringing the inventories to their
present location and condition. Net realisable value represents the estimated selling price less all estimated costs of completion and
costs to be incurred in marketing, selling and distribution.
no
tes
to
th
e co
ns
oliD
ateD
fin
an
cial s
tatem
en
ts
For the year ended 31 Decem
ber 2010
66 / 67psion annual report & accounts 2010

2. significant accounting policies (continueD)
n) Financial instruments
Financial assets and financial liabilities are recognised in the Group’s Balance Sheet when the Group becomes a party to the
contractual provisions of the instrument.
Equity instruments issued by the Company are recorded at the proceeds received net of direct issue costs.
Financial assets
Financial assets are initially recorded at fair value net of transaction costs. The Group classifies its financial assets as loans and
receivables, except for derivative financial instruments which are accounted for at fair value through profit or loss.
Loans and receivables, which comprise trade receivables and other receivables which have fixed or determinable payments, are
measured at amortised cost, using the effective interest method, less impairment.
Trade and other receivables are short-term in nature and hence the recognition of interest would be immaterial.
Cash and cash equivalents comprise cash on hand, demand deposits and other short-term highly liquid investments that are
readily convertible to a known amount of cash and are subject to an insignificant risk of change in value.
Financial liabilities
All the Group’s financial liabilities are classified as other financial liabilities except for derivative financial instruments which are
accounted for at fair value through profit or loss. Other financial liabilities are initially measured at fair value, net of transaction costs
and are subsequently measured at amortised cost, using the effective interest method, with interest expense recognised on an
effective yield basis, except where such liabilities are short-term in nature and the recognition of interest would be immaterial.
o) Leases
Leases are classified as finance leases when substantially all the risks and rewards of ownership are transferred to the Group.
All other leases are operating leases.
The Group as Lessee
Finance leases are capitalised at the inception of the lease at the lower of the fair value of the leased asset and the present value of
the minimum lease payments. The corresponding liability to the lessor is recognised as an obligation under a finance lease in the
Balance Sheet. Lease payments are apportioned between the liability and finance costs to produce a constant rate of interest on the
finance lease obligation outstanding. Finance expenses are recognised immediately in profit or loss, unless they are directly
attributable to qualifying assets, in which case they are capitalised in accordance with the Group’s policy on borrowing costs. Assets
capitalised under finance leases are depreciated over the shorter of the useful life of the asset and the lease term.
Payments made under operating leases are recognised as an expense in profit or loss on a straight-line basis over the lease
term. Any incentives to enter into operating leases are recognised as reductions in rental expense over the lease term on a straight-
line basis.
The Group as Lessor
Rental income from operating leases is recognised on a straight-line basis over the term of the lease.
p) Provisions
Provisions for warranty costs are recognised at the date of sale of the relevant products, at the directors’ best estimate of the
expenditure required to settle the Group’s liability.
Provisions for onerous lease costs are calculated by reference to all estimated net future costs on the properties concerned
discounted to net present value at the balance sheet date.
q) Investment in subsidiaries
In the accounts of the Company, investments in subsidiary undertakings are stated at cost less, where appropriate, provisions for
impairment.
r) Exceptional items
Exceptional items comprise items of income or expense that, in the judgment of management, should be disclosed separately on the
basis that they are material in amount, either by size or nature, to provide an understanding of the Group’s underlying financial
performance and would significantly distort the comparability of financial performance between periods. Examples of matters giving
rise to the disclosure of material items of income or expense include, but are not limited to, reorganisation costs, the costs of defending
the Group’s ongoing legal claims in Japan (net of any insurance recoveries against those costs) and one off costs arising from the
termination and appointment of directors.
s) Borrowing costs
Borrowing costs are recognised in profit or loss in the period in which they are incurred, unless they are directly attributable to the
construction or production of qualifying assets when they are added to the cost of those assets until the assets are ready for their
intended use or sale.
no
tes
to
th
e co
ns
oliD
ateD
fin
an
cial s
tatem
en
ts
For the year ended 31 Decem
ber 2010

3. segmental analysis
IFRS disclosures
The Group is managed on a geographical basis using a regional structure. These geographical regions are the basis on which the Group
reports its results within internal reporting to the Chief Executive Officer (the chief decision maker) and the Board for the purposes of
resource allocation and assessment of segmental performance. Inter-segment revenues and profits are eliminated in such internal reporting
prior to reporting the regional performance. Segment Balance Sheet information is not included in the Group’s internal reporting.
The 2009 analyses have been re-presented to conform with the current year presentation. The Psion corporate activity segment
comprises the Group’s development centre to which goodwill is attributed, together with expensed development costs, amortisation of
capitalised development costs and associated staff costs, together with costs of Group functions.
Revenue by geographical market 2010 2009 £000s £000s
—————— ——————
USA 38,792 41,173
Canada 5,556 2,768
Other 11,841 9,097 —————— ——————
Americas 56,189 53,038 —————— ——————
France 35,183 37,801
Germany 17,094 15,926
UK 11,147 9,090
Rest of Continental Europe 33,512 35,039
Other 6,842 7,095 —————— ——————
EMEA 103,778 104,951 —————— ——————
Asia Pacific 14,531 12,053 —————— ——————
Total revenue from continuing operations 174,498 170,042 ––– –––Results by geographical market
Operating profit/(loss) before exceptional items
Americas 11,637 10,227
EMEA 26,422 27,103
Asia Pacific 4,444 2,197 —————— ——————
42,503 39,527
Corporate activities (36,491) (37,162)
Exceptional operating costs (note 4) (316) (5,420) —————— ——————
Operating profit/(loss) from continuing operations 5,696 (3,055)
Investment income 118 207
Finance costs (131) (138) —————— ——————
Profit/(loss) before tax 5,683 (2,986)
Tax (3,013) (4,769) —————— ——————
Profit/(loss) from continuing operations 2,670 (7,755) ––– –––Non-current assets (excluding deferred tax) by segment
Americas 529 467
EMEA 676 918
Asia Pacific 39 50
Corporate activities 129,602 1 14,567 —————— ——————
130,846 1 16,002 ––– –––Within EMEA non-current assets located within the UK total £162,000 (2009 – £166,000).
Depreciation and amortisation
Americas 363 302
EMEA 242 913
Asia Pacific 24 200
Corporate activities 4,182 3,366 —————— ——————
4,811 4,781 ––– ––– no
tes
to
th
e co
ns
oliD
ateD
fin
an
cial s
tatem
en
ts
For the year ended 31 Decem
ber 2010
68 / 69psion annual report & accounts 2010

3. segmental analysis (continueD)
Additional voluntary disclosures
The following disclosures are provided for additional information purposes only and do not form part of the Group’s segmental reporting
under IFRS 8.
The Group segregates revenue into three main segments – hardware and software, professional services and customer services and
support which arise in each geographical segment. The following table provides an analysis of the Group’s revenue according to these
segments.
2010 2009 £000s £000s —————— ——————
Hardware and software 130,765 125,644
Professional services 3,689 3,801
Customer services and support 40,044 40,597 —————— ——————
174,498 170,042 ––– –––4. exceptional costs
2010 2009 £000s £000s
—————— ——————
Restructuring costs (a) 293 4,466
Japanese costs (b) (148) 412
Board changes (c) 259 542
Other (88) – —————— ——————
316 5,420 ––– –––(a) The costs of a redundancy programme in various countries undertaken to align costs and revenues.
(b) Costs relating to unauthorised trade in the Japanese business together with associated investigation and other related costs of
defending claims made on the Japanese business, offset by insurance proceeds of £1,048,000 (2009 – £2,500,000). See note 31 for
more detail.
(c) Costs incurred in restructuring the Board.
The timing of cash payments for restructuring costs does not match the timing of the charge to profit or loss. 2010 2009 £000s £000s
—————— ——————
Balance at start of year 618 2,676
Charge to profit or loss 293 4,466
Paid in year (796) (6,365)
Foreign exchange impact 16 (159) —————— ——————
Balance at end of year 131 618 ––– –––The charge to profit or loss for Japanese costs in 2010 comprised £900,000 of costs incurred and paid, offset by an insurance recovery
of £1,048,000. In addition £2,500,000 of insurance proceeds were received early in the year which were credited in exceptional operating
costs in 2009.
5. operating profit / (loss)
Operating profit / (loss) has been arrived at after (crediting)/charging: 2010 2009 £000s £000s —————— ——————
Net foreign exchange gains (a) (677) (767)
Research and development costs 8,662 8,400
Depreciation of property, plant and equipment 3,081 3,511
Amortisation of other intangible assets (included in administrative expenses) 1,730 1,270
(Profit)/loss on disposal of property, plant and equipment (42) 210
Loss on disposal of intangible assets – 10
Cost of inventories recognised as an expense 66,479 60,458
Write-down of inventories recognised as an expense 155 4,762
Release of prior period inventory provisions (112) –
Operating lease expense 4,314 4,319
Staff costs (note 6) 54,754 56,601 —————— ——————
no
tes
to
th
e co
ns
oliD
ateD
fin
an
cial s
tatem
en
ts
For the year ended 31 Decem
ber 2010

5. operating profit / (loss) (continueD)
a) The net foreign exchange gains in 2010 are net of £665,000 of realised gains (2009 – loss of £8,000) on foreign currency derivative
contracts and unrealised losses of £66,000 (2009 – £14,000) on open foreign currency derivative contracts which are accounted for
at fair value through profit or loss.
The analysis of auditors’ remuneration is as follows: £000s £000s —————— ——————
Fees payable to the Company’s auditors for the audit of the Company’s annual accounts 133 1 13
Fees payable to the Company’s auditors and their associates for the audit of the Company’s subsidiaries 480 402
Fees payable to other auditors for the audit of a subsidiary undertaking 6 –
Fees payable to the Company’s auditors and their associates for other services to the Group 183 257 —————— ——————
Total fees 802 772 ––– –––Other services:
– Tax services 126 250
– Other services 57 7 —————— ——————
Total non-audit fees 183 257 ––– –––Fees payable to Deloitte LLP and their associates for non-audit services to the Company are not required to be disclosed because the
consolidated financial statements are required to disclose such fees on a consolidated basis.
Reconciliation of adjusted operating profit from operating profit/(loss) from continuing operations £000s £000s —————— ——————
Operating profit/(loss) from continuing operations 5,696 (3,055)
Add back/(deduct):
Share-based payment credit (79) (411)
Exceptional operating costs (note 4) 316 5,420 —————— ——————
Adjusted operating profit from continuing operations 5,933 1,954 ––– –––6. staff costs
The average monthly number of persons including directors employed by the Group during the year by function was:
2010 2009 Number Number —————— ——————
Distribution and manufacturing (a) 627 659
Research and development 180 176
Finance and administration (a) 118 1 12 —————— ——————
925 947 ––– –––The aggregate remuneration comprised: 2010 2009 £000s £000s —————— ——————
Wages and salaries 47,666 49,735
Social security costs 6,147 6,392
Other pension costs (see note 29) 1,020 885
Share-based payment credit (79) (411) —————— ——————
54,754 56,601 ––– –––The parent company had no employees (2009 – nil) but the costs of certain employees were recharged by Psion Services Limited (note 32).
Details of directors’ remuneration are included in the audited part of the Directors’ Remuneration Report on pages 50 to 55.
(a) 2009 analysis amended to take account of reclassification of staff during 2010.
no
tes
to
th
e co
ns
oliD
ateD
fin
an
cial s
tatem
en
ts
For the year ended 31 Decem
ber 2010
70 / 71psion annual report & accounts 2010

7. investment income
2010 2009 £000s £000s —————— ——————
Interest on bank deposits 118 207 ––– –––8. finance costs
2010 2009 £000s £000s —————— ——————
Interest on bank overdrafts and loans 6 31
Interest on obligations under finance leases 125 107 —————— ——————
131 138 ––– –––9. tax charge/(creDit)
Continuing operations Discontinued operations Total 2010 2009 2010 2009 2010 2009 £000s £000s £000s £000s £000s £000s —————— —————— —————— —————— —————— ——————
Current tax 380 62 – – 380 62
Deferred tax 2,633 4,707 – – 2,633 4,707 —————— —————— —————— —————— —————— ——————
Total 3,013 4,769 – – 3,013 4,769 ––– ––– ––– ––– ––– –––UK corporation tax is calculated at 28.0% (2009 – 28.0%) of the estimated assessable profit for the year. Taxation for other jurisdictions
is calculated at the rates prevailing in the respective jurisdictions.
The charge/(credit) for the year can be reconciled to the profit and loss as follows:
2010 2010 2009 2009 £000s % £000s % —————— —————— —————— ——————
Profit/(loss) before tax
continuing operations 5,683 (2,986)
discontinued operations (129) 603 —————— ——————
5,554 (2,383) ––– –––Tax at the domestic tax rate of 28.0% (2009 – 28.0%) 1,555 28.0 (667) 28.0
Tax effect of expenses/(income) that are not deductible/
(taxable) in determining taxable profit 735 13.2 (992) 41.6
Tax effect of utilisation of tax losses (2,012) (36.2) (168) 7.1
Losses carried forward 1,996 36.0 3,988 (167.4)
Losses unavailable due to cessation of trade – – 15 (0.6)
Timing differences (54) (1.0) 222 (9.3)
Reassessment of recognition of deferred tax assets 2,580 46.5 2,998 (125.8)
Overseas withholding tax (847) (15.3) 767 (32.2)
Effect of different tax rates of subsidiaries operating in other jurisdictions (435) (7.8) (1,094) 45.9
Prior year adjustments (505) (9.1) (300) 12.6 —————— —————— —————— ——————
Tax charge and effective tax rate for the year 3,013 54.3 4,769 (200.1) ––– ––– ––– –––A number of changes to the UK corporation tax system were announced in the June 2010 Budget Statement. The Finance (No 2) Act 2010
includes legislation to reduce the main rate of corporation tax from 28% to 27% from 1 April 2011. Further reductions to the main rate
have been proposed to reduce the rate by 1% per annum to 24% by 1 April 2014. These further reductions in the tax rate had not been
substantively enacted at the balance sheet date and, therefore, are not reflected in these financial statements.
There was no significant effect on the tax charge from changes in local rates of tax in jurisdictions where deferred taxes were
recognised.
no
tes
to
th
e co
ns
oliD
ateD
fin
an
cial s
tatem
en
ts
For the year ended 31 Decem
ber 2010

10. DiscontinueD operations
The results for the year from the discontinued operations are analysed as follows: 2010 2009 £000s £000s —————— ——————
Surplus on closure of discontinued operations – 790
Finance costs
Unwinding of discount on provisions (129) (187) —————— ——————
(129) 603 ––– –––The results from discontinued operations all relate to the UK.
During 2009 new tenants were found for the properties vacated during 2008 and early 2009, taking a lease running through to the
end of Psion’s lease term. Consequently the provision was reduced in 2009. During 2010 there were no significant changes to tenancies
and, following a review, there has been no additional charge to, or release from, the onerous lease provision. Costs incurred and rents
received during the year have all been booked against the onerous lease provision (note 25).
11. DiviDenDs
2010 2009 £000s £000s —————— ——————
Amounts recognised as distributions to equity holders in the year:
Paid second interim dividend for the prior year of 2.6p (2009 – final dividend 2.5p per share) 3,655 3,513
Paid interim dividend for the current year of 1.3p (2009 – 1.2p) per share 1,830 1,687 —————— ——————
5,485 5,200 ––– –––Final dividend proposed for the year ended 31 December 2010 of 2.7p per share 3,800 ––– Second interim dividend declared for the year ended 31 December 2009 of 2.6p per share. 3,655 –––The proposed final dividend has not been included as a liability in these financial statements. The dividend, subject to shareholder approval,
will be paid on 13 May 2011 to shareholders on the register on 15 April 2011.
12. earnings/(loss) per share
2010 2009 Number Number ————————— —————————
Number of shares
Weighted average number of ordinary shares for the purposes of basic earnings per share 140,650,796 140,556,248
Dilutive effect of potential ordinary shares:
Share options 66,773 23,438 ————————— —————————
Weighted average number of ordinary shares for the purposes of diluted earnings per share 140,717,569 140,579,686 ––––– –––––The denominators above are used for the purposes of calculating basic and diluted earnings per share.
no
tes
to
th
e co
ns
oliD
ateD
fin
an
cial s
tatem
en
ts
For the year ended 31 Decem
ber 2010
72 / 73psion annual report & accounts 2010

12. earnings/(loss) per share (continueD)
FROM CONTINUING AND DISCONTINUED OPERATIONS £000s £000s —————— ——————
Profit/(loss)
Profit/(loss) for the purposes of basic and diluted earnings per share being
earnings attributable to equity holders of the parent 2,541 (7,152) ––– ––– Pence Pence —————— ——————
Earnings/(loss) per share from continuing and discontinued operations
Basic earnings/(loss) per share 1.81 (5.09) ––– –––Diluted earnings/(loss) per share 1.81 (5.09) ––– –––FROM CONTINUING OPERATIONS £000s £000s —————— ——————
Profit/(loss)
Profit/(loss) attributable to equity holders of the parent 2,541 (7,152)
Add/(deduct) loss/(profit) for the period from discontinued operations 129 (603) —————— ——————
Profit/(loss) for the purposes of basic and diluted earnings per share from continuing operations 2,670 (7,755) ––– –––Earnings/(loss) per share from continuing operations Pence Pence —————— ——————
Basic earnings/(loss) per share 1.90 (5.52) ––– –––Diluted earnings/(loss) per share 1.90 (5.52) ––– –––Adjusted earnings from continuing operations are calculated as follows: £000s £000s —————— ——————
Profit/(loss) from continuing operations attributable to equity holders of the parent 2,670 (7,755)
Adjustments to exclude exceptional operating costs net of tax 316 3,698
Adjustment to exclude share-based payment credit net of tax (79) (411) —————— ——————
Adjusted profit/(loss) from continuing operations for the purpose of basic and diluted earnings per share 2,907 (4,468) ––– –––Adjusted earnings/(loss) per share from continuing operations Pence Pence —————— ——————
Adjusted basic earnings/(loss) per share 2.07 (3.18) ––– –––Adjusted diluted earnings/(loss) per share 2.07 (3.18) ––– –––FROM DISCONTINUED OPERATIONS £000s £000s —————— ——————
(Loss)/profit
(Loss)/profit from discontinued operations (129) 603 ––– –––(Loss)/earnings per share from discontinued operations Pence Pence —————— ——————
Basic (loss)/earnings per share (0.09) 0.43 ––– –––Diluted (loss)/earnings per share (0.09) 0.43 ––– –––
no
tes
to
th
e co
ns
oliD
ateD
fin
an
cial s
tatem
en
ts
For the year ended 31 Decem
ber 2010

13. gooDwill
COST £000s ——————
As at 1 January 2009 1 12,065
Exchange differences (12,134) ——————
At 31 December 2009 99,931
Exchange differences 3,175 ——————
At 31 December 2010 103,106 ——————
ACCUMULATED IMPAIRMENT LOSS
At 1 January 2009 22
Exchange differences 1 1 ——————
At 31 December 2009 and 31 December 2010 33 ——————
CARRYING AMOUNT
At 31 December 2010 103,073 –––At 31 December 2009 99,898 –––The carrying value of all goodwill relates to the Group’s corporate activities segment, which includes the development centre of the Group
at Psion Inc. The goodwill is maintained as a US Dollar asset. The movement of the US Dollar from 31 December 2009 to 31 December
2010 is the reason for the increase in the value of goodwill in Sterling terms.
The recoverable amount is determined from value in use calculations. The key assumptions for the value in use calculations are those
regarding the discount rates, growth rates and expected changes to selling prices and costs during the period. The model covers a nine
year period before in perpetuity growth rates of 2% (2009 – 2%) are applied, the first three years of which are supported by budgets and
forecasts, and the remainder incorporate growth assumptions based on industry forecasts which have been discussed and agreed by
management. Management estimates pre-tax discount rates that reflect current market assessments of the time value of money and
specific risks. The growth rates are based on industry growth forecasts. Changes in selling prices and direct costs are based on past
experience and expectations of future changes in the markets. Management considers that using a nine year model is reasonable as the
key growth assumption is supported by industry growth forecasts.
The Board has carefully considered recent trading activity and budgeted profitability in the impairment test, together with general
economic and market conditions. Sensitivity analyses have been performed on the major assumptions within the impairment test to see
if a reasonably likely change in an assumption, or combination of assumptions, would lead to a need to recognise impairment of goodwill,
but in no case was an impairment charge considered necessary. The most important of these assumptions relate to future growth of
revenue and the discount rate used.
The rate used to discount the forecast cash flows is the pre-tax cost of capital of 9% (2009 – 9.54%). Within the sensitivity analysis
a discount rate of 15% was also tested. Application of this higher discount rate did not indicate a need to impair the asset.
no
tes
to
th
e co
ns
oliD
ateD
fin
an
cial s
tatem
en
ts
For the year ended 31 Decem
ber 2010
74 / 75psion annual report & accounts 2010

14. other intangiBle assets
Patents and Development Customer trademarks Software costs lists Total £000s £000s £000s £000s £000s —————— —————— —————— —————— ——————
COST
At 1 January 2009 661 1 1,025 – 504 12,190
Additions 27 683 1,248 – 1,958
Own costs capitalised – 509 2,272 – 2,781
Disposals – (8) – (14) (22)
Reclassification – (29) – – (29)
Exchange differences 5 713 181 (56) 843 —————— —————— —————— —————— ——————
At 31 December 2009 693 12,893 3,701 434 17,721
Additions 481 1,225 4,209 – 5,915
Own costs capitalised – 176 4,154 – 4,330
Disposals – (4) – (485) (489)
Reclassification – 3,371 – – 3,371
Exchange differences 113 1,482 586 51 2,232 —————— —————— —————— —————— ——————
At 31 December 2010 1,287 19,143 12,650 – 33,080 —————— —————— —————— —————— ——————
ACCUMULATED AMORTISATION
At 1 January 2009 520 9,355 – 494 10,369
Charge for the year 76 1,193 – 1 1,270
Eliminated on disposals – (5) – (7) (12)
Reclassification – (12) – – (12)
Exchange differences 17 616 – (54) 579 —————— —————— —————— —————— ——————
At 31 December 2009 613 11,147 – 434 12,194
Charge for the year 58 1,108 564 – 1,730
Eliminated on disposals – (3) – (485) (488)
Reclassification – 2,799 – – 2,799
Exchange differences 97 1,271 19 51 1,438 —————— —————— —————— —————— ——————
At 31 December 2010 768 16,322 583 – 17,673 —————— —————— —————— —————— ——————
CARRYING AMOUNT
At 31 December 2010 519 2,821 12,067 – 15,407 ––– ––– ––– ––– –––At 31 December 2009 80 1,746 3,701 – 5,527 ––– ––– ––– ––– –––Further details of capitalised development costs are given in the Operational Review on page 20. The net book value at 31 December 2010
of £12,067,000 represents development costs for the Omnii™ product which first went into production in 2010 and hence began
depreciating during 2010, and two new products which will go into production in 2011.
All intangible assets have finite lives (note 2j).
no
tes
to
th
e co
ns
oliD
ateD
fin
an
cial s
tatem
en
ts
For the year ended 31 Decem
ber 2010

15. property, plant anD equipment
Group Freehold land and Leasehold Plant and buildings improvements equipment Total £000s £000s £000s £000s —————— —————— —————— ——————
COST
At 1 January 2009 4,017 1,802 34,765 40,584
Additions 404 17 2,174 2,595
Disposals – (374) (1,594) (1,968)
Reclassification – – 29 29
Exchange differences 358 (94) (57) 207 —————— —————— —————— ——————
At 31 December 2009 4,779 1,351 35,317 41,447
Additions 54 26 4,442 4,522
Disposals – (4) (4,203) (4,207)
Reclassification – – (3,371) (3,371)
Exchange differences 696 43 1,803 2,542 —————— —————— —————— ——————
At 31 December 2010 5,529 1,416 33,988 40,933 —————— —————— —————— ——————
ACCUMULATED DEPRECIATION AND IMPAIRMENT
At 1 January 2009 555 1,137 27,686 29,378
Charge for the year 47 128 3,336 3,511
Eliminated on disposals – (265) (1,348) (1,613)
Reclassification – – 12 12
Exchange differences 171 (38) 94 227 —————— —————— —————— ——————
At 31 December 2009 773 962 29,780 31,515
Charge for the year 68 83 2,930 3,081
Eliminated on disposals – (4) (4,062) (4,066)
Reclassification – – (2,799) (2,799)
Exchange differences 337 38 1,364 1,739 —————— —————— —————— ——————
At 31 December 2010 1,178 1,079 27,213 29,470 —————— —————— —————— ——————
CARRYING AMOUNT
At 31 December 2010 4,351 337 6,775 11,463 ––– ––– ––– –––At 31 December 2009 4,006 389 5,537 9,932 ––– ––– ––– –––The carrying amount of the Group’s plant and equipment includes an amount of £2,358,000 (2009 – £1,243,000) in respect of assets held
under finance leases. Additions to plant and equipment during the year amounting to £1,954,000 (2009 – £243,000) were financed by
new finance leases. These assets have been pledged as security for the Group’s lease repayment obligations (note 23).
Plant and equipment includes computers and equipment, office furniture, motor vehicles, production and test equipment and
production line machinery.
There were no significant capital commitments at the year end (2009 £nil).
no
tes
to
th
e co
ns
oliD
ateD
fin
an
cial s
tatem
en
ts
For the year ended 31 Decem
ber 2010
76 / 77psion annual report & accounts 2010

15. property, plant anD equipment (continueD)
Company Fixtures Leasehold and improvements equipment Total £000s £000s £000s —————— —————— ——————
COST
At 1 January 2009 44 86 130
Additions – 16 16
Disposals – (1) (1) —————— —————— ——————
At 31 December 2009 44 101 145
Additions – 3 3
Disposals – (15) (15) —————— —————— ——————
At 31 December 2010 44 89 133 —————— —————— ——————
ACCUMULATED DEPRECIATION AND IMPAIRMENT
At 1 January 2009 14 74 88
Charge for the year 4 4 8
Eliminated on disposals – (1) (1) —————— —————— ——————
At 31 December 2009 18 77 95
Charge for the year 5 12 17
Eliminated on disposals – (15) (15) —————— —————— ——————
At 31 December 2010 23 74 97 —————— —————— ——————
CARRYING AMOUNT
At 31 December 2010 21 15 36 ––– ––– –––At 31 December 2009 26 24 50 ––– ––– –––
16. investments in suBsiDiaries
Company Long-term Shares in loans to subsidiary subsidiary undertakings undertakings Total £000s £000s £000s —————— —————— ——————
COST
At 1 January 2009 224,356 54,044 278,400
Repayment of loan – (15,295) (15,295) —————— —————— ——————
At 31 December 2009 224,356 38,749 263,105
Reduction of capital (7,185) – (7,185) —————— —————— ——————
At 31 December 2010 217,171 38,749 255,920 ––– ––– –––ACCUMULATED IMPAIRMENT LOSSES
At 1 January 2009 63,931 54,044 1 17,975
Written back – (15,295) (15,295) —————— —————— ——————
At 31 December 2009 63,931 38,749 102,680
Written back – – – —————— —————— ——————
At 31 December 2010 63,931 38,749 102,680 ––– ––– –––CARRYING AMOUNT
At 31 December 2010 153,240 – 153,240 ––– ––– –––At 31 December 2009 160,425 – 160,425 ––– ––– –––During 2009 part of a loan due from a subsidiary company, which had previously been fully provided for, was repaid.
no
tes
to
th
e co
ns
oliD
ateD
fin
an
cial s
tatem
en
ts
For the year ended 31 Decem
ber 2010

16. investments in suBsiDiaries (continueD)
Details of the Company’s principal subsidiaries at 31 December 2010 are as follows: Proportion of equity Country of owned andName of subsidiary incorporation voting rights ——————— ———————
Psion Teklogix S.A. (d) Argentina 100%
Psion Teklogix (Australia) Pty Ltd (d) Australia 100%
Psion Teklogix NV (d) Belgium 100%
Psion Teklogix Inc. (a) Canada 100%
Psion Teklogix Systems Inc (d) Canada 100%
Psion Teklogix Wireless Technologies (Shanghai) Limited (d) China 100%
Psion Teklogix ApS (d) Denmark 100%
Psion Services Limited* (b) Great Britain 100%
Psion Shared Services Limited (b) Great Britain 100%
Psion Teklogix (UK) Limited (d) Great Britain 100%
Psion Teklogix SAS (d) France 100%
Psion Teklogix EMEA SAS (b) France 100%
Psion Teklogix Europe SAS (c) France 100%
Psion Teklogix GmbH (d) Germany 100%
Psion Teklogix BV (d) Holland 100%
Psion Teklogix Systems India Pvt. Limited (d) India 100%
Psion Teklogix S.r.l (d) Italy 100%
Psion Teklogix Japan KK (d) Japan 100%
Psion Teklogix de Mexico SA de CV (d) Mexico 100%
Psion Teklogix Asia Pacific Pte Limited (d) Singapore 100%
Psion Teklogix South Africa (Proprietary) Limited (d) South Africa 100%
Psion Teklogix SL (d) Spain 100%
Psion Teklogix SARL (d) Switzerland 100%
Psion Teklogix Corporation (d) USA 100%
The above represents the Group companies with significant operating transactions. There are a number of other holding and intermediary
companies which are not listed. After the year end, as a part of the rebranding exercise, company names were changed to exclude
“Teklogix”. The new names are shown at the back of the Annual Report on the inside back cover.
Each subsidiary has a single class of ordinary share capital.
a) This company’s principal activity is to research and develop, organise the manufacture of, market and sell Group products.
b) This company’s principal activity is to provide services to the Group.
c) This company’s principal activity is to service and repair the Group’s products.
d) The principal activity of these companies is to market and distribute the Group’s products.
* held directly by Psion PLC
17. investments
Group and Company £000s ——————
COST
At 1 January 2009 3,064
Written off (3,064) ——————
At 31 December 2009 and 31 December 2010 – –––ACCUMULATED IMPAIRMENT LOSSES
At 1 January 2009 3,064
Impairment provision no longer required (3,064) ——————
At 31 December 2009 and 31 December 2010 – –––CARRYING AMOUNT
At 31 December 2009 and 31 December 2010 – –––During 2009 Radioscape plc, the only external investment, went into liquidation with no prospect of a payment to equity shareholders.
The investment was fully impaired in the accounts previously, but was formally written off in 2009.
no
tes
to
th
e co
ns
oliD
ateD
fin
an
cial s
tatem
en
ts
For the year ended 31 Decem
ber 2010
78 / 79psion annual report & accounts 2010

18. inventories
Group 2010 2009 £000s £000s —————— ——————
Components 16,719 14,387
Work-in-progress 645 1,366
Finished goods 868 2,677 —————— ——————
18,232 18,430 ––– –––The directors believe that there is no significant difference between the net book value and replacement cost of inventories held.
Inventories are stated net of provisions for slow moving and obsolete items of £9,070,000 (2009 – £12,365,000).
The value of inventories at 31 December 2009 converted to Sterling at the rates of exchange applicable at 31 December 2010 was
£19,473,000.
19. traDe anD other receivaBles
Group Company 2010 2009 2010 2009 £000s £000s £000s £000s —————— —————— —————— ——————
Amounts receivable from the sale of goods and provision of services 41,962 38,726 – 28
Amounts owed by subsidiary undertakings – – 6,020 2,740
Other debtors 2,457 4,205 74 28
Prepayments and accrued income 2,967 2,713 135 48 —————— —————— —————— ——————
Included in current assets 47,386 45,644 6,229 2,844
Prepayments included in non-current assets 903 645 – – —————— —————— —————— ——————
48,289 46,289 6,229 2,844 ––– ––– ––– –––Trade receivables
The average credit period provided on sale of goods and provision of services is 65 days (2009 – 63 days).
Group Company 2010 2009 2010 2009 £000s £000s £000s £000s —————— —————— —————— ——————
The movements in the allowance for doubtful receivables were as follows:
Balance at the start of year (3,138) (4,558) (22,479) (22,479)
Provided in the year (413) (838) (2,835) –
Provisions reversed as no longer required 244 541 – –
Amounts written off as uncollectible 166 1,360 – –
In business sold 444 – – –
Exchange differences 100 357 – – —————— —————— —————— ——————
Balance at the end of the year (2,597) (3,138) (25,314) (22,479) ––– ––– ––– –––For the Group provisions are made against trade receivables, for the Company provision is made against inter-company receivables.
Age analysis of trade receivables (Group) 2010 2009 Gross Allowance Gross AllowanceBased on original contract terms: £000s £000s £000s £000s —————— —————— —————— ——————
Not due at 31 December 21,172 – 24,081 (78)
Overdue 1 – 60 days 15,039 (21) 10,648 (3)
Overdue 61 – 90 days 2,821 (107) 2,072 (14)
Overdue 91 – 120 days 1,147 (68) 854 (27)
Overdue 121 – 180 days 906 (29) 734 (104)
Overdue by more than 180 days 3,474 (2,372) 3,475 (2,912) —————— —————— —————— ——————
44,559 (2,597) 41,864 (3,138) ––– ––– ––– –––The total of the overdue but not impaired trade receivables is £20,790,000 (2009 – £14,723,000).
The directors consider that the carrying amount of trade and other receivables approximates their fair value.
Trade receivables of the Company are not material and so an age analysis table has not been prepared.
no
tes
to
th
e co
ns
oliD
ateD
fin
an
cial s
tatem
en
ts
For the year ended 31 Decem
ber 2010

19. traDe anD other receivaBles (continueD)
Credit Risk
The Group’s credit risk is primarily attributable to its trade receivables. The amounts presented in the balance sheet are net of allowances
for doubtful receivables, and the tables above show the age analysis of the gross amounts and of the allowances for doubtful receivables.
Credit limits are set for all new customers, based on audited financial statements (where available), bank and trade references and
external credit rating agency reports. Limits are reviewed regularly, and always in cases where there is a deterioration in a customer’s
payments compared with contract terms. The process is begun afresh for any customer placing an order who has not ordered in the
preceding 12 month period.
Provisions are made against receivables using management judgement taking into account the time by which the receivable amount
is overdue, the customer’s previous payment history and the most recent understanding of the customer’s financial position. A 100%
provision is not made where any element of the gross receivable amount could be recovered by way of a sales tax recovery in the event
the receivable amount is actually written off.
The credit risk on liquid funds and derivative financial instruments is considered to be limited because the counterparties are major
international banks with credit-ratings assigned by international credit-rating agencies. The Board considers and monitors the credit risk
of counterparties for liquid funds and derivative financial instruments which it has identified as a principal risk in the Operational Review.
See also note 21 “Treasury Risk Management”.
With the exception of Liquidity Funds, which are discussed in more detail in the Financial Review on page 29, and cash balances the
Group has no significant concentration of credit risk, with exposure spread over a large number of counterparties and customers.
The Group considers its exposure to credit risk at 31 December to be as follows:
Group Company 2010 2009 2010 2009 £000s £000s £000s £000s —————— —————— —————— ——————
Cash and cash equivalents 36,881 45,268 21,451 32,298
Trade receivables 41,962 38,726 – 28
Other debtors 2,457 4,205 74 28 —————— —————— —————— ——————
81,300 88,199 21,525 32,354 ––– ––– ––– –––The exposure to credit risk at the end of the year is representative of the exposure during the year.
20. cash anD cash equivalents
The carrying amount of the Group’s and Company’s cash resources are denominated in the following currencies:
Group Company Floating Floating Floating Floating rate rate rate rate 2010 2009 2010 2009 £000s £000s £000s £000s —————— —————— —————— ——————
Sterling 10,007 32,909 7,910 31,807
Euro 7,373 4,968 1 460
Canadian Dollar 4,054 259 3,799 –
US Dollar 13,620 2,703 9,741 31
Other currencies 1,827 4,429 – – —————— —————— —————— ——————
36,881 45,268 21,451 32,298 ––– ––– ––– –––The cash and cash equivalents comprise cash held by the Group almost all of which is on overnight deposit. The carrying amount of these
assets approximates to their fair value.
Of the Group cash balance above, £266,000 (2009 – £266,000) is restricted cash in respect of funds held by the Group’s Employee
Share Option Trust. £224,000 (2009 – £232,000) is in accounts managed by the Company’s registrars to pay unclaimed dividends.
12 years after the dividend payment date any unclaimed funds are returned to the company, although the dividends remain a liability of
the Company until claimed.
no
tes
to
th
e co
ns
oliD
ateD
fin
an
cial s
tatem
en
ts
For the year ended 31 Decem
ber 2010
80 / 81psion annual report & accounts 2010

21. Derivative financial instruments
2010 2009 Assets Liabilities Assets Liabilities £000s £000s £000s £000s —————— —————— —————— ——————
Forward foreign exchange contracts – 66 – 14 ––– ––– ––– –––Analysed as:
Current – 66 – 14 —————— —————— —————— ——————
– 66 – 14 ––– ––– ––– –––The net liabilities in 2010 of £66,000 (2009 – £14,000) include £nil in Psion PLC (2009 – £14,000).
Foreign currency derivatives
The Group utilises currency derivatives to economically hedge future transactions and cash flows. The Group does not apply hedge
accounting and the financial instruments are accounted for at fair value through profit or loss. The Group is party to a variety of foreign
currency forward contracts in the management of its exchange rate exposures. The instruments purchased are primarily denominated in
the currencies of the Group’s principal markets.
At the balance sheet date, the total notional amount of outstanding forward foreign exchange contracts to which the Group has
committed is equivalent to £7,070,000 (2009 – £447,000). The fair value of the forward currency contracts was a liability of £66,000
(2009 – £14,000). The increase in the notional amount of the contracts relates to timing of entering the transactions prior to the year
end, whereas at the prior year end similar contracts were predominantly entered into shortly after the year end. All the open contracts at
the year end mature within 3 months of the year end (2009: within 3 to 6 months).
Foreign currency risk management
The Group undertakes transactions denominated in foreign currencies; consequently exposures to exchange rate fluctuations arise.
Exchange rate exposures are managed within approved policy parameters utilising forward foreign exchange contracts.
The carrying amounts of the Group’s foreign currency denominated monetary assets and monetary liabilities denominated in a
currency other than the functional currency of the entity in question at 31 December are as follows:
2010 2009 Assets Liabilities Assets Liabilities £000s £000s £000s £000s —————— —————— —————— ——————
Sterling 4,277 (281) 610 (34)
Euro 22,920 (946) 1,596 (547)
US Dollar 9,866 (1,559) 868 (73)
Canadian Dollar 6,543 (8,465) 4,787 (7,611)
Other 1,701 – – (54)
The increase in the Euro monetary assets held in subsidiary undertakings where the functional currency is not the Euro arises from
the restructuring of the European businesses during the year in the European Streamlining Project.
Capital risk management
Businesses in technology related industries are subject to risks of rapid change in markets and technology. It is the Group’s policy to
maintain a strong balance sheet as this provides the best balance of risk and reward for the company and shareholders. The board reviews
the Group’s capital structure regularly taking into account available cash balances, trends in technology and markets and investment
opportunities generally but especially in new product development.
Psion’s cash position is monitored and managed through the Group’s treasury risk management procedures which are described below.
The Group does not rely on long-term external borrowings and so is not subject to externally imposed capital requirements or
operational or financial covenants.
The Group’s processes for maintaining and managing capital are consistent with the prior year.
Treasury risk management
The principal treasury risks to the Group arise from exchange rate and interest rate fluctuations. The Board has approved policies for
managing risks, which are reviewed on a regular basis, including the use of financial instruments, principally forward foreign exchange
contracts. No transactions of a speculative nature are undertaken. There has not been any change in risk exposures, or processes for
managing the risks, during the year.
The principal transactional foreign currency exposures are to Euro and US Dollar revenues and US and Canadian Dollar costs. The
Group hedges certain net foreign currency cash flows in accordance with policies set by the Board. The Group does not hedge the foreign
exchange exposure arising on net investments in overseas subsidiaries.
Surplus funds are primarily invested in managed Liquidity Funds with instant access to the deposited funds. The Liquidity Funds are
rated AAAm by S&P, whose rating criteria stipulates that a minimum of 50% of the portfolio should be composed of A-1+ (or equivalent)
instruments in order for the fund to maintain a AAAm rating. The methodology S&P applies to calculate the A-1+ percentage counts A-1
(or equivalent) rated instruments maturing in seven days or less towards the A-1+ percentage minimums, as historical default rates on A-1
paper maturing within seven days are similar to the default rates of A-1+ issuers. By using such Funds counterparty risk for the Group is
reduced as the Funds deposit with a wide range of counterparties.
no
tes
to
th
e co
ns
oliD
ateD
fin
an
cial s
tatem
en
ts
For the year ended 31 Decem
ber 2010

21. Derivative financial instruments (continueD)
Market risks
Psion generates income in local currencies in most of the territories where it operates. Expenses related to the cost of sales are mostly
denominated in US Dollars. This is a function of the supplier terms in the electronics industry where the majority of components and
manufacturing services are priced in US Dollars even if purchased by Psion Teklogix Inc, our Canadian operating and manufacturing
subsidiary. Overheads are incurred in local currencies wherever the Group has sales, administration or engineering activities. A substantial
element of the administration and engineering overheads are incurred in Canadian Dollars. The profile of income and expenditure
by currency varies each year but broadly we expect to generate a surplus of Euros, and have net outflows in the US Dollar and the
Canadian Dollar.
Like our main competitors, the Group operates price lists denominated in Euros and US Dollars. Prices quoted in other currencies are
linked to these underlying price lists. Asia is linked to the US Dollar price list.
Our main competitors are US based multinationals who have a greater proportion of their sales in North America and a predominantly
US Dollar related cost base. This profile may lead them to adopt different pricing policies to which the Group must respond in order to
remain competitive in the market.
The following table sets out the impact on profit before tax of a 10% movement in foreign exchange rates arising from the re-translation
of the Group’s foreign currency monetary assets and monetary liabilities that are denominated in a currency other than the functional currency
of the entity holding the asset or liability.
Change Impact in foreign on profit exchange before tax rates £000s —————— ——————
Sterling 10% 444
Euro 10% 2,442
US Dollar 10% 923
Canadian Dollar 10% 700
Other 10% 189 —————— ——————
The sensitivity of net equity is illustrated in the following table: Change in foreign Impact exchange on equity rates £000s —————— ——————
Japanese Yen 10% 1,417
US Dollar 10% 312
Euro 10% 4
Other 10% (75) —————— ——————
In the year ended 31 December 2010 the effective rate of interest earned on average Group cash balances was 0.33% (2009 – 0.5%).
A 1% change in rates over the year would have changed the net interest on cash and borrowings by around £357,000 (2009 – £416,000).
22. DeferreD tax
The following are the major deferred tax assets and liabilities recognised by the Group and movements thereon during the current and
prior reporting period. Accelerated Other tax Investment temporary depreciation Tax losses tax credit differences Total £000s £000s £000s £000s £000s —————— —————— —————— —————— ——————
At 1 January 2009 1,043 2,343 1,674 5,884 10,944
(Charge)/credit to income (808) (1,627) (1,172) (1,099) (4,706)
Exchange differences (15) 2 4 (254) (263) —————— —————— —————— —————— ——————
At 31 December 2009 220 718 506 4,531 5,975
Reclassification (18) – (2) 20 –
Credit/(charge) to income 103 (632) 192 (2,296) (2,633)
Exchange differences 19 16 51 290 376 —————— —————— —————— —————— ——————
At 31 December 2010 324 102 747 2,545 3,718 ––– ––– ––– ––– –––
no
tes
to
th
e co
ns
oliD
ateD
fin
an
cial s
tatem
en
ts
For the year ended 31 Decem
ber 2010
82 / 83psion annual report & accounts 2010

22. DeferreD tax (continueD)
The table below presents an analysis of the other temporary differences that give rise to deferred tax assets and liabilities recorded in the
Group’s Balance Sheet: 2010 2009 £000s £000s —————— ——————
Research and development deduction 1,495 1,546
Provisions not deductible for tax 1,027 3,465
Other temporary differences 23 408
Withholding tax on unremitted earnings of overseas subsidiaries – (888) —————— ——————
2,545 4,531 ––– –––The following is the analysis of the deferred tax balances for financial reporting purposes: 2010 2009 £000s £000s —————— ——————
Deferred tax assets 3,718 6,863
Deferred tax liabilities – (888) —————— ——————
3,718 5,975 ––– –––Deferred tax assets in Psion Teklogix Corp. as at 31 December 2009 were written off in 2010. This was due to insufficient evidence of future
profitability.
At the balance sheet date, the Group has tax losses and other deductible temporary differences of £61,094,000 (2009 – £55,133,000)
available for offset against future profits. As well, the Group has tax credits of £14,354,000 (2009 – £11,084,000) available for offset
against future taxes payable. A deferred tax asset has been recognised in respect of £3,718,000 (2009 – £5,975,000) of such temporary
differences and investment tax credits. No deferred tax assets have been recognised in respect of the remaining £48,686,000 (2009 –
£36,286,000) of temporary differences and tax losses and £13,607,000 (2009 – £10,580,000) of investment tax credits due to the
unpredictability of future profit streams. Included in the unrecognised temporary differences and tax losses are capital losses of £7,385,000
(2009 – £7,153,000) with no expiry.
Included in unrecognised tax assets are amounts of £nil (2009 – £879,000) that will expire within twelve months of the year end and
£5,352,000 that expire between 2020 and 2027. The remainder have no expiry date. In addition, included in the unrecognised tax assets
are tax credits of £1,210,000 that will expire in 2013. The remainder expire in the period 2015 to 2030.
At the balance sheet date, the aggregate amount of temporary differences associated with undistributed earnings of subsidiaries for
which deferred tax liabilities have not been recognised was £51,643,000 (2009 – £48,933,000). A dividend was planned to be paid which
would have given rise to a withholding tax liability of £888,000. This was booked as a deferred tax liability in 2009. However, in 2010 the
Group started a reorganisation that will eliminate any withholding tax. As such, the Group has derecognised this deferred tax liability in
2010. No deferred tax liability has been recognised on the remainder of these differences because the Group is in a position to control the
timing of the reversal of the temporary differences and it is probable that such differences will not reverse in the foreseeable future.
At the balance sheet date, the Group recognised deferred tax assets of £2,447,000 (2009 – £5,111,000) in an entity which had suffered
a loss in either the current or preceding period. This is based on management’s assessment that it is probable that the entity will have
taxable profits against which the unused tax losses, unused tax credits and deductible temporary differences can be utilised. In support
of this the entity in question reported profits in the current year. Generally, in determining the amounts of deferred tax assets to be
recognised, management uses profitability information and, if relevant, forecast operating results, including a review of eligible carry-
forward periods, tax planning opportunities and other relevant considerations.
The Company
The Company had no recognised deferred tax assets or liabilities at 31 December 2009 or 2010.
At the balance sheet date, the Company has unused tax losses of £10,688,000 (2009 – £9,309,000) available for offset against
future profits. No deferred tax asset has been recognised in respect of these losses due to the unpredictability of future profit streams.
no
tes
to
th
e co
ns
oliD
ateD
fin
an
cial s
tatem
en
ts
For the year ended 31 Decem
ber 2010

23. oBligations unDer finance leases
Present value Minimum of minimum lease payments lease payments 2010 2009 2010 2009 £000s £000s £000s £000s —————— —————— —————— ——————
Amounts payable under finances:
Within one year 701 262 583 236
In the second to fifth years inclusive 1,612 1,048 1,451 946 —————— ——————
2,313 1,310
Less: future finance charges (279) (128) —————— —————— —————— ——————
Present value of lease obligations 2,034 1,182 2,034 1,182 ––– –––Less: amount due for settlement within 12 months (583) (236) —————— ——————
Amount due for settlement after 12 months 1,451 946 ––– –––It is the Group’s policy to lease certain of its fixtures and equipment under finance leases. The average lease term is 3.5 years (2009 –
3 years). For the year ended 31 December 2010, the average effective borrowing rate was 7.0% (2009 – 7.0%). Interest rates are fixed at
the contract date. All leases are on a fixed repayment basis and no arrangements have been entered into for contingent rental payments.
All lease obligations are denominated in local currencies.
The fair value of the Group’s lease obligations approximates their carrying value.
The Group’s obligations under finance leases are secured by the lessors’ charges over the leased assets (note 15).
24. traDe anD other payaBles
Group Company 2010 2009 2010 2009 £000s £000s £000s £000s —————— —————— —————— ——————
Trade creditors 23,775 21,663 174 134
Amounts owed to subsidiary undertakings – – 3,827 16,609
Other creditors 1,949 1,593 – –
Accruals and deferred income 26,485 25,462 969 777 —————— —————— —————— ——————
Current liabilities 52,209 48,718 4,970 17,520 ––– ––– ––– –––Trade and other payables principally comprise amounts outstanding for trade purchases and ongoing costs. The average credit period
taken for trade purchases is 45 days (2009 – 45 days) for the Group and 30 days (2009 – 30 days) for the Company.
The directors consider that the carrying amount of trade payables approximates to their fair value.
The maturity analysis of trade and other payables (other than non-monetary liabilities) is as follows:
Group Company 2010 2009 2010 2009 £000s £000s £000s £000s —————— —————— —————— ——————
1 to 3 months 32,259 25,539 4,806 17,520
3 to 6 months 3,053 896 164 –
6 to 12 months 1,413 3,688 – –
1 to 2 years 39 615 – –
Over 2 years 173 427 – – —————— —————— —————— ——————
36,937 31,165 4,970 17,520 ––– ––– ––– –––Amounts classified as maturing more than 1 year after the balance sheet date are classified as current liabilities as they are within the
normal trade cycle of the business for the class of liability.
no
tes
to
th
e co
ns
oliD
ateD
fin
an
cial s
tatem
en
ts
For the year ended 31 Decem
ber 2010
84 / 85psion annual report & accounts 2010

25. provisions
Group Company Onerous Onerous Warranty lease lease provision provision Total provision £000s £000s £000s £000s —————— —————— —————— ——————
At 1 January 2010 1,287 3,436 4,723 –
Transferred from subsidiary undertaking – – – 1,250
Provided in the year 2,360 – 2,360 –
Released as no longer required (292) – (292) –
Utilisation of provision (2,464) (1,203) (3,667) –
Unwinding of discount – 129 129 –
Exchange differences 119 1 120 – —————— —————— —————— ——————
At 31 December 2010 1,010 2,363 3,373 1,250 ––– ––– ––– ––– 2010 2009 2010 £000s £000s £000s —————— —————— ——————
Included in current liabilities 1,530 2,227 319
Included in non-current liabilities 1,843 2,496 931 —————— —————— ——————
3,373 4,723 1,250 ––– ––– –––The warranty provision represents management’s best estimate of the Group’s liability under warranties granted on products, based on
past experience and industry averages for defective products. The warranty provision is expected to be utilised over a period of 12 months
(2009 – 12 months).
The onerous lease provision relates to property leases in the Group’s discontinued operations. The amount relates to estimated losses
on vacant or sublet properties where lease commitments exceed anticipated future sublet income. The amount provided reflects
management’s best estimate of the expected liability and includes assumptions concerning income in future periods. The timing of cash
flows is dependant on the remaining terms of the leases, ranging from 4 to 10 years (Company – 4 years). At the year end an onerous
lease provision amount was transferred from a subsidiary undertaking to Psion PLC.
26. share capital
2010 2009 £000s £000s —————— ——————
Authorised:
177,539,973 (2009 – 177,539,973) Ordinary Shares of 15p each 26,631 26,631 ––– –––Issued and fully paid:
140,748,722 (2009 – 140,572,827) Ordinary Shares of 15p each 21,112 21,086 ––– –––During the year 175,895 Ordinary Shares were issued for cash in respect of the exercise of share options.
Reconciliation of issued share capital Number £000s ————————— ———————
At 1 January 2010 140,572,827 21,086
Exercise of share options 175,895 26 ————————— ———————
At 31 December 2010 140,748,722 21,1 12 –––––– –––Ordinary Shares
The Company has one class of ordinary shares which carry no right to fixed income.
no
tes
to
th
e co
ns
oliD
ateD
fin
an
cial s
tatem
en
ts
For the year ended 31 Decem
ber 2010

27. operating lease arrangements
As lessee Group Company 2010 2009 2010 2009 £000s £000s £000s £000s —————— —————— —————— ——————
Minimum lease payments under operating
leases recognised as expense in the year 4,314 4,319 510 852 ––– ––– ––– –––At the balance sheet date, the Group and the Company had outstanding commitments for future minimum lease payments under non-
cancellable operating leases, which fall due as follows: 2010 2009 2010 2009 £000s £000s £000s £000s —————— —————— —————— ——————
Within one year 4,139 3,704 510 852
In the second to fifth years inclusive 6,780 7,009 1,360 3,238
After five years 2,257 2,940 – 1,796 —————— —————— —————— ——————
13,176 13,653 1,870 5,886 ––– ––– ––– –––Operating lease payments represent rentals payable by the Group for certain of its office properties.
Leases have a weighted average term of 2.6 years (2009 – 2.7 years) and rentals are fixed for the majority of the lease term.
As lessor
The Group sublets part of its leased properties under operating leases. Property rental income earned during the year was £603,000
(2009 – £242,000).
At the balance sheet date, the Group and the Company have contracted with tenants for the following future minimum lease payments:
Group Company 2010 2009 2010 2009 £000s £000s £000s £000s —————— —————— —————— ——————
Within one year 673 370 212 370
In the second to fifth years inclusive 1,366 1,097 233 1,097
After five years 454 1,216 – 1,216 —————— —————— —————— ——————
2,493 2,683 445 2,683 ––– ––– ––– –––28. share-BaseD payments
Equity-settled share option plan
The Company operates a Portfolio Long-Term Share Plan under which options are exercisable at a price equal to the closing middle market
quotations, as derived from the Daily Official List of the London Stock Exchange, for the five business days immediately preceding the
date of grant, subject to relevant performance criteria being satisfied. The usual minimum vesting period is three years but options can
vest pro rata in a shorter time period where an employee leaves the Group for certain reasons such as ill-health or disability. Options
granted prior to November 2006 were granted under the Company’s Executive Share Option Scheme under which options are exercisable
at a price equal to the middle market quotation from the Daily Official List of the London Stock Exchange for the last trading day
immediately preceding the date of grant, subject to relevant performance criteria being satisfied. The usual minimum vesting period is
three years but some options can vest two years after grant where an employee leaves the Group for certain reasons such as ill-health or
disability.
IFRS 2 transitional provision
In accordance with the transition provision of IFRS 2, the Group has elected not to apply the provision of IFRS 2 to options granted on or
before 7 November 2002, or granted after 7 November 2002 which had vested by 1 January 2005.
The information below outlines the share option details used in the calculation of the share-based payment expense.
Options granted in May 2003 are exercisable subject to the adjusted earnings per share growth of the Company over the life of the
option up to the date of exercise exceeding the growth in the Retail Prices Index by an average of at least 3% per annum. Options granted
after May 2003 are subject to the above performance condition but these options will lapse if the performance criteria has not been met
by the fifth anniversary of grant.
Performance conditions applicable to options granted to Directors of Psion PLC are set out in the Directors’ Remuneration Report
on page 54.
no
tes
to
th
e co
ns
oliD
ateD
fin
an
cial s
tatem
en
ts
For the year ended 31 Decem
ber 2010
86 / 87psion annual report & accounts 2010

28. share-BaseD payments (continueD)
Details of the share options outstanding during the year are as follows:
2010 2009 EPS and Premium Priced TSR EPS and Premium Priced TSR Weighted Weighted Weighted Weighted No of average No of average No of average No of average share exercise share exercise share exercise share exercise options price options price options price options price £ £ £ £ —————— —————— —————— —————— —————— —————— —————— ——————
Outstanding at the beginning
of the year 5,379,486 1.11 – – 6,402,273 1.44 620,371 1.09
Granted during the year 2,099,957 0.88 1,382,986 – 2,040,000 0.69 – –
Exercised during the year (166,667) 0.68 – – (6,667) 1.02 – –
Lapsed during the year (1,757,161) 1.46 – – (3,056,120) 1.50 (620,371) (1.09) —————— —————— —————— —————— —————— —————— —————— ——————
Outstanding at the end
of the year 5,555,615 0.92 1,382,986 – 5,379,486 1.1 1 – – ––– ––– ––– ––– ––– ––– ––– –––Exercisable at the year end 1,142,158 1.21 1,186,761 1.21 ––– ––– ––– –––For the options exercised during the year the weighted average closing market price on the day of exercise was £0.73 (2009 – £1.10).
The options outstanding at the end of the year have a weighted average remaining contractual life of 7.4 years (2009 – 7.6 years).
The exercise prices ranged from £0.68 to £1.5825.
In 2010, the options were granted on 25 March (2009 – 31 March, 28 May and 29 September). The estimated fair values were calculated
using the Binomial option pricing model. The inputs into the model at each grant date and the estimated fair values were as follows:
2010 Premium 2010 2009 2009 2009 priced TSR March May Sept —————— —————— —————— —————— ——————
Weighted average share price 88.0p 88.0p 45.25p 62.80p 1 10.50p
Weighted average exercise price 88.0p 88.0p 68.00p 94.50p 1 12.75p
Expected volatility 90.30% 90.30% 84.70% 88.20% 89.10%
Expected life (years) 4 3 4 4 4
Risk free rate 0.50% 0.50% 0.50% 0.50% 0.50%
Expected dividend yield 4.32% 4.32% 8.18% 5.89% 3.35%
Number of options granted 2,099,957 1,382,986 1,960,000 60,000 20,000
£000s £000s £000s £000s £000s —————— —————— —————— —————— ——————
Fair value of options granted 968 668 318 16 12 —————— —————— —————— —————— ——————
Expected volatility was determined by calculating the historical volatility of the Company’s share price over the previous three years.
Expected life for EPS options used in the model has been adjusted, based on management’s best estimate, for effects of non-transferability,
exercise restrictions and behavioural considerations.
The Group recognised a total credit of £79,000 (2009 – credit of £411,000) related to equity-settled share-based payment transactions
during the year. The Company recognised a total charge of £264,000 (2009 – expense of £262,000).
Share options granted prior to 7 November 2002
The movements during the year to 31 December 2010 are as follows:
As at 1 Exercised Lapsed As at 31 Option January during the during the December pricePeriod of options Notes 2010 year year 2010 £ —————— —————— —————— —————— ——————
6 April 2003 to 5 April 2010 (a) 15,002 – (15,002) – 19.45
1 December 2003 to 30 November 2010 (a) 53,561 – (53,561) – 6.39
11 April 2004 to 10 April 2011 (a) 834 – – 834 2.10
3 October 2004 to 2 October 2011 (b) 1 18,366 (4,428) (2,069) 111,869 0.55
24 April 2005 to 23 April 2012 (c) 63,991 – (5,134) 58,857 1.05
15 October 2005 to 14 October 2012 (c) 64,494 (4,800) (334) 59,360 0.53 —————— —————— —————— —————— ——————
The performance conditions relating to the options in the table above are as follows:
(a) These options are exercisable subject to the adjusted EPS growth of the Company over the life of the options up to the date of
exercise exceeding the growth in the Retail Prices Index by an average of at least 3% per annum.
(b) These options are exercisable subject to both the Group sales in the most recently reported twelve months preceding the date of
exercise exceeding £150 million, and the consolidated pre-exceptional operating profit in the most recently reported twelve months
preceding the date of exercise exceeding 7% of the Group’s revenue.
(c) These options are exercisable subject to the consolidated sales in the most recently reported twelve months preceding the date of
exercise exceeding £140.0m (£146.0m for super options).
no
tes
to
th
e co
ns
oliD
ateD
fin
an
cial s
tatem
en
ts
For the year ended 31 Decem
ber 2010
29. retirement Benefit schemes
Defined contribution schemes
The Group operates various defined contribution retirement schemes for the benefit of employees.
The total cost charged to income of £1,020,000 (2009 – £885,000) represents contributions payable to these schemes by the Group
at rates specified in the rules of the plans. As at 31 December 2010 contributions of £79,000 (2009 – £7,000) due in respect of the current
reporting period had not been paid over to the schemes.
30. contingent liaBilities
From time to time the Group is exposed to claims of alleged infringement of agreements and patents which the Group vigorously defends.
Provision for costs is made when the likelihood of a case proceeding is adjudged as probable. Disclosure is made of potentially material
matters where, on the basis of legal advice, an adverse outcome cannot currently be judged as remote.
As reported in note 31 the Group will continue to incur costs defending claims and pursuing actions in connection with receivable and
alleged payable amounts in Japan. It is not possible to quantify the costs at present and they will continue to be expensed as incurred.
31. Japan
We have previously reported that the Group had engaged forensic consultants to investigate claims from trading partners of our Japanese
subsidiary Psion Teklogix KK (“PTKK”). These claims amounted to JPY 2.1 bn (£16.7 million at 31 December 2010 exchange rates) relating
to unauthorised trades and a guarantee of third party trading obligations.
The detailed results of our investigations have been submitted to the Japanese legal authorities and to senior management of the
owners of the largest claimant who commenced proceedings against us in the Japanese courts. We continue to resist this claim, and will
pursue any further actions necessary to defend our position. Discussions with the major claimant are at an early stage and remain ongoing.
No further claims have arisen since our interim results were reported on 12 August 2010. We have settled certain of the smaller claims
for amounts lower than was claimed. It is not possible to reasonably estimate how long it will take to resolve the remaining claims and
court actions, nor the amounts which may ultimately be paid. Accordingly, we continue to treat the remaining balances as contingent
liabilities and have made no provision. With exchange rate differences between Sterling and the Japanese Yen, the contingent liabilities
at 31 December 2010 are estimated at £15.4 million (JPY 1.95 bn) (December 2009 – £13.6 million (JPY 1.95 bn)).
No provision has been made for future legal and related costs as it is not possible to make a reliable estimate of them. Costs incurred
to the end of December 2010 in investigating the claims, legal fees, and additional travel costs amounted to £0.6 million (2009 – £2.9
million.). This amount was charged to exceptional operating costs in 2010. Future costs incurred will continue to be disclosed separately
within exceptional operating costs.
Offsetting the cash payments to date is an insurance settlement of £1.0m received in July 2010, which was recorded as a credit to
exceptional operating costs. In addition insurers agreed before the year end to repay an additional £83,000 towards costs incurred and
that has also been recorded as a credit to exceptional operating costs.
32. relateD party transactions
Group
Transactions between companies within the Group, which are related parties, have been eliminated on consolidation and are not disclosed
in this note.
Remuneration of key management personnel
The remuneration of the directors, who are the key management personnel of the Group, is set out below in aggregate for each of the
categories specified in IAS 24 “Related Party Transactions” 2010 2009 £000s £000s —————— ——————
Executive directors:
Short-term benefits 595 996
Post-employment benefits 15 18
Termination payments (a) 164 347
Share-based payments 264 (262) —————— ——————
1,038 1,099
Short-term benefits:
Chairman 110 83
Non-executive directors 157 104 —————— ——————
1,305 1,286 ––– –––(a) Provision for payment to Fraser Park after 31 March 2011.
no
tes
to
th
e co
ns
oliD
ateD
fin
an
cial s
tatem
en
ts
For the year ended 31 Decem
ber 2010
88 / 89psion annual report & accounts 2010

32. relateD party transactions (continueD)
Dividends paid to Directors during the year amounted to: £000s £000s —————— ——————
John Conoley 0.8 0.8
Stuart Cruickshank 0.4 –
Ross Graham 1.9 1.1
John Hawkins 0.7 0.6
Mike O’Leary 0.4 –
Fraser Park 6.1 3.8 —————— ——————
10.3 6.3 ––– –––Former director’s transactions
As reported last year David Potter, the former Chairman, continues to occupy an office which was previously used for both Psion and non-
Psion activities. A new lease is being negotiated by David Potter with the superior landlord but it has not yet been signed. David Potter
paid to Psion all the costs charged to Psion relating to the use of the office during 2010 and there was nothing outstanding between David
Potter and the Company at the year end.
Company
Transactions between the Company and its subsidiaries, which are related parties, are disclosed in accordance with IAS 24.
During the year, the Company entered into the following transactions, all of which were at arms length, with its subsidiaries:
Liabilities settled on Liabilities settled byManagement fees behalf of Psion PLC Psion PLC
2010 2009 2010 2009 2010 2009 £000s £000s £000s £000s £000s £000s —————— —————— —————— —————— —————— ——————
Subsidiary undertakings 1,399 2,393 201 352 571 436 ––– ––– ––– ––– ––– –––Psion PLC is the main business within the corporate sub-group of companies in the UK. In the normal course of business payments are
made by Psion Services Ltd. on behalf of Psion PLC, and Psion PLC makes payments on behalf of, primarily, Psion Digital Ltd. and Psion
Investments Canada.
The amounts owed by subsidiary undertakings net of provisions and the amount of the provisions are disclosed in note 19. The
amounts owed to subsidiary understandings are disclosed in note 24.
no
tes
to
th
e co
ns
oliD
ateD
fin
an
cial s
tatem
en
ts
For the year ended 31 Decem
ber 2010

2010 2009 2008 2007 2006 £000s £000s £000s £000s £000s —————— —————— —————— —————— ——————
Results
Revenue – continuing operations 174,498 170,042 199,364 199,740 190,649 ––– ––– ––– ––– –––Gross profit – continuing operations 66,707 63,685 86,354 81,288 80,850 ––– ––– ––– ––– –––Gross margin 38.2% 37.5% 43.3% 40.7% 42.4% ––– ––– ––– ––– –––Operating profit/(loss) – continuing operations 5,696 (3,055) (8,806) 9,454 6,504 ––– ––– ––– ––– –––Profit/(loss) before tax – continuing operations 5,683 (2,986) (7,622) 10,792 7,578 ––– ––– ––– ––– –––Profit/(loss) attributable to equity holders of Psion PLC 2,541 (7,152) (12,032) 7,812 5,566 ––– ––– ––– ––– –––Adjusted operating profit – continuing operations1 5,933 1,954 6,047 10,512 9,160 ––– ––– ––– ––– –––Assets employed
Non-current assets 134,564 122,865 136,670 100,637 107,161
Current assets 103,098 1 12,995 137,235 123,562 1 1 1,907
Non-current asset held for sale – – – 5,827 –
Current liabilities (55,682) (53,369) (56,229) (47,610) (41,533)
Non-current liabilities (1,653) (2,409) (2,860) (2,365) (1,862)
Non-current provisions (1,843) (2,496) (4,417) (3,394) (3,912) —————— —————— —————— —————— ——————
Net assets 178,484 177,586 210,399 176,657 171,761 ––– ––– ––– ––– –––Key statistics
Earnings/(loss) per share from continuing and discontinued operations 1.81p (5.09p) (8.58p) 5.60p 3.99p
Diluted earnings/(loss) per share from continuing and discontinued operations 1.81p (5.09p) (8.58p) 5.56p 3.95p
Adjusted earnings per share from continuing operations1 2.07p (3.18p) 2.58p 5.76p 5.31p
Dividend for the year 4.0p 3.8p 3.7p 3.6p 3.2p
1. Stated before profits related to acquisitions and disposals, the charge or credit for share-based payments, exceptional operating costs,
discontinued operations and gains on property sales.
five year
s
um
mar
y
90 / 91psion annual report & accounts 2010

Stock exchange: London
Index: PON.L
INVESTOR RELATIONS CONTACT
Email: [email protected]
Telephone: +44 (0)20 7535 4253
WEBSITE
For further up to date shareholder information, please visit www.psion.com/investor or use the following quick links:
Financial information: www.psion.com/reports
News releases: www.psion.com/news
Corporate governance: www.psion.com/corporategovernance
Share price information: www.psion.com/shares
NEWS ALERTS
To receive the latest news announcements and press releases by email, please visit www.psion.com/news and click on the news alert link.
ADVISERS
Corporate Brokers Solicitors
RBS Slaughter & May
250 Bishopsgate One Bunhill Row
London London
EC2M 4AA EC1Y 8YY
Auditor Bankers
Deloitte LLP HSBC
2 New Street Square 69 Pall Mall
London London
EC4A 3BZ SW1Y 5EY
Share Registrars Financial PR
The contact details for Equiniti are: Buchanan Communications
Equiniti 45 Moorfields
Aspect House London
Spencer Road EC2Y 9AE
Lancing
West Sussex
BN99 6DA
Share Registration Helpline +44 (0)871 384 2168
Textel/Hard of hearing line +44 (0)871 384 2255
Shareviewdealing helpline +44 (0)8456 037037
Single Company ISA helpline +44 (0)871 384 2244
The Registrars should be contacted directly if you have a query regarding the registration of your shares such as moving house or a lost
share certificate.
www.shareview.co.uk
Shareview is a service from Equiniti which enables you to check your holdings in Psion and many other UK companies and helps you to organise
your investments electronically. To register free of charge you just need your ‘shareholder reference’ which is printed on your share certificate.
When you have registered with the site you can register your proxy instruction online.
Financial Calendar
Annual General Meeting 6 May 2011
Payment of final dividend 13 May 2011
(Record Date: 15 April 2011)
Announcement of 2011 Interim results August 2011
Announcement of 2011 Final results February / March 2012sh
ar
eh
olD
er
es
sen
tials
, aD
vis
er
s an
D fin
an
cial calen
Dar

92 / 93psion annual report & accounts 2010
psion plc
Group Headquarters:
48 Charlotte Street
London
W1T 2NS
T: +44 20 7535 4253
Psion International
Sales offices:
north america
canaDa
Psion Inc
2100 Meadowvale Blvd.
Mississauga, Ontario
L5N 7J9
T: +1 905 813 9900
uniteD states
Psion Corp.
3000 Kustom Drive
Hebron
Kentucky 41048
T: +1 800 322 3437
europe, miDDle east
& africa
Belgium
Psion NV
Nieuwe Weg 1
2070 Zwijndrecht
T: +32 3250 2200
DenmarK
Psion Denmark ApS
Vesterballevej 1
DK-7000 Fredericia
T: +45 7 624 0133
france
Psion SAS,
Psion Europe SAS and
Psion EMEA SAS
Parc de la Duranne
135 Rue Rene Descartes
BP 421 000
13591 Aix En Provence
Cedex 3
T: +33 4 4290 8809
germany
Psion GmbH
Jakob-Kaiser-Str 3
47877 Willich Münchheide
T: +49 2154 9282 135
italy
Psion Srl
Piazza Don Mapelli 75
Sesto San Giovanni
20099 Milan
T: +39 02 2412471
netherlanDs
Psion BV
Biesboschhaven Zuid 10c
4251 NM Werkendam
T: +31 183 67 87 33
spain
Psion SL
Edificio ASTROLABIO
Avda Cerdanyola 92-94
Barcelona
08173 Sant Cugat del Vallés
T: +34 902 884 220
switZerlanD
Psion sarl
Technopark Jagerstrasser
Winterthur, CH-8406
T: +41 52 209 0010
uniteD KingDom
Psion (UK) Ltd and
Psion Shared Services Ltd
Bourne End Business Centre
Cores End Road
Bourne End
Bucks
SL8 5AS
T: +44 1628 648 800
rest of the worlD
argentina
Psion de Argentina S.A.
1 1 de Septiembre 4717 Piso 5 C
C1429BJM
Buenos Aires
T: +54 11 4704 9900
china
Psion Wireless Technologies
(Shanghai) Ltd.
1202 Unicom International Tower
1033 Changning Road
Shanghai 200050, PRC
T: +86 21 5273 5188
inDia
Psion Systems India Private Limited
2nd Floor A-230
Okhla Industrial Area Phase 1
New Delhi 1 10 020
T: +91 1 1 4107 4500
singapore
Psion Asia Pacific Pte. Limited
152 Beach Road
#22-03/04 Gateway East
Singapore
T: +65 6288 0700
south africa
Psion Africa (Proprietary) Limited
Ground Floor E
Waterfall Park, Bekker Rd.,
Midrand 1685
T: +271 1 8057 440
ps
io
n w
or
lD
wiD
e
The paper used in the front section of this report contains material sourced from responsibly managed forests,certified in accordance with the FSC (Forest Stewardship Council) and is totally recyclable and acid-free.
The paper used in the back section of this report is produced with FSC mixed sources pulp which is fully recyclable,biodegradable, pH Neutral, heavy metal absence and acid-free. It is manufactured within a mill which complies withthe international environmental ISO 14001 standard.
Fulmar Colour is FSC certified, PEFC certified and ISO 14001 certified showing that it is committed to all roundexcellence and improving environmental performance is an important part of this strategy. We aim to reduce atsource the effect our operations have on the environment, and are committed to continual improvement, preventionof pollution and compliance with any legislation or industry standards.
Fulmar Colour is a Carbon Neutral Printing Company.
Designed and produced by MAGEE
www.magee.co.uk
Printed by Fulmar Colour
ISO 14001 REGISTERED
DNV Certification BV 013

Registered in England. No. 1520131. VAT No. GB 393 8220 35
Registered Office. 48 Charlotte Street, London W1T 2NS
Additional resources available online:
www.psion.com
www.IngenuityWorking.com
psion annual report & accounts 2010
ingenuity is working
we are now ready for growth
Psio
n Annual Report & Accounts
2010