a reliable new 2-stage distributed interactive tgs system based...
TRANSCRIPT

98IEICE TRANS. INF. & SYST., VOL.E89–D, NO.1 JANUARY 2006
LETTER Special Section on Artificial Reality and Telexistence
A Reliable New 2-Stage Distributed Interactive TGS SystemBased on GIS Database and Augmented Reality
Seungjun KIM†a), Student Member, Hojung KIM†, Seongeun EOM†b),Nitaigour P. MAHALIK†, and Byungha AHN†c), Nonmembers
SUMMARY Most of the traveller guidance services (TGS) are basedon GPS technology and generally concerned with the position data map-ping on the simplified 2D electronic map in order to provide macro levelservice facility such as drive direction notifications. Digital GIS based GPSentails in situ intuitive visualization. The visually enhanced TGS can im-prove the global and local awareness of unknown areas. In this paper, wepropose a reliable new TGS system that provides 3D street as well as pin-pointed destination information in two stages of its interactive services;web-based and AR-based. The web server generates a guiding path on 2Ddigital map and displays 3D car-driving animation along the path. And,the AR-based service is embedded so that users can interactively obtain thedetailed micro-level information of a specific section in the area with theirfingertips. The implementation is based on autoformation of on-line GISdata structures from the available priori. For the verification, a 5×4 roadnetwork is selected as a test area. In the service demonstration, we showthe effective awareness of street environments and the usefulness of thisnew TGS system.key words: traveller guidance service, GIS, ITS, fingertip interaction, aug-mented reality
1. Introduction
With the high growth of GPS (Global Positioning System)technology research and development on digital, GIS (Ge-ographical Information System) has drawn significant at-tention in transportation, topographical, military and aca-demic fields in order to foster powerful spatial analyticalcapabilities. The effective visualization of geospatial infor-mation tends to center around the offer of intuitive visual-information whose range and details are determined accord-ing to the types of GIS database services. The creation ofnew geospatial database that is appropriate to the services(macro- or micro-level) becomes an indispensable processfor the reliable and effective realization of digital GIS [1]–[4].
At the same time, visualization of geospatial data isone of the most active application areas for augmented re-ality (AR) and computer graphics technology. The note-worthy researches on the geospatial application of AR wereperformed in Tinmith project [5] and AR PRISM inter-face [6]. Tinmith project has focused on the mobile outdoor
Manuscript received March 11, 2005.Manuscript revised June 19, 2005.†The authors are with the Department of Mechatronics,
Gwangju Institute of Science and Technology (GIST), 1 Oryoung-dong, Buk-gu, Gwangju, Korea.
a) E-mail: [email protected]) E-mail: [email protected]) E-mail: [email protected]
DOI: 10.1093/ietisy/e89–d.1.98
AR system that integrates subsystem modules and wearablecomputing, head-mounted display, compass and interactiontools. It can be applied for city models creation, metro 3Dbuilding construction, and wire frame campus building de-sign. In Nicholas R. Hedley and his colleagues’ work [6]–[8], explorations in the use of hybrid user interfaces for col-laborative geographic data visualization were shown with asummary of GIS- and VR-related demonstration. Also, dueto the convenience of network service and user-friendly con-trol, integration of 3D technologies has taken momentum toimprove the visualization capability in GIS [9], [10]. Fur-ther, we emphasize that the design of user-friendly interfaceis becoming a kind of de facto principle in realizing effectiveGIS system [11].
Most of recent urban areas are systematically con-structed with city planning so that the information onmetropolitan road network and its traffic facilities becomesvery important geospatial information to travellers. In thispaper, we present a TGS (Traveller Guidance Service) sys-tem with two different service types, web-based and AR-based, taking into account of real-world constraints of thetarget regions in a metropolitan district. Firstly, we haveimplemented a web-based system with newly proposed GISdata structures of an urban area, and then shown how it canbe converted to the AR interaction service for a specific sec-tion in the area. In particular, the following attempts havebeen made, in order to design a full-fledged reliable two-stage TGS system.
• Requirement analysis for new 3D TGS• Prototype platform design of 2-stage 3D TGS system• Novel GIS-based geospatial data structure• Detailed 3D representation of the test district• AR interfacing for interactive TGS
We performed several case studies by using the de-signed platform. The system works well with maximumsatisfaction. This paper demonstrates only one experiment.
2. Requirement Analysis
2.1 Apprizing TGS Systems
The services of GIS-based TGS systems can be divided intothree layers; Web-based district information service, Web-based traffic information service and CNS (Car NavigationSystems) service.
Copyright c© 2006 The Institute of Electronics, Information and Communication Engineers

LETTER99
The first web-based district information services offerliteral- or pictorial-type information about the major facili-ties such as hospitals, theaters or restaurants in a district withbriefly-sketched guidance map. ‘Keyword search’ is widelyused as an inquiry method for the information. The serviceis focused on the geospatial position guidance so that routeguidance to the target place is well presented while the in-formation on neighborhood road conditions is less consid-ered. It was importantly reported, however, that travellersin their first visit to a target place rely preferentially ontraffic-control or road sign (44.3%) and road map (24.8%)according to the latest surveys concerned with the road signsystem [12], [13]. Slight difference of the actual road envi-ronment from the traveller’s estimation can not cause onlymistaking the route but also incident under driving [3], [14],[15]. In addition, 3D figuration of the facility outlines hasbeen recently provided to enhance user’s visual intuitivenessin the manner of positioning box-like graphic primitives onthe sloping 2D map. Although 3D maps using 3D viewpointcontrol have been experimentally introduced, however, ithas difficulty in the construction of supportable geospatialdatabase in actuality as well as is still at an early stage [19].
Next, traffic information services offer highly-reliableinformation about traffic conditions, public transportationguide, weather, or construction region by utilizing RF-beacon & probe vehicles, traffic correspondents or CCTV.However, the users are very few due to the high cost as wellas tend to rely on their empirical knowledge because trafficcongestion in the National Capital region becomes almostchronic so that only traffic information itself is not help-ful [14]. In the case of most public transportation guide,database is well constructed; however, vehicles’ intervalsare usually unkept and the locations of their stops are hardto find in actual environment except subway.
The last CNS services provide users’ position infor-mation usually on GPS terminals such as PDA in GIS-mapstyle representation. Optimal or shortest route informationis complementally offered. Differently from the web-basedservices, a GPS receiver, a terminal and a digital map arenecessary. While the road images are simplified in 2D ver-tex and line form at the early stage, the information aboutthe road and its surrounding environment to be representedin 3D has been attempted, noticeably in Japan.
2.2 Key Requirements
For the configuration of our service items and the reliabil-ity validation afterward, we specified users’ requirementsfor TGS by e-mail questionnaire method before our imple-mentation. In the way of priority marking, three categorieswere asked to fifteen applicants who were computer liter-ate: (1) preference to the existing road-traffic informationin real-live driving situation, (2) defects of the existing 2Dweb-based TGS, and (3) demands for useful 3D TGS. Thefollowing major results of each category are firstly consid-ered for our TGS system implementation.
• The most helpful information in real-live driving situa-tion is the directional board and crossroad information.• The first defect is the absence of directional board and
neighborhood building information.• Realistic and detailed representation of the road ap-
pearance will be more helpful than of traffic facility (Tothe level of road width and the number of car lanes).
3. System Overview
3.1 Modular Representation of Target Area
The representation of target area is modular in nature.Firstly, we selected a test area and a section; a subset of thetest area. The ‘area’ means a region composed of metropoli-tan road network such as streets and avenues. Bearing inmind that a matrix of paths where the public transport isavailable and travellers can mainly pass through only by ve-hicles, the ‘section’ in the area implies a smaller region likea kind of prepared land for building lots such as a town,a complex or a zone of interest (e.g. a company town, aresearch institute, a university campus, a general hospitalzone, a shopping town with many malls, a tourist zone, astadium complex, an apartment complex, etc). Hence, thesection is very likely to be a destination place to the trav-ellers. We define the macro- and micro-service in 2-stageTGS system as web-based TGS for the area and AR-basedTGS for the section, respectively. As shown in Fig. 1, wehave selected a 5×4 road network of Gangnam in Seoul, Ko-rea, as a test area and our institute GIST (Gwangju Instituteof Science and Technology) as a section, and then we makethe section be positioned at a destination-candidate place inthe area for service demonstration.
3.2 Prototype 2-Stage 3D TGS System
Based on the reliable GIS sources, we newly design a mod-ule in order to incorporate novel geospatial data structures,SMFs (GIS metafile format co-produced by SI lab of GISTand Symtech System, Inc. [16]), for links, nodes and trafficfacilities in the test area. The physical and logical config-uration is presented in Sect. 4.1. The data sessions of eachstructure are constructed using a custom-built data-editingprogram module (DEPM). With the help of the module, the3D geospatial database can be constructed by adding somesupplementary data like texture images, building geometriesand informative texts. The architectural design view of themodule for database generation is shown in Fig. 2.
As shown in the figure, our system offers two differenttypes of services, Web-based and AR-based, which dependon the district scope, area and section. In the web-basedservice, there are two subsystems, a video retriever and apath generator, which works while a client user connectsto the traveller guidance site via Internet. If s/he selects adeparture and a destination place in the test area, the pathgenerator determines the shortest path between them and

100IEICE TRANS. INF. & SYST., VOL.E89–D, NO.1 JANUARY 2006
Fig. 1 Test area and section.
Fig. 2 System architecture of the prototype TGS system.
makes an animation sequence list of the path. Then, thevideo retriever mounts the link and node videos recorded inthe graphic engine sequentially on the server according tothe list. And the video retriever is independently interfacedon the applied shortest path algorithms of the path generator.In this service, the user can confidently obtain the 3D streetinformation and the 2D guide path of the area.
The AR-based service is related to the destination sec-
tion of interest in the area. A generic monitor-based AR sys-tem with ARToolKit [17] is designed and interfaced. Thisfundamental AR environment setting is employed for thefast prototyping while expecting future extension of its plat-form combined with widely-used see-through HMD (Head-Mounted Display) or other displays in spatial AR applica-tions [22]. The user needs a web-camera and a rectangularboard as a tracking feature. The feature tracker analyzesthe captured scene from the camera and tracks the featurerectangle. The tracker can calculate the spatial relationshipbetween the board and the cam in 4×4 transformation ma-trix form, which is performed through the processes; imagethresholding→ connected region detection→ contours de-tection → line extraction and corner detection. Finally, theimage mixer overlays the virtual imagery of the graphic en-gine on the live video scene. In this service, the fingertip in-teraction function has been implemented, which is describedin Sect. 4.3.
Besides DEPM, the other module of primary interest isthe graphic engine that facilitates animation control. Thegraphic engine is developed taking into account of datastructures and each service type. The engine retrieves nu-merical data from the database and performs geometric cal-culations and 3D rendering techniques. The animation con-trol module, which configures the viewpoint navigation andrecords the rendered scenes in the selected video formats,has been embedded into the engine. It provides fully 3Dstreet models for the area and mixed models of 3D build-ings and 2D map texture for the section. The 3D graphicalmodelling of the street components is described in Sect. 4.2.
4. Modelling and Implementation
4.1 Geospatial Data Structure Design
To design a new GIS format for the test area, field investiga-tion for texture images based on the electronic topographicalmaps on scales of 1:1000 and 1:5000 of Korea National Ge-ographic Information Institute was conducted in first place.Our geospatial database is built in layered structure apply-ing persistent topology approach [18] for the enforcementof data consistency and more efficient storage of geospatialdata.
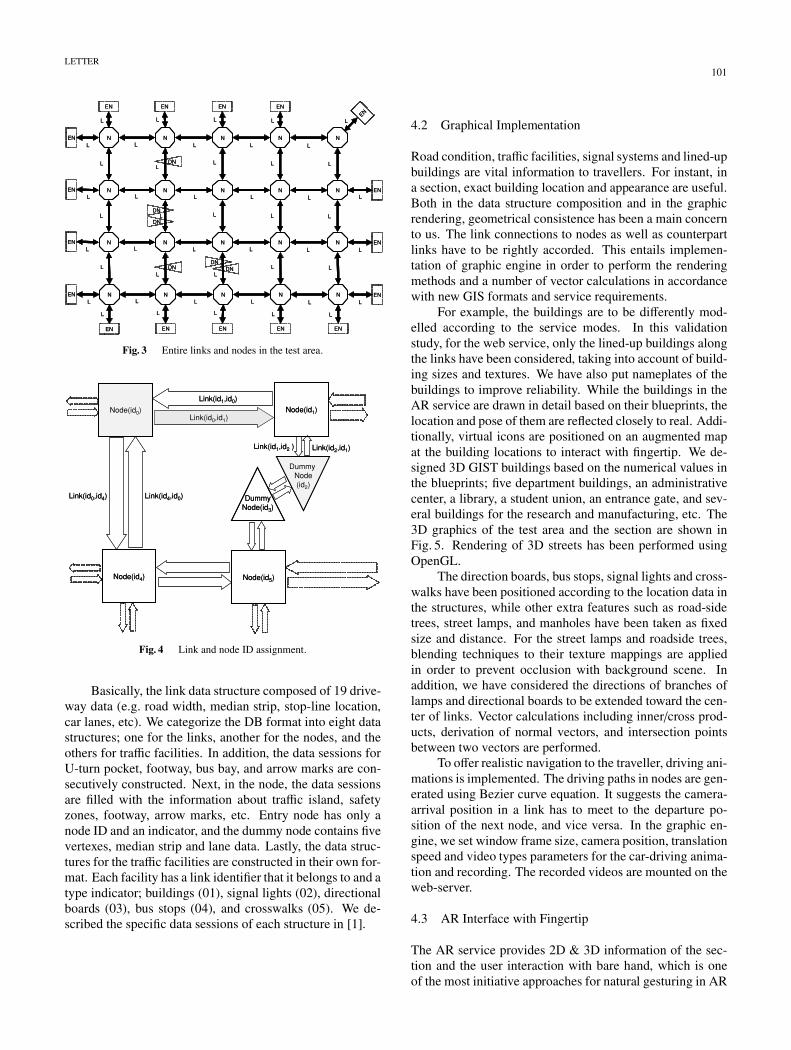
As shown in Fig. 3, the test area is composed of 102links (L) and 43 nodes; 20 general nodes (N), 17 entry nodes(EN) and 6 dummy nodes (DN). The ‘link’ represents a halfside of a straight roadway and the ‘node’ is a crossroad be-tween diverged links. The node IDs are assigned with fourdigits. Link IDs are automatically determined with eightdigits derived from up-node ID and down-node ID. Later,we have used these IDs for handling animations. As shownin Fig. 4, link (id0,id1) represents the connected drivewayfrom node (id0) to node (id1). The neighboring nodes areconnected with two contrary directional links. The ‘dummynode’ is defined for the creation of curved links as shownin the figure and the ‘entry node’ is the outer border of thearea.
LETTER101
Fig. 3 Entire links and nodes in the test area.
Fig. 4 Link and node ID assignment.
Basically, the link data structure composed of 19 drive-way data (e.g. road width, median strip, stop-line location,car lanes, etc). We categorize the DB format into eight datastructures; one for the links, another for the nodes, and theothers for traffic facilities. In addition, the data sessions forU-turn pocket, footway, bus bay, and arrow marks are con-secutively constructed. Next, in the node, the data sessionsare filled with the information about traffic island, safetyzones, footway, arrow marks, etc. Entry node has only anode ID and an indicator, and the dummy node contains fivevertexes, median strip and lane data. Lastly, the data struc-tures for the traffic facilities are constructed in their own for-mat. Each facility has a link identifier that it belongs to and atype indicator; buildings (01), signal lights (02), directionalboards (03), bus stops (04), and crosswalks (05). We de-scribed the specific data sessions of each structure in [1].
4.2 Graphical Implementation
Road condition, traffic facilities, signal systems and lined-upbuildings are vital information to travellers. For instant, ina section, exact building location and appearance are useful.Both in the data structure composition and in the graphicrendering, geometrical consistence has been a main concernto us. The link connections to nodes as well as counterpartlinks have to be rightly accorded. This entails implemen-tation of graphic engine in order to perform the renderingmethods and a number of vector calculations in accordancewith new GIS formats and service requirements.
For example, the buildings are to be differently mod-elled according to the service modes. In this validationstudy, for the web service, only the lined-up buildings alongthe links have been considered, taking into account of build-ing sizes and textures. We have also put nameplates of thebuildings to improve reliability. While the buildings in theAR service are drawn in detail based on their blueprints, thelocation and pose of them are reflected closely to real. Addi-tionally, virtual icons are positioned on an augmented mapat the building locations to interact with fingertip. We de-signed 3D GIST buildings based on the numerical values inthe blueprints; five department buildings, an administrativecenter, a library, a student union, an entrance gate, and sev-eral buildings for the research and manufacturing, etc. The3D graphics of the test area and the section are shown inFig. 5. Rendering of 3D streets has been performed usingOpenGL.
The direction boards, bus stops, signal lights and cross-walks have been positioned according to the location data inthe structures, while other extra features such as road-sidetrees, street lamps, and manholes have been taken as fixedsize and distance. For the street lamps and roadside trees,blending techniques to their texture mappings are appliedin order to prevent occlusion with background scene. Inaddition, we have considered the directions of branches oflamps and directional boards to be extended toward the cen-ter of links. Vector calculations including inner/cross prod-ucts, derivation of normal vectors, and intersection pointsbetween two vectors are performed.
To offer realistic navigation to the traveller, driving ani-mations is implemented. The driving paths in nodes are gen-erated using Bezier curve equation. It suggests the camera-arrival position in a link has to meet to the departure po-sition of the next node, and vice versa. In the graphic en-gine, we set window frame size, camera position, translationspeed and video types parameters for the car-driving anima-tion and recording. The recorded videos are mounted on theweb-server.
4.3 AR Interface with Fingertip
The AR service provides 2D & 3D information of the sec-tion and the user interaction with bare hand, which is oneof the most initiative approaches for natural gesturing in AR

102IEICE TRANS. INF. & SYST., VOL.E89–D, NO.1 JANUARY 2006
(a) Test area
(b) Test section
Fig. 5 3D graphic outlines.
applications [19], [20]. Open-source library, ARToolkit, isused to calculate camera pose relative to known patterns at30 frames per second utilizing IBM compatible desktop PC,fast enough to augment video. The AR module can be inte-grated into the existing workplace using available state-of-the-art interface technologies. Besides, different AR con-tents (CG contents including interaction mode) of a sectioncan be individually offered at a time by employing severalpatterned-markers.
Fig. 6 AR interaction procedures with fingertip.
For the stable augmentation, we have employed amulti-type pattern formed by four markers as a tracking fea-ture. Although hands or fingers occlude some of markers,augmentation is ensured by detecting other visible mark-ers. And, a noise filter is applied to resolve the tremblingproblem of augmented virtual models in the user’s staticview state. Four corner vertices of marker are tracked whileshowing slight but flickering variation, which affects the el-ement values of transformation matrix from marker to cam-era coordinates. It is almost unaware in the user’s dynamicview state; however, it can disturb users’ observation in theirstatic view. So, in our system, those elements are enforcedto take the average of previous values when the variationsare within given constraint. If the variation is larger thanthe constraint, the motion of marker is regarded as in thedynamic state and the filtering pauses.
Using this integrated system, users can control virtualicons with their fingertip navigating over the map, whichacts like a mouse pointer. Fingertip detection is conductedwhile a hand encroaches on the patterned area. If fingertipstays on the virtual icon areas for a second, it is recognizedas a mouse clicking and the predetermined functions are ex-ecuted. To reduce searching area, dynamic region search-ing [21] is applied. And fixed threshold value is used to de-tect the hand feature. The fingertip position determined bythe minimum value of the hand feature in screen coordinateshas been compared with the screen-projected coordinates ofthe virtual icons in 3D world space. In Fig. 6, the task pro-cedures between the hand estimation and augmentation pro-cess is shown.
This AR-based TGS is interfaced to web-based TGSsystem by three Boolean-type control parameters; micro-service request, node ID request and arrival flag. When aweb-based TGS operation is completed, node ID of the des-tination is referred to the AR interface. Arrival flag is alsotransferred at this time. As shown in Fig. 7, AR contents ofthe destination node is processed since arrival flag parameterand node ID data are transferred.

LETTER103
Fig. 7 Operation of AR interface by web-based TGS interface.
5. Service Demonstration
Figures 8 and 9 show an experimental demonstration withregard to the services that the designed guidance system pro-vides. In order to use, first of all the user has to establisha connection to the web-based traveller guidance site. Atthis point, choices of departure and destination place likesubway stations, well-known hospitals, famous companies,etc are made. The site then displays the shortest path on2D guidance map, which in turn provides information oncrossroads and/or turns. The passing time and distance isautomatically predicted. In the demo, a subway station andGIST are selected as the departure place and as the destina-tion place, respectively.
The street information with 3D car-driving animationinterfaces five items; a main 3D view, a 2D path map, afront directional board, turning direction indicators, and an-imation control keys. While passing along the 3D streets,the site informs us the next turning direction, the present po-sition on the 2D path map, and a directional board that thetraveller would meet at the front crossroad. Moreover, thestreet condition of unknown area such as the road widths,lined-up buildings with their nameplates, the availability ofU-turns and the existence of bus bays or pockets can beknown in advance.
The last animated node prompts the traveller to availthe AR service for the desired section. Since, the travellerhas arrived in a destination section, the search for the spe-cific building should start. The detail 2D map of the sec-tion is augmented on a multi-type pattern. The map imageryover-laid on the board can be switched according to the sec-tions.
There are virtual icons located at the exact building po-sitions on the map. To get the detailed building information,the user clicks on one of them with fingertip or mouse. Then,the appropriate 3D building model is overlaid on the map.Its appearance and pose are reflected on it, as well as the textinformation like building name is annotated. The user canmove and rotate the patterned board as if the destination sec-tion is miniaturized on it. Additionally, there are two extra
Fig. 8 Web-based service for area.
Fig. 9 AR-based service for section.
views on the screen; right-top view which reports the presentfingertip position and the detected marker ID, right-bottomview which shows the outlines of the building in animation.These are independently displayed on the board motion (SeeFig. 9). The interaction steps are explained in Fig. 10.
For the validation of the proposed implementation, theprior applicants have been asked to visit our demonstrationsite. And reliability and usability are tested in questionnairemethod by scoring. Specific procedures and interim resultswere reported in [1], [16]. In the reliability test, none of ser-vice items was evaluated as dissatisfaction. It seems because

104IEICE TRANS. INF. & SYST., VOL.E89–D, NO.1 JANUARY 2006
Fig. 10 Interaction steps in AR-based TGS (captured in mouse-interaction mode).
Table 1 Usability summary.
Index Service items
Very useful 2D path guidance/ Front board notification
Useful3D driving simulation/ Detailed road outlines/ Buildingnameplate/ Front turning direction/ Present movementdirection
Useless Nothing
Opinions(future
demands)
- Flexible viewpoint movement in 3D screen- Public transportation information- Point-navigating display of the present position on 2Dmap
the implementation of our system has been initiated on thebasis of the reliability requirement specification.
The usability of our TGS system is evaluated as in Ta-ble 1. We have noted two interesting results. One is thatthe applicants demanded higher viewpoint than driver’s realview in 3D screen. And the path guidance on 2D map wasevaluated higher than 3D driving simulation for the pathcontrary to their prior requirement. At the same time, mostof the applicants have gazed devotedly the varying presentlink notification on the map in accordance with the 3D sim-ulation above other existing TGSs of Sect. 2.1. It means thatthe 3D service items as TGS complements manifest the en-hancement of users’ immersion in the service enough as ex-pected. Nevertheless, the service items for the global aware-ness of the target area are prior to the realistic representation.
6. Conclusion
In this paper, we have presented a reliable interactive trav-eller guidance service (TGS) system with what we callmacro and micro service facilities through web- and AR-based implementations, respectively. Compared with theexisting TGS systems, the designed platform provides morerealistic street condition in 3D domain. From web-based
service, the traveller can easily obtain the visually enhancedstreet information on the guiding path and from the AR-based service, the pin-pointed destination (micro service) ina specific section of an area is confidently acquired throughintuitive interaction with fingertip. In the validation of theproposed implementation, we have demonstrated that the 2-stage platform performs well providing satisfactory usabil-ity as 3D TGS. The reliability was tested based our severalexperiments and questionnaire method. The flat plane satel-lite imagery-like animated view needs to be amended to re-flect the altitude of the ground for more realistic geographyvisualization. Further, practical AR platform and interactionmay be accounted for future considerations.
Acknowledgements
This work was supported by the Ministry of Constructionand Transportation (MOCT) and carried out as a joint re-search of GIST and SimTech Systems INC in Korea. Theauthors gratefully acknowledge the contribution of Dr. Eu-nseok Choi in SAIT (Samsung Advanced Institute of Tech-nology) and Myunghwan Bae in SimTech Systems.
References
[1] S.J. Kim, S.E. Eom, S.C. Byun, S.M. Yang, and B.H. Ahn, “Trav-eler guidance system based on 3D street modeling,” Proc. 2004Int’l Conf. on Control, Automation and Systems (ICCAS 2004),pp.1187–1190, Bangkok, Thailand, Aug. 2004.
[2] H.J. Kim, J.S. Han, T.H. Shin, and B.H. Ahn, “Development of3D interface program for the micro traffic simulation —Focused onNETSIM—,” Proc. Korean Society of Transportation fall AnnualConference, pp.23–27, 2000.
[3] H.J. Kim, S.A.A. Shah, H.H. Jang, and B.H. Ahn, “Microscopicsimulation in decision support system for the incident induced trafficmanagement,” Proc. 9th Int’l Conf. on Knowledge-based IntelligentInformation & Engineering Systems (LNCS/LNAI 368), pp.255–260, 2005.
[4] Y.S. Cho, H.J. Kim, and S.K. Lee, “Development of microscopictollgate simulation using SIMPLUS,” KSCE J. Civil Eng., vol.22,no.6-D, pp.1045–1055, 2002.
[5] Tinmith Project, http://www.tinmith.net/[6] N.R. Hedley, M. Billinghurst, L. Postner, R. May, and H. Kato,
“Explorations in the use of augmented reality for geographic visual-ization,” Presence: Teleoperators and Virtual Environments, vol.11,no.2, pp.119–133, April 2002.
[7] N.R. Hedley, C.H. Drew, E.A. Arfin, and A. Lee, “Hagerstrand revis-ited: Interactive space-time visualizations of complex spatial data,”Informatica, vol.23, no.2, pp.155–168, 1999.
[8] T.A. Slocum, C. Blok, B. Jiang, A. Koussoulakou, D.R. Montello, S.Fuhrmann, and N.R. Hedley, “Cognitive and usability issues in geo-visualization,” Cartography and Geographic Information Science,vol.28, no.1, pp.61–75, 2001.
[9] M. Reddy, Y. Leclerc, L. Iverson, and N. Bletter, “TerraVisionII:Visualizing massive terrain databases in VRML,” IEEE Comput.Graph. Appl., vol.19, no.2, pp.30–38, 1999.
[10] C. Zhu, E.C. Tan, and T.K. Chan, “3D terrain visualization for webGIS,” Proc. Map Asia 2003, AD65, 2003.
[11] N.P. Mahalik, J.H. Ryu, and B.H. Ahn, “Simulation integrated man-agement for embedded DCN,” Comput. Stand. Interfaces, 2005 (inpress).
[12] Final Report, “Road sign design system development project,” SeoulDevelopment Institute, Korea, 1998.

LETTER105
[13] Y.G. Lee, S.K. Park, and H.M. Kim, “Improvement of traffic infor-mation system for traffic safety —Focused on VMS—,” ResearchReport, Traffic Safety Authority, 2004.
[14] S.A.A. Shah, H.J. Kim, S.K. Baek, H.H. Chang, and B.H. Ahn, “In-cident impacts forecasting for non-recurrent freeway traffic conges-tion management,” Proc. 3rd Int’l Conf. on Computers, Communi-cations and Control Technologies: CCCT’05, pp.134–139, 2005.
[15] S.A.A. Shah, H.J. Kim, and B.H. Ahn, “Post-incident decision sup-port system for freeway incident analysis and traffic management,”Int’l ITS Conference, pp.67–74, 2005.
[16] SimTech and GIST, Final Research Report, Web-based 3D TravelerGuidance System, 2001.
[17] ARToolKit, http://www.hitl.washington.edu/artoolkit.[18] D. Galdi, “Spatial data storage and topology in the redesigned
MAF/TIGER system,” U.S. Census Bureau Geography Division,2005.
[19] G.G. Yun, S.J. Kim, S.E. Eom, and B.H. Ahn, “3D augmentedreality map with fingertip interaction,” Proc. 2004 Korea HumanComputer Interaction (HCI 2004), pp.598–604, Pyongchang, Korea,2004.
[20] C. McDonald, Hand interaction in augmented reality, Master Thesis,Carleton University, Jan. 2003.
[21] S.E. Eom, I.L. Lee, G.G. Yun, and B.H. Ahn, “Hybrid image seg-mentation using edge and region growing,” Proc. IEEK Conf. IV,vol.26, no.1, pp.2299–2302, 2003.
[22] O. Bimber and R. Raskar, “Modern approaches to augmented re-ality,” Proc. EUROGRAPHICS 2004 Tutorial 8, Grenoble, France,Aug./Sept. 2004.