ã - ryerson university home · locomotion, and toilet use o level of difficulty with instrumental...
TRANSCRIPT


Table of Contents
Acknowledgements ................................................................................................................ III
Executive Summary ................................................................................................................ IV1.0 Background ....................................................................................................................................IV2.0 Data and Methods ......................................................................................................................... IV3.0 Findings ...........................................................................................................................................V4.0 Conclusions ....................................................................................................................................VI
North West Balance of Care Project II...................................................................................... 1
1.0 Background........................................................................................................................ 11.1 Goals................................................................................................................................................ 11.2 Balance of Care Approach............................................................................................................... 21.3 Key Findings from Previous Balance of Care Projects in Ontario.................................................... 3
2.0 Data and Methods ............................................................................................................. 5Stage 1: Convene NW BoC II Steering Committee ............................................................................... 5Stage 2: Update NW BoC I Wait List..................................................................................................... 5Stage 3: Refresh Vignettes ................................................................................................................... 6Stage 4: Construct Care Packages ........................................................................................................ 6Stage 5: Conduct Supportive Housing Key Informant Interviews......................................................... 7Stage 6: Estimate Costs and Divert Rates ............................................................................................ 7
3.0 Findings ............................................................................................................................. 93.1 Characteristics of All LTC Wait Listed Individuals, 2008 and 2009.................................................. 93.2 Distribution by Sub region ............................................................................................................ 103.3 Characteristics of Supportive Housing Sites ................................................................................. 113.4 Overall Distribution of SH Residents............................................................................................. 183.5 Comparison of SH Residents to LTC Wait List ............................................................................... 193.6 Vignettes and Care Packages ........................................................................................................ 203.7 SH Costs and Estimated Divert Rates............................................................................................ 223.8 Supportive Housing �“Wish List�” ................................................................................................... 26
4.0 Conclusions...................................................................................................................... 284.1 SH Offers Considerable Potential to Support �“At Risk�” Older Persons in the NW ....................... 284.2 SH Generates Value ...................................................................................................................... 284.3 Prevention and Maintenance are Key........................................................................................... 294.4 Risk Management is Crucial .......................................................................................................... 294.5 Realize SH�’s Potential.................................................................................................................... 29
Appendix 1: Balance of Care Sub Groups............................................................................... 31

North West Balance of Care Project II: Supportive Housing July 19, 2010
II
Appendix 2: Distribution of All Wait Listed Individuals by Location (Thunder Bay, Region,Entire NW) for 2008 and 2009 ............................................................................................... 33

North West Balance of Care Project II: Supportive Housing July 19, 2010
III
AcknowledgementsThe North West Balance of Care Project II (NW BoC II) was commissioned by the North West CommunityCare Access Centre (NW CCAC) in partnership with the North West Local Health Integration Network(NW LHIN).
Special thanks to Paula Donylyk, Client Services Manager, NW CCAC, for her support and assistancethrough all project phases; Carmelo Iorianni, Decision Support, who provided anonymized ResidentAssessment Instrument �– Home Care (RAI HC) data for all individuals on the NW CCAC long stay andlong term care (LTC) wait lists; and Ian Ritchie, Director, Client Services, who provided technicalassistance.
The authors also gratefully acknowledge the valuable advice provided by the NW BoC II SteeringCommittee including 10 leaders from across the health and social care continuum in North WestOntario.
We particularly want to thank the Supportive Housing key informants, who voluntarily gave hours oftheir time providing crucial details of their organizations, clients, and costs, as well as insights into whatworks, and what doesn�’t, �“on the ground�” in the North West.

North West Balance of Care Project II: Supportive Housing July 19, 2010
IV
Executive Summary
1.0 BackgroundThe North West Balance of Care Project II (NW BoC II) aimed to estimate the potential of supportivehousing (SH) to maintain the region�’s growing population of older persons safely and cost effectively�“closer to home.�”
Project II is built on the foundation of the North West Balance of Care Project I (NW BoC I) led by KerryKuluski. Conducted in 2008, Project I concluded that 8% of individuals �“at risk�” of institutionalization inThunder Bay, and 49% of wait listed individuals in the surrounding Region could potentially besupported, safely and cost effectively in the family residence if given access to coordinated packages ofhome and community care (H&CC).
2.0 Data and MethodsTo maximize comparability, NW BoC II adapted the multi stage approach used in NW BoC Project I andin BoC projects conducted in 8 other regions of Ontario:
A Steering Committee was convened, comprised of 10 experienced leaders from organizationsacross the health and social care continuum in North West Ontario; 6 of these individuals hadpreviously participated on the Steering Committee for Project I.
Key multi measure indicators of need from RAI HC assessments were used to stratify 975individuals on the NW CCAC LTC Wait List (as of November 2009) into 36 relatively homogenousBoC sub groups. These indicators were:
o Cognitive performance including short term memory, cognitive skills for decisionmaking, expressive communication and eating self performance;
o Level of difficulty with activities of daily living (ADLs) including eating, personal hygiene,locomotion, and toilet use
o Level of difficulty with instrumental activities of daily living (IADLs) including mealpreparation, housekeeping, phone use, and medication management
o Presence of an informal/family caregiver in the home.
2009 data were used to refresh the �“vignettes�” and home and community care (H&CC) carepackages constructed for Project I in 2008. Vignettes describe key characteristics of typicalindividuals in each of the BoC sub groups populated with sufficient numbers of individuals towarrant analysis; the same 16 vignettes were used in both Projects I and II. Care packagesspecify the mix and volume of home and community support services judged by experiencedcase managers required to maintain individuals safely and appropriately at home.
In depth interviews (sometimes lasting several hours over two or more days) were conductedwith 6 key informants representing 4 SH providers, operating 6 SH sites in the NW (two SHproviders operated satellite sites). Of these, 2 sites were located in Thunder Bay, with theremaining 4 sites located in small municipalities in the Region.
Costs were estimated for individuals represented in each of the 16 BoC vignettes for each SHsite over a 13 week period (a typical planning time frame). Subsequently, we estimated theproportion of LTC wait listed individuals that could be safely and cost effectively supported ateach site (compared to LTC).

North West Balance of Care Project II: Supportive Housing July 19, 2010
V
3.0 FindingsCharacteristics of All Wait Listed Individuals, 2008 and 2009. The NW CCAC LTC wait list included 975individuals as of November, 2009; this compared to 864 wait listed individuals in March, 2008. Whilenumbers thus increased, overall levels of need also increased.
Distribution by Sub Region. In both 2008 and 2009, considerably higher proportions of �“low needs�”wait listed individuals were observed in the Region as compared to Thunder Bay. The threshold or�“tipping point�” for LTC is lower in rural and remote areas where there is more limited access to H&CC.
Characteristics of Supportive Housing Sites. Key informants provided rich descriptions of the 6 SH sitesin the NW and indicated the number of current residents falling into each of the 16 BoC sub groups andvignettes. While considerable variation was observed, 4 of 6 SH sites provided 24/7 staff coverage; allprovided a range of services including emergency response, personal support, assistance with meals,congregate dining, life enrichment, physiotherapy, transportation, foot care and social activities.Admissions criteria included age (60+ years), need for support services, and ability to function relativelyindependently (no disruptive or wandering behavior; two person transfers not required).
Overall Distribution of SH Residents. According to the key informants, most SH residents had low tomoderate needs: 90% were cognitively intact; most experienced little or no difficulty with ADLs andIADLs; most had MAPLe scores in the mild (2) to moderate (3) range.
Comparison of SH Residents to LTC Wait List. While SH residents tended to be at the lower end of theneeds spectrum, individuals on the LTC wait list tended to be at the higher end: 91% of SH residents fellinto BoC sub groups before Upperton �– they were cognitively intact; by contrast, almost three quarters(74%) of LTC wait listed individuals fell into sub groups after Upperton �– they experienced cognitiveimpairments. Nevertheless, there was important overlap in these two populations: a quarter (26%) ofLTC wait listed individuals fell into BoC sub groups below Upperton.
Vignettes and Care Packages. Vignettes simulated the notes case managers would use when makingactual care decisions. SH Key informants constructed packages of services needed to support individualsrepresented in each vignette safely and appropriately in supportive housing. Packages differed fromthose constructed for individuals living in their family residences since in SH, transportation needs forresidents and workers were minimized, and many services were provided on site (e.g., meals).
SH Costs and Estimated Divert Rates. Using two different costing methods where possible, weestimated the potential, on a site by site basis, to �“divert�” individuals currently on the NW CCAC LTCwait list safely and cost effectively to SH. Estimated divert rates ranged from 20% to 66% depending onsite and costing method.
Supportive Housing �“Wish List.�” SH providers made a number of suggestions going forward: Expand SH capacity. SH currently works for many older persons, informal carers and the health
care system. However, current capacity is limited and needs to be expanded.
Build capacity where older persons have naturally congregated. SH can �“follow the seniors�”particularly where they are concentrated in municipal housing buildings, in private apartmentbuildings, or even in hospital wings. In smaller communities, larger houses can be adapted tobuild �“Abbeyfield�” SH models characterized by 6 �– 10 private rooms (rather than self contained

North West Balance of Care Project II: Supportive Housing July 19, 2010
VI
apartments) and a range of congregate activities and meals.
Continue to emphasize prevention and maintenance. SH sites do not now have the capacity toadmit older persons with cognitive impairments or high personal care needs. The key is toadmit individuals earlier, focus on prevention and maintenance, develop care routines andcoping skills, delay or avoid institutionalization, and smooth transitions when needed.
Allow SH sites to manage admissions and resident mix. SH care managers strongly emphasizedthat resources are finite and that to ensure high quality, appropriate care, and avoid risks toresidents, informal carers and workers, they need to continuously balance resident mix andavailable resources. While SH wait lists might be maintained centrally, admissions must bemanaged locally to ensure the best possible �“fit�” between needs and capacity.
Promote closer links between SH and LTC. Some SH sites are located near LTC facilities andshare resources. This offers advantages to residents in both SH and LTC who can accessprograms and services which might otherwise not be available. Familiarity with the LTC facilityalso offers smoother transitions when independent living is no longer possible.
Promote closer links between SH and other providers. Particularly in smaller communities,there is a tradition of collaboration between providers. Existing partnerships with recreationalfacilities enhance social opportunities for older persons while maintaining functionalindependence and mobility. Visiting nurses or nurse practitioners can organize clinics on site inSH to manage medications, conduct blood tests and diagnose health conditions. One SH site haspartnered with a family health team to provide access to needed primary care.
Invest in workers. The availability of health human resources is an ongoing challenge. Someproviders commented that adequate compensation is needed to attract and retain workers andimprove continuity and quality of care. Training programs could potentially expand capacity tohelp support a growing number of older persons experiencing cognitive challenges.
Make programs equitable. SH programs and services require user fees which vary by provider.If user fees are required, thought should be given to standardizing them across the NW toensure equal treatment.
Enhance palliative care. Currently there is little capacity to support end of life care in SH. Suchcapacity is needed so that SH does not become a form of transitional care.
4.0 ConclusionsSH Offers Considerable Potential to Support �“At Risk�” Older Persons in the NW. NW BoC I (conductedin 2008) concluded that 8% of individuals �“at risk�” of institutionalization in Thunder Bay, and 49% of waitlisted individuals in the surrounding Region, could be supported safely and cost effectively in the familyresidence if given access to needed home and community care. By contrast, NW BoC II estimateshigher divert rates for SH: in Thunder Bay, SH divert rates approach one third (30% to 33%), while in theRegion divert rates range from 20% to 66% depending on site and method of cost calculation. Ofcourse, it is important to emphasize that these divert rates estimate potential, not current capacity.

North West Balance of Care Project II: Supportive Housing July 19, 2010
VII
Prevention and Maintenance are Key. SH aims to admit individuals earlier and keep them later as partof a dynamic and proactive process of continuously monitoring needs and making the best use ofavailable resources. Early entry to SH allows staff to anticipate needs and plan care pathways, includingtransitions to LTC or hospital when required.
Risk Management is Crucial. While there is always some risk associated with caring for older personswith declining mental and physical abilities, risk increases unacceptably as needs outstrip organizationalcapacity. This means that there has to be ongoing assessment of who to admit, how to care for them,and when to transition to LTC if required. SH sites in the NW currently do not have the capacity tosupport Individuals with cognitive impairments or heavy personal care needs.
Realizing SH�’s Potential. Finally, our key informant interviews and review of the literature suggest anumber of strategies for realizing SH�’s potential in the NW.
�“Follow the seniors.�” Begin by identifying concentrations of older persons in existing housingstock (including public housing) and build SH capacity around them.
Clone satellites. Two current SH providers in the NW have used this strategy effectively,establishing services at one site, building capacity, and then extending services to a new site.
Network SH sites. Web based and video technologies offer ever expanding opportunities for SHproviders in different locations to communicate, develop common approaches and protocol,share innovations and best practices, and anticipate and respond proactively to changingpopulation needs.
Develop SH sites into regional service integration hubs. In addition to offering a range of servicesto residents, SH sites could radiate out key services including scheduled health care clinics (e.g.,primary care, pharmacy, nutrition, social work) to the broader community. There are valuableprecedents: in the U.S., rural PACE (Programs of All inclusive Care for the Elderly) models useinterdisciplinary teams (including primary care physicians) to provide a coordinated range ofservices (preventive, acute and long term care) to concentrations of older persons (55+ years ofage) living in rural areas. Closer to home, an ongoing project in North Renfrew, Ontario, hasachieved considerable success in providing an integrated range of supportive services to itsscattered population of older persons, by building SH and LTC capacity at a central site, and thenpushing services out to the broader community.

North West Balance of Care Project II: Supportive Housing July 19, 2010
1
NorthWest Balance of Care Project II
1.0 Background
1.1 GoalsThe North West Balance of Care Project II (NW BoC II) aimed to estimate the potential of supportivehousing (SH) to maintain the region�’s growing population of older persons safely and cost effectively�“closer to home.�”
While there are many different definitions of supportive housing in the literature, and a wide range ofdifferent supportive housing models �“on the ground�” across Ontario, we defined SH broadly to includecombinations of mostly rent geared to income housing and a range of home and community supportsdesigned to maintain the well being, independence and quality of life of older persons and theirinformal carers while moderating demand for hospital and residential long term care (LTC). Accordingto the website of the Ontario Ministry of Health and Long Term Care (OMHLTC), �“Supportive Housing isdesigned for people who only need minimal to moderate care such as homemaking or personal careand support �– to live independently�” (for details go tohttp://www.health.gov.on.ca/english/public/program/ltc/13_housing.html).
Project II built on the foundation of the North West Balance of Care Project I (NW BoC I) led by KerryKuluski. Conducted in 2008, Project I concluded that 8% of individuals waiting for LTC in Thunder Bayand 49% of those waiting in the surrounding Region could potentially be supported, safely and costeffectively at home if given access to coordinated packages of home and community care (H&CC). Aninability to perform �“lower level�” instrumental activities of daily living (IADLs) such as housekeeping,medication management and meal preparation was a key LTC wait list driver.
Note that these 2008 estimates assumed a conventional home care model, with line by line H&CCservices delivered, often by multiple providers, at different times, to older persons and carers in theirfamily residences. While doable, this posed challenges. As needs increased, and a greater volume andmix of services was required, coordination and scheduling complexities also increased, as did travel timeand costs; this was particularly problematic in rural and remote areas characterized by few providers,low population densities, and long distances. It was observed that alternative models of care deliveryalready present in some communities in the North West, such as supportive housing (SH), offeredgreater potential to achieve individual and system level goals in large part due to the ability toconcentrate and coordinate resources at geographic points.
The NW BoC Project II thus looked beyond the findings of Project I to analyze the potential of SH tocreate additional value in the NW: for older persons, by maintaining well being, independence andquality of life; for carers, by reducing burden and stress; and for the health care system, by moderatingdemand for LTC.
Goals of the NW BoC II were to: document key characteristics of current SH models in the North West; and estimate the potential for SH to divert individuals safely and cost effectively from LTC wait lists.

North West Balance of Care Project II: Supportive Housing July 19, 2010
2
1.2 Balance of Care ApproachIn conducting NW BoC II, we again adapted the Balance of Care (BoC) model pioneered in the U.K. by Dr.David Challis and his group at the Personal Social Services Research Unit (PSSRU), University ofManchester, UK.
The BoC is a planning tool which aims to set evidence based benchmarks for the most appropriate mixof community based and institutional resources needed at the local level to support an agingpopulation. While conventional projections of care needs often assume that a growing population ofolder persons will require a proportionately greater number of residential LTC beds, the BoC emphasizesthat the need for such beds will be determined as well by the availability of safe, cost effective H&CC.Other factors being equal, where needed H&CC is more accessible, greater proportions of older personswill be able to age successfully at home.
Nevertheless, there are limits to this potential. H&CC will not be a safe option for all older persons,particularly those with very high levels of need who lack informal carers. Further, even when safe,H&CC may not be cost effective since the costs of home care for some older persons in some localitiesmay exceed the cost of residential LTC by a significant margin. The BoC question is: �“for which groups ofolder persons, under what conditions, is H&CC both a safe and cost effective option?�”
As noted, the BoC approach emphasizes that answers to this question will depend as much upon �“supplyside�” factors, related to how care is organized and delivered, as to �“demand side�” factors, related to thecharacteristics and needs of individuals. Some delivery models, such as SH, may offer greater (or at leastdifferent) scope for delivering safe, cost effective H&CC, as compared to conventional home care in thefamily residence.
In considering such questions, Ontario BoC projects (including NW BoC Projects I and II) have convenedpanels of local experts from across the care continuum (including home care, community supports,hospitals, LTC, primary care) to review the assessed needs of individuals on LTC wait lists (using the mostup to date Resident Assessment Instrument �– Home Care (RAI HC) data), and consider what H&CCservices would be required to support them and their carers safely at home (i.e., in the familyresidence). H&CC costs have then been calculated using the most current data and compared to thecosts of residential LTC. The strength of this approach is that it combines the best available evidencewith the best available knowledge and insight of experienced decision makers and front line casemanagers who understand needs, as well as local capacity to meet needs, realizing that capacity variesgreatly across urban, rural and remote areas. The BoC is, in effect, an �“in vivo�” simulation of how caredecisions are made given existing resource mixes, and how they could be made given different mixes.
In this connection, a number of BoC projects have specifically examined the potential of SH to supportolder persons and carers safely and cost effectively. These include a 2009 study conducted for theNorth East LHIN (see �“Seniors�’ Residential/Housing Options �– Capacity Assessment and Projections�” athttp://www.nelhin.on.ca/WorkArea/showcontent.aspx?id=3434) and a BoC project conducted inChamplain in the same year (see �“The Champlain Balance of Care Project: Final Report�” athttp://www.unitedwayottawa.ca/downloads/ChamplainBoCProject.pdf). The findings of an earlier BoCstudy in Toronto Central also consider supportive housing (see �“Balancing Institutional and CommunityBased Care: Why Some Older Persons Can Age Successfully at Home While Others Require ResidentialLong Term Care�” at http://www.longwoods.com/product.php?productid=20694). Key findings fromthese studies are summarized below.

North West Balance of Care Project II: Supportive Housing July 19, 2010
3
1.3 Key Findings from Previous Balance of Care Projects in OntarioTo date, BoC projects have been conducted in 9 regions of Ontario; those including a focus on SH aredesignated with an asterisk (*) below:
Waterloo Wellington Toronto Central (*) North West Central (*) North East (*) Central West South West (*) North Simcoe Muskoka (*) Champlain (*)
These projects have concluded that: Significant proportions (between 15% and 50%) of those on LTC wait lists could potentially be
�“diverted�” safely and cost effectively to home and community if given access to needed H&CC.
In home and community the unit of care is the individual and informal carer; needs must beassessed, care packages designed and outcomes measured considering both.
Instrumental activities of daily living (IADLs) including transportation, meal preparation, abilityto use the telephone and medication management are a key LTC wait list driver. Although nothealth care per se, an inability to perform such everyday activities can result in functionaldecline, illness and the utilization of costly, but often avoidable, hospital and institutional care.
In order to achieve H&CC�’s full potential, additional capacity is required at the local level acrossthe province. While existing services support large numbers of older persons and their carers,including many at high levels of need, there is insufficient capacity to increase numberssubstantially. Inadequate H&CC capacity is almost universally cited as a main reason why manyindividuals who might otherwise age at home, instead require residential LTC.
H&CC capacity is particularly problematic in rural and remote areas due to distance, a lack oftransportation and few providers. Combined with demographic shifts such as the out migrationof younger persons resulting in fewer informal carers and attenuated social networks, the�“tipping point�” for LTC appears substantially lower outside of urban areas.
While the presence of H&CC services is a necessary condition for supporting older persons athome, it is not sufficient. Particularly for older persons with cognitive deficits who do not havecarers living with them and who cannot manage on their own, system level coordinationmechanisms need to be in place. In Ontario there are few mechanisms to manage a full range ofH&CC for persons with complex health and social needs. Lacking such mechanisms, LTC canbecome the default option even when needed services are present.
Regarding supportive housing more specifically, BoC projects have found that: SH providers and sites across Ontario vary extensively in terms of the volume and mix of care
provided, populations served, and costs. In fact, while identified as �“supportive housing,�” someproviders and sites in some regions are better characterized as �“attendant care�” serving adults

North West Balance of Care Project II: Supportive Housing July 19, 2010
4
with physical disabilities; �“cluster care,�” serving older persons in physically proximate familyresidences; or �“home care outreach,�” serving older persons in their homes in rural and remotecommunities where congregate housing is not readily available.
Compared to conventional home care models, where care is provided on a service by servicebasis, often by different providers, at different times, SH offers greater scope to plan andcoordinate care for older persons with multiple needs. Workers are familiar with theircommunities, buildings and residents, work in close proximity, communicate on an ongoingbasis, and proactively monitor and respond to changing resident needs in �“real time.�”
In contrast to a conventional home care visit of a standard length (e.g., an hour of home nursingcare) SH allows greater flexibility in the use of available resources. When residents need only afew minutes of care, or when they need more than a standard unit, workers can flex schedulesto accommodate. This allows care to be �“ratcheted up�” or �“ratcheted down�” as needed andshared across all residents in a building.
Transportation is minimized for residents and workers. Meals and social activities are oftenorganized on site, so that residents don�’t have to leave their buildings to access them, andworkers can concentrate their efforts at a single geographic location.
Congregate activities in SH can serve multiple purposes. For example, in addition to nutritionand social connectedness, congregate meals offer a regular opportunity to observe, assess andcommunicate with residents in a normal setting. They also offer opportunity for regularmedication checks, a key consideration given that many older persons take multiplemedications, often from multiple prescribers (i.e., poly pharmacy).
In the family residence, the first line of care is the informal carer; particularly with older personsexperiencing multiple chronic conditions including dementia, this can lead to carer stress,burnout and crisis. In SH, first line care is provided by trained workers, with family membersand friends providing enhanced supports and social connectedness. �“Peace of mind�” for olderpersons and carers is high, knowing that basic needs will be met on a predictable basis.
In the family residence, older persons living alone may have few options when a crisis occursparticularly outside of normal business hours; a too frequent recourse is the use of 911 andhospital emergency departments even for minor problems. In SH, residents usually have accessto a call system and 24/7 staff, reducing reliance on emergency services.

North West Balance of Care Project II: Supportive Housing July 19, 2010
5
2.0 Data and MethodsTo maximize comparability, NW BoC II adapted the multi stage approach used in Project I and otherOntario projects.
Stage 1: Convene NW BoC II Steering CommitteeWe convened a Steering Committee comprised of 10 experienced leaders from organizations across thehealth and social care continuum in North West Ontario including:
6 NW BoC I Steering Committee members; New representatives from 3 organizations participating on the NW BoC I Steering Committee; A health care leader from Dryden who strengthened representation from the Region.
Note that 3 individuals from the NW BoC I Steering Committee did not participate in Project II becausetheir organizations operated SH sites; this avoided potential conflicts of interest.
Project II Steering Committee members (listed in alphabetical order) were: Cindy Backen, Psychogeriatric Resource Consultant, St. Joseph�’s Care Group, Thunder Bay
Cathy Collinson, Chief Nursing Officer, Nipigon District Memorial Hospital
Paula Donylyk, Senior Director, Client Services, NW CCAC
Chris Fell, Case Manager, Seniors Behavioral Health Outreach Team, St. Joseph's Care Group,Thunder Bay
Darlene Furlong, Senior Vice President, Patient Care Services, Dryden Regional Hospital
Sandi Homeniuk, Community Care Manager, NW CCAC
Wendy Kirkpatrick, Administrator, Grandview Lodge Home for the Aged, Thunder Bay
Carole Neff, Community Services Facilitator, Wesway, Thunder Bay
Karen Ryback, Utilization Manager, Thunder Bay Regional Health Sciences Centre
Lisa Siimi, Senior Consultant Funding and Allocation, NW LHIN
An initial meeting to describe the project and receive advice was conducted in Thunder Bay onDecember 17, 2009; one member of the research group (KK) attended in person while two others (APWand JW) participated via the Ontario Telemedicine Network (OTN).
A final meeting to present the results and confirm the findings took place on May 6, 2010, with threemembers of the research group (APW, KK and JW) participating via OTN.
Stage 2: Update NW BoC I Wait ListIn the project�’s second stage, the NW CCAC provided RAI HC assessment data for 975 individuals on theLTC wait list as of November, 2009.
These data included 4 key multiple item measures of individual characteristics and needs: Cognitive performance including short term memory, cognitive skills for decision making,
expressive communication and eating self performance (coded into 2 categories: intact, notintact).
Difficulty with ADLs (activities of daily living) including eating, personal hygiene, locomotion, andtoilet use (coded into 3 categories: no difficulty, some difficulty, great difficulty).

North West Balance of Care Project II: Supportive Housing July 19, 2010
6
Difficulty with IADLs (instrumental activities of daily living) including meal preparation,housekeeping, phone use, and medication management (coded into 3 categories: no difficulty,some difficulty, great difficulty).
Presence of an informal/family caregiver in the home (coded into 2 categories: present, notpresent).
As in previous BoC projects including NW BoC Project I, we used these 4 multiple item measures tocategorize all LTC wait listed individuals into 36 relatively homogenous sub groups. Each sub group wasassigned a fictitious family name and the distribution of individuals across sub groups was determined.The first of these sub groups, named �“Appleton,�” contained 1 individual who was cognitively intact,experienced no difficulty performing ADL or IADL tasks, and had a live in caregiver. In contrast, the 36thand highest needs sub group, �“J. Johns,�” contained 100 individuals who were not cognitively intact,could not perform ADL and IADL tasks independently, and did not have a caregiver living with them.
In addition to providing an up to date portrait of wait listed individuals in the North West, the 2009 dataallowed us to examine how characteristics and needs had changed since Project I in 2008.
We also calculated average MAPLe (Method for Assigning Priority Levels) scores ranging from 1 (low)to 5 (very high) for each of the 36 BoC sub groups, both to validate our stratification, and to assistplanning, since MAPLe is now widely used in Ontario as an index of need. Note however, that unlike theBoC stratification, MAPLe does not consider the presence or capacity of informal carers, contributing tosome divergence in results.
No personal identifiers (e.g., name, OHIP number) were included in the data provided by the NW CCAC,nor were any individuals identified in our analysis. As described below, our analysis specifically excludedsub groups containing low numbers precluding any chance that individuals could be identified by theresearch team or by others accessing the results.
Stage 3: Refresh VignettesIn the third stage, we used the 2009 data to refresh the �“vignettes�” constructed in 2008 for Project I.Vignettes describe key characteristics of typical individuals in each of the BoC sub groups populatedwith sufficient numbers of individuals to warrant analysis. Although, as detailed below, there weredifferences in the distributions of wait listed individuals in Projects I versus Project II, we used vignettesfor the same 16 sub groups for both years to maximize comparability. In Project I, these 16 sub groups(and associated vignettes) accounted for 92% of all wait listed individuals in the NW; in Project II, theyaccounted for 96% of those on the wait list.
Stage 4: Construct Care PackagesAs part of the NW BoC Project I, a cross sectoral Expert Panel comprised of 17 experienced caremanagers from organizations across the care continuum (including hospitals, LTC, CCAC, communitysupport services, supportive housing) constructed H&CC packages required to support typical individualsin each of the 16 vignettes safely and appropriately at home. Since a key focus of Project I wasurban/rural/remote differences, two sets of care packages were constructed for each vignette, one forThunder Bay and one for the surrounding Region.
While also analyzing geographic differences in Project II, our focus was on SH as an alternative to LTC.Using the detailed information generated in Project I, we therefore constructed a single, composite carepackage for each vignette assuming home care in the family residence; we then asked SH key informants

North West Balance of Care Project II: Supportive Housing July 19, 2010
7
to consider how care organization, delivery and costs would change if individuals with the samecharacteristics and needs lived in supportive housing.
Stage 5: Conduct Supportive Housing Key Informant InterviewsWe conducted in depth, semi structured interviews (sometimes lasting several hours over two or moredays) with 6 key informants representing 4 SH providers, operating 6 SH sites in the NW (two SHproviders operated satellite sites). Of these, 2 sites were located in Thunder Bay, with the remaining 4sites located in small municipalities in the Region. SH sites and key informants were identified bymembers of the Project II Steering Committee.
For each site, informants were asked to describe: Key organizational characteristics (e.g., number of units, number of residents, admissions
criteria, services or programs offered); Key resident characteristics (e.g., functional ability, hours and types of services required); The mix and volume of services provided by SH staff to SH residents (e.g., housekeeping,
congregate dining and/or meal preparation, social/recreation programs, transportation, 24/7 oncall, emergency call system);
The mix and volume of services provided by external organizations to SH residents (e.g., CCAC,community support services (CSS), LTC facilities, hospitals);
Planned or possible changes in SH organization, resident mix or services; Their �“wish list�” for how SH capacity could be expanded.
Key informants were then asked to review each of the 16 BoC vignettes and, for each SH site, toindicate:
The proportion of current SH residents falling into each vignette; The mix and volume of services typically provided to SH residents in each vignette, noting
particularly how mix and volume might change in SH as compared to home care in the familyresidence (e.g., fewer transportation services required).
Finally, key informants were asked which services would be funded: Within their SH base budget (e.g., congregate dining on site); Through the budgets of other providers (e.g., meals on wheels).
Stage 6: Estimate Costs and Divert RatesIn the 6th stage, the research group estimated the costs of care for typical individuals in each of the 16BoC vignettes for each SH site over a 13 week period (a typical planning time frame). We thenestimated the proportion of LTC wait listed individuals that could be safely and cost effectivelysupported at each site (compared to LTC).
To estimate SH costs we used two methods (where possible) to determine the total cost of care to theLHIN; each captured direct SH costs (those paid by the SH provider) as well as indirect SH costs (servicesprovided and paid for by other agencies such as the CCAC). Both methods excluded user fees and rent.
Method A used the average cost of SH services per resident, per day, per site, as calculated bySH key informants; to this average we added the costs of any additional CCAC services or CSSrequired by residents represented in each BoC vignette. This method did not differentiate SHcosts by the resident�’s level of need; rather it assumed a �“pooling�” or averaging of costs over allresidents at a particular SH site. A number of SH key informants suggested that this accuratelyreflected how resources and costs were managed in their organizations as available resources

North West Balance of Care Project II: Supportive Housing July 19, 2010
8
were accessed flexibly on an as needed basis. While SH costs were thus constant across BoCvignettes, overall costs for each vignette still varied due to the variable use of �“external�” CCACservices and CSS. Method A was applied in all 6 SH sites.
Method B involved estimating the actual number of SH staff hours provided to residents in eachBoC vignette; as in Method A, the costs of any additional CCAC services and CSS were thenadded. Thus, SH costs were generally lower for lower needs vignettes, and higher for higherneeds vignettes. Method B was applied in 2 SH sites which could estimate actual care hours foreach resident.
To estimate divert rates, we compared SH costs for each vignette, for each SH site, against the costs ofLTC. To estimate LTC costs we used:
An average LHIN cost of $89.00 per day or $8,099 for a 13 week period. Resident co paymentsof $53.07 per day (primarily for accommodation) were not included to ensure comparability.According to the website of the Ontario Association of Non Profit Homes and Services forSeniors (OANHSS), these costs were valid as of July 2009. (For details go tohttp://www.oanhss.org/Content/NavigationMenu/Consumers/AboutLongTermCare/default.htm#LTC4).
In applying these two costing methods and calculating SH divert rates, we made two adjustments. First, we adjusted for urban/rural differences in CSS costs; in the surrounding Region such costs
tended to be higher than in Thunder Bay. Thus, for SH sites in the region, CSS costs were basedon LHIN costs for CSS providers in the region; likewise, for SH sites in Thunder Bay, CSS costswere based on LHIN costs for CSS providers in Thunder Bay. No similar adjustments were madefor CCAC costs since these were consistent across the NW.
Second, we adjusted for urban/rural differences in LTC wait lists; wait listed individuals in thesurrounding Region tended to be at lower levels of need than wait listed individuals in ThunderBay (even though, for the population as a whole, health needs tended to be higher in theregion). Thus, divert rates for SH sites in Thunder Bay were calculated against the distribution ofwait listed individuals in Thunder Bay; divert rates for SH sites in the Region were calculatedagainst the distribution of wait listed individuals in the Region.

North West Balance of Care Project II: Supportive Housing July 19, 2010
9
3.0 Findings
3.1 Characteristics of All LTCWait Listed Individuals, 2008 and 2009As noted, the NW CCAC LTC wait list included 975 individuals as of November, 2009; this compared to864 wait listed individuals in March, 2008.
A first observation, therefore, was that the 2009 NW LTC wait list was 13% longer than a year and a halfearlier. However, compared to 2008, it was characterized by higher levels of need.
The data presented in this section are for all wait listed individuals (i.e., including, but not limited to, the16 BoC sub groups for whom vignettes and care packages were constructed). They show that:
In 2008, 40% of wait listed individuals were cognitively intact they experienced few problemswith short term memory, cognitive skills for decision making, expressive communication oreating self performance; in 2009, only 30% were cognitively intact.
In 2008, 44% experienced little or no difficulty (�“none�”) with ADL tasks such as eating, personalhygiene, toilet use and locomotion in the home while only about a quarter (28%) experienced�“great�” difficulty requiring others to perform these tasks for them; in 2009, a somewhat smallerpercentage (37%) experienced no difficulty with ADLs and a slightly larger percentage (30%)experienced great difficulty.
In 2008, two thirds (65%) experienced �“great�” difficulty with IADLs such as meal preparation,housekeeping, telephone use and medication management, requiring others to perform thesetasks for them; in 2009, three quarters (76%) experienced great difficulty with IADLs.
The likelihood of having a caregiver living in the home was similar; in 2008, just over a third(36%) reported having a caregiver living with them, compared to 40% in 2009.
Cognition 2008 2009
Intact 40% 30%
Not Intact 60% 70%
Total N 864 975
Difficulty with ADLs 2008 2009
None 44% 37%
Some 28% 32%
Great 28% 30%
Total N 864 975

North West Balance of Care Project II: Supportive Housing July 19, 2010
10
Difficulty with IADLs 2008 2009
None 1% .4%
Some 34% 24%
Great 65% 76%
Total N 864 975
Live in Caregiver? 2008 2009
Yes 36% 40%
No 64% 60%
Total 864 975
These data do not show why the wait list was longer in 2009 than in 2008, or why needs tended to behigher. Also, because we did not have individual identifiers, it was not possible to see what proportionof the 2008 wait list remained in 2009, or how individual needs had changed. Nevertheless, it is possiblethat overall changes reflected some combination of: increasing needs in an aging population; previouslyunmet needs now being identified; more intensive triaging or targeting; and efforts aimed at reducingthe number of hospital alternative level of care (ALC) beds by discharging patients �“quicker and sicker�”to community care. What is clear, however, is that growing wait list numbers were not the result of�“cream skimming,�” that is, placing individuals on the wait list earlier; in fact, the reverse appeared to betrue as overall levels of need increased.
3.2 Distribution by Sub regionAs noted, 4 multiple item measures of need were combined to define 36 relatively homogeneous BoCsub groups. To get a better sense of where change had occurred, we calculated numbers of individualsfalling into �“low needs,�” �“medium needs�” and �“high needs�” sub groups, for the NW overall, and forThunder Bay and the Region separately.
We found that: For the whole NW, 24.1% of all wait listed individuals fell into relatively �“low needs�” sub groups
(sub groups 1 �– 6: Appleton to Fanshaw) in 2008; in 2009, only 15.7% were low needs.
In Thunder Bay, the proportion of low needs individuals was halved: in 2008, 13.2% qualified aslow needs; in 2009 only 6.0% were low needs.
In the Region, proportions of individuals in low needs sub groups were considerably higher thanin Thunder Bay in both years, although these proportions declined considerably between 2008(40.0%) and 2009 (25.4%).

North West Balance of Care Project II: Supportive Housing July 19, 2010
11
BoC Sub Groups ThunderBay, 2008
ThunderBay, 2009
Region,2008
Region,2009
OverallNorth West,
2008
OverallNorth West,
2009
Low Needs(Sub groups 1 6)
13.2% 6.0% 40.0% 25.4% 24.1% 15.7%
Medium Needs(Sub groups 7 30)
60.6% 66.7% 47.0% 57.2% 55.6% 62.0%
High Needs(Sub groups 31 36)
26.2% 27.3% 13.0% 17.4% 20.3% 22.3%
N 475 481 383 487 864* 975*
* Location (Thunder Bay/Region) was not known for 6 individuals in 2008 and 7 individuals in 2009
In summary, between 2008 and 2009: The NW LTC wait list grew by 111 individuals (13%) largely due to increasing numbers of LTC
wait listed individuals in the Region (104 or 27%); Overall levels of need increased. There was considerable movement out of �“low needs�” sub
groups into �“middle needs�” sub groups; movement into �“high needs�” sub groups was lessmarked;
In both years, considerably higher proportions of �“low needs�” wait listed individuals wereobserved in the Region as compared to Thunder Bay. This emphasizes a key finding of Project Ithat the threshold or �“tipping point�” for referral to LTC is lower in rural and remote areas wherethere is more limited access to H&CC.
3.3 Characteristics of Supportive Housing SitesOur key informants provided detailed descriptions of the 6 SH sites studied. They also indicated thenumber of current residents in each SH site falling into each of the 16 BoC vignettes. The research groupthen calculated average MAPLe scores for each of the 16 BoC sub groups and estimated the distributionof residents by these scores for each SH site and for all SH residents in the NW. Note that becauseMAPLe scores were not calculated for individuals, but averaged for each BoC sub group, the range wasattenuated, with most scores falling between 2 (mild) and 4 (high).
Summary information for each of the 6 SH sites are given below.
SH Site1. Located in Thunder Bay, this site includes 99 units owned by the housing authority, with 24hour services provided on site by an adjacent municipal home for the aged. According to the web site,�“the Support Services Program is intended for seniors whose physical status and/or lack of adequatesocial supports threatens their ability to remain living independently in the community.�” According toour informants, key characteristics of this site included:
Residents: 107 Services:
o 24 hour on site staffo 24 hour emergency response (hardwired in apartment)o Personal support/bath assistanceo Assistance with mealso Light housekeeping

North West Balance of Care Project II: Supportive Housing July 19, 2010
12
o Congregate diningo Life enrichment (e.g. recreational activities and programs)o Access to a social worker/counseloro Physiotherapyo Transportationo Basic foot care.o Clients can utilize the coffee shop and hairdresser from the attached LTC facility.
Admission Criteria: 60 years of age, meets minimum income threshold, and agrees to accept asupport package (at least socialization and meals). Client should be functionally independent(no disruptive or wandering behaviors; single clients must not require a two person transfer). Ifan existing resident loses capacity or is judged to become a risk to themselves or others,conversation around transition to LTC may be initiated.
The resident mix in Site 1 is presented below. Using the BoC sub groups, most (60%) were categorizedas �“Jones�” (cognitively intact, some difficulty with ADLs, some difficulty with IADLs, with no live incaregiver). Using MAPLe, most (78%) scored 3 (moderate).
Note that in contrast to the MAPLe, which provides a summary index of need, the BoC sub groups detailwhich dimensions of need come into play. Most importantly, because of the way in which dimensionsare combined, the first 18 of the 36 BoC sub groups (Appleton to Rogers) include individuals who arecognitively intact; of the 16 vignettes included in the NW BoC II analysis, Upperton is the first includingindividuals with a cognitive impairment. This is crucial, since the majority of residents in SH Site 1, as in
1%14%
2%
60%
5% 11% 2% 6%
SH Site 1:Resident Mix by BoC Sub Group
015%
78%
7%0
Low Mild Moderate High Very High
SH Site 1:Resident Mix by Average MAPLe Scores

North West Balance of Care Project II: Supportive Housing July 19, 2010
13
the other NW sites described below, fell into BoC sub groups before Upperton, that is, they werecognitively intact.
SH Site 2. Also located in Thunder Bay, Site 2 is in a building which includes 113 market rental and 68rent geared to income (RGI) units; it is proximate to a LTC facility. According to the provider web site,the SH units �“are for persons over the age of 60 or under the age of 60 with a disability who can liveindependently with or without support;�” about half of current residents were fully independent andreceived no services. According to our key informants, characteristics of this site include:
Residents: 115 Services: Individuals who wish to receive support services choose one of seven different
packages of care (based on preference not need). Available services include:o 24 hr. on site staff.o Personal support (assistance with bathing and medications)o Homemaking (assistance with laundry, meals, and light housekeeping)o Congregate diningo Daily �“how are you�” checkso Life enrichment (e.g. outings and educational sessions)o Transportationo Access to a social worker/counselor.
Admissions Criteria: 60 years of age. No minimum level of care required. Individuals must befunctionally independent (no disruptive or wandering behaviors, single clients must not requirea two person transfer). If an existing resident loses capacity or is judged to be a risk tothemselves or others, conversation around transition to LTC may be initiated.
The tables below show that a majority (82%) of SH Site 2 residents fell into relatively low needs BoC subgroups (Davis, Fanshaw and Jones); almost all were cognitively intact but experienced some difficultywith ADLs and/or IADLs. This is reflected in MAPLe scores of 2 to 3.
0
35%30%
17%
06% 4% 0 0 3% 1% 4% 0 0 0 0
SH Site 2:Resident Mix by BoC Sub Groups

North West Balance of Care Project II: Supportive Housing July 19, 2010
14
SH Site 3A. Located in a small municipality in the Region, Site 3A was relatively new, funded in 2009through Aging at Home dollars. It provides community supports to 20 �“frail elderly clients�” in a buildingcontaining 75 senior�’s apartments. A community support services agency oversees this program with apart time coordinator�’s office based in the building. According to the website of a local communitysupport organization, �“this program is designed to help people live independently in their ownapartments. A supportive housing environment promotes mental and physical health along with aroundthe clock personal support. For a low monthly fee, clients enjoy a variety of scheduled activities andoutings among other benefits.�” According to our key informants, characteristics of this site include:
Residents: 20 in 2009 with expansion to 25 in 2010 Services:
o 24 hr. on site staffo Personal support (medication reminders, bathing, morning and evening dressing
assistance)o Homemaking (assistance with laundry, light meal preparation, housekeeping and
shopping assistance)o Congregate diningo Emergency response/lifelineo Daily �“how are you?�” checkso Access to the program coordinator (to provide additional support and care coordination
including CCAC and other support agency referrals). Admissions Criteria: Singles or couples, 65 years of age or older. Priority tends to be given to
individuals with the greatest need; however, consideration is also given to what mix of needscan be handled by staff at a given time. Individuals must be functionally independent (nodisruptive or wandering behaviors, single clients must not require a two person transfer). If anexisting resident loses capacity or is judged to be a risk to themselves or to others in thebuilding, conversations around transition to LTC may be initiated.
As shown in the tables below, Site 3A serves individuals with a range of needs, extending up to C.Cameron (not cognitively intact, some difficulty with ADLs, great difficulty with IADLs); however, mostresidents fell into lower needs BoC sub groups such as Davis (cognitively intact, no difficulty with ADLs,some difficulty with IADLs). MAPLe scores ranged from 2 (mild) to 4 (high), with about half of this site�’sresidents (52%) scoring 2.
0
35%
58%
8%0
Low Mild Moderate High Very High
SH Site 2:Resident Mix By MAPLe Score

North West Balance of Care Project II: Supportive Housing July 19, 2010
15
SH Site 3B: This is a �“satellite�” of Site 3A. Like Site 3A, it was originally an apartment building whichattracted older persons who then required community supports. It draws on resources from Site 3A(including administrative support) with services provided by the same organization. According to thekey informants, characteristics of this site include:
Residents: 21 in 2009 with expansion to 28 clients in 2010 Services:
o 24 hour on site staffo Personal support (medication reminders, bathing, morning & evening dressing)o Homemaking (assistance with laundry, light meal preparation, housekeeping and
shopping assistance)o Congregate diningo Emergency response/lifelineo Daily �“how are you?�” checkso Access to program coordinator (to provide additional support and care coordination
including CCAC and other support agency referrals)o A day program is housed in the building and can be attended by the residents up to
twice weekly for a fee. Admissions Criteria: Singles or couples, 65 years of age or older. Priority tends to be given to
individuals with greatest need although staff ability to care for resident needs is also considered.Individuals must be functionally independent (no disruptive or wandering behaviors; single
5%
47%
9% 5% 0 5% 5% 0 5% 9% 5% 0 5% 0 0 0
SH Site 3A:Client Mix by BoC Sub Groups
52%
24% 24%
Low Mild Moderate High Very High
SH Site 3A:Resident Mix by MAPLe Score

North West Balance of Care Project II: Supportive Housing July 19, 2010
16
clients must not require a two person transfer). If an existing resident loses capacity or isjudged to be a risk to themselves or others in the building, conversations around transition toLTC may be initiated.
The following tables show that while many residents of Site 3B fell into relatively low needs BoC subgroups, almost a fifth (17%) were categorized as Xavier (not cognitively intact, no ADL difficulty, buthigh IADL difficulty). This is reflected in MAPLe scores ranging from 2 (mild) to 4 (high), with more thana quarter (27%) scoring 4.
SH Site 4A. Site 4A consists of SH units within a senior�’s apartment building. It is adjacent to a LTCfacility. A community support outreach agency operates from the building. Residents are classified intoone of three �“needs groups:�” minimum (requiring at least 1 hour of care/week), moderate (5.5 hours ofcare/week) or maximum (10 15 hours of care/week). While staff are available during the day andevenings, 24/7 coverage is not available.
Residents: 35 Services:
o Staff available between 7am 9pm on weekdays and for 4 hours on Saturday and Sundayo Personal support (assistance with bathing, toileting, dressing, and medication
reminders)o Homemaking (assistance with laundry, light meal preparation and housekeeping)
0
17%
0
35%
0
17%
4% 0 010%
0
17%
0 0 0 0
SH Site 3B:Resident Mix by BoC Sub Groups
17%
56%
27%
Low Mild Moderate High Very High
SH Site 3B:Client Mix by MAPLe Score
North West Balance of Care Project II: Supportive Housing July 19, 2010
17
o Congregate diningo Emergency response/lifelineo Access to a recreation program with ongoing activities provided by visiting volunteers,
community groups, and high school students Admissions Criteria: Singles or couples, 60 years of age or older. Individuals must require some
level of care to be accepted to the SH program. However, individuals must be functionallyindependent (no disruptive or wandering behaviors, and single clients must not require a twoperson transfer). If an existing resident loses capacity or judged to be a risk to themselves orothers, conversations around transition to LTC may be initiated.
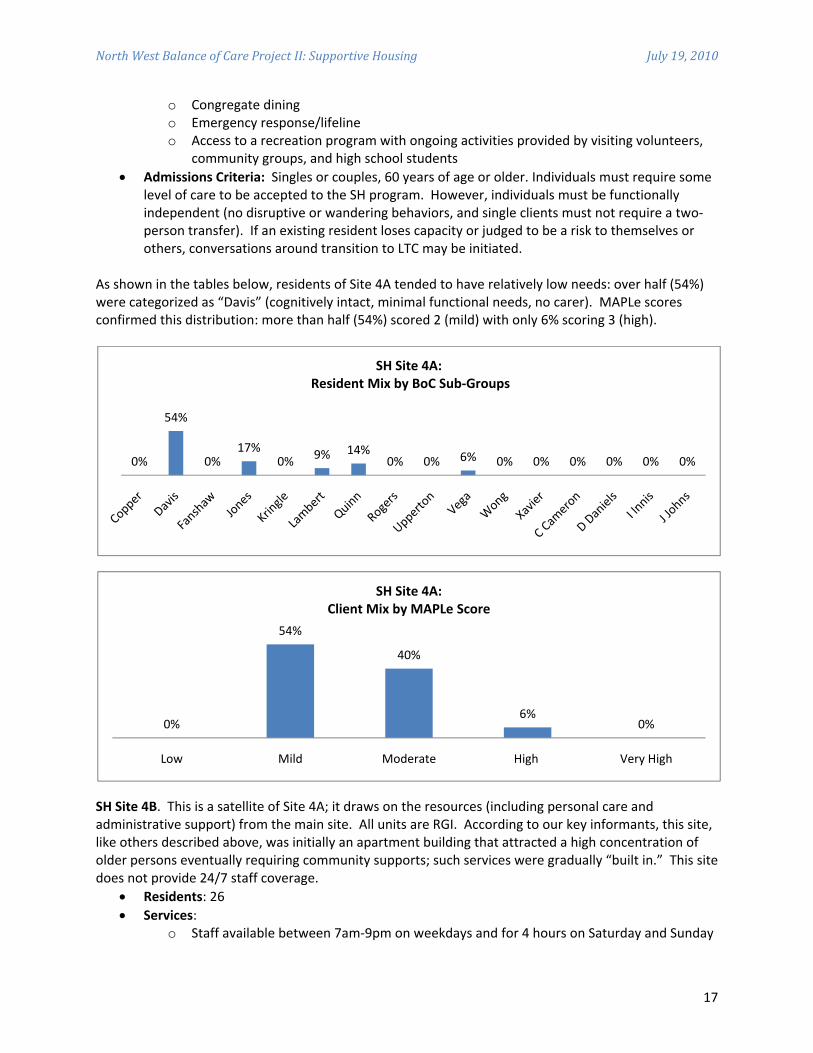
As shown in the tables below, residents of Site 4A tended to have relatively low needs: over half (54%)were categorized as �“Davis�” (cognitively intact, minimal functional needs, no carer). MAPLe scoresconfirmed this distribution: more than half (54%) scored 2 (mild) with only 6% scoring 3 (high).
SH Site 4B. This is a satellite of Site 4A; it draws on the resources (including personal care andadministrative support) from the main site. All units are RGI. According to our key informants, this site,like others described above, was initially an apartment building that attracted a high concentration ofolder persons eventually requiring community supports; such services were gradually �“built in.�” This sitedoes not provide 24/7 staff coverage.
Residents: 26 Services:
o Staff available between 7am 9pm on weekdays and for 4 hours on Saturday and Sunday
0%
54%
0%17%
0% 9% 14%0% 0% 6% 0% 0% 0% 0% 0% 0%
SH Site 4A:Resident Mix by BoC Sub Groups
0%
54%
40%
6%0%
Low Mild Moderate High Very High
SH Site 4A:Client Mix by MAPLe Score

North West Balance of Care Project II: Supportive Housing July 19, 2010
18
o Personal support (assistance with bathing, toileting, dressing, and medicationreminders)
o Homemaking (assistance with housekeeping, laundry, and light meal preparation). Admissions Criteria: Singles or couples, 60 years of age or older. Individuals must require some
level of care to be accepted to the SH program. However, individuals must be functionallyindependent (no disruptive or wandering behaviors, single clients must not require a twoperson transfer). If an existing resident loses capacity or judged a risk to themselves or others inthe building, transition to LTC may be initiated.
The following tables show that Site 4A residents had relatively low needs; 85% were classified as�“Davis.�” Using average MAPLe scores, 85% of residents were classified as �“mild.�”
3.4 Overall Distribution of SH ResidentsThe following tables present distributions by BoC sub groups and MAPLe scores for all SH residents inthe 6 SH Sites in the NW. They show that:
90% of current residents were cognitively intact; Most experienced little or no difficulty with ADLs and IADLs; While 10% had high (4) MAPLe scores, most scored mild (2) or moderate (3).
0%
85%
0% 10% 0% 0% 0% 0% 0% 0% 0% 5% 0% 0% 0% 0%
SH Site 4A:Resident Mix by BoC Sub Groups
0
85%
10% 5% 0%
Low Mild Moderate High Very High
SH Site 4A:Client Mix by MAPLe Score

North West Balance of Care Project II: Supportive Housing July 19, 2010
19
3.5 Comparison of SH Residents to LTCWait ListWe also compared the distribution of SH residents to the distribution of all wait listed individuals in theNW, using both the BoC sub groups and MAPLe scores. Results are shown in the tables below.
In summary these results show that SH residents tended to be at the lower end of the needs spectrum,while individuals on the LTC wait list tended to be at the higher end:
Nine in ten (91%) SH residents fell into BoC sub groups before Upperton �– they were cognitivelyintact; by contrast, almost three quarters of LTC wait listed individuals fell into sub groups afterUpperton �– they experienced cognitive impairments;
While 74% of LTC wait listed individuals had MAPLe scores of 4, most SH residents scored 3 orbelow.
Nevertheless, there was important overlap in these two populations: a quarter (26%) of LTC wait listedindividuals fell into BoC sub groups below Upperton, with 15% located in Copper, Davis and Fanshaw;individuals in these sub groups were cognitively intact, could conduct ADL tasks independently, butexperienced some level of difficulty with IADLs. They appeared to be possible candidates for current SHsites.
1%
33%
12%
31%
2%9%
3% 0% 1% 5% 1% 3% 0% 0% 0% 0%
Overall SH Client Mix by BoC Sub Groupsn = 319
0
34%
57%
10%0%
Low Mild Moderate High Very High
MAPLe Score of SH Clientele in NWOn = 319

North West Balance of Care Project II: Supportive Housing July 19, 2010
20
3.6 Vignettes and Care PackagesAs detailed above, we drew upon RAI HC data to create 16 �“vignettes,�” one for each of the 16 BoC subgroups populated with sufficient numbers of individuals to warrant analysis. Vignettes were written tosimulate the notes case managers would use when making actual care decisions. For example, thevignette for Davis, at a relatively low level of need, states:
�“Davis is cognitively intact and functionally independent in all ADLs with the exception ofbathing (limited assistance is required). Davis has no difficulty using the phone; some difficultywith transportation, managing medications and preparing meals; great difficulty housekeeping.Davis does not have a live in caregiver. Davis�’ caregiver is an adult child who lives outside of thehome. This caregiver provides advice/emotional support and assistance with IADLs.�”
Building on the urban and rural/remote H&CC packages constructed for NW BoC I, in Project II weconstructed a single, composite H&CC package for each vignette; these composite packages contained
1%
33%
12%
31%
2%
9%
3%
0% 1%
5%
1%3%
0% 0% 0% 0%2%
10%
3%2% 2% 3% 3%
4%2%
7% 6%8%
12%
14%12%
11%
SH versus Wait List by BoC Sub Groups
SH Sample (%) WL Sample (%)
34%
57%
10%12% 17%
72%
Low Mild Moderate High Very High
Average MAPLe Scores for SH Residents and LTC Wait List
Supportive Housing Wait List
North West Balance of Care Project II: Supportive Housing July 19, 2010
21
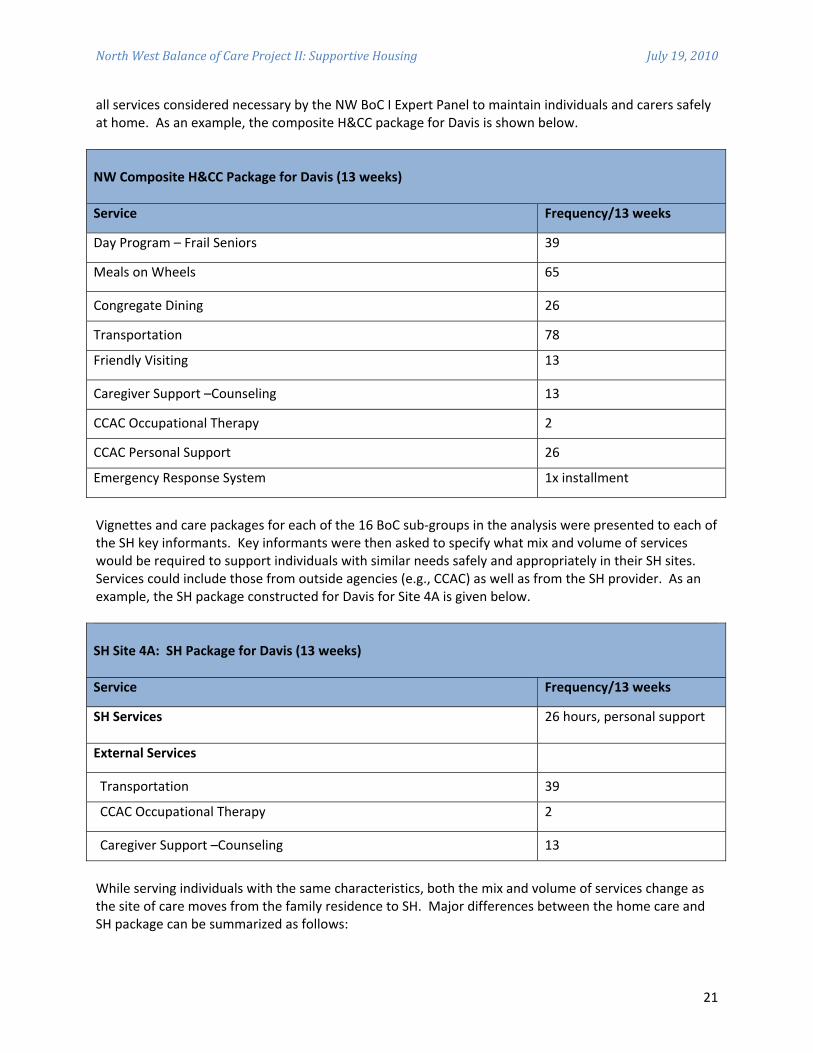
all services considered necessary by the NW BoC I Expert Panel to maintain individuals and carers safelyat home. As an example, the composite H&CC package for Davis is shown below.
NW Composite H&CC Package for Davis (13 weeks)
Service Frequency/13 weeks
Day Program �– Frail Seniors 39
Meals on Wheels 65
Congregate Dining 26
Transportation 78
Friendly Visiting 13
Caregiver Support �–Counseling 13
CCAC Occupational Therapy 2
CCAC Personal Support 26
Emergency Response System 1x installment
Vignettes and care packages for each of the 16 BoC sub groups in the analysis were presented to each ofthe SH key informants. Key informants were then asked to specify what mix and volume of serviceswould be required to support individuals with similar needs safely and appropriately in their SH sites.Services could include those from outside agencies (e.g., CCAC) as well as from the SH provider. As anexample, the SH package constructed for Davis for Site 4A is given below.
SH Site 4A: SH Package for Davis (13 weeks)
Service Frequency/13 weeks
SH Services 26 hours, personal support
External Services
Transportation 39
CCAC Occupational Therapy 2
Caregiver Support �–Counseling 13
While serving individuals with the same characteristics, both the mix and volume of services change asthe site of care moves from the family residence to SH. Major differences between the home care andSH package can be summarized as follows:

North West Balance of Care Project II: Supportive Housing July 19, 2010
22
In the family residence, all services are provided on a service by service basis by externalproviders; in SH many services are provided in house expanding opportunities forcommunication, ongoing assessment, and care planning;
In the family residence, nutrition needs are addressed through a combination of meals onwheels and participation in congregate dining programs offered by adult day programs; in SH,nutritional needs can often be met through on site meals;
In the family residence, friendly visiting or visits to day programs ensure social connectedness; inSH, on site congregate activities provide regular opportunities for social engagement,communication and ongoing assessment;
In the family residence, transportation is required to bring workers to clients, and clients toservices; in SH residents transportation needs are minimized, although transportation may stillbe required for medical appointments and shopping;
In the family residence, older persons requiring emergency assistance use 911 or responsesystems offered by external providers who then contact emergency personnel; in SH, there isimmediate access to staff (often, but not always on a 24/7 basis) mitigating the need for callsystems and emergency services;
In the family residence, Occupational Therapy services focus on assessing safety andaccessibility; in SH sites designed for safety and accessibility, the focus shifts to providingtherapy for individuals;
In both the family residence and SH, caregiver counseling emphasizes and supports the crucialrole and often challenging role played by family, friends, and neighbors.
3.7 SH Costs and Estimated Divert RatesUsing Method A (which averages costs across all residents in a SH site), we produced cost estimates foreach of the 16 SH packages for each of the 6 SH sites; we then compared them to the cost of residentialLTC. Recall that each of these estimates is for a 13 week period, excluding user fees and co payments.
Below is an example for Site 4A, for Davis.

North West Balance of Care Project II: Supportive Housing July 19, 2010
23
SH Site 4A: Costs for Davis Using Cost Method A (Average Cost Per Day)
Service Unit Cost/Unit of Service
Units of Service (13 weeks)
Total Cost (13 weeks)
SH Program day $15.82 91 $1,439.62SH ProgramSub Total $1,439.62External ServicesTransportation round trip $38.54 39 $1,503.06CCAC OT visit $158.00 2 $316.00Caregiver Support visit $17.60 13 $228.80External ServicesSub Total $2,047.86Total Cost $3,487.48
Our key informants in SH Site 4A were also able to apply Method B, which calculates costs based on thenumber of hours of care required by individuals represented in each vignette. The results are shownbelow.
SH Site 4A: Costs for Davis Using Cost Method B (Hours of Care Per Day)
Service UnitCost/Unit ofService
Units of Service(13 weeks)
Total Cost(13 weeks)
SH Program hour $46.38 26 $1,205.88SH ProgramSub Total $1,205.88External ServicesTransportation round trip $38.54 39 $1,503.06CCAC OT visit $158.00 2 $316.00Caregiver Support visit $17.60 13 $228.80External ServicesSub Total $2,047.86Total Cost $3,253.74
Note that because individuals in the Davis sub group have lower than average needs and use fewer thanaverage hours of care, �“Total SH Cost�” for Davis was slightly lower using Method B (which looks at actualhours of care) as compared to Method A (which averages care across all residents in an SH site).Conversely, for residents with higher than average needs, requiring higher than average hours of care,Method B cost estimates tended to be higher.
Recall that individuals in BoC sub groups are considered to be �“diverts�” if the total cost to the LHIN(excluding user fees and co payments) is equal to, or less than, the total cost to the LHIN of a residentialLTC bed (excluding resident co payments) for the same period.

North West Balance of Care Project II: Supportive Housing July 19, 2010
24
The �“overall divert rate�” is calculated by dividing the total number of individuals in divertible sub groupsby the total number of individuals in the 16 sub groups for which SH packages were constructed.Detailed divert rate calculations are given below for SH Site 4A using both Method A and Method B.
SH Site 4A: Divert Rate Estimate Using Cost Method A (Average Cost Per Day)
Sub Group
Number onLTC WaitList in NWRegion
Percent ofLTC WaitList in NWRegion
Number ofResidentsin SH Site4A
SH ProgramCost(AverageCost/ Day)
ExternalServicesCost Total Cost LTC Cost
Copper 19 4.1% N/A N/A** N/A N/A $8,099.00
Davis 82 17.5% 19 $1,439.62 $2,047.86 $3,487.48 $8,099.00
Fanshaw 13 2.8% 0 $1,439.62 $2,205.86 $3,645.48 $8,099.00
Jones 7 1.5% 6 $1,439.62 $2,615.61 $4,055.23 $8,099.00
Kringle 14 3.0% N/A N/A N/A N/A $8,099.00
Lambert 10 2.1% 3 $1,439.62 $4,142.68 $5,582.30 $8,099.00
Quinn 10 2.1% 5 $1,439.62 $6,605.30 $8,044.92 $8,099.00
Rogers 8 1.7% N/A N/A N/A N/A $8,099.00
Upperton 13 2.8% 0 $1,439.62 $4,204.79 $5,644.41 $8,099.00
Vega 42 9.0% 2 $1,439.62 $4,354.81 $5,794.43 $8,099.00
Wong 33 7.1% 0 $1,439.62 $5,351.62 $6,791.24 $8,099.00
Xavier 36 7.7% 0 $1,439.62 $4,250.96 $5,690.58 $8,099.00
C. Cameron 52 11.1% 0 $1,439.62 $6,992.21 $8,431.83 $8,099.00
D, Daniels 44 9.4% N/A N/A N/A N/A $8,099.00
I. Innis 44 9.4% N/A N/A N/A N/A $8,099.00
J. Johns 41 8.7% N/A N/A N/A N/A $8,099.00
Total 468 100% 35
Divert Rate 52.6%
SH Site 4A: Divert Rate Estimate Using Cost Method B (Hours of Care Per Day)
Vignette
Number onLTC WaitList in NWRegion
Percent ofLTC WaitList in NWRegion
Number ofResidentsin SH Site4A
SH ProgramCost(AverageCost/Hour)
ExternalServicesCost
Total Cost LTC Cost
Copper 19 4.06% N/A N/A** N/A N/A $8,099.00
Davis 82 17.52% 19 $1,205.88 $2,047.86 $3,253.74 $8,099.00
Fanshaw 13 2.78% 0 $1,205.88 $2,205.86 $3,411.74 $8,099.00
Jones 7 1.50% 6 $9,044.10 $2,615.61 $11,659.71 $8,099.00
Kringle 14 2.99% N/A N/A N/A N/A $8,099.00
Lambert 10 2.14% 3 $8,441.16 $4,142.68 $12,583.84 $8,099.00
Quinn 10 2.14% 5 $12,661.74 $6,605.30 $20,215.04 $8,099.00
Rogers 8 1.71% N/A N/A N/A N/A $8,099.00

North West Balance of Care Project II: Supportive Housing July 19, 2010
25
Upperton 13 2.78% 0 $4,823.52 $4,204.79 $9,028.31 $8,099.00
Vega 42 8.97% 2 $8,441.16 $4,354.81 $12,795.97 $8,099.00
Wong 33 7.05% 0 $2,441.16 $5,351.62 $10,175.14 $8,099.00
Xavier 36 7.69% 0 $8,441.16 $4,250.96 $12,692.12 $8,099.00
C. Cameron 52 11.11% 0 $8,441.16 $6,992.21 $15,433.37 $8,099.00
D. Daniels 44 9.40% N/A N/A N/A N/A $8,099.00
I. Innis 44 9.40% N/A N/A N/A N/A $8,099.00
J. Johns 41 8.76% N/A N/A N/A N/A $8,099.00
Total 468 100.0% 35
Divert Rate 20.30%
Note the following about these two examples: Divert rates estimate the proportion of individuals on the NW LTC wait list that could potentially
be supported safely and cost effectively in SH sites similar to Site 4A. However, this does notsuggest that these individuals could be diverted immediately; additional capacity would likely berequired.
�“N/A�’s�” in these tables identify BoC sub groups judged not to be appropriate for SH Site 4A:o In the case of Copper, the key informant stated that individuals in this sub group would
not be eligible because their needs were too low;o In the case of Kringle, the key informant stated that individuals in this sub group would
not be appropriate since they required extensive assistance with toileting. This SH sitedoes not have staff to assist during the night and Kringle�’s caregiver does not provideassistance with ADLs.
o In the case of Rogers, the key informant stated that due to high ADL and IADL needs(individuals in this group were completely dependent on others to perform tasks forthem) and lack of a live in caregiver, individuals in this sub group would not beappropriate for this SH site. In contrast, individuals in some, but not all, sub groupsabove Rogers could be admissible since while they are not cognitively intact, they havelower ADL and IADL needs, and many have live in caregivers.
o With respect to I. Innis and J. Johns (both cognitively impaired, with high levels of ADLand IADL difficulties) it was concluded that SH would never be a safe option.
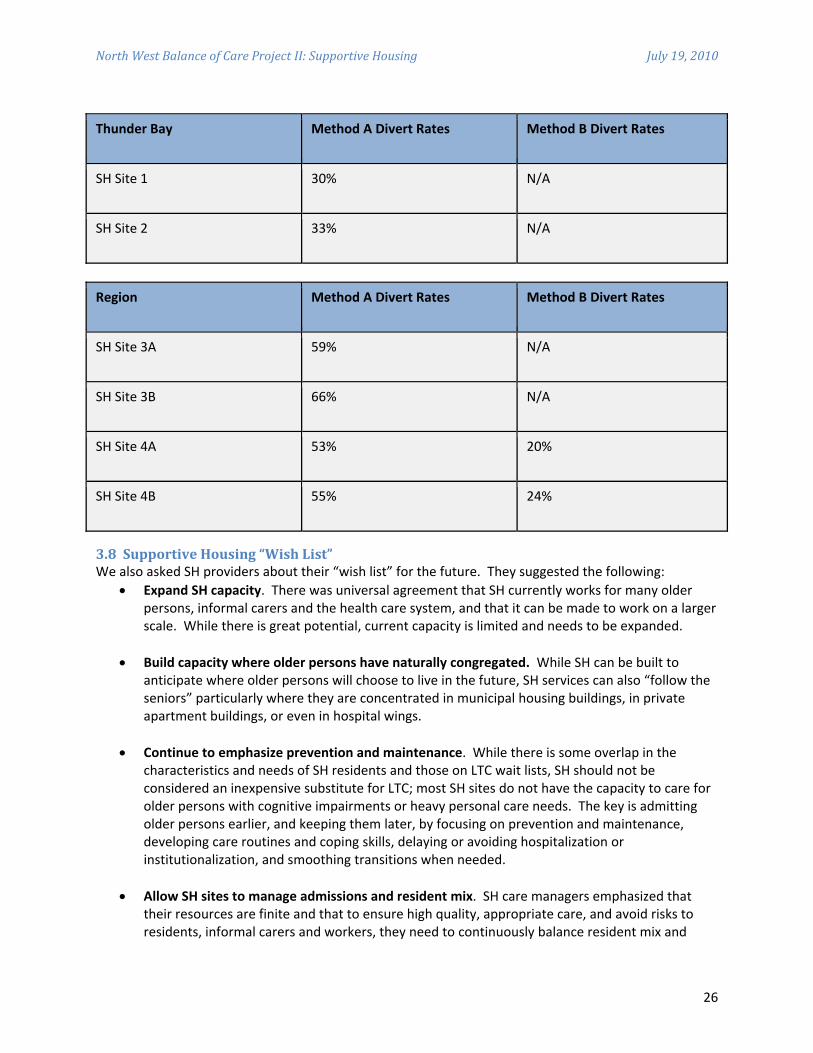
The tables below summarize divert rates for SH sites in Thunder Bay and the Region using both costmethods where possible. Estimates for SH sites in Thunder Bay and the Region are given separatelysince they were adjusted for differences in the characteristics of LTC wait listed individuals, as well as forvariable CSS costs. Using Method A, divert rates in Thunder Bay SH sites range from 30% to 33%; in theRegion they range from 53% to 66% using Method A, and from 20% to 24% using Method B.
North West Balance of Care Project II: Supportive Housing July 19, 2010
26
Thunder Bay Method A Divert Rates Method B Divert Rates
SH Site 1 30% N/A
SH Site 2 33% N/A
Region Method A Divert Rates Method B Divert Rates
SH Site 3A 59% N/A
SH Site 3B 66% N/A
SH Site 4A 53% 20%
SH Site 4B 55% 24%
3.8 Supportive Housing �“Wish List�”We also asked SH providers about their �“wish list�” for the future. They suggested the following:
Expand SH capacity. There was universal agreement that SH currently works for many olderpersons, informal carers and the health care system, and that it can be made to work on a largerscale. While there is great potential, current capacity is limited and needs to be expanded.
Build capacity where older persons have naturally congregated. While SH can be built toanticipate where older persons will choose to live in the future, SH services can also �“follow theseniors�” particularly where they are concentrated in municipal housing buildings, in privateapartment buildings, or even in hospital wings.
Continue to emphasize prevention and maintenance. While there is some overlap in thecharacteristics and needs of SH residents and those on LTC wait lists, SH should not beconsidered an inexpensive substitute for LTC; most SH sites do not have the capacity to care forolder persons with cognitive impairments or heavy personal care needs. The key is admittingolder persons earlier, and keeping them later, by focusing on prevention and maintenance,developing care routines and coping skills, delaying or avoiding hospitalization orinstitutionalization, and smoothing transitions when needed.
Allow SH sites to manage admissions and resident mix. SH care managers emphasized thattheir resources are finite and that to ensure high quality, appropriate care, and avoid risks toresidents, informal carers and workers, they need to continuously balance resident mix and

North West Balance of Care Project II: Supportive Housing July 19, 2010
27
available resources. Many factors impact on this balance. The availability of trained workersvaries considerably with most communities experiencing continuing shortages. A net outflow ofyounger persons continues, leaving many older persons without informal caregivers, or withspouses who themselves need care. Access to crucial services such as transportation also variesacross urban, rural and remote areas. Thus, while SH wait lists might be maintained centrally,admissions must be managed locally to ensure the best �“fit�” between needs and capacity.
Promote closer links between SH and LTC. As described above, some SH sites are located nearLTC facilities and share resources; this offers advantages to residents in both SH and LTC whocan access programs and services which might otherwise not be available. Familiarity with theLTC facility also offers smoother transitions for residents and families when independent living isno longer possible, and vice versa, since some LTC residents improve sufficiently to return to SH.The ability to transition to a proximate LTC facility can be beneficial for couples if one transfersnext door, the couple can maintain their relationship without both moving to LTC. While SH andLTC fall under different legislation and funding mechanisms, and while LTC placement iscurrently managed centrally, stronger linkages between SH and LTC could encourage jointprograms and greater scope to transition individuals smoothly in their own communities.
Promote closer links between SH and other providers. Particularly in smaller communities,with limited resources, there is a tradition of interdependence and collaboration betweenproviders. It was observed that partnerships with recreational facilities enhance socialopportunities while maintaining functional independence and mobility. Visiting nurses canorganize clinics in SH to manage medications, conduct blood tests and diagnose healthconditions. Physiotherapy and social work are relatively new but valuable services whichmaintain the functional capacity of SH residents and enhance family support, care coordinationand referral. One SH site has partnered with a family health team to provide access to primarycare, including the services of a Nurse Practitioner. Strong linkages between providers result inbetter triaging of needs and more seamless, timely transitions between home, SH and LTC.
Invest in workers. The availability of health human resources is an ongoing challenge. Someproviders commented that adequate compensation is needed to attract and retain workers andimprove continuity and quality of care. But even where workers are available, they may not beappropriately trained. Since a growing number of older persons experience Alzheimer�’s diseaseor other dementias, and since this poses particular challenges in SH where independent living isemphasized, training programs for workers and managers in this area could improve care andpotentially expand capacity.
Make programs equitable. SH programs and services require user fees which vary by provider.Ideally, funding would be sufficient to make user fees unnecessary since they create barriers toaccess particularly in smaller, poorer communities. If user fees are required, thought should begiven to standardizing them across the NW to ensure equal treatment.
Enhance palliative care. Currently there is little capacity to support end of life care in SH. Suchcapacity is needed so that SH does not become a form of transitional care.

North West Balance of Care Project II: Supportive Housing July 19, 2010
28
4.0 Conclusions
As noted in our introductory remarks, the North West Balance of Care Project II (NW BoC II) aimed toestimate the potential for supportive housing (SH) to maintain the region�’s growing population of olderpersons safely and cost effectively �“closer to home.�”
To achieve these goals we used the Balance of Care (BoC) approach previously used in the North WestBalance of Care Project I, and in other 8 regions of Ontario, to examine the characteristics and needs ofindividuals on the LTC wait list, and to estimate what proportion could safely and cost effectively age inplace in SH. A particular strength of this approach is the combining of the best available quantitativedata with the insights and analysis of the most experienced leaders and care managers who understandneeds and capacity to meet needs at the local level. This combination produced a very rich portrait ofwhat SH now does, and what it could potentially do.
Below, we offer a number of conclusions drawn from this analysis and our read of the literature.
4.1 SH Offers Considerable Potential to Support �“At Risk�” Older Persons in the NWOur first conclusion is that SH offers considerable potential to support older persons safely and costeffectively �“closer to home�” in the NW.
NW BoC I (conducted in 2008) analyzed the potential to �“divert�” individuals from LTC wait lists. Itconcluded that 8% of individuals �“at risk�” of institutionalization in Thunder Bay, and 49% of wait listedindividuals in the surrounding Region, could be supported safely and cost effectively in the familyresidence if given access to needed home and community care.
By contrast, NW BoC II (conducted in late 2009) estimates higher divert rates for SH even though overalllevels of need for LTC wait listed individuals have increased since 2008 across the NW. In Thunder Bay,SH divert rates approach one third (30% to 33%), while in the Region divert rates range from 20% to 66%depending on site and method of cost calculation. Of course, it is important to emphasize that thesedivert rates estimate potential, not current capacity.
4.2 SH Generates ValueSH is not a single, uniform entity. Rather it comes in many shapes and sizes, reflecting, to a largedegree, differences in needs and resources at the local level. Indeed, most SH sites have grown �“fromthe ground up�” in response to the needs of a growing population of older persons who wish to continueto live in their own communities as independently as possible, for as long as possible. While SH is notthe family residence, it is home, in the same way that an apartment or condominium would be home.
Advantages of SH (compared to LTC) are seen to include: Enhanced independence, quality of life, privacy Less intrusive care Particularly for individuals in low to middle needs sub groups, a cost effective alternative to LTC
which can be adapted to existing housing stock to avoid capital costs and construction delays.
Advantages of SH (compared to home care in family residence) are seen to include: Ability to concentrate resources in a single location Increased flexibility in the use of available resources including staff Reduced travel costs for residents and workers

North West Balance of Care Project II: Supportive Housing July 19, 2010
29
�“Critical mass�” for SH congregate activities (e.g., meals, social activities) which can be levered toestablish a service hub for the broader community
Increased peace of mind for older persons and carers Improved coordination/navigation, pro active planning, smoother transitions, and crisis
avoidance
4.3 Prevention and Maintenance are KeyThe international literature suggests that home and community care (H&CC) can:
Substitute for acute care in hospitals; Substitute for long term care in facilities; Prevent illness and disability, and maintain functional capacity and wellbeing
According to our key informants, while often seen as a less expensive substitute for LTC, SH�’s real valuelies in maintaining wellbeing and functional capacity, and preventing or delaying hospital and facilitycare. Thus instead of pegging SH at a particular needs level (e.g., MAPLe 3�’s or 4�’s), SH aims to admitindividuals earlier and keep them later as part of a dynamic and proactive process of continuouslymonitoring needs and planning care pathways, including transitions to LTC or hospital when required,avoiding crisis placements.
4.4 Risk Management is CrucialSH key informants emphasized risk management as a means of ensuring high quality care. While thereis always some risk associated with caring for older persons with declining mental and physical abilities,risk increases unacceptably as needs outstrip organizational capacity. This means that there has to beongoing assessment of who to admit, how to care for them, and when to transition to LTC if required.
Most importantly, while a majority of SH sites in the NW offer 24/7 staffing, none has the capacity for 24hour surveillance. Consistent with the idea of independent living, residents are free to come and go,and to make their own decisions, for good and for bad, which means that SH is likely not an optimalchoice for individuals with major cognitive impairments, who wander, pose safety risks, are aggressive,or make poor decisions. Nor do SH sites currently have the capacity to provide heavier personal caresuch as two person transfers for bathing and toileting, although presumably, such capacity could beenhanced with additional resources and staff training. Thus ongoing risk management is vital to ensurean optimal balance between resources and needs.
4.5 Realize SH�’s PotentialFinally, our key informant interviews and review of the literature suggest a number of strategies forrealizing SH�’s potential in the NW. These include:
�“Follow the seniors.�” Begin by identifying concentrations of older persons in existing housing(including public housing) and build SH capacity around them. In larger communities this canhappen in apartments buildings with high densities of older persons; in smaller communities,larger houses could be adapted as Abbeyfield type SH sites where 6 to 10 people have their ownprivate rooms, share congregate services including meals, and have access to 24/7 staffincluding emergency on call. Such strategies lever the advantages of �“critical mass�” whileavoiding the prohibitive costs and delays associated with constructing new buildings.
Clone satellites. Two current SH providers in the NW have used this strategy effectively,establishing services at one site, building capacity, and then extending services to a new site.This takes full advantage of an existing base of experience, allows pooling of resources (including

North West Balance of Care Project II: Supportive Housing July 19, 2010
30
administration and staff) across sites, and achieves improved flexibility and economies of scale.
Network SH sites. Web based and video technologies offer ever expanding opportunities for SHproviders in different locations to communicate, develop common approaches and protocol,share innovations and best practices, and anticipate and respond proactively to changingpopulation needs. For example, conversations around risk management and admissions,particularly for older persons with cognitive problems, might be particularly valuable. Suchtechnologies can also facilitate virtual team approaches to caring for individuals with complexneeds, thus supporting care quality, continuity, and cost effectiveness.
Develop SH sites into regional service integration hubs. A key challenge, highlighted in NW BoCProjects I and II, particularly outside of Thunder Bay, is access to a coordinated range ofcommunity based supports for older persons �“at risk�” of institutionalization. Even whenservices are present, individuals with multiple, chronic needs (and their caregivers) may still findit difficult to access and manage multiple services, often from multiple providers; LTC too oftenbecomes the only viable option. It is in this context that SH could play a particularly valuablerole by establishing regional service �“hubs.�” In addition to offering a range of services toresidents, SH sites could radiate out services including scheduled health care clinics (e.g.,primary care, pharmacy, nutrition, social work) to the broader community. The addition ofstandardized assessment and case management/care coordination to the mix could see SH sitesemerge as regional service integration hubs able to triage needs, plan care pathways, andnavigate older persons to the most appropriate services and sites (including SH) across the carecontinuum.
There are valuable precedents: in the U.S., rural PACE (Programs of All inclusive Care for theElderly) models use interdisciplinary teams (including primary care physicians) to provide acoordinated range of services (preventive, acute and long term care) to concentrations of olderpersons (55+ years of age) living in rural areas. Some programs offer services at a central site(such as SH and adult day programs) and others offer services in the family residence. Whileoperated by different provider organizations, PACE sites have access to shared technicalresources including rural workgroups on key issues (staffing, financing, infrastructure,technology, network development, risk management strategies, and community needsassessment) and consultation (particularly to support the start up of new sites). Telehealth,telemedicine and teleconferencing are widely used for electronic medical records,communications, access to web based resources and services, and digital imaging (e.g.,paperless x rays for radiology); also, clients can access information, refill prescriptions, andreview their own medical histories on line. For case studies describing 3 rural PACE models see�“Setting the PACE for Rural Elder Care�” (2004) athttp://pace.techriver.net/website/download.asp?id=586.
Closer to home, an ongoing project in North Renfrew, Ontario, has achieved considerablesuccess in providing a range of supportive services to a scattered population of older persons, bybuilding SH and LTC capacity at a central site, and then pushing services out to the broadercommunity. Currently, this project services 40+ clients in supportive care apartments and LTCbeds, more than 30 respite clients and 300+ clients in the community, while coordinating over300 volunteers. For details see �“From Denmark to Deep River: Integrating Care in Small andRural Communities in Ontario�” (2010) at http://www.longwoods.com/content/21223.

North West Balance of Care Project II: Supportive Housing July 19, 2010
31
Appendix 1: Balance of Care Sub Groups
Sub group Cognition ADL Difficulty IADL Difficulty Live in Caregiver
1. Appleton Intact No No Yes
2. Bruni Intact No No No
3. Copper Intact No Some Yes
4. Davis Intact No Some No
5. Eggerton Intact No Great Yes
6. Fanshaw Intact No Great No
7. Grimsby Intact Some None Yes
8. Hamilton Intact Some None No
9. Islington Intact Some Some Yes
10. Jones Intact Some Some No
11. Kringle Intact Some Great Yes
12. Lambert Intact Some Great No
13. Moore Intact Great None Yes
14. Nickerson Intact Great None No
15. Opus Intact Great Some Yes
16. Pringle Intact Great Some No
17. Quinn Intact Great Great Yes
18. Rogers Intact Great Great No
19. Smith Not Intact None None Yes
20. Thompson Not Intact None None No
21. Upperton Not Intact None Some Yes
22. Vega Not Intact None Some No
23. Wong Not Intact None Great Yes

North West Balance of Care Project II: Supportive Housing July 19, 2010
32
24. Xavier Not Intact None Great No
25. Yeung Not Intact Some None Yes
26. Zeleny Not Intact Some None No
27. A. Armour Not Intact Some Some Yes
28. B. Biloski Not Intact Some Some No
29. C. Cameron Not Intact Some Great Yes
30. D. Daniels Not Intact Some Great No
31. E. Edwards Not Intact Great None Yes
32. F. Fish Not Intact Great None No
33. G. Gallo Not Intact Great Some Yes
34. H. Hogan Not Intact Great Some No
35. I. Innis Not Intact Great Great Yes
36. J. Johns Not Intact Great Great No
Notes: Vignettes and care packages constructed for 16 highlighted sub groups in 2008 and 2009.

North West Balance of Care Project II: Supportive Housing July 19, 2010
33
Appendix 2: Distribution of All Wait Listed Individuals by Location(Thunder Bay, Region, Entire NW) for 2008 and 2009
BoC SubGroup
Thunder Bay (%)
2008 2009
NW Region (%)
2008 2009
Entire NW (%)
2008 2009
Appleton 0 0 0 0.2 0 0.1
Bruni 0.2 0 2 0.4 0.8 0.2
Copper 1 0.6 6 3.9 3.1 2.3
Davis 7 1.9 25 16.8 14.6 9.3
Eggerton 1 0.8 2 1.4 1.4 1.1
Fanshaw 4 2.7 5 2.7 4.4 2.7
Grimsby 0 0 0 0 0 0
Hamilton 0 0 0 0 0 0
Islington 1 0.2 1 0.2 0.9 0.2
Jones 3 1.9 1 1.4 2 1.6
Kringle 3 1.9 1 2.9 1.9 2.4
Lambert 5 3.1 3 2.0 4.1 2.7
Moore 0 0 0 0 0 0
Nickerson 0 0 0 0 0 0
Opus 0.4 0.2 1 0.2 0.7 0.2
Pringle 1 1 1 0.6 0.9 0.8
Quinn 3 3.5 1 2.0 2.2 2.8
Rogers 5 6.4 2 1.6 3.5 4.1
Smith 0 0 0 0 0 0
Thompson 0.2 0 0.3 0.2 0.2 0.1
Upperton 2 1.2 5 2.7 3 1.9
Vega 3 4.2 9 8.6 5.9 6.5
Wong 3 4.8 5 6.8 4.1 5.7
Xavier 7 7.7 8 36 (7.4) 6.7 7.5
Yeung 0 0 0 0 0 0

North West Balance of Care Project II: Supportive Housing July 19, 2010
34
Zeleny 0 0 0 0 0 0
A.Armour 1 0 1 0 0.9 0
B.Biloski 2 1.2 1 0.6 1.6 0.9
C.Cameron 8 11.4 6 10.7 6.9 11.1
D.Daniels 14 17.9 5 9 10 13.5
E.Edwards 0 0 0 0 0 0
F.Fish 0 0 0 0 0 0
G.Gallo 0.2 0 0 0 0.1 0
H.Hogan 0 0 0 0 0 0.1
I.Innis 14 15 7 9 10 11.9
J.Johns 12 12.3 6 8.4 9.4 10.3
Total 475 481 383 488 864* 975*
Notes: Vignettes and care packages constructed for 16 highlighted sub groups in 2008 and 2009. Totals exclude 6 individuals in 2008 and 7 individuals in 2009 for whom location
(Region/Thunder Bay) was not known.