a seismotectonic zonation map of eastern siberia: new ... · a seismotectonic zonation map of...
TRANSCRIPT
Open Journal of Earthquake Research, 2015, 4, 115-125 Published Online November 2015 in SciRes. http://www.scirp.org/journal/ojer http://dx.doi.org/10.4236/ojer.2015.44011
How to cite this paper: Imaeva, L.P., Imaev, V.S., Smekalin, О.P. and Grib, N.N. (2015) A Seismotectonic Zonation Map of Eastern Siberia: New Principles and Methods of Mapping. Open Journal of Earthquake Research, 4, 115-125. http://dx.doi.org/10.4236/ojer.2015.44011
A Seismotectonic Zonation Map of Eastern Siberia: New Principles and Methods of Mapping L. P. Imaeva1, V. S. Imaev1,2, О. P. Smekalin1, N. N. Grib3 1Institute of the Earth’s Crust, Siberian Branch of RAS, Irkutsk, Russia 2Diamond and Precious Metals Geology Institute, Siberian Branch of RAS, Yakutsk, Russia 3Technical Institute (Branch) of North-Eastern Federal University, Neryungri, Russia
Received 21 September 2015; accepted 10 November 2015; published 13 November 2015
Copyright © 2015 by authors and Scientific Research Publishing Inc. This work is licensed under the Creative Commons Attribution International License (CC BY). http://creativecommons.org/licenses/by/4.0/
Abstract The paper reviews goals and objectives, stages and components of a seismotectonic study con-ducted in Eastern Siberia, Russia. Based on a comprehensive analysis of geological and geophysi-cal data, our study establishes whether the local earthquakes are of tectonic origin and reveals relationships among earthquakes with recent geodynamic processes in the area under study. Seismic hazard assessment and evaluation of tectonic processes are the two major closely inter-related aspects of seismotectonic studies. A seismotectonic study is generally combined with a seismic study and conducted prior to the stage of detailed seismic zonation (DSZ) which is fol-lowed by seismic micro-zonation (SMZ). In three stages of the seismotectonic study, we analyze specific geological structures, reveal the regional dynamics of seismotectonic processes, clarify details of potential seismic hazard locations and identify sites of the potential instantaneous de-formation of the crust which may take place due to active faulting. Based on results of our long- term studies, a seismotectonic zonation map of Eastern Siberia is compiled. The paper briefly re-views the methods of mapping and refers to data on active faults and neotectonic structures re-vealed in the area under study, which are closely related to regional earthquake sources.
Keywords Seismotectonic Studies, Seismic Hazard, Active Faults, Geological and Geomorphological Methods, Trenching, Seismic Source Zones, Seismic Belts, Seismic Belt Segments, Seismotectonic Zonation Map of Eastern Siberia
L. P. Imaeva et al.
116
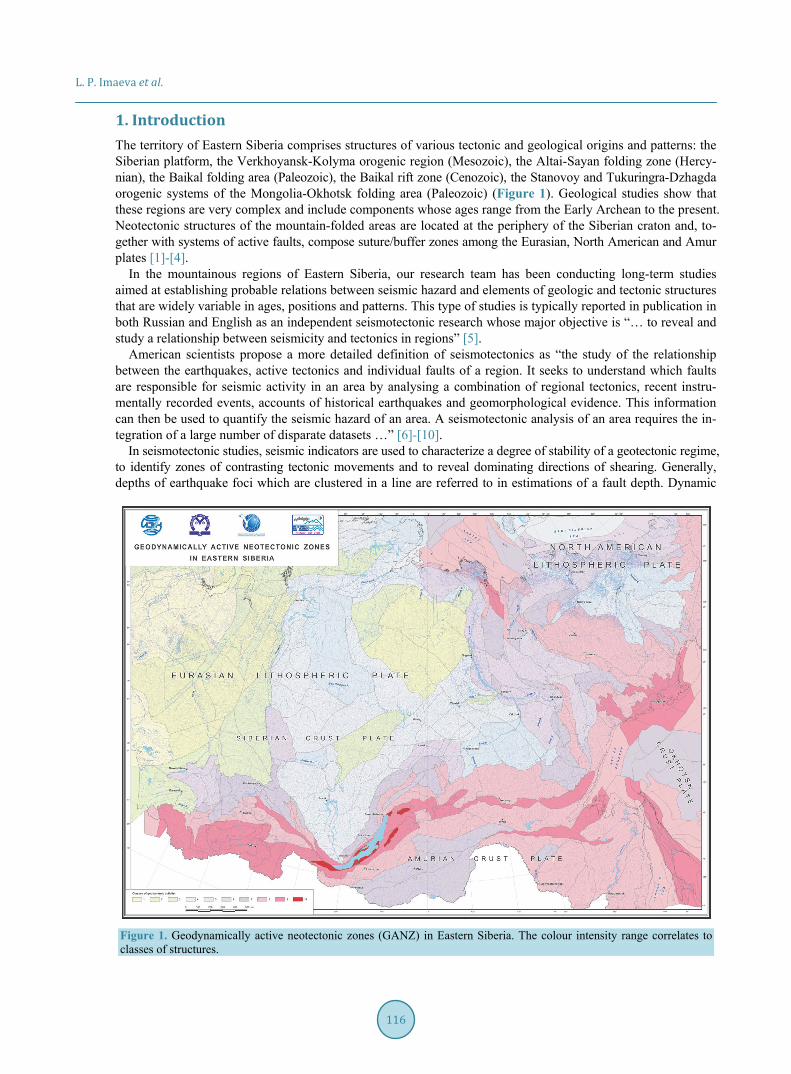
1. Introduction The territory of Eastern Siberia comprises structures of various tectonic and geological origins and patterns: the Siberian platform, the Verkhoyansk-Kolyma orogenic region (Mesozoic), the Altai-Sayan folding zone (Hercy-nian), the Baikal folding area (Paleozoic), the Baikal rift zone (Cenozoic), the Stanovoy and Tukuringra-Dzhagda orogenic systems of the Mongolia-Okhotsk folding area (Paleozoic) (Figure 1). Geological studies show that these regions are very complex and include components whose ages range from the Early Archean to the present. Neotectonic structures of the mountain-folded areas are located at the periphery of the Siberian craton and, to-gether with systems of active faults, compose suture/buffer zones among the Eurasian, North American and Amur plates [1]-[4].
In the mountainous regions of Eastern Siberia, our research team has been conducting long-term studies aimed at establishing probable relations between seismic hazard and elements of geologic and tectonic structures that are widely variable in ages, positions and patterns. This type of studies is typically reported in publication in both Russian and English as an independent seismotectonic research whose major objective is “… to reveal and study a relationship between seismicity and tectonics in regions” [5].
American scientists propose a more detailed definition of seismotectonics as “the study of the relationship between the earthquakes, active tectonics and individual faults of a region. It seeks to understand which faults are responsible for seismic activity in an area by analysing a combination of regional tectonics, recent instru-mentally recorded events, accounts of historical earthquakes and geomorphological evidence. This information can then be used to quantify the seismic hazard of an area. A seismotectonic analysis of an area requires the in-tegration of a large number of disparate datasets …” [6]-[10].
In seismotectonic studies, seismic indicators are used to characterize a degree of stability of a geotectonic regime, to identify zones of contrasting tectonic movements and to reveal dominating directions of shearing. Generally, depths of earthquake foci which are clustered in a line are referred to in estimations of a fault depth. Dynamic
Figure 1. Geodynamically active neotectonic zones (GANZ) in Eastern Siberia. The colour intensity range correlates to classes of structures.

L. P. Imaeva et al.
117
parameters of earthquake foci indicate values and directions of forces that cause strain and destruction of rocks. Traditionally, results of seismotectonic studies are presented in the form of seismotectonic maps showing neo-tectonic structures and earthquake source zones and providing a basis for establishing a relationship between the earthquakes and specific features of the tectonic/neotectonic setting of an area under study. Such a relationship is then referred to in forecasting of locations, strengths and repeat periods of earthquakes and also applied in seismic mapping [3] [11]-[15].
A success of seismotectonic studies is often jeopardized by the lack of a uniform approach as there are no clear regulations concerning the use of geological and geophysical characteristics. Moreover, seismic hazard as-sessments are often challenged if based only on instrumental measurements without any support by seismotec-tonic studies (that are mandatorily required by the current legislation). In this paper, we review our experiences of long-term seismotectonic studies conducted in seismically active areas of Yakutia, Altai, Sayan, Tuva regions and the Baikal rift zone. The use of selected geological and geophysical indicators is justified for constructing a seismotectonic zonation map of Eastern Siberia, and a mapping method is described. Similar to other studies of such type, the effectiveness and reliability of our seismotectonic studies are mainly ensured by the stage-by- stage methodology envisaging three stages.
2. Stages of Research Stage 1 is aimed at the source data collection for an area under study, including data on the geological setting, seismic regime, neotectonics, terrain history, deep structure, state of stresses and recent movements of the crust. The available earth remote sensing (ERS) data are deciphered. Thus, a regional seismotectonic data base is con-solidated.
In Stage 2, site-specific studies are conducted to address needs of engineering and design of industrial, com-mercial and municipal facilities. Field studies are conducted to reveal and analyze active faults. A combination of remote and direct field methods provides for the identification of active faults evidenced by topographic data and the presence of young sediments. Such faults and associated deformations are mapped, and fault types, am-plitudes and average displacement velocities are determined. Obviously, any reconstruction cannot be consi-dered adequate and reliable unless it is based on field studies and actual structural-geological and geomorpho-logical observations on the reconstructed site. Trenching is mandatory conducted across faults that are thought to be seismically active in order to detect potential cross-points and/or overlapping areas of the facilities and ac-tive faults.
Stage 3 (office and laboratory) includes general processing of the field data and information from relevant depository and published sources. The trenching data are analyzed to detect potential cross-points and/or over-lapping areas of the facilities and active faults. A seismotectonic model is constructed on the basis of the accu-mulated database with reference to the trenching data.
3. The Method and Objectives of Seismic Studies Seismic impacts shown in a seismotectonic model, i.e. a map showing zones of potential earthquake foci (PEF), are distinguished as background and concentrated seismicity. The background seismicity is shown by square areas called “domains”. The concentrated seismicity is shown by linear features, i.e. potential strong earthquake foci (termed as “seismic lineaments” in [16]. It is commonly accepted in the seismological practice that an ac-tive fault (i.e. a linear feature) is likely to become the source of another earthquake. A new criterion is proposed to denote “domain seismicity”—a geodynamically active neotectonic zone (GANZ) [17].
In terms of the system analysis, GANZ is an object in a specific location which main components generate multi-factor impacts in the crust and the upper mantle/lithosphere (crust-mantle variant) or in the lithosphere and the lower mantle (super-global variant). GANZ are classified into 10 groups distinguished by specific indicators, including the following; geodynamic setting in which geologic structures are formed; velocities (mm per year) of vertical and horizontal movements of the geological bodies, the latter estimated from GPS and geological- geomorphological data; amounts of plastic/plicative and faulting strain; directions of forces in tectonic fields; morphostructural types of endogenous topographic features of land and sea, and their heights and contrasts; and geophysical parameters, including values of heat flow and gravity fields, Moho depth, asthenosphere depth, and the upper and lower mantle thickness [17].
An example of a GANZ map for Eastern Siberia is shown in Figure 1. Geological and geophysical criteria of

L. P. Imaeva et al.
118
seismicity are now established by applying the modern GIS technologies. Software packages ArcView and Ar-cInfo, which have become available quite recently, allow us to easily show a specified information layer and improve our understanding of the pattern of its segments in space.
The need to analyze the recent Late Cenozoic (Late Pliocene—Quaternary) structure of the area under study is due to that fact that the recent tectonics is actually a framework incorporating active faults and other features manifesting the recent tectonic activity which are directly related to the regional seismicity. In Eastern Siberia, the GANZ pattern in plan demonstrates that the seismic activity is the highest at the southern boundary of the Siberian platform and in the Upper-Kolyma folded area at the north-eastern margin of the platform. Linearly striking structures are less evident in areas to the east of the platform than those along the southern boundary. Anyway, high GANZ values are typical of the entire area to the east of the Lena River, and some linearities are noted at the Sakhalin island. In the central Siberian platform, the seismic activity is present at low values yet not zero. This is obviously due to different regimes of the neotectonic development of the structures.
It should be noted that the Siberian researchers [1] [2] pioneered in integrated assessments of geodynamic ac-tivity in Asia and introduced an indicator termed as “geodynamic activity of the lithosphere in Asia” (GALA). This integral indicator is not regionally-specific. Later on, it was applied to assess the seismic hazard for some regions in Eurasia [18].
Forecasted earthquake magnitudes are the critical component for seismotectonic modelling. Maximum poten-tial magnitudes are estimated from a set of geological, geophysical, seismological and seismotectonic data for an area under study. Estimations of earthquake magnitudes from seismotectonic data are based on global statistical ratios between earthquake magnitudes, fault lengths and displacements along the faults [19] [20].
The most important deliverables of seismotectonic studies are a seismotectonic zonation map of the studied area and a PEF map in scales 1:1,000,000, 1:500,000 and 1:200,000, which are further developed into detailed seismic zonation (DSZ) maps. Such maps can provide a tool for solving the problem of seismic hazard assess-ment in areas allocated for specific industrial and municipal facilities. With application of the above-described approach, our practice shows that a number of sites classified as “high seismic hazard (M = 8 - 9)” may be re-duced in comparison with their number in general seismic zonation (GSZ) maps, and construction costs may be reduced accordingly. In other cases, previously unknown sources of seismic impacts may be discovered, and lo-cal seismic hazard levels will have to be increased against GSZ maps.
The stage-by-stage implementation of the studies is highly important. A decision to skip or shorten a stage, which seems like a time-saving idea, is not allowable – it always brings an adverse effect on results. Taking into account the fact that seismotectonic studies are very specific and require non-conventional approaches, it can be stated that such studies can be successfully conducted and yield reliable and useful data only if arranged with the involvement of specialized scientific organizations that can provide their qualified and experienced staff who can research traces of strong earthquakes.
The seismotectonic zonation principles envisage that the researchers will identify sites where very weak local earthquakes may be expected, and such seismic events will not put any impact on citizens and the life-supporting infrastructure, including municipal utilities. Such sites are considered as incapable of earthquake generation and subject only to seismic impacts from remote strong earthquakes. Other sites and areas that can generate earth-quakes in the crust are called zones of potential earthquake foci (PEF) and classified by maximum potential magnitude and repeat periods of earthquakes. PEF zones can be identified and assessed by analyzing combina-tions of seismological, geological and geophysical criteria.
Seismological data can be obtained from published earthquake catalogues that contain data on instrumentally recorded earthquakes, historical and Holocene paleo-seismic events revealed by geological and geo-archeo- logical data, as wells as instrumental macro-seismic indicators of the shock intensity scatter in case of percepti-ble seismic events, i.e. the basis for mapping. By studying earthquake foci patterns in plan, it becomes possible to assess seismic impacts, reveal source areas of strong earthquakes and thus clarify the geometry of PEF zones.
The map showing the scatter of earthquake epicentres in plan in Eastern Siberia (see Figure 1) is constructed on the basis of records by the regional divisions of RAS Geophysical Survey and SB RAS and data from pub-lished local earthquake catalogues that are available in the internet resources [4] [21].
The analysis of the earthquake scatter pattern in plan shows that the South-Siberian seismic belt is located at the southern boundary of the Siberian platform in the region where the Altai, Sayan and Tuva mountainous folded orogenic structures are developed. Seismic events are manifested in the Baikal rift zone, earthquake foci

L. P. Imaeva et al.
119
fields in the Olyokma-Stanovoy region and at the Okhotsk sea shore. The Arctic-Asian seismic belt is traced from the Laptev Sea shore across the Verkhoyano-Kolyma mountainous folded region and further to the south-east, where it is connected with seismic fields of the Okhotsk sea shore and the Kamchatka peninsula (Figure 2).
Information for mapping is also obtained by analyzing the data on mechanisms of strong earthquakes which gives grounds to reveal the state of stresses and strain in components and segments of geological and neotecton-ic structures. Focal mechanisms of earthquakes that took place in Eastern Siberia are shown in Figure 3. The focal mechanism solutions are consolidated from publications by other authors and the internet sources [22]- [29].
According to the earthquake scatter plots and solutions of the focal mechanisms, the recent seismicity tends to be manifested at the southern and eastern boundary of the Eurasian lithospheric plate, and the paleo-earthquakes are also grouped in the same lengthy seismic belts. In the state of crustal stresses and strain, horizontal compres-sion is dominant through the entire continental segments of the above-mentioned boundary (except the Baikal rift zone), and the Southern Siberian and Arctic-Asian seismic belts are fragmented into segments differing in geodynamic indicators.
On the basis of the geological and geophysical criteria of PEF zones, we identify active geological structures and constrain their parameters. A geological structure is considered active if earthquakes of a specified magni-tude and repeat period took place in it in the past and may be expected in the near future. Seismic hazard is as-sessed for each active geological structure. A PEF map is constructed on the basis of results of the detailed stu-dies of active faults and secondary effects of the paleo-earthquakes, seismotectonic and seismological data [3] [9] [15] [30], and this is actually a major target of the seismotectonic studies. Generally, active faults correlate with PEF zones, and quantitative analyses of fault maps and fault parameters can thus provide for establishing con-tours of PEF zones and preliminary ranking of the zones. Quantitative characteristics of a PEF zone, including a maximum expected magnitude, Mmax) and an earthquake repeat period, are mainly based on seismological data.
Figure 2. Earthquake epicentres in Eastern Siberia. The map is based on data consolidated by RAS Geophysical Survey and Siberian Branch of RAS, published records and data available in the internet resources [4] [21].

L. P. Imaeva et al.
120
Figure 3. Earthquake focal mechanisms map of Eastern Siberia.
Based on detailed studies of active faults, it is possible to get an idea of the structure of an earthquake source
and ancient, prehistoric seismic events that took place in the studied focal zones. In the geological medium, foci of strong and hazardous earthquakes are represented by stable structures (i.e. active faults) which positions are predetermined by geological and geophysical conditions, and their shearing kinematics may vary from one seismic event to another.
Typically, strong earthquake foci are manifested on the surface by a zone of seismic fractures. Its width may reach several hundred metres and even a few kilometres, depending on geological and geomorphological setting and an earthquake strength. Seismic fractures may occur on the surface in different segments of a fault zone, i.e. their positions may vary from one seismic event to another. Cumulative shearing due to an earthquake source may be dissipated and manifested by numerous fractures and associated deformation. Anyway, specific structur-al patterns typical of tectonic deformation features are generated at certain geological structure and topographic forms that were created by earlier seismic shifts. Ancient events are reflected in both the shearing of young se-diments and topographic forms and the development of ancient secondary discontinuities, i.e. paleoseismic dis-locations (PSD).
Two objectives of paleoseismological studies are important for practical applications and theoretical assump-tions: 1) Identify single-phase and approximately same-age paleoseismic dislocations, and constrain ages of pa-leo-earthquakes; 2) Determine morpho-kinetic types of active faults along which fault-generating paleo-earth- quakes took place [14] [31]-[33]. Based on our long-term studies, we have mapped active faults on the corres-ponding topographic map of Eastern Siberia and specified estimated potential magnitudes of earthquake that can be generated by such faults (Figure 4).
It is noteworthy that the active faults are abundant along the southern boundary of the Eurasian lithospheric plate in the region of its contract with the Amur (China) plate, and an active faulting belt is formed along the eastern boundary of the Eurasian plate within the limits of the Verkhoyansk-Kolyma folded system, i.e. at the western boundary of the North-American plate. As evidenced by the fault scatter in plan, large seismic linea-ments (that can generate the strongest earthquakes, М = 7.5 - 8.0) are found in the axial parts of the revealed

L. P. Imaeva et al.
121
Figure 4. Seismic lineaments map of Eastern Siberia. It shows potential earthquake magnitudes and the kinematics of shearing.
seismic belts and tend to be located in the most active parts of the geodynamically active neotectonic zones.
The seismotectonic zonation map and the development dynamics of earthquake-generating structures in East-ern Siberia.
Based on the available geological, geophysical, geomorphological and neotectonic data, the data on systems of the Late Cenozoic active faults, seismicity, and results of tectonophysical studies, the comprehensive analysis reveals a lengthy seismic belt in the southern regions of Eastern Siberia. It comprises several large segments, specifically the Altai-Sayan-Tuva segment, the Baikal rift zone, and the Olyokma-Stanovoy zone. These seg-ments reflect, respectively, the seismicity of shearing structures located in the Altai, Sayan and Tuva mountainous folded regions, extension structures of the Baikal rift zone, transpression shearing-thrusting structures of the Olyokma-Stanovoy zone, and the seismicity of the Okhotsk Sea. Another seismic belt called Arctic-Asian is traced along the boundary between the Eurasian and North-American lithospheric plates. It reflects the seismic-ity of the Arctic Ocean shore which is related to the crustal extension. Through the shearing-thrusting structures developed in the continental segments of the plate boundaries, it is connected to the seismogenic structures lo-cated on the shores of the Okhotsk Sea and Kamchatka peninsula.
Based on the consolidated seismotectonic and recent geodynamic data on the seismic belts located in the north-eastern regions of Asia, it becomes possible to forecast potential scenarios of the seismic activity, estimate a location and a maximum magnitude of a potential catastrophic earthquake, and predict the most hazardous di-rections of the seismic energy release. The knowledge of potential locations prone to seismic hazard can reduce the risks of allocating such areas for industrial, commercial and municipal facilities. We propose the seismotec-tonic zonation map of East Siberia which is actually the first multi-layered model constructed with the applica-tion of geoinformation technologies to show the development of seismotectonic processes taking place in the studied area (Figure 5).
The map also shows points of potential seismic shocks (MSK-64), which intensity levels correspond to those in the new general seismic zonation map of the Russian Federation (ОСР-2014-В; repeat period: 1000 years).

L. P. Imaeva et al.
122
Figure 5. Seismotectonic map of Eastern Siberia. Isolines show potential intensity of seismic events (MSK-64), which correspond to ОSR-2014-V Map (repeat period: 1000 years) with additions and amendments.
This information is sufficient for purposes of the industrial development of the mapped territory. However, it must be taken into account that the area covered by the map (especially regions of Yakutia) is a complicated, still poorly studied and undeveloped territory of Russia which is experiencing the deformation due to active in-teractions between several tectonic plates. Further detailed studies of the segments of the established seismic belts are obviously required. In such studies, special attention should be given to the East Siberian Arctic Shelf in view of strategic plans for the industrial development of Russia and milestones of the economic and social security of the Russian Federation.
4. Geodynamics The current geodynamic setting and seismicity of Eastern Siberia are determined by the interaction of the Eura-sian, North American and Amur plates, which takes place in buffer zones [1]-[4] [13]. Based on the comprehen-sive analysis of geological, geomorphological and neotectonic data, the information on fault systems that are ac-tive in the Late Cenozoic, seismicity data, and results of tectonophysical studies, it is established that there are two elongated seismic belts within the buffer zones—the South Siberian and the Arctic Asian ones—as an evi-dence of the connection between seismicity of the mountainous folded areas at the southern margin of the Sibe-rian craton and the Okhotsk sea and seismicity of the Arctic and Pacific oceans (see Figure 1). The belts formed due to the convergence of the large lithospheric plates and act as specific plate boundaries. The interaction be-tween continental segments of the plates is manifested in a wide (up to several hundred kilometers) elongated area wherein shearing takes place along activated faults.
Locations of the contemporaneous seismic belts give evidence of the presence of three large crustal plates— the Siberian, Amur and the Okhotsk ones—at the margins of the converging Eurasian and North American li-thospheric plates. The crustal plates are separated by active fault zones. By studying the kinematics of the en-semble of the crustal plates and blocks in Eastern Siberia, it is possible to convincingly reveal the cause-

L. P. Imaeva et al.
123
and-consequence relationships between geological, tectonic and seismic processes. In the South Siberian seismic belt, the dynamic systems of active faults and their kinematics can be explained by the convergent (in the NS direction) displacement of the Eurasian plate relative to the Amur plate. In the Altai—Sayan, Tukuringra- Dzhagda and Olyokma-Stanovoy segments of this belt, the seismic process takes place under compression, while extension is dominant in the Baikal rift. Left- and right-lateral shifting is typical of the western and eastern segments of the Olyokma-Stanovoy seismic zone, respectively. In this zone, thrusts accompany the shear faults and strike parallel to them. In the central part of the zone, there is a system of diagonal NE and NW right-lateral shear faults that form a “wedge” traceable to the north within the limits of the Aldan shield. Such dynamic sys-tems of active faults (i.e. parallel shear faults and thrusts) can be explained by the convergent displacement of the Eurasian plate relative to Aldan-Stanovoy block. As a result, the seismic process in the Olekma-Stanovoy zone takes place under compression. The above-mentioned regularities in the development of the active faults and neotectonic structures in the segments of the South Siberian seismic belt are revealed by detailed structural and geological observations, analyses of tectonic fractures, and processing of space images, aerial photos and topographic maps with the application of various morphometric techniques.
Studies in the continental part of the Arctic Asian seismic belt show that seismicity is currently determined by compression, which is evidenced by the domination of shear faults, upthrow shifts and thrusts. Another evidence is intensely dislocated Cenozoic sediments revealed by observations of rock fracturing and slickensides in active fault zones and analyses of cross-sections of sediments in the Cenozoic depressions and troughs [13] [25]. Aerial and satellite images and maps provided data for detecting the kinematics and strike of active faults in the Chersky seismotectonic zone that is bordered by sub-parallel thrusts. Shear faults are represented by an echelon system of “wings” that host the Cenozoic basins. Focal mechanisms of earthquakes also clearly indicate the predominance of horizontal compression.
Thus, the geodynamic regime vary along the interplate boundary that stretches from Greenland to Alaska and separates the North American plate from the Eurasian pale and Okhotsk sea—crustal expansion in the region of lithospheric plates divergence (the Gakkel Ridge); transitional regime manifested by the field of mixed tectonic stress (the Laptev sea shelf and coast, where the rotation pole of the North American and Eurasian plates is lo-cated); and sliding accompanied by left-lateral shifting due to the NE compression resulting from the oblique convergence of the plates (the Chersky seismotectonic zone).
A satisfactory explanation of the above-mentioned changes of the geodynamic setting from tensional to com-pressional can be provided in terms of global tectonics of the lithospheric plates, if it is assumed that the rotation pole of the Eurasian and North American plates is located near the Buor-Khaya Gulf (71.240˚N, 132.050˚E). If so, the neotectonic structures located to the north of the rotation pole should be currently expanding, and the structures to the south and south-east should be under compression. This model is consistent with the data col-lected by observations.
Based on results of our studies, the lateral zonation is established in the patterns of the tectonic stress fields— the axial parts of the seismic belts are subject to shear stresses, but towards the periphery shearing is replaced by reverse faulting, and the transpressional mechanism (i.e. compression with slip) causes the formation of seis-mogenic structures in the seismic belts. The fact that the fields of tectonic stresses are changed shows that the magnitude of interactions of the plates and blocks with each other is decreasing, and this suggests a specific “neutralization” of the level of seismic hazard.
5. Conclusions 1) The seismotectonic zonation map of Eastern Siberia is the first map in a new generation of maps based on
the electronic database of seismotectonic parameters. A mapped combination of geological, geophysical and seismic parameters allows the map user to clarify specific features of the recent geodynamics and, correspon-dingly, to identity seismic hazard sites in the studied territory.
2) Mapping based on the proposed approach ensures a transition to detailed seismic zonation mapping of dis-tricts in Eastern Siberia to address the needs of active industrial development and provide properly justified seismic hazard assessments for industries and local population of Siberia. This approach to mapping can initiate a new stage in studies of the problem of seismic safety. Regional seismogeodynamic models can facilitate a more precise definition of input/reference magnitudes for the general and detailed seismic zonation maps.
3) It is recommendable that district/regional government executive bodies, emergency response authorities

L. P. Imaeva et al.
124
and disaster preparedness committees should use the seismotectonic zonation map of Eastern Siberia to clarify potential seismic hazard magnitudes for settlements and towns and improve their awareness of potential nega-tive impacts of strong earthquakes.
Acknowledgements The study was supported by the Russian Science Foundation (Grant No. 15-17-20000) and partly the Ministry of Science and Education (Grant for State Task No. 5.1771.2014/K).
References [1] Logatchev, N.A., Sherman, S.I. and Levi, K.G. (1987) Recent Geodynamic Activity of the Lithosphere in Siberia in the
Cenozoic. Geology and Geophysics, 8, 3-10. (In Russian) [2] Logatchev, N.A., Sherman, S.I. and Levi, K.G. (1991) Geodynamic Activity of the Lithosphere in Asia: Bases for
Analysis and Principles of Mapping. In: Geodynamics and Development of Tectonosphere, Proceedings of ITC Tec-tonic Meeting, Moscow, 27-31 January 1991, 31-39. (In Russian)
[3] Imaev, V.S., Imaeva, L.P. and Koz’min, B.М. (2000) Seismotectonics of Yakutia. GEOS, Moscow, 227 p. (In Russian) [4] Mackey, K.G., Fujita, K., Hartse, H.E., et al. (2010) Seismicity Map of Eastern Russia (1910-2-10). Seismological Re-
search Letters, 81, 761-768. [5] Geological Dictionary (1973) Two Volumes. Nedra, Moscow, 986 p. (In Russian) [6] Tibaldi, A. and Mariotto, F.P. (2015) Structural Geology of Active Tectonic Areas and Volcanic Regions. Lulu Press,
Inc., Raleigh, 205 p. [7] Allen, C.R. (1975) Geological Criteria for Evaluating Seismicity. Geological Society of America Bulletin, 86, 1041-
1057. [8] Wallace, R.E. (1977) Profiles and Ages of Young Scarps, North-Central Nevada. Geological Society of America Bulle-
tin, 88, 1267-1281. [9] Yeats, R.S., Sieh, K. and Allen, C.R. (1997) The Geology of Earthquakes. Oxford University Press, Oxford, 568 p. [10] McCalpin, J.P. (2009) Paleoseismology. 2nd Edition, Academic Press, Amsterdam-London, 615 p. (International Se-
ries, 95) [11] Gorshkov, G.P. (1984) Regional Seismotectonics of the Southern Territory of the USSR. Alpine Belt. Nauka, Moscow,
272 p. (In Russian) [12] Nikolaev, V.V., Semenov, R.F., Semenova, V.G. and Solonenko, V.P. (1982) Seismotectonics, Volcanoes and Seismic
Zonation of the Stanovoy Ridge. Nauka, Novosibirsk, 150 p. (In Russian)
[13] Imaev, V.S., Imaeva, L.P. and Koz’min, B.М. (1990) Active Faults and Seismotectonics of North-Eastern Yakutia. Yakutia Scientific Centre, Siberian Branch of the USSR Academy of Sciences, Yakutsk, 138 p. (In Russian)
[14] Rogozhin, E.A. and Platonova, S.G. (2002) Focal Zones of Strong Earthquakes in Mountainous Altai in the Holocene. UIFE RAS, Moscow, 130 p. (In Russian)
[15] Rogozhin, E.A. (2012) Features of Regional Seismotectonics. IPE RAS, Moscow, 340 p. (In Russian) [16] Ulomov, V.I. and Shumilina, L.S. (1999) The Set of General Seismic Zonation Maps of the Territory of the Russian
Federation—ОSR-97. Scale 1:8,000,000. Explanatory Note. UIFE RAS, Moscow, 57 p. (In Russian) [17] Gusev, G.S. and Imaeva, L.P. (2014) Recent and Current Tectonic (Geodynamic) Activity of the Territory of Russia.
Subsoil Prospecting and Protection, 12, 23-29. (In Russian)
[18] Reisner, G.I., Ioganson, L.I., Reisner, M.G. and Baranov, Yu.Е. (1993) Typification of the Earth’s Crust and Recent Geological Processes. UIFE RAS, Moscow, 208 p. (In Russian)
[19] Strom, A.L. (1993) Comparison of Parameters of Recent and Paleoseismotectionic Structures. Physics of the Earth, 9, 38-42. (In Russian)
[20] Paleoseismology (2011) Two Volumes. Edited by J. P. McCalpin, Nauchny Mir, Moscow, 878 p. (In Russian) [21] http://zeus.wdcb.ru/wdcb/sep/hp/seismology.ru/cat_Obninsk.ru.shtml
[22] Koz’min, B.M. (1984) Seismic Belts of Yakutia and Earthquake Focal Mechanisms. Nauka, Moscow, 125 p. (In Rus-sian)
[23] Starovoit, O.E., Chepkunas, L.S. and Gabsatarova, I.P. (2003) Parameters of 27 September 2003 Earthquake in Altai According to Instrumental Data. Vestnik, Earth Sciences Division RAN, 1, 1-12. (In Russian)

L. P. Imaeva et al.
125
[24] Mel’nikova, V.I. (2008) Crustal Deformation Parameters of the Baikal Rift Zone from Seismological Data. Synopsis of the Ph.D. Thesis, Irkutsk, IZK RAN, 38 p. (In Russian)
[25] Imaeva, L.P., Imaev, V.S. and Koz’min, B.M. (2011) Seismotectonic Analysis of the Yana-Indigirka Segment of the Chersky Zone. Physics of the Earth, 12, 23-36. (In Russian)
[26] Emanov, A.F., Emanov, A.A., Leskova, E.V., Seleznev, V.S. and Filina, A.G. (2012) Earthquake in Tuva (27 Decem-ber 2011, ML = 6.7) and Its Aftershocks. Vestnik, Earth Sciences Division RAS4, NZ2002. (In Russian)
[27] Radziminovich, Y.B., Mel’nikova, V.I., Seredkina, A.I., Radziminovich, N.A., Gileva, N.A. and Papkova, A.A. (2012) The Balei Earthquake of 6 January 2006 (Mw = 4.5): A rare Case of Seismic Activity in Eastern Transbaikalia. Russian Geology and Geophysics, 53, 1430-1444. (In Russian)
[28] Imaeva, L.P., Koz’min, B.M., Imaev, V.S. and Mackey, K.G. (2015) Structural Dynamic Analysis of the Epicentral Zone of the Ilin-Tas Earthquake (Feb 14, 2013, Ms = 6.9). Journal of Seismology, 19, 341-353. http://dx.doi.org/10.1007/s10950-014-9469-5
[29] http://earthquake.usgs.gov/earthquakes/map/ [30] Trifonov, V.G., Kozhurin, A.I. and Lukina, N.V. (1993) Studies and Mapping of Active Faults. In: Seismicity and
Seismic Zonation of North Eurasia, Vol. 1, UIFE RAS, Moscow, 196-206. (In Russian) [31] Solonenko, et al. (1977) Seismic Zoning of East Siberian and Its Geologic and Geophysical Base. Nauka, Novosibirsk,
302 p. (In Russian) [32] Arzhannikov, S.G. (2000) Paleoseismic Dislocations in the Ottugtaiginsk-Azassky Fault Zone (Eastern Tuva). Russian
Geology and Geophysics, 41, 1499-1504. (In Russian) [33] Smekalin, О.P., Imaev, V.S. and Chipizubov, А.V. (2011) Paleoseismology of Eastern Siberia (Applied Practice). IEC
SB RAS, Irkutsk, 99 p. (In Russian)