a spreadsheet approach to facilitate visualization of...
TRANSCRIPT

1
A Spreadsheet Approach to Facilitate Visualizationof Uncertainty in Information
Alexander Streit, Binh Pham, Ross Brown
Abstract—Information uncertainty is inherent in manyproblems and is often subtle and complicated to un-derstand. While visualization is a powerful means forexploring and understanding information, informationuncertainty visualization is ad hoc and not widespread.This paper identifies two main barriers to the uptake ofinformation uncertainty visualization: firstly, the difficultyof modeling and propagating the uncertainty information;and secondly, the difficulty of mapping uncertainty tovisual elements.
To overcome these barriers, we extend the spreadsheetparadigm to encapsulate uncertainty details within cells.This creates an inherent awareness of the uncertaintyassociated with each variable. The spreadsheet can hidethe uncertainty details, enabling the user to think simplyin terms of variables. Furthermore, the system can aid withautomated propagation of uncertainty information, since itis intrinsically aware of the uncertainty. The system alsoenables mapping the encapsulated uncertainty to visualelements via the formula language and a visualization sheet.Support for such low-level visual mapping provides flexibil-ity to explore new techniques for information uncertaintyvisualization.
Index Terms—Uncertainty Visualization, InformationUncertainty, Fuzzy Visualization, Visualization Process,Visualization Framework, Information Modeling
I. INTRODUCTION
INFORMATION UNCERTAINTY is present in manyfields and numerous modeling techniques exist to
manage this uncertainty. Using information uncertaintymodeling techniques not only provides greater confi-dence in results, but can also give an indication of howmuch confidence to place in the result. Visualization is apowerful tool for exploring and understanding informa-tion. However, when it comes to visualizing informationwith uncertainty, too often the information is treated asthough it were entirely certain, thus discarding valuableknowledge.
The term uncertainty has broad meaning and canrelate to numerous aspects of uncertainty, for some
The authors are with the Faculty of Information Technol-ogy at the Queensland University of Technology, Australia.Email: [email protected], [email protected], [email protected]
examples see [16]. This paper deals with uncertaintyabout the true value of information, which we refer toas information uncertainty. Such uncertainties arise dueto predictions, errors or imprecision in measurement,linguistic ambiguity or vagueness, lacking or insufficientinformation, and similar sources. The common theme isthat the uncertainty can be characterized for a particularunit of information.
Despite ongoing research into information uncertaintyvisualization methods (e.g. [5], [6], [11], [19]), in-formation uncertainty visualization has failed to gainwidespread acceptance. Barriers to the uptake of infor-mation uncertainty visualization include an artificial sep-aration between modeling of information and its uncer-tainty, and the need for non-standard display techniques.This combination often results in ad hoc visualizations.From a practical point of view, the tools that usersemploy are not conducive to uncertainty modeling andvisualization, which results in a tendency by users toignore uncertainty for visualization.
To overcome these barriers, we present a visualizationsystem based on a spreadsheet paradigm that inherentlysupports modeling, propagation, and visualization ofinformation uncertainty. Facilitating this system requiresthe integration of uncertainty modeling techniques intoa hierarchical order, encapsulation of uncertainty param-eters in highly cohesive polymorphic data types, andaccess to a sufficiently general form of uncertainty whenmapping to visual elements. Spreadsheets are ubiquitous,intuitive, and offer several other advantages, such asimmediate feedback when changes are made.
The significance of our spreadsheet approach is four-fold. Firstly, our spreadsheet does not require additionalcells to hold uncertainty details when they are added,which prevents the complexity of the spreadsheet layoutfrom spiraling out of control. Secondly, adding uncer-tainty information does not change spreadsheet layout,hence the user’s model is represented identically to amodel without uncertainty details. Thirdly, the user’sformulae remain unchanged, which makes them easierto read and understand, and not specific to any particu-lar uncertainty modeling type. Fourthly, abstracting themapping of uncertainty information to visual elements
Digital Object Indentifier 10.1109/TVCG.2007.70426 1077-2626/$25.00 © 2007 IEEE
IEEE TRANSACTIONS ON VISUALIZATION AND COMPUTER GRAPHICSThis article has been accepted for publication in a future issue of this journal, but has not been fully edited. Content may change prior to final publication.

2
allows the user to change uncertainty information in themodel without destroying the visualizations that dependon the model.
This paper is organized as follows. Section 2 re-views related work on spreadsheets and visualization.Section 3 discusses issues facing users when they seekto visualize information uncertainty, drawing out desiredcharacteristics of solutions motivating our work. Section4 describes encapsulating uncertainty within information,such that the semantics of the parameters and propaga-tion of the uncertainty is given structural support, aswell as proposing a general uncertainty form for usewith visualization. Section 5 details the motivation anddesign for a spreadsheet-based integrated modeling andvisualization system and presents capabilities of such anapproach. Section 6 uses a case study in financial model-ing to demonstrate the new framework’s improvementsin accessibility, power, and visualization sophisticationover traditional approaches.
II. RELATED WORK
The spreadsheet paradigm widely understood for man-aging numerical information, prompting researchers toexplore other uses. An early proposal to generalizespreadsheets is the Analytical Spreadsheet Package [21](ASP), which allowed any Smalltalk-80 object to beplaced inside a cell and used Smalltalk messages asformulae. While this provides flexibility, it is too generaland complicated for non-expert users to understand.However, ASP did anticipate many of the uses exploredby works that followed, such as widgets, which areavailable in Spreadsheets for Images [15] (SI). SI extendstraditional spreadsheets to include graphical objects, in-cluding several different widgets and images. Further,SI takes the unusual step of allowing formulae to writetheir results to a different cell. While this offers flowcontrol, it can complicate the user’s interpretation of thespreadsheet.
FINESSE [27] specifically targeted real-time financialinformation, adding images, heat maps, and graphs tothe regular cell types. FINESSE introduced “presentationrelationships”, where groups of cells have access tocommon presentation attributes. This provides for sharedmemory that is not shown in a cell. However, othersystems (including SI) achieve a similar effect by storingpresentation attributes in cells.
The Spreadsheet for Information Visualization[7], [8](SIV) explored more general visualization, building onthe Visualization Toolkit [24] (VTK). Each cell in SIVcan contain a visualization, including the data sets usedto drive the visualization. Visualization related operators
are available and can operate on multiple cells, suchas a whole column. SIV is motivated by the ability tocompare visualizations side-by-side, particularly to seeincremental changes, which is often referred to as “smallmultiples” after [25, pp. 67]. Further, a key advantage ofspreadsheets is to use templates for analysis and exper-imentation. While suited to visualization tasks, SIV isnot particularly suited to modeling as it is optimized forfewer cells containing larger datasets and has dispensedwith traditional text and numerical cells.
VisTrails [1], [3] specifically uses a spreadsheet fordisplaying multiple visualizations for side-by-side explo-ration. In this sense the term spreadsheet refers to thetabular appearance rather than any ability to create for-mula driven relationships. Similarly, tabular visualizationmethods, such as Hyperslice [26] and TableLens [22],share some similarity to spreadsheets. However, tradi-tional spreadsheets are sparse, allow a mix of cells, andoffer inter-cell dependencies through formulae. Theseproperties lend to a paper-likeness that separates spread-sheets from tabular displays.
Prior work on uncertainty visualization frameworksincludes the multi-agent framework for supporting visu-alization of fuzzy systems [20]. This framework consistsof multiple agents that coordinate to deliver appropriateoptions to the user, with the aim of being context-sensitive and relevant. Our framework aims to providean environment conducive to modeling and visualiza-tion of information uncertainty and provides users withflexibility when it comes to visual mappings. However,the two are not mutually exclusive and the multi-agentapproach could be incorporated in the visualization sys-tem component of our framework. The profile agent ofthe multi-agent framework learns user preferences totune the options that are displayed to the user. Thisis similar to [10], which details a formal notation andcalculus for visualization exploration. Both of these areintended to improve visualization workflow and could beintegrated into the framework described here, howeverthis is beyond the scope of this paper.
III. ISSUES IN INFORMATION UNCERTAINTY
VISUALIZATION
This section examines the issues that confront userswhen they seek to visualize information uncertainty.At present, information uncertainty visualization is non-trivial and requires the user to have both a comprehensiveunderstanding of uncertainty as well as sophisticationwith visualization tools.
IEEE TRANSACTIONS ON VISUALIZATION AND COMPUTER GRAPHICSThis article has been accepted for publication in a future issue of this journal, but has not been fully edited. Content may change prior to final publication.

3
A. Sensemaking/Visualization
Visualization is “the bringing out of meaning in in-formation” [12]. It is performed iteratively and usuallyas part of the sensemaking cycle [4], [23]. The iterativelooping is not exclusive to mapping data into visualform; instead, users sometimes return to the data modelto gather or transform data. This is particularly true forinformation uncertainty. For example: uncertainty detailscan be deemed to be more important later, once thebasic model is in place; or the uncertainty details maychange as more becomes known about the variables.Therefore, frameworks for information uncertainty vi-sualization should ideally allow the user to go back tomake changes with minimal effort.
B. Visualizing Information Uncertainty
Flexibility: Visualization of information uncertaintyis different to visualizing other forms of information fortwo main reasons. Firstly, information uncertainty is as-sociated with a particular unit of information. This meansthat the uncertainty cannot be freely visualized withoutregard to its interpretation relative to the informationto which it belongs. Secondly, information uncertaintyis usually mapped differently to visual elements. Forexample, uncertainty is commonly mapped to intrinsicproperties, such as transparency or color; or by adding adimension to geometry, such as using a surface wherethere would otherwise be a line. Therefore, a visual-ization system for information uncertainty requires theflexibility in mapping uncertainty to visual elements,including intrinsic properties and changed geometry.
Figure 1 demonstrates how information uncertaintyis associated with information, but typically mappeddifferently to visual elements. Four graph visualizationsof historical and predicted employment rates in Califor-nia are shown. The first graph (a) assumes that growthwill continue at the average growth rate of the past 15years and is therefore visualized using traditional means.While the information in graph (a) is modeled as notbeing subject to uncertainty, it requires the unreliableassumption about employment rates to be made. Thegraph in (b) estimates that the growth will continue at theaverage rate. The fact that the predictions are estimates isindicated by the line stippling, an intrinsic property of theline. The graph in (c) shows the possible range within themaximum and minimum growth rates experienced in thepast 15 years. The uncertainty is indicated by extendingthe one dimensional line into a two dimensional polygon.The graph in (d) uses a normal distribution centered onthe average growth rate. The uncertainty is indicated by
both extending the dimensionality of the line as wellmapping to the intrinsic property of opacity.
Homogeneous Access: To enable the visual mappingsthat expose the uncertainty in variables, it is neces-sary to have access to the associated uncertainty de-tails. However, there are numerous uncertainty modelingtechniques that use different methods for encoding theuncertainty. This creates a barrier to visualizing uncertaininformation because visual mappings that work withone uncertainty modeling technique may not work foranother. Such inconsistency creates a strong dependencybetween visualizations and the data types used in themodel, limiting the user’s ability to update the model.Therefore, a generalized means for accessing informationuncertainty information should be sought to enable aconsistent environment information uncertainty visual-ization.
C. Declaring and Managing Information Uncertainty
Model Rigidity: The declaration of the informationuncertainty should be co-located with the informationto which it relates, since the two are fundamentallyconnected. However, this relationship is neglected inmost environments, which instead require the user todeclare the parameters of the uncertainty separately fromthe variable. This results in an added layer of complexityand the user is faced with an increasingly intricate datamodel.
Adding uncertainty information to a data model allowsthe user to specify a greater level of detail about themodel. However, changing the uncertainty modelingtechnique typically requires the user to reconstruct theaffected portion data model, often involving a fundamen-tal change in form. This makes the data model rigidand, as a consequence, the user will typically need toanticipate their use of uncertainty and build their modelaccordingly. This poses a limitation for uncertainty vi-sualization, limiting the workflow loop where the userupdates the model in response to visualization.
Separation of Parameters: Furthermore, the stronglyrelated parameters of the uncertainty modeling techniqueare often treated as separate variables. For example,rather than declaring a variable as being modeled us-ing a probability, many environments require separatevariables for mean and variance. This is akin to useof the “go-to” directive before the advent of structuredprogramming, because the burden is upon the user totreat these variables as being connected. This separationhas two significant ramifications: firstly, it is easier tointroduce errors since the environment does not enforceany semantic properties of the uncertainty parameters;
IEEE TRANSACTIONS ON VISUALIZATION AND COMPUTER GRAPHICSThis article has been accepted for publication in a future issue of this journal, but has not been fully edited. Content may change prior to final publication.

4
(a)
(b)
(c)
(d)
Figure 1. Visualizations of Employment Numbers in California.Years 2005-2010 are predicted. (a) Assuming Average Growth (b) In-dicating Growth is Estimated (c) Possible Growth (d) Likely Growth.(Data Source: California Employment Development Department)
and secondly, the introduced complexity discouragesusers from using uncertainty modeling techniques, limit-ing the information available for visualization. Therefore,the uncertainty parameters should be treated as part of aunit and the system should enforce the semantics of theparameters.
Propagation of Uncertainty: Since it is usually up tothe user to manage and interpret uncertainty parameters,the use of information uncertainty therefore requires theuser to have a mathematical understanding of modelingtechniques, not only when declaring the uncertainty, butalso for the subsequent propagation of that uncertainty.It would therefore be ideal if the system can track theuncertainty with the variable to which it applies andmanage propagation of the uncertainty whenever thatvariable is used.
IV. ENCAPSULATING UNCERTAINTY IN
INFORMATION
The previous section described a number of uncer-tainty modeling and management issues that users facewhen they seek to visualize information uncertainty.This section seeks to overcome these issues through theuse of a highly cohesive polymorphic1 data model thatencapsulates the uncertainty within the variable. Thisapproach has three significant advantages: firstly, theuncertainty models become polymorphic, allowing theuser to think in terms of variables and not their modelingtechniques, thus reducing model rigidity; secondly, itprovides structural support for dealing with parametersof the uncertainty as a unit, thereby allowing automaticpropagation of uncertainty and avoiding common errorsthat arise when related parameters are separated; andthirdly, it integrates information uncertainty modelingtechniques into a consistent framework, allowing homo-geneous access for mapping uncertainty into visual form.
A. Levels of Uncertainty Detail
There are numerous modeling techniques for describ-ing information uncertainty. Interested readers are di-rected to [14] for mathematical foundations that aimtoward a general theory of information. We place thesemodeling techniques into one of five general categories:estimate, where the value is not guaranteed to be thetrue value; non-specificity, where the true value is knownto be one of a set of values; probability, where thelikelihood of the true value is known; membership, where
1highly cohesive refers to inseparability of uncertainty parameters;polymorphic refers to the definition covering different data types
IEEE TRANSACTIONS ON VISUALIZATION AND COMPUTER GRAPHICSThis article has been accepted for publication in a future issue of this journal, but has not been fully edited. Content may change prior to final publication.

5
Graph Growth Rate Known / Assumed
(a) 0.147 it is certainly 0.147(b) 0.147, estimated = true it is not necessarily 0.147(c) [−0.3, 0.6] it is between -0.3 and 0.6(d) μ = 0.147, σ = 0.1 it is probably 0.147
Table IPREDICTED GROWTH RATES USED IN FIGURE 1
the degree of membership2 within a group or label isknown; and belief, where the believability of values isknown. Two additional categories are required for com-pleteness: absolute certainty, which covers values wherethere is no uncertainty; and uncertainty ignorance, whichis the degenerate case where uncertainty is unknown orignored.
Information uncertainty modeling is a way of improv-ing fidelity of the model. By adding information aboutthe uncertainty of a variable, the user is increasing thelevel of knowledge about that variable. Consider thefuture employment growth rates used in Figure 1, whichare shown in Table I. With each graph, more informationis shown about the future employment rates. The valueused in graph (a) is ignorant of potential for variance inthe predicted growth, implying its value to be certain. Ingraph (b), it is known that the value is only an estimate,which is additional knowledge that was not availablein graph (a). Graph (c) adds further information: it iscertain that the value will be within the bounds. Graph(d) adds even more information, the degree of certaintyabout what the actual growth value will be.
We further group the modeling techniques accordingto their level of uncertainty detail (see Figure 2): thetop tier being the crisp strata; the middle tier beingthe bounded strata; and the lower tier being the explicitstrata. Crisp modeling techniques describe a single value,to the exclusion of alternatives. Estimates belong inthe crisp strata, because estimates represent values thatare treated as though they were the true value: noinformation about the uncertainty is known other than itsexistence. In the bounded strata, the modeling techniquesencode the boundaries between what is possible and whatis not. For example, the accuracy of a measurementdevice can be specified as ±10 units. This means thatit is certain that the measurement is within ±10 units(assuming the device is working correctly), however,nothing is stated about the degree of certainty of thepossible values: it is not stated that +1 is more or lesscertain than +2. The explicit strata contains modeling
2Although standard sets use the term “membership”, they do notemploy a notion of partial membership and are thus part of the non-specificity category.
crisp
bounded
explicit
estimate
non-specificity
probability membership belief
increasinguncertainty
detail
uncertainty ignorance
absolute certainty
Figure 2. The information uncertainty modeling techniques sortedinto three strata
techniques that explicitly state the degree of certainty ofall candidate values. For example, it is more certain thatthe predicted employment growth rate in California willbe 0.147 than -0.3.
Each strata provides increasing detail about the un-certainty over the previous one. As the user refines theirmodel, they can progress downward along the strata withthe addition of more information. Thus, as the modelis refined, a variable may begin as an estimate, then berefined to an interval once the extents are known, then berefined further into a probability distribution as the fulllikelihood becomes known. This refinement is impliedby the arrows in Figure 2. The reverse operation is alsopossible where, by removing information, the variablecan be modeled using a technique that is further backup the level of detail tree.
B. Information Uncertainty Conversion and Propagation
To support the concept of refinement, conversion op-erators are necessary to convert from one modeling tech-nique to another. Conversion operators are normally sub-ject to the uncertainty invariance principle [14], whichrequires that the level of uncertainty remain unchangedafter conversion. We use the term promotion to referto conversions that increase the level of uncertaintydetail and demotion for decreasing the level of detail.The specific implementation of conversion operators willdepend on the user’s mathematical requirements andthere is no single correct choice. For example, a commoninterpretation when promoting a non-specific uncertaintyvalue to a probability is to assign each possible value anequal probability [13]. However, the user may wish totake an alternative approach and instead create a normaldistribution.
For every variable there exists a demotion that pro-duces a crisp value. We term this crisp value the rep-resentative value for that variable. For example, in thecase of probabilities, the representative value can beone of the most likely values, the mean, or any otheroperator that suits the purpose of the user. The intentionof the representative value is to provide a value that
IEEE TRANSACTIONS ON VISUALIZATION AND COMPUTER GRAPHICSThis article has been accepted for publication in a future issue of this journal, but has not been fully edited. Content may change prior to final publication.

6
the user considers a reasonable estimate. The user willassociate this value with the variable when details of theuncertainty are hidden from view.
Once a variable has associated uncertainty informa-tion, the uncertainty is propagated through subsequentoperations upon that variable. In order for variables tocorrectly interact, either the user has chosen a mathe-matical model that defines the semantics of the opera-tion for the combination of their associated uncertaintymodels (e.g. [14], [18], [28]), or the uncertainties arefirst converted into compatible forms. Which conversionsare performed depend upon the needs of the user. Forexample, consider the following operation C = A + B,where A is an interval and B is a probability. Theuser might prefer to make minimal assumptions, whereB would be demoted to an interval; or the user maywish to maximize uncertainty detail, where A would bepromoted to a probability using default rules.
C. A Visualizable Form of Information Uncertainty
There are numerous ways to model information un-certainty, some of which are discrete and others that arecontinuous. Such a heterogeneous environment can makevisualization tools excessively complicated. It wouldtherefore be beneficial to have a generalized form fordescribing uncertainty that can be used when mappinguncertainty to visual features.
Our approach is inspired by the description of fuzzysets, using the membership function μ, as a generalizedform of crisp sets (e.g. [18]). A fuzzy set is defined usingmembership function μ: δ = μ(v) where δ is the levelof membership ranging from 0 (definitely not a member)to 1 (definitely a member) and v is the candidate value.Thus the candidate value 28 is half in the fuzzy set long
if long(28) = 0.5. This method of definition can beapplied to crisp sets, for example the set A can be definedby:
δ =
{1 v ∈ A
0 otherwise
We expand this reasoning to other uncertainty model-ing types. However, we choose to replace the symbol formembership to avoid confusion. Thus the visualizationaccessible form of information uncertainty is a function:
δ = f(v)
where δ is the degree of certainty ranging from 0 to 1, v
is the candidate value, and f() is the degree of certaintyfunction. Traditional numbers can be considered to bea special type of uncertainty modeling technique: the
technique specifying total certainty. The constant c isdescribed by the following uncertainty function:
δ =
{1 v = 20 otherwise
We choose δ = 0 to indicate impossibility. The truemeaning of δ varies with the type of uncertainty beingmodeled. For non-specificity types, δ is either 0 (notpossible) or 1 (possible). For membership methods, δ
ranges from 0 (definitely not a member) to 1 (definitelya member). For probabilities and belief, δ ranges from0 (impossible) to 1 (certainly).
Some visualizations are intended to compare the val-ues of δwith each other. Depending on the uncertaintyof the variable in question, the range of δ can vary. Inthese circumstances it is desirable to normalize δ suchthat min(δ) = 0 and max(δ) = 1.
The visualization system can focus on providingmeans for mapping a range of [0..1] to visual elements,rather than providing methods specific to each type ofmodeling technique. The next section describes such aninformation uncertainty visualization system based ona spreadsheet paradigm. f(v) is provided as a specialoperator in the spreadsheet formula language, giving readonly access to the uncertainty.
V. SPREADSHEET SYSTEM FOR INFORMATION
UNCERTAINTY VISUALIZATION
This section describes an integrated visualizationand modeling system design that uses a spreadsheetparadigm. This integrates the modeling and visualizationtasks, allowing a tight feedback loop between visualinspection and data model building.
The relationship between spreadsheets and other ap-proaches can be illustrated using a formal definition forspreadsheets that consists of four components [9]: theschema, a definition of the spreadsheet logic; the data,which are the instance values for this spreadsheet; theeditorial, which consists of headings, borders, etc.; andbinding, which is the mapping of the content to thetabular structure of cells. It is the binding property thatis responsible for the tabular layout of a spreadsheet.The binding could be replaced by a mapping of data tomember variables and the editorial could be converted tocomments, thereby allowing implementation of the samefunctionality using a traditional programming language.
The spreadsheet paradigm allows a great amount offreedom for users to organize their information. Thefreedom to quickly perform experimental calculationsthat do not have to be integrated with the rest of themodel is of benefit to users. However, the drawback of
IEEE TRANSACTIONS ON VISUALIZATION AND COMPUTER GRAPHICSThis article has been accepted for publication in a future issue of this journal, but has not been fully edited. Content may change prior to final publication.

7
this freedom is that spreadsheets can be error prone. Thefact that spreadsheets are so widespread and yet capableof errors has motivated much research into spreadsheettesting methods [2], [17], particularly where spreadsheetsare used for financial decisions. Further discussion oferror reduction strategies is beyond the scope of thispaper.
The terminology used in this section is as follows.The spreadsheet matrix is made up of sheets. A sheetis a heterogeneous sparse two-dimensional grid of cells.Sheets are also theoretically infinite, but practically con-strained due to resource limitations. Their heterogeneityrefers to the ability to have cells of different typeswithin the same sheet. A cell is an addressable locationthat contains a unit of information. We use the termuncertainty spreadsheet to refer to any spreadsheet thatincludes information uncertainty.
A. Motivation for Our Approach
Our approach integrates both the visualization andmodeling tools into a single system. Spreadsheets areideal for this because they are interruptible, widelyunderstood, and in a constantly running state. The in-terruptible characteristic allows the user to move to an-other location in the spreadsheet to experiment, withoutinterfering with their main task. They are widely under-stood by users because spreadsheet use is ubiquitous,especially in the financial modeling field. Finally, unlikescripts that must be run before they produce results, aspreadsheet is constantly in an up-to-date state, allowingit to be easily interrogated and refined.
To support the needs of visualizing information uncer-tainty, the system must provide flexibility for mappinguncertainty information to visual elements. The formulaconstruct of spreadsheets is both expressive and power-ful, and is easily extended to enable access to uncertaintyinformation. Thus, the spreadsheet formula presents anideal mapping method.
There exist numerous information uncertainty model-ing techniques and multiple mathematical models for thepropagation of these uncertainties. Therefore we use aplug-in based architecture to allow new uncertainty datatypes and propagation models to be added to the sys-tem. Additionally, new visual elements can be providedthrough the plug-in system, since new display techniquescontinue to be developed.
B. Design of the Spreadsheet Software
The goal of this software is to directly support uncer-tainty information within spreadsheet cells, in a managedand extensible way. The process for construction of a
Plug-in Modules
Spreadsheet Matrix
Core
Uncertainty
DependencyTree
VisualizationSystem
Kernel
FunctionTables
Figure 3. Diagram of the System Components
spreadsheet using the software is described in later inSection V-D.
Figure 3 shows the main components of the spread-sheet software, which is designed to be modular. Thekernel provides the interface between the components.The spreadsheet matrix is a collection of sheets andcells that the user interacts with, containing all theinformation that is required for persistent storage. Thedependency tree is used to update appropriate cellswhen changes are made. The function tables providean index to functions that are invoked in formulae,and are necessary to enable uncertainty propagation andconversion. The visualization system is a scenegraph-based graphics display system that maps data storedin the spreadsheet matrix to visual elements. The coreplug-in adds basic spreadsheet functionality, includingstring, number, and formula cell types; the uncertaintyplug-in extends the traditional types to include estimates,intervals, and normal probabilities.
The user navigates the spreadsheet matrix and entersinput to be placed in the cells. The input takes the formof a string, for which there is an edit field at the topof the screen. Once the input has been submitted bythe user, each plug-in is queried to determine whichshould handle the string. If none match then it is a stringtype. The string is parsed by the appropriate plug-in,which generates and returns a cell object. For example,the string “10+-2” will be processed by the intervalcomponent of the uncertainty plug-in to produce aninterval of 10 ± 2. The resulting cell object is insertedinto the current sheet at the current cursor location.
Formulae are identified by a leading equals symbol.The remainder of the string is parsed and convertedinto a sequence of function calls, with infix operators(e.g. “+”) being converted into function names (e.g.“add”). The function tables are used to invoke the ap-propriate function handler for the parameter types. Plug-
IEEE TRANSACTIONS ON VISUALIZATION AND COMPUTER GRAPHICSThis article has been accepted for publication in a future issue of this journal, but has not been fully edited. Content may change prior to final publication.

8
ins register function handlers with a {function name,parameter types} signature. Propagation of uncertaintyis managed by using multiple handlers for the samefunction name, but with different parameter type combi-nations. For example, interval addition can be used whenboth parameters to the add function are intervals. Themathematical model for managing the propagation ofuncertainty is user selectable, as different domains mayhave different propagation requirements: when more thanone function handler is defined for the same signature,the user can choose which one is active.
To handle operations between different types of uncer-tainty, an appropriate function handler must be definedfor the parameter types. Our prototype system usesfunction handlers that promote parameters to the higherlevel of detail parameter type. For example, addition ofestimates and intervals result in intervals.
The use of formulae creates functional relations be-tween cells and it is from these relations that the de-pendency tree is built. The dependency tree lists thecells that directly depend upon a particular cell. Therecannot be any circular references as this would createrace conditions. When a user completes updating anexisting cell, the system recalculates any affected cells.Affected cells are determined by walking the dependencytree, starting with the current node. If the current nodeis not a member of the dependency tree then no othercells need updating.
Typical spreadsheet languages contains basic operators(such as addition, subtraction, multiplication, and divi-sion) and usually a wealth of commonly used functions(such as statistical and financial functions). To supportinformation uncertainty, the language needs to be ex-tended to allow access to the underlying uncertaintyinformation. Two categories of new functions are added.The first category contains the conversion operators,which convert from one type of uncertainty model toanother. The second category involves interrogation ofthe uncertainty details, which is intended to be usedfor mapping to visual elements. This second categorymakes use of the visualizable uncertainty form given inSection IV-C. The prototype system provides five suchinterrogation functions, listed in Table II.
The user will sometimes think of the cell contents asthe representative value. Therefore, to avoid visual clut-ter, the system has an option that hides the uncertaintydetails and displays the representative value in the cell.Figure 4 shows a screenshot of the prototype systemwhere uncertainty hiding has been enabled. The cur-rently highlighted cell shows the value 171.51, whereasthe cell contents is actually “normpdf(175.51,5)”. Thisbehavior parallels formulae, which display the result of
Function Returns
isCertain(x) True if the cell x is completely certain.hasUncertainty(x) True if the cell x has associated uncertainty
information.Lower(x) The lower bounds of the cell x.Upper(x) The upper bounds of the cell x.Certainty(x, y) The degree of certainty that the cell x is
going to be y, where y is a crisp value. y isa literal constant or the address of areference to another cell. In the unusualcase that y is uncertain, the representativevalue is used.
Table IIPROTOTYPE UNCERTAINTY INTERROGATION FUNCTIONS
Figure 4. Screenshot of the Prototype with Uncertainty Hidden
the calculation in the cell rather than the formula itself.The prototype automatically shades cells to help identifythose that are uncertain. The color scheme was chosenarbitrarily.
The visualization system is implemented as a special-ized sheet, called a visualization sheet. The layout of thevisualization sheet matches the scene graph structure,with every non-empty row of the visualization sheetrepresenting a node in the graph. The starting columnindicates the position of the node in the hierarchy, wherea row that begins in column n will be a child node of itsnearest preceding row that begins in columns 1 .. n − 1,or the root node if none can be found. Thus, all rowsbeginning with the column “A” will be children of theroot node, while rows beginning in column “B” will bechildren of a preceding row beginning in column “A”,etc. The first non-empty column contains a string keythat determines the node type. The subsequent columns
IEEE TRANSACTIONS ON VISUALIZATION AND COMPUTER GRAPHICSThis article has been accepted for publication in a future issue of this journal, but has not been fully edited. Content may change prior to final publication.

9
Figure 5. Visualization Sheet for the Graph in Figure 8
contain the parameters for that node. The nodes them-selves are implemented by classes derived from the scenegraph group node. It is the responsibility of the nodeobject to perform type checking on parameters.
Figure 5 shows a visualization sheet with three chil-dren of the root node: a Title node, which displaystitle text; a 2Daxes node, which generates a rectangulargrid; and a Scale node, which adds a scaling to thetransformation matrix of its children. The 2Daxes nodehas two children, which specify the labels for each axis.The Scale node has a Translate child, and together theyposition the data correctly over the 2Daxes object. TheColor node specifies that its child should be drawn inblue. The AreaLine node takes a sequence of lower andupper y-values and produces the polygon representingthe data. All parameter fields can either contain animmediate value or a formula. For example, the cell E8in Figure 5 contains the formula “=Lower(Sheet 1!F8)”,indicating that this cell should contain the lower boundsof the cell “F8” in the sheet “Sheet 1”.
Uncertainty is mapped to visual elements using thefunctions in Table II. For example, the Certainty() func-tion can be used to map the degree of certainty to opacityfor nodes supporting an opacity parameter, as was donein Figure 1 (d).
C. Capabilities of the Spreadsheet Software
The default uncertainty plug-in implements several in-formation uncertainty modeling techniques. This allowsusers to construct a model using information uncertaintymodels as native types. The parameters of the uncertaintyare inherent in the cell, providing structural and semanticsupport for the uncertainty modeling technique, therebyavoiding potential errors that can arise when parametersare separated.
The system provides an ability to choose the prop-agation model from options supplied by plug-ins. Theuser is now free to iteratively build uncertainty intoa model: first, a rough crisp data model is producedas a proof-of-concept; then, the user refines the data
model by promoting variables to add uncertainty detail.Each variable with uncertainty is treated as a unit andpropagation of the uncertainty is handled automaticallyusing the chosen propagation model.
The modular and extensible plug-in based architectureallows new cell types, propagation models, and scenegraph nodes to be defined by plug-ins. New cell typescan be used to cover additional uncertainty modelingtechniques; new propagation models are able to handlepropagation of uncertainty and combinations of variousmodeling techniques; and new scene graph nodes allowfuture display techniques to be supported.
The use of a visualization sheet keeps the interfaceconsistent and brings the power of formulae to thevisual mapping process. Through the combinations ofseveral visual elements, sophisticated visualizations canbe constructed by the user. This provides the flexibilityto perform traditional visualization tasks as well assupporting the sometimes unusual needs of informationuncertainty visualization.
D. Process for Constructing an Uncertainty Spreadsheet
We use an incremental process to building uncertaintyspreadsheets. It is typically most convenient to beginconstruction of a model at the high level, where the focusis on logic, before proceeding to add details. The useof uncertainty modeling increases detail and is thereforetypically most conveniently added later, once the basicstructure of the model is in place. This is particularlytrue of information uncertainty.
Figure 6 shows the process for building an uncertaintyspreadsheet. In the first step an initial spreadsheet isbuilt, typically using uncertainty ignorance datatypes.This step is similar to building a traditional spreadsheet,and includes the spreadsheet structure, variables, andformulae. Next, the spreadsheet is iteratively refined inthree ways: firstly, uncertainty detail is added to (orremoved from) variables; secondly, visualizations in themodel are added, altered, or removed; and thirdly, themodel can be refined in the traditional sense, such aschanging formulae or adding variables.
The task labeled refine uncertainty details consists oftwo types of activities: adding / removing uncertaintydetail, and changing the mathematical model for prop-agation. There are three main steps to add or removeuncertainty details: firstly, the appropriate variable isidentified, e.g. a variable whose uncertainty is currentlyignored; secondly, its details are changed (promoted/ demoted); and thirdly those changes are evaluated,returning to the second step if found to be inadequate.
IEEE TRANSACTIONS ON VISUALIZATION AND COMPUTER GRAPHICSThis article has been accepted for publication in a future issue of this journal, but has not been fully edited. Content may change prior to final publication.

10
Build Initial Spreadsheet
Refine Spreadsheet
Refine Uncertainty
DetailsRefine ModelRefine
Visualizations
Figure 6. Process for Constructing an Uncertainty Spreadsheet
E. Comparison to Traditional Spreadsheets
To incorporate uncertainty modeling in a traditionalspreadsheet requires three major changes. Firstly, theuncertainty details must be recorded in the spreadsheetsomewhere, resulting in additional cells being used.The addition of new cells changes the layout of thespreadsheet and increases the amount of informationthat the user faces. Furthermore, the number of cellsthat are added depend on the number of parametersrequired by the uncertainty data type. Secondly, formulaeneed to be changed to incorporate the propagation ofuncertainty details. These formulae become harder tounderstand, because the uncertainty information handlingobscures the fundamental operation. The uncertaintyinformation propagation must also be carried forward toall downstream formulae, which can be many. Thirdly,any graphs or visualizations should be updated to includeuncertainty information as appropriate.
There are four limitations to traditional spreadsheetsfor incorporating uncertainty. Firstly, the user is requiredto be intimately aware of the uncertainty modelingtechnique, including rules for its propagation, beforethey can incorporate it in their model. Secondly, it isprohibitive to change the level of uncertainty informationafter the initial design. Adding uncertainty informationafter the model is already in place becomes an arduoustask that is error prone. Should more information come tolight, for which another uncertainty modeling techniqueis more appropriate, then all affected parts of the modelhave to be manually rebuilt. Thirdly, it is also prohibitiveto change the mathematical propagation model, sincechanging propagation rules requires all formulae to berewritten. Fourthly, there are currently few built-in vi-sualization techniques for information uncertainty. Thevisualization techniques that are supplied target specificuncertainty modeling types (e.g. intervals). To createsophisticated visualizations requires the user to exporttheir data to a more advanced visualization system.
Our system overcomes these four limitations. In con-
trast to adding new cells to the spreadsheet, our approachis to store the uncertainty information in the same cell.The immediate advantages of this approach are that thespreadsheet does not change in layout and the number ofcells do not increase, irrespective of the type or volumeof uncertainty information it contains. Furthermore, thesystem is aware of this uncertainty information andhas a mechanism for resolving appropriate propagationoperations in formulae, meaning that formulae do notchange either. Thus, it is a local change to a singlecell to add, change, or remove uncertainty for a vari-able. Exceptions only occur where the user’s chosenmathematical model prohibits particular operations orcombinations, which is no different to any traditionalapproach. The system resolves operations using a tableof operations that the user can control at a global level.Therefore, should an alternative mathematical model beneeded, no change to the actual spreadsheet contents isrequired. Our system uses a flexible visualization sheetthat allows sophisticated visualizations to be explored.The advantage is that any changes to the spreadsheet areimmediately reflected in the visualizations.
We interviewed two financial analysis experts, threeregular spreadsheet users, and one general computer user.Participants were shown the prototype system appliedto a sensitivity analysis scenario. All respondents foundthe approach to be clear and intuitive. Of the fivethat used spreadsheets regularly, all indicated that theywould like to use uncertainty spreadsheets as a tool. Themost common reasons for wanting to use an uncertaintyspreadsheet were time savings and immediate visualfeedback.
VI. CASE STUDY
This section illustrates the advantages of using ourarchitecture over a traditional spreadsheet when usedin a case study. The problem to be explored is under-standing and visualizing the profitability of a prospectiveinvestment property. Acquiring property for investmentand rental income is a common prospect for many whomay not have a background in finance. However, thereare many estimations and subtle interactions betweenvariables that can have significant effects on the profitoutcomes. Furthermore, many of these interactions arepoorly understood or difficult to define, even for experts.
The decision to acquire an investment property isbased on profitability of the investment. Therefore, theoutput of the model is a Net Present Value (NPV)calculation that gives a comparison of the profitabilityof buying a property using a deposit against investingthat same deposit into a fixed interest vehicle. A positive
IEEE TRANSACTIONS ON VISUALIZATION AND COMPUTER GRAPHICSThis article has been accepted for publication in a future issue of this journal, but has not been fully edited. Content may change prior to final publication.

11
NPV indicates that the property investment is moreattractive.
The NPV calculation is as follows:
NPV =t∑
n=1
CashF low(n)
(1 + in)n
where t is the number of years the property is held;in is the after tax interest rate in year n; and CashF low
is given by
CashF low = r − p − o + x − CI + CO − u
where r is rental income; p is the loan payment forthe current year; o is the ongoing expenses; x is thetax refund due to investment; CI is the deposit paid onpurchase; CO is the deposit + net profit on sale; and u
are upfront costs.Building the Initial Spreadsheet: If uncertainty is
ignored, then the common approach to this problem isto create a tabular spreadsheet: each column contains avariable and each iteration of n adds another row. Asummary page is created where input variables, suchas increases in salary, can be placed in an accessiblelocation. The user is able to change input details andobserve their effects over a number of years, usually withthe aid of graphs.
Most of the variables in this model are subject touncertainty. For example: rental income becomes pro-gressively less certain the farther into the future it ispredicted; loan repayments are similarly uncertain sincethey are dependent on a variable interest rate; the taxrefund is uncertain because it depends upon taxationlaw, employment status, and promotions, all of whichcan change unexpectedly; and the net profit on sale isalways subject to uncertainty.
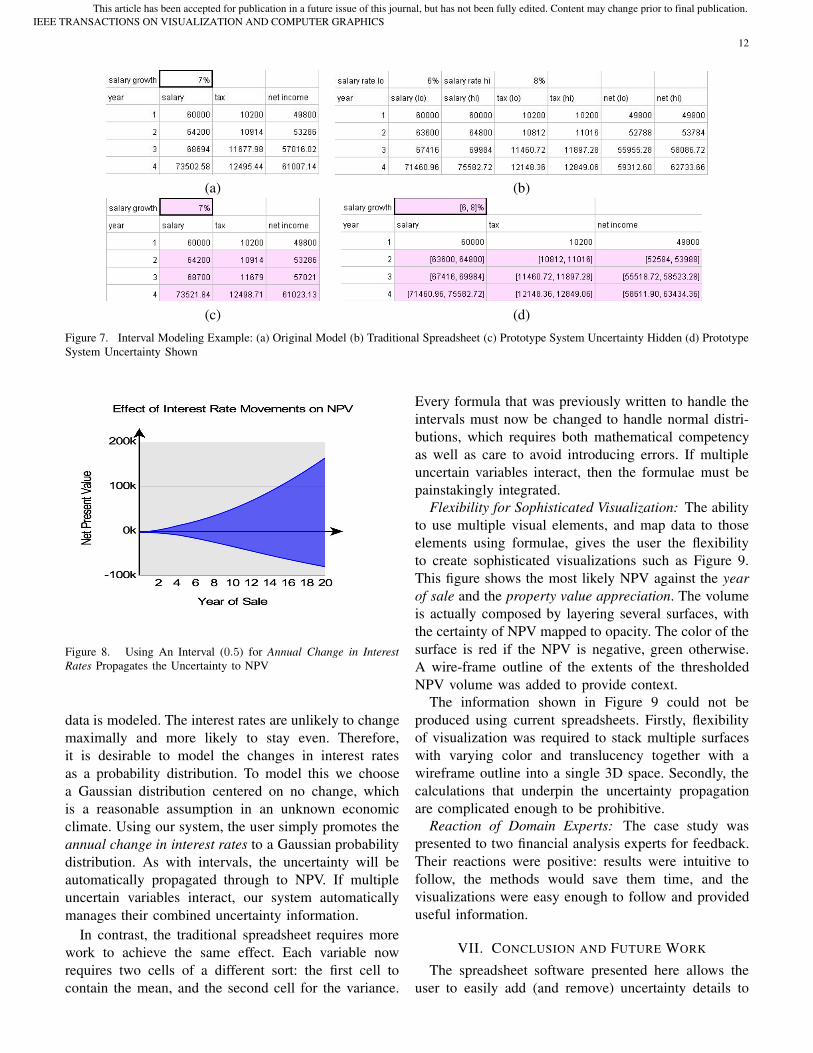
Spreadsheet Layout is Unchanged: Adding uncer-tainty details using our software does not add new cellsor change the spreadsheet layout. Figure 7 illustrates thisusing the annual salary increase projected over 20 years.There are four variables: salary growth, which is givenby the user; salary; tax; and net income. Uncertaintyinformation propagates from salary increase to salaryto tax. The user wishes to model the salary increase asan interval of 71 (6 to 8). Figure 7 (a) shows the originalspreadsheet model prior to modeling an interval. Figure 7(b) presents a solution using a traditional spreadsheet,which requires six columns to represent three variables.Each column had to be manually added and the formulafor tax and salary had to be updated to reflect thischange. Figure 7 (c) shows our prototype system withuncertainty hiding switched on. The salary growth fieldwas promoted to an interval (71) and no other changewas made. In this view the updated model closely reflects
the original3. Figure 7 (d) is the same as Figure 7 (c)with uncertainty hiding switched off.
Formulae are Unchanged: The shaded cells indicatethat they contain an interval, thus it can be seen fromFigure 7 (b) that the uncertainty is propagated automati-cally to both salary and tax. The formulae for these cells,however, are unchanged. It is noteworthy that while thefigure shows the representative value in each cell, theuser can always toggle the viewing option to show theuncertainty details instead of the representative value.The traditional approach not only changes layout, butthe formulae had to be repeated to calculate both thelow and high rates.
To achieve the same effect using a traditional spread-sheet requires more effort. Firstly, each affected vari-able must be expanded to two cells, namely the upperand lower bounds. This typically involves adding anadditional column for each variable that is calculatedover multiple years. Secondly, the propagation of theuncertainty information must be manually managed byadding the appropriate formulae.
Visualization can be Abstracted from UncertaintyType: Using the traditional spreadsheet limited thegraphs to those that the program provided, of whichtwo could be used to indicate the intervals. The firstwas a graph that used error bars, while the secondwas to overlay the maximum and minimum lines onthe same graph as two different data points. However,these traditional graphs only work with interval data. Incontrast, the graph in Figure 8 will work with the otherdatatypes.
The graph in Figure 8 was generated using threeelements in a visualization sheet: a title text object, a 2Daxes object, and a polygon. The 2D axes object takesas parameters the label and range for the vertical andhorizontal axes. The polygon requires a color specifiedin the first four cells, followed by a series of alternatingx and y coordinates. The y coordinate is given byfirstly the lower bounds of the variable, then the upperbounds, using formulae of the form “=Lower(cellref )”,where cellref is a reference to a cell containing NPVfor the appropriate year. These functions are definedfor all numerical types. For example, the Upper() andLower() functions return the same value when that valueis certain, resulting in a line graph.
Changing Uncertainty Models is Easy: The user canchoose to use the modeling technique that is appropriatefor the variable, with little regard for how the rest of the
3Note that the number shown represents the halfway value betweenthe upper and lower limits. The upper limit grows more rapidly thanthe lower limit, thus the mean value for [6, 8]%growth will not match7% growth.
IEEE TRANSACTIONS ON VISUALIZATION AND COMPUTER GRAPHICSThis article has been accepted for publication in a future issue of this journal, but has not been fully edited. Content may change prior to final publication.
12
(a) (b)
(c) (d)
Figure 7. Interval Modeling Example: (a) Original Model (b) Traditional Spreadsheet (c) Prototype System Uncertainty Hidden (d) PrototypeSystem Uncertainty Shown
Figure 8. Using An Interval (0.5) for Annual Change in InterestRates Propagates the Uncertainty to NPV
data is modeled. The interest rates are unlikely to changemaximally and more likely to stay even. Therefore,it is desirable to model the changes in interest ratesas a probability distribution. To model this we choosea Gaussian distribution centered on no change, whichis a reasonable assumption in an unknown economicclimate. Using our system, the user simply promotes theannual change in interest rates to a Gaussian probabilitydistribution. As with intervals, the uncertainty will beautomatically propagated through to NPV. If multipleuncertain variables interact, our system automaticallymanages their combined uncertainty information.
In contrast, the traditional spreadsheet requires morework to achieve the same effect. Each variable nowrequires two cells of a different sort: the first cell tocontain the mean, and the second cell for the variance.
Every formula that was previously written to handle theintervals must now be changed to handle normal distri-butions, which requires both mathematical competencyas well as care to avoid introducing errors. If multipleuncertain variables interact, then the formulae must bepainstakingly integrated.
Flexibility for Sophisticated Visualization: The abilityto use multiple visual elements, and map data to thoseelements using formulae, gives the user the flexibilityto create sophisticated visualizations such as Figure 9.This figure shows the most likely NPV against the yearof sale and the property value appreciation. The volumeis actually composed by layering several surfaces, withthe certainty of NPV mapped to opacity. The color of thesurface is red if the NPV is negative, green otherwise.A wire-frame outline of the extents of the thresholdedNPV volume was added to provide context.
The information shown in Figure 9 could not beproduced using current spreadsheets. Firstly, flexibilityof visualization was required to stack multiple surfaceswith varying color and translucency together with awireframe outline into a single 3D space. Secondly, thecalculations that underpin the uncertainty propagationare complicated enough to be prohibitive.
Reaction of Domain Experts: The case study waspresented to two financial analysis experts for feedback.Their reactions were positive: results were intuitive tofollow, the methods would save them time, and thevisualizations were easy enough to follow and provideduseful information.
VII. CONCLUSION AND FUTURE WORK
The spreadsheet software presented here allows theuser to easily add (and remove) uncertainty details to
IEEE TRANSACTIONS ON VISUALIZATION AND COMPUTER GRAPHICSThis article has been accepted for publication in a future issue of this journal, but has not been fully edited. Content may change prior to final publication.

13
Figure 9. Volumetric Representation of the Most Likely EffectInterest Rate Changes Will Have on NPV.
variables as needed. This makes it easy for the userto find the appropriate uncertainty modeling techniquefor the problem at hand. The uncertainty information isautomatically propagated to related parts in the modeland is readily available for mapping to visual elements.This quickly fills the model with accessible uncertaintyinformation, making it easier to visualize. The visual-izations are built on a low level, using formulae andcell references. This provides the expressive power ofspreadsheet formulae as well as the benefits of onlinevisualization. The user can create unusual and sophisti-cated visualizations with immediate feedback whenevera change is made to the spreadsheet. All these factorsovercome barriers to the use of information uncertaintyvisualization by making it easier, less error prone, andmore accessible.
The extensible architecture allows new cell types,operations, and visual elements to be defined by plug-ins. In this paper we have considered several modelingtechniques, but further work can easily add more. Forexample, classic sets are non-specific types that couldbe evaluated in an expert systems context. While newdata types can be added, parsing formulae to recognizearbitrary constants in an extensible way is non-trivial(consider “= 5 +- 2 - 2”, which should evaluate to32) . The prototype system does not support unusualconstants to be declared inside a formula. Future workcould explore use of a dynamic parser. One way aroundthe problem is to force all constants to be defined byfunctions, for example “interval(5, 2) - 2”.
The visualization sheet keeps the interface consis-tent and brings the power of formulae to the visualmapping process. The user is given flexibility to createthe visualizations that they desire. While this is ideal
for information uncertainty visualization research, it isperhaps too low level for typical users of spreadsheets.It would be worth investigating the incorporation of ahigher level interface, such as the multi-agent framework.
Cells are able to display two states: either the rep-resentative value, or the full description. Spreadsheetsappeal to users because they can see across multiplecells, therefore it is worth exploring further ways ofrepresenting the uncertainty inside cells. For example,other views might show various levels of detail. Anotheroption would be to show graphical representations. Therehas been extensive work on spreadsheets that incorporategraphical cells and these ideas can be explored in anuncertainty context.
The color scheme used to shade uncertain cells inthe prototype was chosen arbitrarily, but this could beexplored further. For example, the color might be chosento represent the degree of certainty in the cell and assigna more saturated color to those that are more uncertain.Such a scheme could aid the user to quickly distinguishareas of high uncertainty.
While the system presented here uses a spreadsheetparadigm, many of the concepts can be applied to otherparadigms, such as data flow networks or script basedlanguages. Typical mathematical modeling languages,such as Matlab, currently require separate variables tohold the mean and variance of a Gaussian distribution.Consequently, it is not a simple task to promote a vari-able to a different uncertainty type. Future work couldinvestigate a similar approach for these environments.
REFERENCES
[1] L. Bavoil, S. P. Callahan, P. J. Crossno, J. Freire, C. E.Scheidegger, C. T. Silva, and H. T. Vo. Vistrails: enablinginteractive multiple-view visualizations. In Visualization, 2005.VIS 05. IEEE, pages 135–142, 2005.
[2] Polly S. Brown and John D. Gould. An experimental studyof people creating spreadsheets. ACM Transactions on OfficeInformation Systems, 5(3):258–272, July 1987.
[3] Steven P. Callahan, Juliana Freire, Emanuele Santos, Carlos E.Scheidegger, Claudio T. Silva, and Huy T. Vo. Vistrails:visualization meets data management. In SIGMOD ’06: Pro-ceedings of the 2006 ACM SIGMOD International Conferenceon Management of Data, pages 745–747, New York, NY, USA,2006. ACM Press.
[4] Ed H. Chi and Stuart K. Card. Sensemaking of evolvingweb sites using visualization spreadsheets. In INFOVIS ’99:Proceedings of the 1999 IEEE Symposium on InformationVisualization, page 18, Washington, DC, USA, 1999. IEEEComputer Society.
[5] S. Djurcilov, K. Kim, P. Lermusiaux, and A. Pang. Visualizingscalar volumetric data with uncertainty. Elsevier Computers &Graphics, 26:239–248, 2002.
[6] L. Hall and M. Berthold. Fuzzy parallel coordinates. In IEEEFuzzy Information Processing Society, pages 74–78, 2000.
IEEE TRANSACTIONS ON VISUALIZATION AND COMPUTER GRAPHICSThis article has been accepted for publication in a future issue of this journal, but has not been fully edited. Content may change prior to final publication.
14
[7] Ed Huai hsin Chi, Joseph Konstan, Phillip Barry, and JohnRiedl. A spreadsheet approach to information visualization.In UIST ’97: Proceedings of the 10th Annual ACM Symposiumon User Interface Software and Technology, pages 79–80, NewYork, NY, USA, 1997. ACM Press.
[8] Ed Huai hsin Chi, John Riedl, Phillip Barry, and JosephKonstan. Principles for information visualization spreadsheets.IEEE Computer Graphics and Applications, 18(4):30–38, 1998.
[9] Tomas Isakowitz, Shimon Schocken, and Jr. Henry C. Lucas.Toward a logical/physical theory of spreadsheet modeling. ACMTrans. Inf. Syst., 13(1):1–37, 1995.
[10] T. J. Jankun-Kelly, K.-L. Ma, and M. Gertz. A model for thevisualization exploration process. In IEEE Visualization, pages323–330, 2002.
[11] C.R. Johnson and A.R. Sanderson. A next step: Visualizingerrors and uncertainty. IEEE Computer Graphics and Applica-tions, 23(5):6–10, September/October 2003.
[12] P. Keller and M. Keller. Visual Cues. IEEE Press, 1992.[13] George J. Klir. The many faces of uncertainty. In B.M. Ayyub
and M.M. Gupta, editors, Uncertainty Modelling and Analysis:Theory and Applications, pages 3–19. Elsevier Science B.V.,1994.
[14] George J. Klir. Uncertainty and Information: Foundations ofGeneralized Information Theory. Wiley-Interscience, 2005.
[15] Marc Levoy. Spreadsheets for images. In SIGGRAPH ’94: Pro-ceedings of the 21st Annual Conference on Computer Graphicsand Interactive Techniques, pages 139–146, New York, NY,USA, 1994. ACM Press.
[16] Alan M. MacEachren, Anthony Robinson, Susan Hopper,Steven Gardner, Robert Murray, Mark Gahegan, and ElisabethHetzle. Visualizing geospatial information uncertainty: What weknow and what we need to know. Cartography and GeographicInformation Science, 32(3):139–160, July 2005.
[17] II Marc Fisher, Gregg Rothermel, Darren Brown, MingmingCao, Curtis Cook, and Margaret Burnett. Integrating auto-mated test generation into the WYSIWYT spreadsheet testingmethodology. ACM Trans. Softw. Eng. Methodol., 15(2):150–194, 2006.
[18] J. M. Mendel. Uncertain Rule-Based Fuzzy Logic Systems.Prentice Hall PTR, 2001.
[19] Alex T. Pang, Craig M. Wittenbrink, and Suresh K. Lodha.Approaches to uncertainty visualization. The Visual Computer,13:370–390, 1997.
[20] Binh Pham and Ross Brown. Multi-agent approach for vi-sualisation of fuzzy systems. In International Conference onComputational Science. Lecture Notes in Computer Science,June 2-4 2003.
[21] Kurt W. Piersol. Object-oriented spreadsheets: the analyticspreadsheet package. In OOPLSA ’86: Conference Proceed-ings on Object-oriented Programming Systems, Languages andApplications, pages 385–390, New York, NY, USA, 1986. ACMPress.
[22] Ramana Rao and Stuart K. Card. The table lens: merginggraphical and symbolic representations in an interactive focus+ context visualization for tabular information. In CHI ’94:Proceedings of the SIGCHI Conference on Human Factorsin Computing Systems, pages 318–322, New York, NY, USA,1994. ACM Press.
[23] Daniel M. Russell, Mark J. Stefik, Peter Pirolli, and Stuart K.Card. The cost structure of sensemaking. In CHI ’93:Proceedings of the SIGCHI conference on Human factors incomputing systems, pages 269–276, New York, NY, USA, 1993.ACM Press.
[24] Will Schroeder, Ken Martin, and Bill Lorensen. The Visualiza-tion Toolkit, Third Edition. Kitware Inc., 2004.
[25] Edward R. Tufte. Envisioning Information. Graphics Press,May 1990.
[26] Jarke J. van Wijk and Robert van Liere. Hyperslice: visu-alization of scalar functions of many variables. In VIS ’93:Proceedings of the 4th Conference on Visualization ’93, pages119–125, 1993.
[27] A. Varshney and A. Kaufman. Finesse: a financial informa-tion spreadsheet. In INFOVIS ’96: Proceedings of the 1996IEEE Symposium on Information Visualization (INFOVIS ’96),page 70, Washington, DC, USA, 1996. IEEE Computer Society.
[28] Y.Y. Yao. Interval based uncertain reasoning. In IEEE FuzzyInformation Processing Society, pages 363–367, 2000.
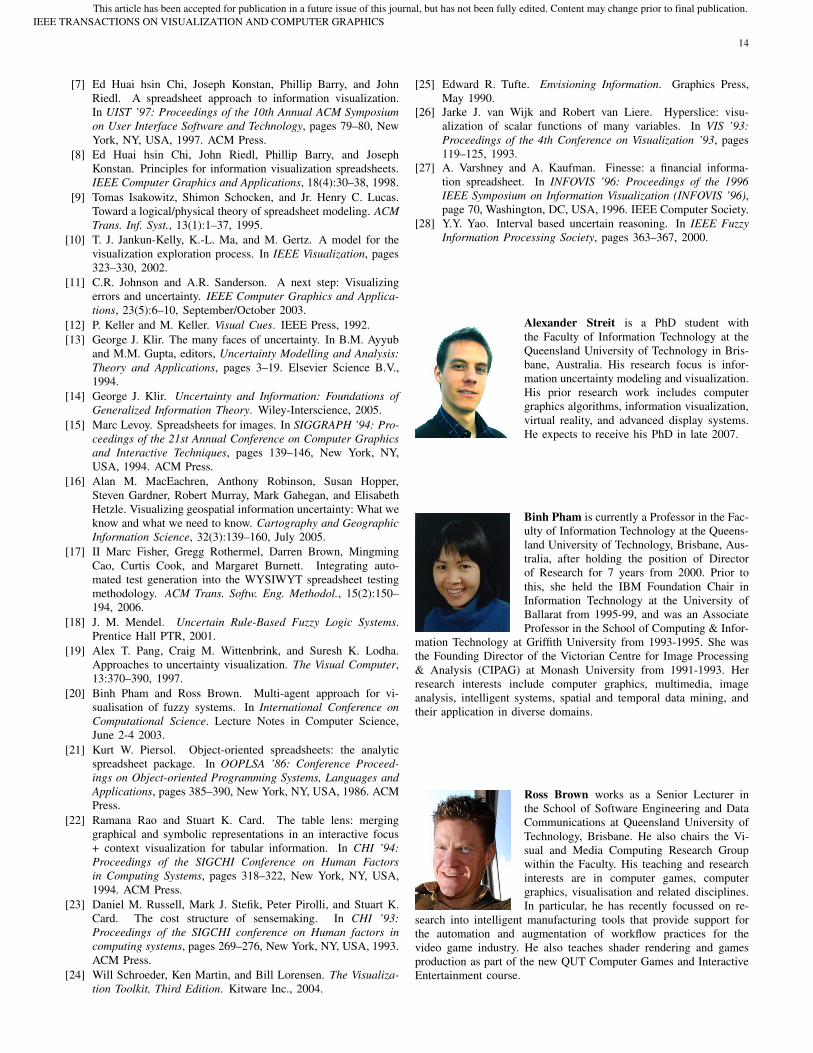
Alexander Streit is a PhD student withthe Faculty of Information Technology at theQueensland University of Technology in Bris-bane, Australia. His research focus is infor-mation uncertainty modeling and visualization.His prior research work includes computergraphics algorithms, information visualization,virtual reality, and advanced display systems.He expects to receive his PhD in late 2007.
Binh Pham is currently a Professor in the Fac-ulty of Information Technology at the Queens-land University of Technology, Brisbane, Aus-tralia, after holding the position of Directorof Research for 7 years from 2000. Prior tothis, she held the IBM Foundation Chair inInformation Technology at the University ofBallarat from 1995-99, and was an AssociateProfessor in the School of Computing & Infor-
mation Technology at Griffith University from 1993-1995. She wasthe Founding Director of the Victorian Centre for Image Processing& Analysis (CIPAG) at Monash University from 1991-1993. Herresearch interests include computer graphics, multimedia, imageanalysis, intelligent systems, spatial and temporal data mining, andtheir application in diverse domains.
Ross Brown works as a Senior Lecturer inthe School of Software Engineering and DataCommunications at Queensland University ofTechnology, Brisbane. He also chairs the Vi-sual and Media Computing Research Groupwithin the Faculty. His teaching and researchinterests are in computer games, computergraphics, visualisation and related disciplines.In particular, he has recently focussed on re-
search into intelligent manufacturing tools that provide support forthe automation and augmentation of workflow practices for thevideo game industry. He also teaches shader rendering and gamesproduction as part of the new QUT Computer Games and InteractiveEntertainment course.
IEEE TRANSACTIONS ON VISUALIZATION AND COMPUTER GRAPHICSThis article has been accepted for publication in a future issue of this journal, but has not been fully edited. Content may change prior to final publication.