a system of sustainability indicators for the province of thai binh, vietnam
TRANSCRIPT

A System of Sustainability Indicators for the Provinceof Thai Binh, Vietnam
Le Trinh Hai • Pham Hoang Hai • Pham Thi Thu Ha •
Nguyen Manh Ha • Ly Trong Dai • Pham Viet Hoa •
Nguyen Cao Huan • Lai Vinh Cam
Accepted: 18 March 2013� Springer Science+Business Media Dordrecht 2013
Abstract Sustainable Development is a broad and universal concept. Indicators are a
basis to measure sustainability and to direct policies that aim to achieve a better quality of
life. Thai Binh, a coastal province in North Vietnam is strongly concerned about strategic
sustainability development. To select a system of sustainability indicators, the Delphi
method was applied in 2012. A two-round questionnaire was organized to use with 32
experts, who acted as participants. 69 indicators were selected from 98 listed indicators: 15
related to economic development, 5 to the sea and coastal zone, 1 to the global economic
partnership, 4 to consumption and production patterns, 7 to poverty, 3 to governance, 9 to
health, 4 to education, 3 to demographics, 2 to natural hazards, 5 to atmosphere, 7 to land,
and 3 to freshwater. Conversely, 29 other indicators were rejected. The Delphi method
L. T. Hai (&) � P. H. Hai � N. M. Ha � L. T. Dai � L. V. CamInstitute of Geography (IG), Vietnam Academy of Science and Technology (VAST), Hanoi, Vietname-mail: [email protected]
P. H. Haie-mail: [email protected]
N. M. Hae-mail: [email protected]
L. T. Daie-mail: [email protected]
L. V. Came-mail: [email protected]
P. T. T. HaFaculty of Environment, Hanoi University of Science, Vietnam National University, Hanoi, Vietname-mail: [email protected]
P. V. HoaSpace Technology Institute (STI), Vietnam Academy of Science and Technology (VAST), Hanoi,Vietname-mail: [email protected]
N. C. HuanFaculty of Geography, Hanoi University of Science, Vietnam National University, Hanoi, Vietname-mail: [email protected]
123
Soc Indic ResDOI 10.1007/s11205-013-0315-x
allows indicator selection for identification of the process of sustainability. The system of
indicators, as the first important step of the sustainable development process, provides
useful information for decision makers and planners as well sustainability strategy. It is
planned that the indicators selected should be applied in the province.
Keywords Thai Binh province � Delphi process, experts � Sustainability indicators �Vietnam
1 Introduction
Sustainable development (SD) relates to aspects of economic-social-cultural-environ-
mental protection and development. There are many definitions of SD as it can mean
different things to different people, including this landmark one that first appeared in 1987:
‘‘Development that meets the needs of the present without compromising the ability of
future generations to meet their own needs’’ (WCED 1987). In 2007, in terms of a ‘‘hot’’
current issue (climate change), a speech on World Environment Day 2007, Secretary-
General Ban Ki-moon said ‘‘… our sustainability world eventually becomes a globally
acclaimed model of efficient use of energy and resources’’ (UN 2007b).
The United Nations has a long history of supporting the use of appropriately defined
indicator systems as a tool to promote better decision making by policy makers. Chapter 40
of the Agenda 21, adopted in 1992, deals with the topic ‘‘Information for decision-making’’
and discusses the development and the worldwide use of Sustainable Development Indi-
cators (SDIs) (UN 1992). The core of this discussion is that indicators had to be developed
to improve and support information for decision-making. In 1995, the third session of the
Commission for Sustainable Development (CSD) followed up the indicators recommen-
dation and approved a work programme on the subject. In 2001, the United States pub-
lished the report as the culmination of the CSD Work Programme on SDIs (1995–2000). It
provided a detailed description of key SD themes and sub-themes and the approach for the
use in decision-making processes the national level. In 2007, based on these earlier sets,
the third edition was published (UN 2001). The indicator set retained the theme/sub-theme
framework as new cross-cutting that was adopted in 2001. It was directly relevant to the
monitoring of national SD strategies. In this framework, the division of indicators of
the four pillars of social, economic, environmental and institutional is no longer explicit in
the newly revised set. In 2012 in Rio, the Member States decided to launch a process to
develop a set of SD Goals, which will build upon the Millennium Development Goals and
converge with the post 2015-development agenda (UN 2012).
The process to select SDIs is important. The lack of quantitative SDIs caused by local
and central level administrative complexity hampers the identification of indicators, at
what levels these indicators should be set to achieve sustainable development goals, and
how to monitor or collect data for these SDI (VIDS 2005). To be effective, the selection
process of SDIs should be fair and open, and involve a wide participation and testing. This
process should result in a well-founded and comprehensive set of relevant SDIs. The
process should be repeated regularly to assure that the selected indicators evolve over time
and remain relevant (NASA 2003). SD is a unique social choice and is as such important
for the future. The importance of protecting and managing the natural resource is based on
the economic and social development and the environmental protection, which focus issues
such as on drinking water, oceans, seas, islands and coastal areas, disasters, climate
L. T. Hai et al.
123
change, agriculture, desertification, mountain systems, sustainable tourism, biodiversity,
forests and trees, and mining (Hens and Nath 2005).
Currently, in regards to the hot issue of climate change, Vietnam is a country of
vulnerable, particularly in terms of its water resources, agriculture, forestry, energy,
aquaculture and human health. Vietnam’s coastal zones are amongst its key vulnerabilities
(ALM 2009) and the country is considered as most threatened by climate change induced
sea level rise. Approximately half of the country’s population lives in the densely popu-
lated areas of the Mekong and Hong (Red) River Deltas; Thai Binh province belongs to the
Red River Delta (Yusuf and Francisco 2009).
This study focused on the Thai Binh province, Vietnam. The province is located in
northern Vietnam and has one of the highest population density in Vietnam (about 1,200
people/km2 and about 15 % of the total population are living in urban areas). In the past,
the province was largely an agricultural area. The Thai Binh economy has since shifted
away from agriculture to small-scale industry, agriculture and aquaculture (DONRE 2011)
and, in recent years, heavier industry has emerged (e.g. gas, brown coal mining). In
addition, other trade villages are exiting. The transition from a largely agricultural province
towards more industrial operations has resulted in a number of emerging challenges (e.g.
population migration, unemployment, and environmental pollutions).
Thai Binh does not currently have a formal SD indicator system, despite having access to a
range of data in provincial documents, reports and statistic yearbooks. Unfortunately, the
province currently lacks adequate approaches, methods, infrastructure and SD policies,
although the provincial authorities are increasingly becoming aware of the importance of this.
Recognising the need a formal SD system in Thai Binh, this study sought to develop a
concise and representative set of SDI aligned to the characteristics and emerging chal-
lenges of the Thai Binh province. A Delphi based approach that drew on the opinion of
multiple experts was used to inform the development of the SD indicator set. This study
shows how key indicators for socio-economic development and environmental protection
can be selected at the provincial level. Indicators are able to show what is the measurable
and sustainability of a situation (DCMS 1999; Hart 1997). These statistical values col-
lectively measure the capacity to meet present and future needs (NASA 2003). They
provide information that is crucial for decision makers and can also inform the public.
2 Delphi Method
Internationally, Delphi method is widely used to inventory scientific consensus. When used
correctly, the method can contribute significantly to broadening knowledge between
experts (Keeney et al. 2001). The Delphi approach know as Knowledge Acquisition for
Multiple Experts with Time scales (KAMET), which takes time scales into consideration
while eliciting feedback from multiple experts (Chu and Hwang 2007) was used to define a
system of sustainability indicators. The method allows for the systematic collection of the
expert judgments on a particular topic through a set of sequentially applied feedback
1 2 3 4 5
the indicator is highly irrelevant
the indicator is irrelevant
the indicator is more or less relevant
the indicator is relevant
the indicator is highly relevant
Fig. 1 Likert-scale of indicator relevance ‘scores’ used by the respondents in the Delphi approach
A System of Sustainability Indicators
123

questionnaires, interspersed with summary information on options from earlier responses
(Delbecq and Van de Ven 1975). This method has been shown to be a reliable qualitative
research approach with the potential to solve problems to contribute to decision-making,
and reach a group consensus in a wide variety of areas (Cochran 1983). The use of this
method is widely accepted, particularly in Vietnam (Chu and Hwang 2007; Hai et al. 2009,
2011; Huge et al. 2009; Hai 2010; Gobin et al. 2012).
The Delphi method requires selected experts to rate the proposed indicators based on a
1–5 rating scale (Fig. 1).
The Delphi method stipulates specific selection criteria relating to median values, quartile
deviation, rating mean, and rating variances of each indicator. These are defined as:
• Median values and Quartile deviation (Q—is the quartile);
• Rating mean (Rme)—The mean of the ratings for questionnaire item indicator i. For
each indicator, the Rmei is calculated using the formula:
Rmi ¼X
i
¼ 1Nxi=N
in which N is the total number of ratings, xi is the rating allocated by expert i
• Rating variances (Rv)—rating variance (Rvi): the ratio of experts who change their
ratings for indicator i
The first stage of the Delphi method (i.e. Round t) requires selected experts to rate each of
the proposed indicators, using the 1–5 rating scale presented in Fig. 1. The number of
experts engaged can vary between 15 and 50 (Helmer 1983; Chu and Hwang 2007; Hai
et al. 2009; Huge et al. 2009; Gobin et al. 2012). They represent the professional experts.
The rules for analyzing the ratings from multiple experts with the Delphi approach are
presented in Table 1.
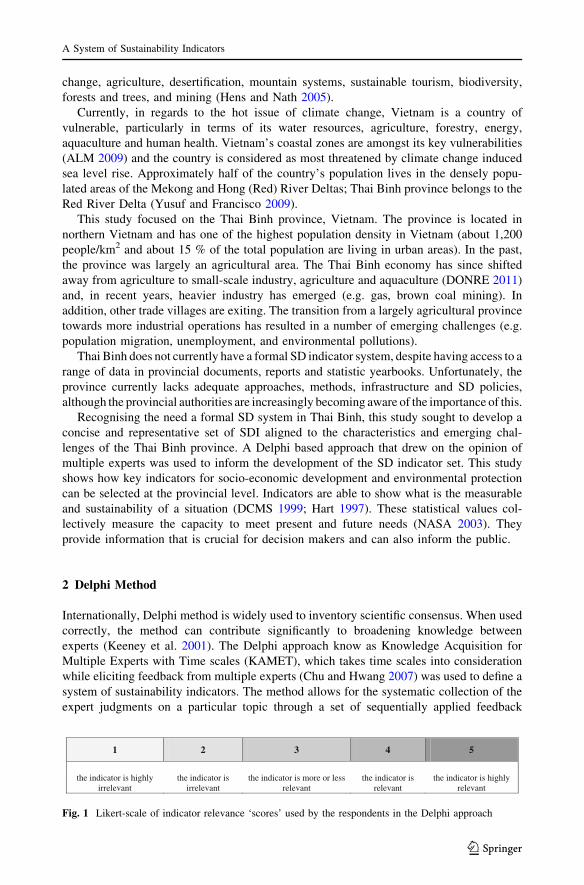
An indicator is accepted when the conditions outlined in Table 1 are fulfilled. In this
table, if an expert’s response (after round 2) falls inside the above R, the data ranges are
used (e.g. Rmei C 3.5 and Q B 0.5 and Rvi B 15 %) then indicator i is accepted, and no
further discussion concerning indicator i is needed. Conversely, if an expert’s response
falls outside the above r, the data ranges are not used (e.g. in Round t ? 2: if Rmei \ 3.5,
and Q B 0.5, and Rvi B 15 %), indicator i is rejected, and no further discussion con-
cerning indicator i is needed. The threshold (minimum requirement) to agree on a par-
ticular indicator during the second or third step is set of the ratio of 75 % of the experts.
Stability is reached when few or no further shifts in the panel of responses occurs from
round to round (Murry and Hammors 1995).
3 Application of the Delphi Method in this Study
The Delphi method was applied as described below:
• Desktop research: Indicators were screened and information sought from a wide range
of sources on existing SDI recommendations, including existing national SDI for
Vietnam, Indonesia, the UK, China, Thailand and Sweden, SDIs proposed by the UN
(2007a) and Thai Binh province master plans1;
1 Thai Binh People’s Committee, 2006. The master plan on social-economic development of Thai Binh by2020. Thai Binh, Vietnam.
L. T. Hai et al.
123
• SDI workshop: A set of open-ended questionnaire were discussed and commented on
the initial indicators by experts. This Workshop took place in May 2012 at the Institute
of Geography (IG) in Hanoi (Vietnam). During these workshops, a multi-disciplinary
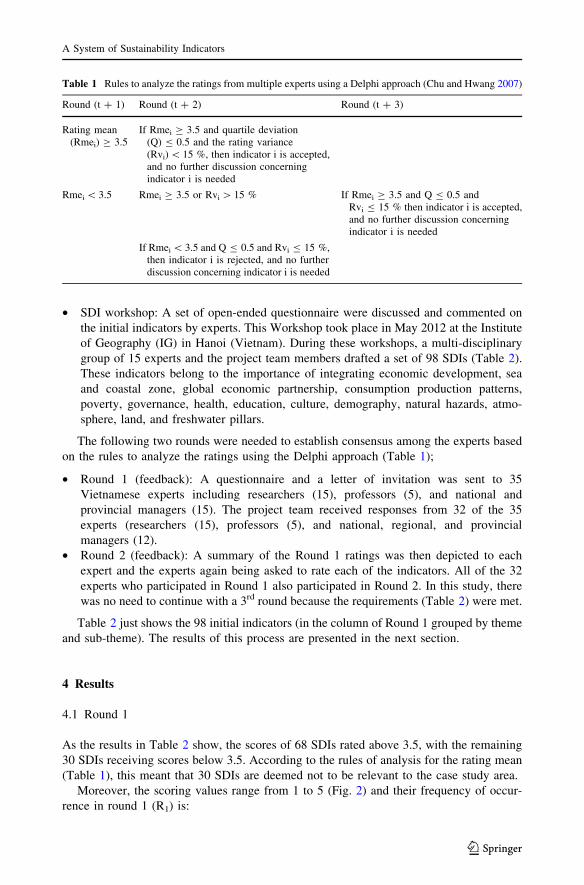
group of 15 experts and the project team members drafted a set of 98 SDIs (Table 2).
These indicators belong to the importance of integrating economic development, sea
and coastal zone, global economic partnership, consumption production patterns,
poverty, governance, health, education, culture, demography, natural hazards, atmo-
sphere, land, and freshwater pillars.
The following two rounds were needed to establish consensus among the experts based
on the rules to analyze the ratings using the Delphi approach (Table 1);
• Round 1 (feedback): A questionnaire and a letter of invitation was sent to 35
Vietnamese experts including researchers (15), professors (5), and national and
provincial managers (15). The project team received responses from 32 of the 35
experts (researchers (15), professors (5), and national, regional, and provincial
managers (12).
• Round 2 (feedback): A summary of the Round 1 ratings was then depicted to each
expert and the experts again being asked to rate each of the indicators. All of the 32
experts who participated in Round 1 also participated in Round 2. In this study, there
was no need to continue with a 3rd round because the requirements (Table 2) were met.
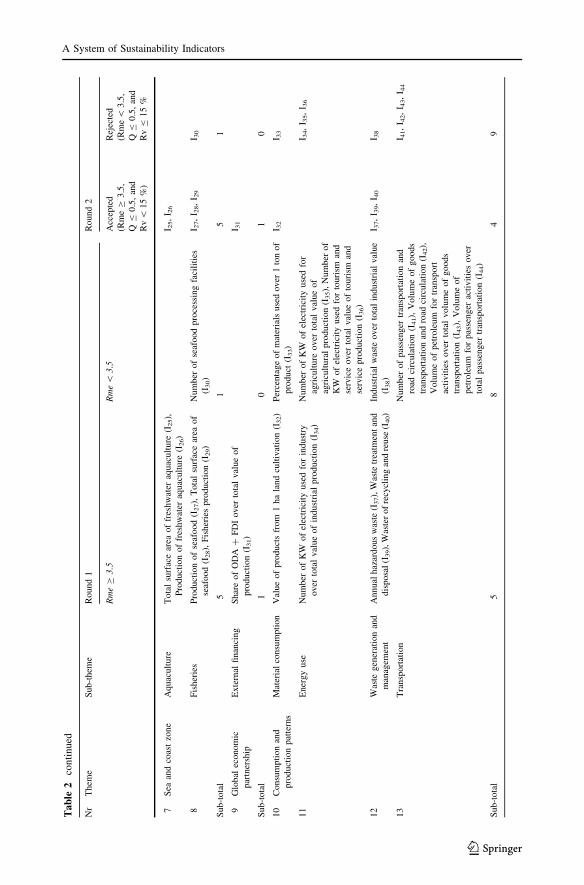
Table 2 just shows the 98 initial indicators (in the column of Round 1 grouped by theme
and sub-theme). The results of this process are presented in the next section.
4 Results
4.1 Round 1
As the results in Table 2 show, the scores of 68 SDIs rated above 3.5, with the remaining
30 SDIs receiving scores below 3.5. According to the rules of analysis for the rating mean
(Table 1), this meant that 30 SDIs are deemed not to be relevant to the case study area.
Moreover, the scoring values range from 1 to 5 (Fig. 2) and their frequency of occur-
rence in round 1 (R1) is:
Table 1 Rules to analyze the ratings from multiple experts using a Delphi approach (Chu and Hwang 2007)
Round (t ? 1) Round (t ? 2) Round (t ? 3)
Rating mean(Rmei) C 3.5
If Rmei C 3.5 and quartile deviation(Q) B 0.5 and the rating variance(Rvi) \ 15 %, then indicator i is accepted,and no further discussion concerningindicator i is needed
Rmei \ 3.5 Rmei C 3.5 or Rvi [ 15 % If Rmei C 3.5 and Q B 0.5 andRvi B 15 % then indicator i is accepted,and no further discussion concerningindicator i is needed
If Rmei \ 3.5 and Q B 0.5 and Rvi B 15 %,then indicator i is rejected, and no furtherdiscussion concerning indicator i is needed
A System of Sustainability Indicators
123
Ta
ble
2In
dic
ato
rsan
dre
sult
so
ftw
oD
elp
hi
rou
nd
s
Nr
Them
eS
ub-t
hem
eR
ound
1R
ound
2
Rm
eC
3.5
Rm
e\
3.5
Acc
epte
d
(Rm
eC
3.5
,
QB
0.5
,an
d
Rv
\15
%)
Rej
ecte
d
(Rm
e\
3.5
,
QB
0.5
,an
d
Rv
B15
%
1E
conom
ic
dev
elopm
ent
Mac
roec
onom
icper
form
ance
Gro
ssdom
esti
cpro
duct
(GD
P)
per
capit
a(I
1),
GD
Pin
the
pro
vin
ce(I
2),
Consu
mer
pri
cein
dex
(I7)
Val
ue-
added
agri
cult
ure
(I3),
Val
ue-
added
indust
ry-c
onst
ruct
ion
(I4),
Val
ue-
added
fish
ery
(I5),
Val
ue-
added
trad
e,to
uri
sm,
and
serv
ice
(I6)
I 1,
I 2,
I 7I 3
,I 4
,I 5
,I 6
2S
ust
ainab
lepubli
cfi
nan
ceP
erce
nt
of
pro
vin
cial
reven
ue/
nat
ional
reven
ue
(I8),
Per
cent
of
reven
ue
over
expen
dit
ure
(I9)
I 8,
I 9
3E
mplo
ym
ent
Shar
eof
emplo
ym
ent
inpopula
tion
rate
(I1
0),
Shar
eof
emplo
ym
ent
fem
ale
(I1
1),
Aver
age
sala
ryof
aw
ork
ing
labor
(I1
5),
Shar
eof
wom
en
inw
age
emplo
ym
ent
inth
enon-a
gri
cult
ura
l
sect
or
(I1
6),
Shar
eof
educa
ted
work
er(I
17)
Rat
ioof
fem
ale
of
work
ing
age
emplo
ym
ent
topopula
tion
(I1
2),
Rat
io
of
work
ing
age
emplo
ym
ent
tourb
an
popula
tion
(I1
3),
Rat
ioof
work
ing
age
emplo
ym
ent
toru
ral
popula
tion
(I1
4)
I 10,
I 11,
I 15,
I 16,
I 17
I 12,
I 13,
I 14
4In
form
atio
nan
d
com
munic
atio
n
tech
nolo
gie
s
Fix
edte
lephone
lines
per
100
popula
tion
(I1
8),
Num
ber
of
inte
rnet
subsc
riber
sper
100
popula
tion
(I1
9),
Mai
nm
obil
ephone
per
100
popula
tion
(I2
0)
I 18,
I 19,
I 20
5T
ouri
smT
ouri
sman
dse
rvic
ere
ven
ue
over
tota
l
reven
ue
(I2
1),
Rat
ioof
loca
lre
siden
tsto
touri
sts
inm
ajor
touri
stpro
vin
cean
d
des
tinat
ions
(I2
2)
I 21
I 22
6A
gri
cult
ure
Export
turn
over
over
GD
P(I
23),
Incr
ease
d
aver
age
annual
labor
pro
duct
ivit
y(I
24)
I 24
I 23
Sub-t
ota
l13
11
15
9
L. T. Hai et al.
123
Ta
ble
2co
nti
nued
Nr
Them
eS
ub-t
hem
eR
ound
1R
ound
2
Rm
eC
3.5
Rm
e\
3.5
Acc
epte
d
(Rm
eC
3.5
,
QB
0.5
,an
d
Rv
\15
%)
Rej
ecte
d
(Rm
e\
3.5
,
QB
0.5
,an
d
Rv
B15
%
7S
eaan
dco
ast
zone
Aquac
ult
ure
Tota
lsu
rfac
ear
eaof
fres
hw
ater
aquac
ult
ure
(I2
5),
Pro
duct
ion
of
fres
hw
ater
aquac
ult
ure
(I2
6)
I 25,
I 26
8F
isher
ies
Pro
duct
ion
of
seaf
ood
(I2
7),
Tota
lsu
rfac
ear
eaof
seaf
ood
(I2
8),
Fis
her
ies
pro
duct
ion
(I2
9)
Num
ber
of
seaf
ood
pro
cess
ing
faci
liti
es
(I3
0)
I 27,
I 28,
I 29
I 30
Sub-t
ota
l5
15
1
9G
lobal
econom
ic
par
tner
ship
Exte
rnal
finan
cing
Shar
eof
OD
A?
FD
Iover
tota
lval
ue
of
pro
duct
ion
(I3
1)
I 31
Sub-t
ota
l1
01
0
10
Consu
mpti
on
and
pro
duct
ion
pat
tern
s
Mat
eria
lco
nsu
mpti
on
Val
ue
of
pro
duct
sfr
om
1ha
land
cult
ivat
ion
(I3
2)
Per
centa
ge
of
mat
eria
lsuse
dover
1to
nof
pro
duct
(I3
3)
I 32
I 33
11
Ener
gy
use
Num
ber
of
KW
of
elec
tric
ity
use
dfo
rin
dust
ry
over
tota
lval
ue
of
indust
rial
pro
duct
ion
(I3
4)
Num
ber
of
KW
of
elec
tric
ity
use
dfo
r
agri
cult
ure
over
tota
lval
ue
of
agri
cult
ura
lpro
duct
ion
(I3
5),
Num
ber
of
KW
of
elec
tric
ity
use
dfo
rto
uri
sman
d
serv
ice
over
tota
lval
ue
of
touri
sman
d
serv
ice
pro
duct
ion
(I3
6)
I 34,
I 35,
I 36
12
Was
tegen
erat
ion
and
man
agem
ent
Annual
haz
ardous
was
te(I
37),
Was
tetr
eatm
ent
and
dis
posa
l(I
39),
Was
ter
of
recy
clin
gan
dre
use
(I4
0)
Indust
rial
was
teover
tota
lin
dust
rial
val
ue
(I3
8)
I 37,
I 39,
I 40
I 38
13
Tra
nsp
ort
atio
nN
um
ber
of
pas
senger
tran
sport
atio
nan
d
road
circ
ula
tion
(I4
1),
Volu
me
of
goods
tran
sport
atio
nan
dro
adci
rcula
tion
(I4
2),
Volu
me
of
pet
role
um
for
tran
sport
acti
vit
ies
over
tota
lvolu
me
of
goods
tran
sport
atio
n(I
43),
Volu
me
of
pet
role
um
for
pas
senger
acti
vit
ies
over
tota
lpas
senger
tran
sport
atio
n(I
44)
I 41,
I 42,
I 43,
I 44
Sub-t
ota
l5
84
9
A System of Sustainability Indicators
123

Ta
ble
2co
nti
nued
Nr
Them
eS
ub-t
hem
eR
ound
1R
ound
2
Rm
eC
3.5
Rm
e\
3.5
Acc
epte
d
(Rm
eC
3.5
,
QB
0.5
,an
d
Rv
\15
%)
Rej
ecte
d
(Rm
e\
3.5
,
QB
0.5
,an
d
Rv
B15
%
14
Pover
tyIn
com
epover
tyS
har
eof
urb
anpover
ty(I
45),
Shar
eof
rura
lpover
ty
(I4
6)
I 45,
I 46
15
Inco
me
ineq
ual
ity
Rat
ioof
shar
ein
pro
vin
cial
inco
me
of
hig
hes
tto
low
est
quin
tile
(I4
7)
I 47
16
San
itat
ion
Pro
port
ion
of
popula
tion
usi
ng
impro
ved
sanit
atio
n
faci
liti
es(I
48)
I 48
17
Dri
nkin
gw
ater
Pro
port
ion
of
urb
anpopula
tion
usi
ng
impro
ved
fres
hw
ater
(I4
9),
Pro
port
ion
of
rura
lpopula
tion
usi
ng
impro
ved
fres
hw
ater
(I5
0)
I 49,
I 50
18
Acc
ess
toen
ergy
Pro
port
ion
of
rura
lpopula
tion
usi
ng
impro
ved
elec
tric
ity
(I5
1)
I 51
19
Liv
ing
condit
ions
Pro
port
ion
of
urb
anpopula
tion
livin
gin
slum
s(I
52)
I 52
Sub-t
ota
l7
17
1
20
Gover
nan
ceC
orr
upti
on
Num
ber
of
offi
cial
shav
ing
pai
dbri
des
(I5
3)
I 53
21
Cri
me
Num
ber
of
reco
rded
crim
esper
10,0
00
popula
tion
(I5
4)
I 54
22
Saf
ety
Num
ber
of
reco
rded
acci
den
tsper
10,0
00
popula
tion
(I5
5)
I 55
Sub-t
ota
l3
03
0
L. T. Hai et al.
123

1.
Ta
ble
2co
nti
nued
Nr
Them
eS
ub-t
hem
eR
ound
1R
ound
2
Rm
eC
3.5
Rm
e\
3.5
Acc
epte
d
(Rm
eC
3.5
,
QB
0.5
,an
d
Rv
\15
%)
Rej
ecte
d
(Rm
e\
3.5
,
QB
0.5
,an
d
Rv
B15
%
23
Hea
lth
Mort
alit
yU
rban
mort
alit
yra
teunder
5yea
rsold
(I5
6),
Rura
l
mort
alit
yra
teunder
5yea
rsold
(I5
7)
I 56,
I 57
24
Hea
lth
care
del
iver
yS
har
eof
inves
tmen
tin
hea
lth
sect
or
toto
tal
inves
tmen
t(I
58),
Shar
eof
hosp
ital
bed
sper
10,0
00
popula
tion
(I5
9),
Shar
eof
doct
ors
per
10,0
00
popula
tion
(I6
0),
Pro
port
ion
of
popula
tion
par
tici
pat
ing
hea
lth
insu
rance
(I6
1),
Per
centa
ge
of
chil
dre
nunder
1yea
rold
of
full
imm
uniz
atio
nvac
cines
(I6
2)
I 58,
I 59,
I 60,
I 61,
I 62
25
Nutr
itio
nal
stat
us
Shar
eof
mal
nutr
itio
nst
atus
under
5yea
rsold
(I6
3)
I 63
26
Hea
lth
stat
us
and
risk
s
Mort
alit
yra
tedue
tom
alar
iaper
10,0
00
popula
tion
(I6
4),
Lif
eex
pec
tancy
atbir
th(I
66)
Mort
alit
yra
tedue
toH
IVper
10,0
00
popula
tion
(I6
5)
I 64,
I 65,
I 66
Sub-t
ota
l8
19
0
27
Educa
tion
Educa
tional
level
Rat
eof
chil
dre
nre
achin
gpri
mar
yed
uca
tion
(I6
7),
Pri
mar
ysc
hool
enro
llm
ent
per
popula
tion
aged
(I6
8),
Popula
tion
rate
over
the
age
of
18
gra
duat
edfr
om
hig
hsc
hool
per
tota
lpopula
tion
over
18
(I6
9)
I 67,
I 68
I 69
28
Lit
erac
yA
dult
illi
tera
cyra
te(I
70)
I 70
29
Educa
tional
fundam
enta
l
Num
ber
of
schools
of
educa
tional
stan
dar
ds
(I7
1),
Inves
tmen
tsh
are
ined
uca
tion
(I7
2)
I 71,
I 72
Sub-t
ota
l6
04
2
30
Cult
ure
Cult
ura
lfu
ndam
enta
lR
ate
of
cult
ura
lvil
lages
(I7
3),
Rat
eof
cult
ura
lhouse
hold
stan
dar
d(I
74)
I 73,
I 74
Sub-t
ota
l0
20
2
A System of Sustainability Indicators
123

Ta
ble
2co
nti
nued
Nr
Them
eS
ub-t
hem
eR
ound
1R
ound
2
Rm
eC
3.5
Rm
e\
3.5
Acc
epte
d
(Rm
eC
3.5
,
QB
0.5
,an
d
Rv
\15
%)
Rej
ecte
d
(Rm
e\
3.5
,
QB
0.5
,an
d
Rv
B15
%
31
Dem
o-g
raphic
sP
opula
tion
Popula
tion
gro
wth
rate
(I7
5),
Mec
han
ical
popula
tion
gro
wth
rate
(I7
6),
Dep
enden
cyra
tio
(I7
7)
I 75,
I 76,
I 77
Sub-t
ota
l3
03
0
32
Nat
ura
lhaz
ards
Vuln
erab
ilit
yto
nat
ura
lhaz
ards
Rat
eof
pro
vin
cial
popula
tion
livin
gin
haz
ards
pro
ne
area
s(I
78)
I 78
33
Dis
aste
rpre
par
ednes
s
and
resp
onse
Eco
nom
ican
dhum
anlo
ssdue
tonat
ura
ldis
aste
rs
(I7
9)
I 79
Sub-t
ota
l2
02
0
34
Atm
osp
her
eC
lim
ate
chan
ge
Incr
ease
dav
erag
ete
mper
ature
ina-
ten
yea
r(I
80)
I 80
35
Ozo
ne
layer
dep
leti
on
Num
ber
of
air
condit
ions
and
refr
iger
ates
over
10,0
00
peo
ple
(I8
1)
I 81
36
Air
qual
ity
Dust
(I8
2),
SO
2(I
83),
NO
2(I
84),
Pb
(I8
5)
I 82,
I 83,
I 84,
I 85
Sub-t
ota
l4
25
1
37
Lan
dA
gri
cult
ure
Rat
eof
chan
ge
of
agri
cult
ura
lla
nd
(I8
6),
Shar
eof
agri
cult
ura
lir
rigat
edla
nd
(I8
7),
Ara
ble
and
per
man
ent
cropla
nd
area
(I8
8)
I 86,
I 87,
I 88
38
Lan
dst
atus
Poin
tsof
coas
tal
line
erosi
on
(I9
0)
Soil
erosi
on
(I8
9)
I 90
I 89
39
Fore
sts
Rat
eof
chan
ge
of
man
gro
ve
fore
st(I
91),
Pro
port
ion
of
fore
stla
nd
cover
edby
nat
ura
l
fore
st(I
92),
Rat
eof
fore
stco
ver
age
and
long-
term
indust
rial
tree
sover
fore
stla
nd
(I9
3),
Are
a
of
fore
sttr
ees
under
sust
ainab
lefo
rest
man
agem
ent
(I9
4)
I 91,
I 93,
I 94
I 92
Sub-t
ota
l8
17
2
L. T. Hai et al.
123

Ta
ble
2co
nti
nued
Nr
Them
eS
ub-t
hem
eR
ound
1R
ound
2
Rm
eC
3.5
Rm
e\
3.5
Acc
epte
d
(Rm
eC
3.5
,
QB
0.5
,an
d
Rv
\15
%)
Rej
ecte
d
(Rm
e\
3.5
,
QB
0.5
,an
d
Rv
B15
%
40
Fre
sh-w
ater
Wat
erquan
tity
Wat
eruse
inte
nsi
tyby
econom
icac
tivit
y(I
96)
Pro
port
ion
of
tota
lw
ater
reso
urc
esuse
d
(I9
5)
I 96
I 95
41
Wat
erqual
ity
Pre
sence
of
faec
alco
lifo
rms
infr
eshw
ater
(I9
7),
BO
D(I
98)
I 97,
I 98
Sub-t
ota
l3
13
1
Tota
l68
30
69
29
A System of Sustainability Indicators
123

If the scoring value is equal to 1, the indicator is highly irrelevant (this happened only
66 times or 2.1 % of the occurrences is the highest value);
2. If the scoring value is equal to 2, the indicator is likely irrelevant (this happened 342
times or 10.9 % of the occurrences);
3. If the scoring value is equal to 3, the indicator is more or less relevant (this happened
1,107 times or 35.3 % of the occurrences is the highest value);
4. If the scoring value is equal 4, the indicator is likely relevant (this happened 892 times
or 28.4 % of the occurrences);
5. If the scoring value is equal to 5, the indicator is highly relevant (this happened 729
times or 23.2 % of the occurrences).
In short, the score that received the most votes was rating 3 (defined as ‘more or less
relevant’) with 35.3 % of the votes, followed by rating 4 (defined as ‘likely relevant) and
rating 5 (defined as ‘highly relevant’).
4.2 Round 2
The rating variance and the quartile deviation from round one were also communicated as
shown in Tables 2 and Fig. 3. The data shows that:
1. The rating means of 69 indicators are above 3.5. In addition, these indicators have a
quartile deviation below or equal to 0.5, and a rating variance of less than 15 %.
According to the rules, therefore, these indicators are considered to be relevant for the
province;
2. Conversely, the rating means of 29 indicators are lower than 3.5, the quartile
deviations are less than, or equal to 0.5, and the rating variances are less than 15 %.
Consequently, these indicators are rejected. This means that they are not relevant to
the study area.
The scoring values range from 1 to 5 (Fig. 2) and their frequency of occurrence in round
2 (R2) is:
1. If the scoring value is equal to 1, the indicator is highly irrelevant (this happened only
55 times or 1.8 % of the occurrences);
2. If the scoring value is equal to 2, the indicator is likely irrelevant (this happened 345
times or 11.0 % of the occurrences);
3. If the scoring value is equal to 3, the indicator is more or less relevant (this happened
1,107 times or 35.3 % of the occurrences);
4. If the scoring value is equal 4, the indicator is likely relevant (this happened 908 times
or 29.0 % of the occurrences);
5. If the scoring value is equal to 5, the indicator is highly relevant (this happened 721
times or 23.0 % of the occurrences).
The figure shows that the ratings 3, 4, and 5 are most prevalent (this means that the
indicator is likely relevant). This is followed by the ratings 2 and 1, respectively. In other
words, almost all experts indicated or agreed on the scales of each indicator from more or
less relevant to highly relevant (87 % in Round 1 and 87.2 % in Round 2), significantly.
The ratio of experts who change their ratings for each indicator in all rounds as shown in
Fig. 3 is:
1. If Rv is equal to 0 %, its frequency is the highest value (this happened 70 times);
2. If Rv is equal to 3 %, its frequency is happened 34 times;
L. T. Hai et al.
123
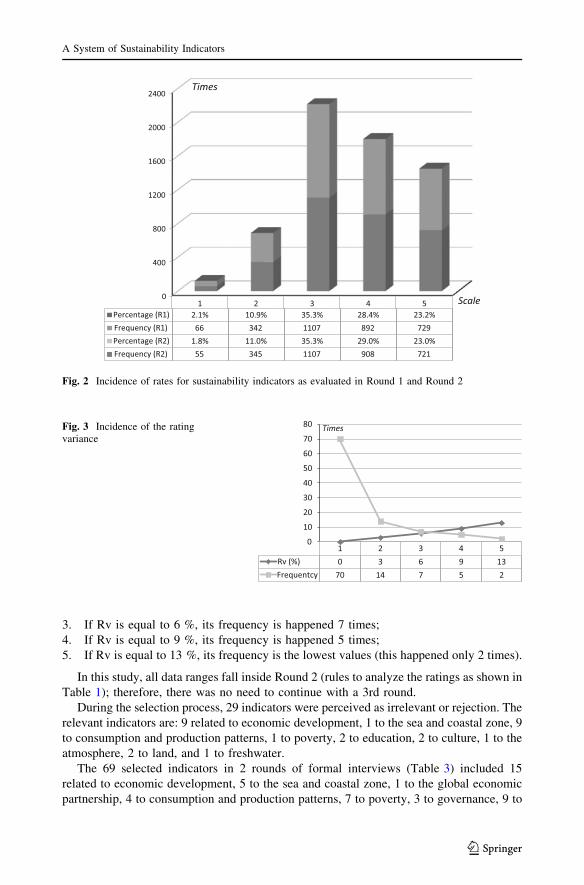
3. If Rv is equal to 6 %, its frequency is happened 7 times;
4. If Rv is equal to 9 %, its frequency is happened 5 times;
5. If Rv is equal to 13 %, its frequency is the lowest values (this happened only 2 times).
In this study, all data ranges fall inside Round 2 (rules to analyze the ratings as shown in
Table 1); therefore, there was no need to continue with a 3rd round.
During the selection process, 29 indicators were perceived as irrelevant or rejection. The
relevant indicators are: 9 related to economic development, 1 to the sea and coastal zone, 9
to consumption and production patterns, 1 to poverty, 2 to education, 2 to culture, 1 to the
atmosphere, 2 to land, and 1 to freshwater.
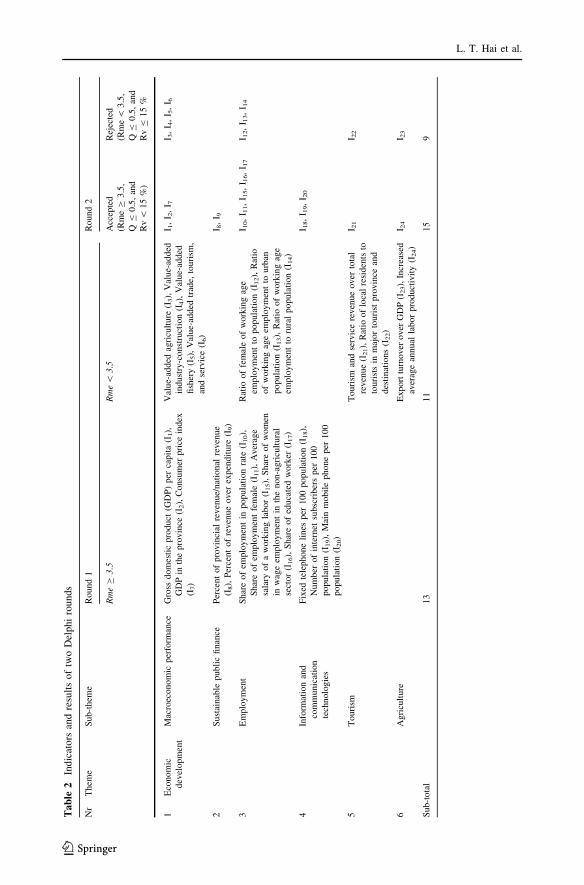
The 69 selected indicators in 2 rounds of formal interviews (Table 3) included 15
related to economic development, 5 to the sea and coastal zone, 1 to the global economic
partnership, 4 to consumption and production patterns, 7 to poverty, 3 to governance, 9 to
Fig. 2 Incidence of rates for sustainability indicators as evaluated in Round 1 and Round 2
Fig. 3 Incidence of the ratingvariance
A System of Sustainability Indicators
123
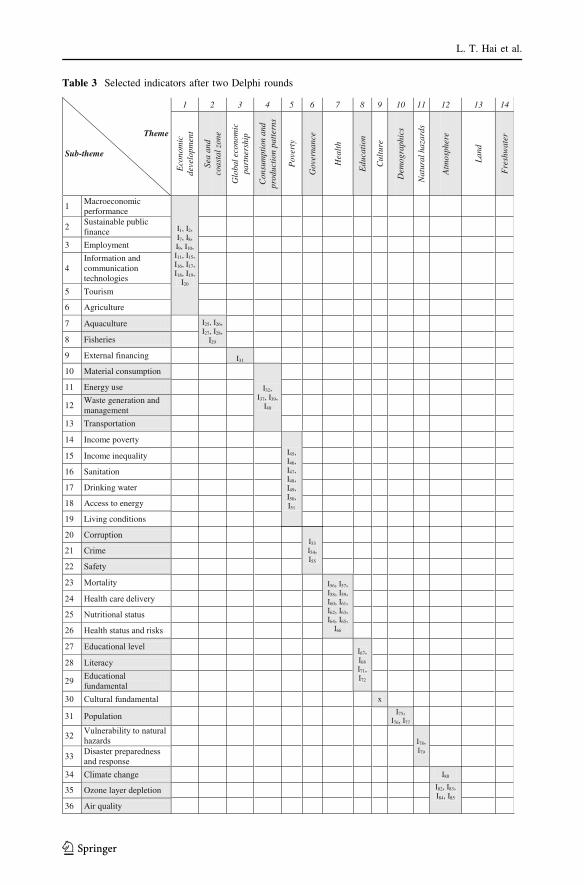
Table 3 Selected indicators after two Delphi rounds
Theme
Sub-theme
1 2 3 4 5 6 7 8 9 10 11 12 13 14
Eco
nom
ic
deve
lopm
ent
Sea
and
coas
tal z
one
Glo
bal e
cono
mic
pa
rtne
rshi
p
Con
sum
ptio
n an
d pr
oduc
tion
pat
tern
s
Pov
erty
Gov
erna
nce
Hea
lth
Edu
cati
on
Cul
ture
Dem
ogra
phic
s
Nat
ural
haz
ards
Atm
osph
ere
Lan
d
Fre
shw
ater
1Macroeconomic performance
I1, I2, I7, I8, I9, I10, I11, I15, I16, I17, I18, I19,
I20
2Sustainable public finance
3 Employment
4Information and communication technologies
5 Tourism
6 Agriculture
7 Aquaculture I25, I26,I27, I28,
I298 Fisheries
9 External financing I31
10 Material consumption
I32,I37, I39,
I40
11 Energy use
12Waste generation and management
13 Transportation
14 Income poverty
I45, I46,I47,I48,I49, I50,I51
15 Income inequality
16 Sanitation
17 Drinking water
18 Access to energy
19 Living conditions
20 CorruptionI53I54,I55
21 Crime
22 Safety
23 Mortality I56, I57,I58, I59, I60, I61, I62, I63, I64, I65,
I66
24 Health care delivery
25 Nutritional status
26 Health status and risks
27 Educational level I67, I68I71, I72
28 Literacy
29 Educational fundamental
30 Cultural fundamental x
31 Population I75, I76, I77
32 Vulnerability to natural hazards I78,
I7933 Disaster preparedness and response
34 Climate change I80
35 Ozone layer depletion I82, I83, I84, I85
36 Air quality
L. T. Hai et al.
123

health, 4 to education, 3 to demographics, 2 to natural hazards, 5 to the atmosphere, 7 to
land, and 3 to freshwater.
5 Discussion
Thai Binh Province is significant in the coastal northern delta of Vietnam in term of
geography and economy. Thai Binh has historically been an agricultural province but
increasing industrial operations have led to emerging problems associated with population
mitigation, employment and environmental degradation (DONRE 2011). Thai Binh is still
among the poorest provinces in Vietnam. Therefore, the Doi moi transition is a complex
process but Vietnam specific features are both necessary and possible because of the
flexibilities (Boothroyd 2000). The process has been helping Thai Binh to become a rich
province and to become an important base for decision makers and planners by 2015 and
for a vision in 2020.
Almost all rating means of the selected indicators range from three to five. This shows
that the experts deemed the indicators to be, ‘more or less relevant’, ‘likely relevant’ or
‘highly relevant’ to the study area in the majority (86.9 %) of cases.
The results indicate that the experts were reluctant to change their Round 1 rating in
Round 2. Seventy of the 98 (71.4 %) SDIs received the same rating by each expert during
the two rounds (i.e. the rating variance is 0). This suggests that the experts did not change
their initial (round 1) rating even after viewing the Round 1 responses from the other
experts for the majority of the SDIs. These indicators that the rating variance is 0 are: GDP,
Consumer price index (CPI), Share of women in wage employment in the non-agricultural
sector, Total surface area of freshwater aquaculture, Fisheries production, Annual haz-
ardous waste, Waste treatment and disposal, Waster of recycling and reuse, Proportion of
urban population using improved freshwater, Proportion of rural population using
improved freshwater, Urban/rural mortality rate under 5 years old, Percentage of children
under 1 year old of full immunization vaccines, Share of malnutrition status under 5 years
old, Life expectancy at birth, etc., Conversely, experts did change their mind for the
remaining 28 SDIs (i.e. the SDI had a rating variances are above 0) and assigned a different
preference in Round 2. This suggests that the sharing of Round 1 responses may have
Table 3 continued
Theme
Sub-theme
1 2 3 4 5 6 7 8 9 10 11 12 13 14
Eco
nom
ic
deve
lopm
ent
Sea
and
coas
tal z
one
Glo
bal e
cono
mic
pa
rtne
rshi
p
Con
sum
ptio
n an
d pr
oduc
tion
pat
tern
s
Pov
erty
Gov
erna
nce
Hea
lth
Edu
cati
on
Cul
ture
Dem
ogra
phic
s
Nat
ural
haz
ards
Atm
osph
ere
Lan
d
Fre
shw
ater
37 Agriculture I86, I87, I88, I90,I91, I93,
I94
38 Land status
39 Forests
40 Water quantity I96,I97, I9841 Water quality
A System of Sustainability Indicators
123
influenced some experts to change their Round 2 responses in some cases, a key benefit of
adopting the Delphi process.
The SDIs that were rated as being the most relevant (i.e. received a rating of 4 or 5) by
the experts are:
• GDP
• Total surface area of freshwater aquaculture
• Share of rural poverty
• Share of agricultural irrigated land
• Production of freshwater aquaculture
• Production of seafood
• Arable and permanent cropland area
• etc.
It is noticeable that many of these SDIs relate to agricultural and aqua-cultural activi-
ties, which is likely a result of the fact that Thai Binh is an agricultural and coastal area.
That is why agricultural and aqua-cultural activities have been deemed by the experts as
important factors to address poverty, infrastructure development, and environmental pro-
tection (DONRE 2010).
Of 29 rejected indicators, the SDIs receiving the lowest rating means included:
• Value-added agriculture, Value-added industry-construction, Value-added fishery, and
Value-added trade, tourism, and service. These may have received low ratings because
the two indicators of GDP per capital and GDP were deemed to adequately capture the
‘economic development’ theme
• Ratio of local residents to tourists in major tourist province and destinations, and
Export turnover over GDP. These may have received low rating because tourism and
export activities are not currently key issues in Thai Binh.
While these indicators were deemed to be unnecessary now, they may become relevant
in the future as the characteristics of the Thai Binh provice change over time. Therefore,
these rejected indicators, along with the whole SDI set, should be re-evaluated and
rechecked on a yearly basis (Hai et al. 2009; Gobin et al. 2012).
More indicators (69) were selected for the Thai Binh province than in some other
provinces in Vietnam [e.g. Quang Tri (37), Thai Nguyen (35), Quang Nam (22), and Lam
Dong (17)]. One of the possible main reasons is that more up to date indicators were added
to the Thai Binh set of SDIs (e.g. for climate change, ozone layer depletion, energy use,
waster reuse, vulnerability to natural hazards, and disaster preparedness and response)
(DONRE 2012). While it is different to compare SDI sets, due to the specific socio-
economic and cultural characteristics of the different provinces (Hai et al. 2009; Hai 2010),
research has shown that, in some cases, smaller indicator sets may be inadequate to convey
the message and may also dilute the purpose (Hathan and Reddy 2010). The selection
process involved managers, decision makers, and scientists. Additionally, local people
should also be involved as participants in the selection process as well. Based on the results
of this study and the United Nation’s guidelines in 2007 (UN 2007a), this study can
developed into a set of SDIs and provided suggestions on how to adapt them to provincial
conditions and priorities. In order to easily use, each indicator need contain a short
description (e.g. theme, sub-theme, brief definition, and description).
While this study adopted a rigorous methodology, the following potential limitations
have been identified by the project team:
L. T. Hai et al.
123
• As the Delphi approach is a consensus method, it aims through consensus to identify a
‘‘central opinion’’, and consequently, important minority issues may be missed
(Gallagher et al. 1996). Delphi has been applied in Vietnam for various areas (e.g.
health and environmental aspects, clean development mechanism projects, and climate
change, etc.) in different places (e.g. Quang Tri province, Binh Thuan province, Quang
Ninh province, and Tay Nguyen region, etc.);
• Here might have been subjective elements in the manner of selection of the experts,
although they are ‘‘representative’’ professionals (Hai 2010). For example, asking too
specific a group to participate, could limit the scope of opinions and expertise; it also
might be more appropriate to involve a multidisciplinary group rather than a highly
specialised team (Ryan et al. 2001). Both the panel composition and the feedback can
influence the judgements made (Campbell et al. 2002);
• Given that response rates for the Delphi method can be low, it may be pragmatic to
select participants who have an interest and involvement in the question being
explored; this should however be balanced against a need to seek relative impartiality
(Hasson et al. 2000);
• It is the first time that the Delphi method has been applied to select an SDI’s set for
Thai Binh. Furthermore, this study shows that such a system of indicators requires
continual improvement and update e.g. through public consultation of the stakeholders
and more local experts.
6 Conclusions
Indicators can lead to better decisions and more effective actions by simplifying, clari-
fying, and making aggregated information available to policy makers (UN 2007a). The
Delphi approach is a proven method for selecting indicators. The method is a well-known
structured communication technique, which relies on a panel of experts to solve complex
problems (Landaeta 2006). This study showed that it is possible to define a set of indicators
for SD in Thai Binh (Vietnam), by applying the Delphi method. This can be done using
methods that make the selection process more objective and transparent.
The study selected 69 indicators and omitted 29 indicators from the initial indicator set,
based on the opinions of the 32 experts in two rounds of feedback. The selected indicators
are tools for measuring SD processes at the provincial level. In the future, the rejected
indicators should be re-evaluated and potentially re-selected if needs and conditions in
Thai Binh and Vietnam change.
The results provide useful information and a scientific base as the first step of the SD
process for the future studies and for decision makers and planners, particularly in Thai
Binh by 2015 and a vision in 2020.
Acknowledgments This study is a part of the project: ‘‘A scientific base for establishing an indicatorsystem for sustainable development: a case study in the Thai Binh province, Vietnam’’ funded by VietnamNational Foundation for Science and Technology (NAFOSTED) under grant number 105.99-2011.08. Wewould like to thank the Thai Binh People’s Committee and Departments (e.g. Natural Resources andEnvironment, Science and Technology, Agriculture and Rural Development, Planning and Investment,Transport, Trade), Institutes, and Universities for their kindness and supplying materials; experts who weremost collaborative in completing the questionnaires and in providing feedback on the results. We would liketo thank Mr. James Hennessy (Australian—Sustainable Development Research Assistant, Vietnam NationalMuseum of Nature) who helped us ensure correctness of English.
A System of Sustainability Indicators
123
References
ALM (Adaptation Learning Mechanism). (2009). Vietnam Country profile. http://www.adaptationlearning.net. Accessed 8 February 2012.
Boothroyd, P. (2000). Doi moi, poverty reduction, and the role of the academy. In International conferenceon Vietnam in the 20th Century, Hanoi, 19th–21st September 2000. http://www.chs.ubc.ca/lprv/PDF/lprv0600.pdf. Accessed 8 March 2012.
Campbell, S., Braspenning, J., Hutchinson, A., & Marshall, M. (2002). Research methods used in devel-oping and applying quality indicators in primary care. Quality & Safety Health Care, 11, 358–364.
Chu, H. C., & Hwang, G. J. (2007). A Delphi-based approach to developing experts system with thecooperation of multiple experts. Experts System with Application. doi:10.1016/j.eswa.2007.05.034.
Cochran, S. W. (1983). The Delphi method: Formulation and refining group judgments. Journal of HumanSciences, 2, 111–117.
DCMS. (1999). Sustainable tourism indicators workshop. 7th May and 3rd June. London: SMS.Delbecq, A. L., & Van de Ven, A. H. (1975). Group techniques for program planning: A guide to nominal
group and Delphi processes. Glenview, IL: Gustafson D.H. Scott-Foreman.DONRE. (2010). Environmental protection program by 2015. Thai Binh, Vietnam.DONRE. (2011). Environmental situation of Thai Binh province in 2010. Thai Binh, Vietnam.DONRE. (2012). Building action plans for climate change adaptation in Thai Binh province (2011–2015).
Thai Binh, Vietnam.Gallagher, M., Bradshaw, C., & Nattress, H. (1996). Policy priorities in diabetes care: A Delphi study.
Quality Health Care, 5, 3–8.Gobin, A., Linh, P. H., Hai, L. T., Hens, L. (2012). Social impacts of desertification. This study in the frame
of the Bilateral Belgian—Vietnamese Project on ‘‘Impact of global climate change and desertificationon the environment and society in Southern Centre of Vietnam (a case study in the Binh Thuanprovince)’’. VITO, Mol, Belgium.
Hai, L. T. (2010). Health and environment: Core aspects of sustainable development in the province ofQuang Tri (Vietnam). Faculty of Medicine and Pharmacy, Vrije Universiteit Brussel (VUB), Brussels,Belgium.
Hai, L. T., Hai, P. H., Khoa, N. T., & Hens, L. (2009). Indicators set for sustainable development indicators:A case study in the province of Quang Tri, Vietnam. International Journal of Human Ecology, 27(3),217–227.
Hai, L. T., Hai, P. H., Thai, C. L., Huge, J., Ahenkan, A., & Quynh, L. X., et al. (2011). Software forsustainability assessment: A case study in Quang Tri province, Vietnam. Environmental ModelAssessment. Doi:10.1007/s10666-011-9264-4.
Hart, S. (1997). Strategic for a sustainable development. Harvard Business Review, 1997, 67–76.Hasson, D., Keeney, S., & McKenna, H. (2000). Research guidelines for the Delphi survey technique.
Journal of Advanced Nursing, 32, 1008–1015.Hathan, H. S. K., & Reddy, B. S. (2010). Selection criteria for sustainable development indicators. Indira
Gandhi Institute of Development Research (IGIDR), India.Helmer, O. (1983). Looking forward: A guide to future research. Beverly Hills, CA: Sage. http://www.
hta.nhsweb.nhs.uk/fullmono/mon505.pdf. Accessed 20 June 2012.Hens, L., & Nath, B. (2005). The world summit on sustainable development. The Johannesburg Conference
(pp. 17–18). Berlin: Springer.Huge, J., Hai, L. T., Hai, P. H., Jan, K., & Hens, L. (2009). Indicators for sustainability assessment for a
clean development mechanism project in Vietnam. International Journal of Environment, Develop-ment and Sustainability, 7(4), 519–536.
Keeney, S., Hasson, F., & McKenna, H. P. (2001). A critical review of the Delphi technique as a researchmethodology for nursing. International Journal of Nursing Studies, 28(2001), 195–200.
Landaeta, J. (2006). Current validity of the Delphi method in social sciences. Technological Forecasting andSocial, 73, 467–482.
Murry, J. W., & Hammors, J. O. (1995). Delphi, a versatile methodology for conducting qualitative research.The Review of Higher Education, 18, 423–436.
NASA. (2003). Sustainable development indicators. http://www.hq.nasa.gov/iwgsdi/Welcome.html.Accessed 20 February 2012.
Ryan, M., Scott, D. A., Reeves, C., Bate, A., & Teijlingen, V. E. R. (2001). Eliciting public preferences forhealthcare: A systematic review of techniques. Health Technology Assessment, 5(5), 1–186.
UN. (1992). Information for decision-making and participation. http://www.un.org/esa/dsd/susdevtopics/sdt_infodecimaki.shtml. Accessed 31 October 2012.
L. T. Hai et al.
123
UN. (2001). Indicators of sustainable development: Guidelines and methodologies. New York: UnitedNations publication.
UN. (2007a). Indicators of sustainable development: Guidelines and methodologies (3rd Ed.). New York:United Nations Publication.
UN. (2007b). United Nations and sustainability. http://www.un.org/en/sustainability. Accessed 28 February2012.
UN. (2012). United Nations conference on sustainable development, Rio ? 20. http://sustainabledevelopment.un.org/rio20.html. Accessed 5 November 2012.
VIDS. (2005). Formulating framework for sustainable development indicators in Vietnam. http://www.vids.org.vn/en/asp/NewsDetail.asp?area=1&cat=828&ID=276. Accessed 5 November 2012.
WCED. (1987). Report on the world commission on environment and development: General assembly. 96thplenary meeting. http://www.un.org/documents/ga/res/42/ares42-187.htm. Accessed on 5 June 2012.
Yusuf, A. A., & Francisco, H. (2009). Climate change vulnerability mapping for Southeast Asia. IDRC,Sida, EEPSA & ACDI.
A System of Sustainability Indicators
123