a user assessment of coastal ocean observation systems in the gulf
TRANSCRIPT
A USER ASSESSMENT OF COASTAL OCEAN OBSERVATION SYSTEMS IN THE GULF OF MEXICO
Prepared for:
Texas Sea Grant Program Texas A&M University System
by:
Aimee R. Thurlow, Graduate Assistant Researcher Texas Transportation Institute
C. James Kruse,
Director, Center for Ports & Waterways Texas Transportation Institute
and
David H. Bierling,
Associate Transportation Researcher Texas Transportation Institute
June 2004

Texas Transportation Institute iii GCOOS Project Report
TABLE OF CONTENTS Page Project Description....................................................................................................................... 1 NOLC, NOPP, IOOS and Ocean US Role ......................................................................... 1 Description of GCOOS Project .......................................................................................... 1 What TTI/Sea Grant is doing for the Project...................................................................... 2 Summary of Existing Observing Systems ................................................................................... 3 Texas................................................................................................................................... 4 Louisiana ............................................................................................................................ 5 Florida................................................................................................................................. 6 Government ........................................................................................................................ 7 User Groups and Needs ............................................................................................................. 12 Environment Monitoring User ......................................................................................... 13 Fishermen User................................................................................................................. 14 Government User.............................................................................................................. 15 Maritime Vessels User ..................................................................................................... 16 Oil Drilling and Production User ..................................................................................... 19 Recreational User ............................................................................................................. 21 Research User ................................................................................................................... 22 Recommendations and Conclusions .......................................................................................... 25 References.................................................................................................................................. 27 Appendix 1: Interviews.............................................................................................................. 30 Appendix 2: Future Contacts ..................................................................................................... 31 Appendix 3: Observation System Data Sets .............................................................................. 32
Texas Transportation Institute 1 GCOOS Project Report
A USER ASSESSMENT OF COASTAL OCEAN OBSERVATION SYSTEMS IN THE GULF OF MEXICO
NOLC, NOPP, IOOS and Ocean US Role
The United States is a participant in the Global Ocean Observing System (GOOS), which is being planned and implemented under the sponsorship of United Nations agencies. The U.S. Congress asked the National Oceanographic Partnership Program (NOPP), lead by the National Ocean Research Leadership Council (NORLC), to prepare a plan for the U.S. component of GOOS, referred to as the Integrated Ocean Observing System (IOOS). The NORLC established the Ocean US Office with the mandate to plan and coordinate the IOOS. Most NOPP agencies have signed a Memorandum of Understanding to support Ocean US activities. The IOOS consists of two parts: (1) the U.S. contribution to an intergovernmental, global component focused on effects of climate variability and marine services, and (2) a coastal ocean observing system for U.S. coastal waters, including estuaries, the EEZ, and the Great Lakes. The IOOS is not merely a measurement system. It is an end-to-end system designed to make measurements, manage data, and produce and distribute information based on that data for the benefits of users. The objective of the IOOS are to improve capabilities for:
• Detecting and forecasting oceanic components of climate variability; • Facilitating safe and efficient marine operations; • Ensuring national security; • Managing resources for sustainable use; • Preserving and restoring healthy marine ecosystems; • Mitigating natural hazards; • Ensuring public health;
The coastal ocean observing component of the IOOS is being designed to consist of two parts: (1) a national backbone of measurements common throughout the system and implemented mainly by the federal government and with federal support, and (2) a series of ten Regional Coastal Ocean Observing Systems, governed by Regional Associations, responsible for measurements and products of special needs to the regions and not provided totally by the national backbone. To qualify as Regional Associations, these organizations must:
1) Identify and develop GCOOS user base and requirements 2) Create a governance structure for GCOOS 3) Develop a business plan.
Texas Transportation Institute 2 GCOOS Project Report
Description of GCOOS Project GCOOS is a Regional Association that enhances the “National Backbone” of ocean observing systems. Two other observing systems, Gulf of Maine Coastal Ocean Observing System (GoMOOS) and South Eastern Coastal Ocean Observing Systems (SEACOOS) are currently operational. The Gulf of Mexico is an important economic region for the United States. It contains over 72% of the United States offshore petroleum drilling operations and six of the ten largest ports by Cargo Tonnage Ranking1; which bring in over half of the nations import-export tonnage. The Gulf supports major shrimp and fisheries industry, with five of the nation’s ten top fishing ports. Many tourists visit the Gulf’s beaches every year. In addition, most of the Gulf’s population resides in low-lying areas that are prone to flooding. An effective observation system will be useful for protection of the Gulf’s population, economy and ecosystem and in doing so will enhance social, environmental and economic sustainability. What TTI/Sea Grant is doing for the Project Texas Transportation Institute (TTI) with the support of Texas Sea Grant is collaborating with the GCOOS program to assist with the first operational stage of the Gulf of Mexico Regional Backbone: identify and develop GCOOS user base and requirements. The GoMOOS organization has already completed this operational stage and assessment and posted a paper2 on lessons learned from their first user survey. Using this paper as a reference along with information provided by Josie Quintrell of GoMOOS, we were able to ascertain what methods did and did not work for a successful survey. Mass contact of users resulted in little response from the user base and what response did occur yielded little information. It was highly stressed that we should conduct one-on-one interviews with the user community. The interviewer should have a clear understanding of GCOOS and the ocean environment to best understand the users’ needs. To begin our survey we identified the different user groups in the Gulf of Mexico. We then researched user applications so we could best fit questions to the specific user. We conducted in-depth interviews or communications with twenty-seven individuals (listed in Appendix 1) representing a cross-section of user groups. These interviews/communications along with other information sources (literature, informal interviews, etc.) formed the basis of the assessment of user needs for this report.
1 American Association of Port Authorities, AAPA online, http://www.aapa-ports.org/pdf/2002_US_Cargo_Rank.pdf 2 Ocean.US, “Lessons Learned from Gulf of Maine Ocean Observing System (GoMOOS) From Start-Up to Operations” http://www.ocean.us/documents/doc-catalogue.jsp
Texas Transportation Institute 3 GCOOS Project Report
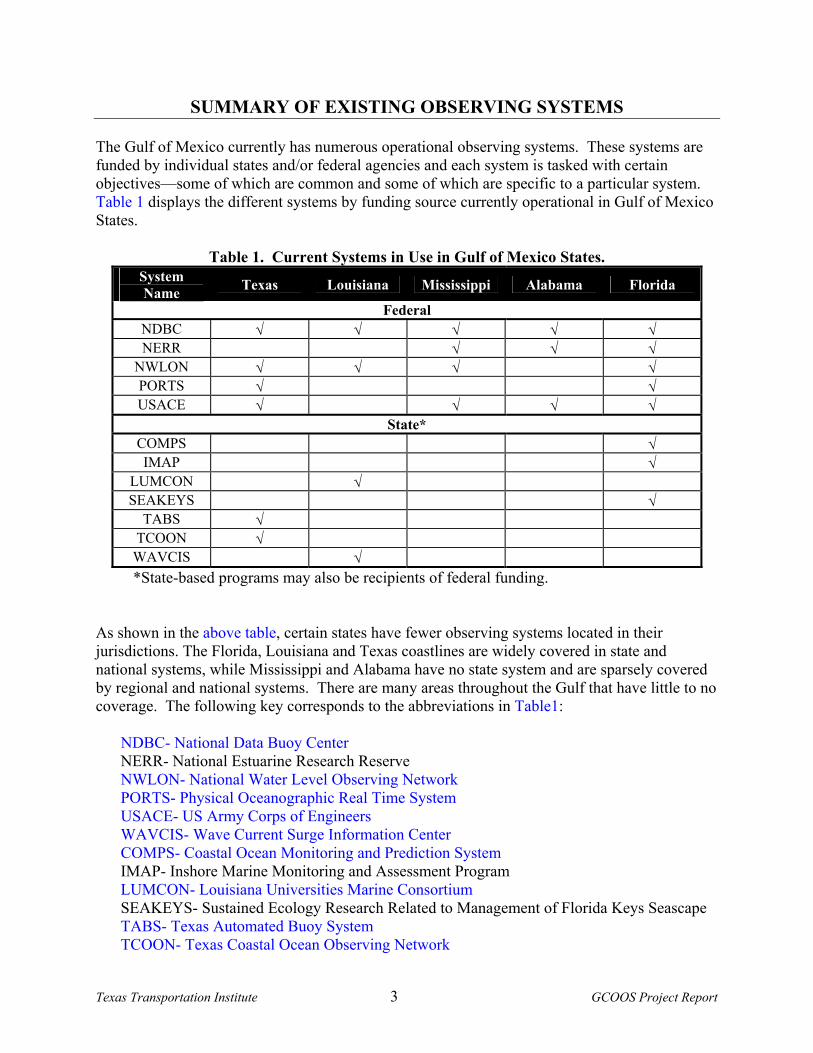
SUMMARY OF EXISTING OBSERVING SYSTEMS The Gulf of Mexico currently has numerous operational observing systems. These systems are funded by individual states and/or federal agencies and each system is tasked with certain objectives—some of which are common and some of which are specific to a particular system. Table 1 displays the different systems by funding source currently operational in Gulf of Mexico States.
Table 1. Current Systems in Use in Gulf of Mexico States. System Name Texas Louisiana Mississippi Alabama Florida
Federal NDBC √ √ √ √ √ NERR √ √ √
NWLON √ √ √ √ PORTS √ √ USACE √ √ √ √
State* COMPS √ IMAP √
LUMCON √ SEAKEYS √
TABS √ TCOON √
WAVCIS √ *State-based programs may also be recipients of federal funding.
As shown in the above table, certain states have fewer observing systems located in their jurisdictions. The Florida, Louisiana and Texas coastlines are widely covered in state and national systems, while Mississippi and Alabama have no state system and are sparsely covered by regional and national systems. There are many areas throughout the Gulf that have little to no coverage. The following key corresponds to the abbreviations in Table1:
NDBC- National Data Buoy Center NERR- National Estuarine Research Reserve NWLON- National Water Level Observing Network PORTS- Physical Oceanographic Real Time System USACE- US Army Corps of Engineers WAVCIS- Wave Current Surge Information Center COMPS- Coastal Ocean Monitoring and Prediction System IMAP- Inshore Marine Monitoring and Assessment Program LUMCON- Louisiana Universities Marine Consortium SEAKEYS- Sustained Ecology Research Related to Management of Florida Keys Seascape TABS- Texas Automated Buoy System TCOON- Texas Coastal Ocean Observing Network
Texas Transportation Institute 4 GCOOS Project Report
The following sections provide more detail about each of these systems categorized by state: Texas TCOON - Texas Coastal Ocean Observation Network
TCOON is a statewide network of water level gauges and meteorological data stations located along the Texas coast, with forecasting for select sites. In addition, TCOON monitors salinity in Nueces Bay, TX. Two stations make up the Wave Climate Monitoring System, which provide wind and wave characteristics and water temperature. The following is data provided by TCOON:
• Water level • Water/air temperature • Wind: speed, direction, gusts • Barometric pressure • Waves: height, period, direction • Water velocity • Tides • Water quality: salinity, conductivity, pH, dissolved oxygen, turbidity, saturation
It should be noted that not all of the above data sets are available for every station.
Most users of this observing system are extremely happy with the quality of the data sets being produced. Suggestions for improvements include adding a trend line to the data and making the uncut unprocessed data available to researchers.
More information about TCOON is available at: http://lighthouse.tamucc.edu/Main/HomePage
TABS – Texas Automated Buoy System
The TABS system is comprised of eight buoys, which are located along the Texas coast, that provide surface current data in near real-time. This data is intended to be incorporated into trajectory models for predicting the movement of oil spills. Some meteorological data can also be obtained from this system. The following data is taken by TABS:
• Wind: speed, direction, gusts • Water/air temperature • Current: speed/direction • Barometric pressure
It should be noted that not all the above data sets are available for every station.
Texas Transportation Institute 5 GCOOS Project Report
The TABS website provides links to NWS marine forecasts, NOAA wind forecasts, TGLO surface current models, tide predictions and other observing systems in the Gulf of Mexico.
More information about TABS is available at: http://resolute.gerg.tamu.edu/Tglo
Louisiana
LUMCON – Louisiana Universities Marine Consortium - Environmental Monitoring According to their website, LUMCON was formed in 1979 to coordinate and stimulate Louisiana’s activities in marine research and education. They provide laboratory space to Louisiana universities, and conduct research and education programs in the marine sciences. LUMCON has three stations located in Terrebonne Bay, in southern Louisiana; they provide the following data:
• Meteorological • Water temperature • Water level • Salinity • Solar and quantum radiation.
Their website provides links for weather/marine forecasts, tide predictions and IR satellite images. More information about LUMCON is available at: http://www.lumcon.edu
WAVCIS – Wave Current Surge Information Center
The WAVCIS system is designed to give sea state information and surface current data for the Louisiana coast. Prior to this system’s installation the only sea state information available for the coast of Louisiana was from one NDBC buoy, located over 60 miles from the mouth of the Mississippi River. Six stations have been placed along the Louisiana coast, with two currently under construction and six more planned. WAVCIS provides the following data:
• Wind: speed, direction, gusts • Wave: height, period, direction • Air/water temperature • Surge • Near surface currents: speed, direction • Water quality: salinity, conductivity, turbidity,
Texas Transportation Institute 6 GCOOS Project Report
The WAVCIS website is available to registered users, and provides current and historical data sets. Links can also be found for other observing systems and state/federal agency programs. More information about WAVCIS is available at: http://wavcis.csi.lsu.edu
Florida
COMPS – Coastal Ocean Monitoring and Prediction System
Buoys and coastal towers are located along the coast and offshore of the western coastlines that take real-time measurements. The readings are sent to shore via satellite telemetry, which enables real-time access to data and models. The following data is gathered by COMPS:
Offshore buoys measure:
• Currents • Temperature • Salinity • Meteorological data.
Coastal towers measure: • Water level • Temperature • Salinity • Meteorological information • Bio-optical sensor data.
Through their website, users are able to find links to different types of COOS systems and organizations. More information about COMPS is available at: http://comps.marine.usf.edu/
IMAP – Inshore Marine Monitoring and Assessment Program
IMAP is part of the Coastal 2000 program, which is a nationwide EPA program to monitor and assess coastal ecological conditions. Florida’s Marine Research Institute, in conjunction with the EPA, takes approximately 180 samples from random sites once a year in late summer. Using ecological indicators, physical/chemical and biological tests, they are able to assess the quality of the water. The following measurements are taken by the IMAP program:
• Water temperature • Salinity • Nutrients
Texas Transportation Institute 7 GCOOS Project Report
• Dissolved oxygen • Chlorophyll A • Water depth • Resident species sampling • Sediment characteristics
Annually a report is produced stating the results of the estuaries’ condition. More information about IMAP is available at: http://www.floridamarine.org/features/category_main.asp?id=1714
SEAKEYS – Sustained Ecology Research Related to Management of Florida Keys Seascape
SEAKEYS was established in the Florida Keys area to monitor the 220- mile stretch of Florida’s coral reefs. Operated by NOAA and the Florida Institute of Oceanography, they enhanced seven NDBC Coastal-Marine Automated Network (C-MAN) stations with oceanographic instruments that measure salinity, fluorometry, sea temperature and turbidity. The following data is gathered by the SEAKEYS system:
• Water and air temperature • Salinity • Wind speed and direction • Barometric pressure • Photosynthetically active radiation (water surface level, one meter and
three meter depths).
This data is available online; however, according to the disclaimer, it is not quality controlled. More information about SEAKEYS is available at:
http://www.coral.noaa.gov/seakeys/index.shtml
Government
HABSOS - Harmful Algae Blooms Observing System HABSOS is a pilot program in the Gulf of Mexico that is testing the integration of information and communication systems for managing the Harmful Algae Blooms (HAB) data, events, and effects. Currently the system is testing their models’ ability to forecast algae blooms. The program will eventually spread throughout the coastal US. HABSOS uses the National Data Buoy Center archived buoy data to try modeling past algae blooms.
More information about HABSOS is available at: http://www.ncddc.noaa.gov/habsos
Texas Transportation Institute 8 GCOOS Project Report
NDBC – National Data Buoy Center
The NDBC is the part of the National Weather Service that operates and maintains the functionality of marine buoys. The two types of data collection stations managed by NDBC are: Coastal-Marine Automated Network (C-MAN) stations and moored buoys. C-MAN stations have been installed on lighthouses, offshore platforms, near shore islands, and beaches; they typically provide the following data:
• Wind characteristics • Temperature • Barometric pressure
Some stations have these additional features:
• Wave characteristics • Humidity • Visibility • Precipitation • Water level.
Moored buoys provide data on:
• Wind characteristics • Temperature • Barometric pressure • Wave characteristics.
The buoys transmit data via satellite once an hour for relay to a processing center: NESDIS (National Environmental Satellite, Data, and Information Service) Data Acquisition Processing System (DAPS). Quality control on the data is performed, and then it is distributed in near real-time. This data and the raw data are also sent to the NDBC, who performs checks on the data to verify its accuracy. NDBC is widely used by the maritime community because of its accessibility and reliability. Researchers are also able to access archived data which has gone through strict checks performed by the NDBC to verify its quality. Some well-liked features of NDBC are: that they update all information on the website hourly, that wind information is updated every 10 minutes, and the last 24 hours worth of readings are available. All of these are helpful for the offshore industry. More information about NDBC is available at: http://www.ndbc.noaa.gov/
Texas Transportation Institute 9 GCOOS Project Report
NERR - National Estuarine Research Reserve
NERR is a monitoring system that continuously monitors water quality in select protected estuaries. This is done to help establish a baseline of environmental conditions in estuaries and also to help identify the origins of non-point source pollution. Four estuaries within the Gulf of Mexico currently participate in the NERR program; Apalachicola Reserve and Rookery Bay in Florida, Weeks Bay in Alabama and Grand Bay in Mississippi. The following data is gathered by data loggers in two locations within each estuary:
• Water temperature • Water level • Conductivity • Salinity • Turbidity • Percent saturation • Dissolved oxygen • pH
In addition, the following data is taken from a local weather station:
• Air temperature • Humidity • Precipitation • Barometric pressure • Wind characteristics • Photosynthetically active radiation
Data is gathered every thirty minutes and uploaded at a later time to a computer. The water and weather data sets are merged to allow for analysis. This data is not available to the public until one year after retrieval from the site. More information about NERR is available at:
http://cdmo.baruch.sc.edu/home.html NWLON – National Water Level Observing Network
NWLON is part of NOAA’s Center for Operational Oceanographic Products and Services (CO-OPS). Their directive is to gather tidal data, which is used to develop tidal datums for: the accurate production of navigational charts, helping with the prediction of storm surge, and in climate monitoring. The following data is provided by NWLON:
• Temperature • Water level • Wind characteristics
Texas Transportation Institute 10 GCOOS Project Report
• Conductivity • Barometric pressure
More information about NWLON is available at: http://www.co-ops.nos.noaa.gov/d_nwlop.html
PORTS – Physical Oceanographic Real Time System
The PORTS system was established by NOAA’s National Ocean Service to ensure safe navigation of maritime vessels while transiting channels. This system provides port pilots and others with accurate real-time information via telephone or internet. Two ports in the Gulf of Mexico currently have operational PORTS systems; Houston, TX and Tampa Bay, FL. Buoys located in the channels provide the following data:
• Water level • Wind characteristics • Currents • Salinity • Temperature • Barometric pressure • Specific gravity
For more information on the PORTS system visit their web page at: http://www.co-ops.nos.noaa.gov/d_ports.html
USACE Waves – US Army Corps of Engineers Wave Gauges
The USACE Waves system is operated by the Corps Coastal Hydraulic Laboratory. The Corps takes wave and tidal data at locations that they are interested in. The following data is provided by USACE:
• Wave characteristics • Water depth
Historical data is available online but, according to the disclaimer, minimal quality control checks have occurred. More information about USACE Waves is available at: http://sandbar.wes.army.mil/public_html/pmab2web/htdocs/main.html
Texas Transportation Institute 11 GCOOS Project Report
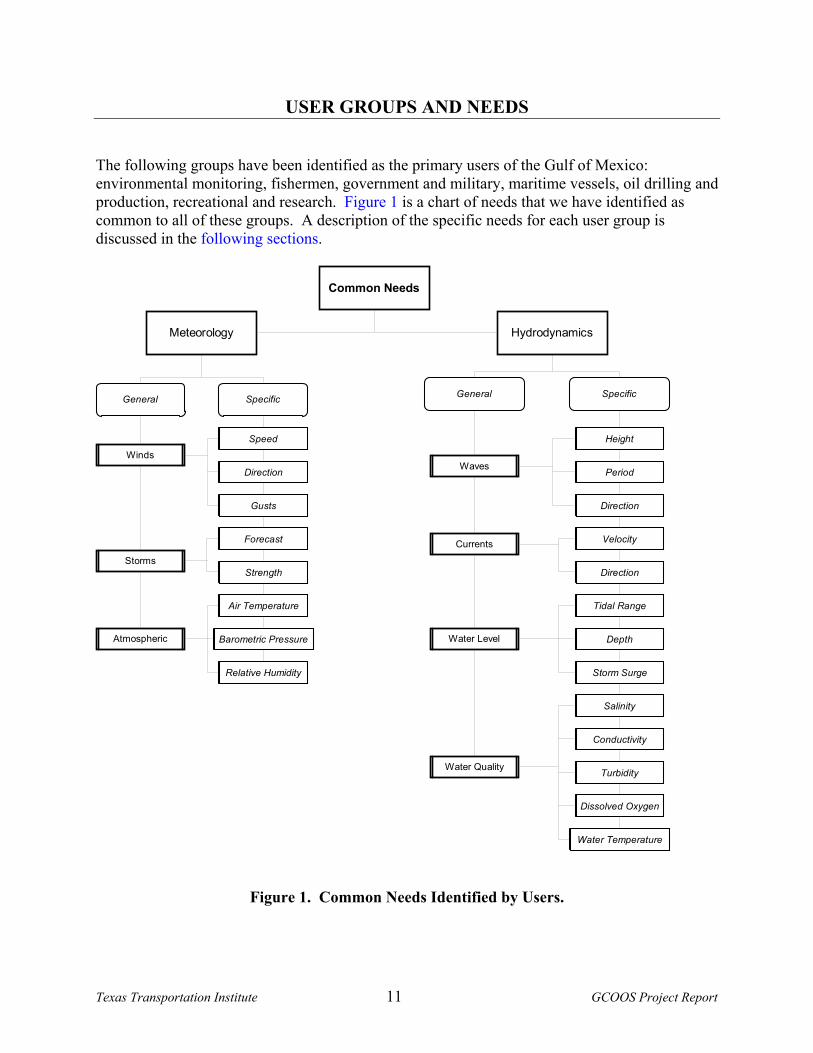
USER GROUPS AND NEEDS The following groups have been identified as the primary users of the Gulf of Mexico: environmental monitoring, fishermen, government and military, maritime vessels, oil drilling and production, recreational and research. Figure 1 is a chart of needs that we have identified as common to all of these groups. A description of the specific needs for each user group is discussed in the following sections.
Common Needs
Meteorology Hydrodynamics
Speed
Winds
Gusts
Direction
Height
Period
Direction
Velocity
General Specific General Specific
Storms
Atmospheric
Forecast
Strength
Air Temperature
Barometric Pressure
Relative Humidity
Waves
Water Quality
Currents
Water Level
Conductivity
Salinity
Direction
Water Temperature
Dissolved Oxygen
Tidal Range
Turbidity
Storm Surge
Depth
Figure 1. Common Needs Identified by Users.
Texas Transportation Institute 12 GCOOS Project Report
Environment Monitoring User Specific Needs:
• Tidal gauge placement • Anemometer placement • Wave data • Biological data and sensors
Different areas of interest include: water quality and resources, climate monitoring, and habitat loss, to name a few. Most users of this category are government agency personnel or government/private contractors.
Many in this group are concerned with tidal gauges and the placement thereof. User comments indicate many of these gauges are placed in poor locations that do not yield useful data. Also, in some areas tidal gauges are referenced to a relative datum in the area, not to each other.
Several individuals spoken to that do estuary research brought up the point that, in smaller bays/estuaries [Matagorda Bay, San Antonio Bay and Sabine-Neches Bay], with less traffic than the larger ones, there is a lack of observation buoys. Sensors that measure dissolved oxygen and optical backscatter would be extremely beneficial in those interior areas. Dissolved oxygen measurements can help identify hypoxic areas as well as possible non-point source pollution origins. Optical backscatter sensors will allow turbidity to be measured remotely.
Another consistent problem is poor placement of existing anemometer installations. Many were installed incorrectly, and provide bad data. According to one user, “Conrad Blucher’s anemometers are not orientated correctly”, in addition “Galveston’s wind data is of no value because of poor placement”. These two areas were named specifically, and many other areas along the Gulf coast have similar problems.
The TCOON network is very much used and liked by this group, especially the ease of access to current and historical data. It was suggested that TCOON could improve the system by having a separate source of data for those interested in non-quality controlled tidal data sets, and to reduce the amount of data smoothing. Those environmental monitors, who are interested in different hydrographic mechanisms, could benefit from information that is omitted in the data control process. A problem that was identified with TCOON was with their Wave Climate Monitoring System. There are currently two stations, but they have been non-operational for extended times during the period of this study. The National Weather Service monitoring station is down indefinitely due to the lack of funding. The second station, Real Time Navigation System (RTNS), has been under repair since the beginning of May 2004. Getting the Wave climate systems operational will allow this user group to assess the long-term variability of the wave climate.
While the TABS system’s data would also meet the needs of environmental monitors, user comments indicate that TABS is not greatly used because data are regularly inaccessible and downloading archived data is cumbersome. Users also have problems after major storm events, with buoys no longer being on location, and they are uncertain when the buoys will be replaced.
Texas Transportation Institute 13 GCOOS Project Report
TABS is currently working on the construction of larger buoys, with expanded measurement capabilities, which are expected to better withstand major storm events. The general consensus is that additional offshore stations that collect meteorological and hydrographic data should be added to the Gulf of Mexico network. Wider data coverage of the Gulf will allow more effective models to be developed that couple ocean and atmospheric data and enhance monitoring capabilities. Fishermen User Specific Needs:
• Accurate weather forecasts • Ocean current models • Identification of hypoxic and anoxic environments
Both domestic and international commercial fishermen operate in the Gulf of Mexico. The offshore fishermen are generally at sea for 30-50 days in less than 50 fathoms of water. Their paths are migratory in their search for fish. All of these vessels should be equipped with radios for communication and weather forecasts. Near shore fishermen are typically out for the day and return with catches of shrimp or oysters. This group is largely impacted by extra-tropical storms and harmful algae blooms. An ability to accurately forecast the intensity and movement of these will save this industry time and money.
Many different kinds of seafood are caught in the Gulf of Mexico including: Tuna, Mahi-Mahi, Amberjack, Mackerel, Shark, Red Snapper, Sand Trout, Marlin, Yellow Tail, and Shrimp. Accurate current models would enhance the success of commercial, recreational and sport fishermen, allowing them to better track the migration of adult fish, which follow the currents for food and migration.
A large concern is harmful algae blooms. Fishermen need to avoid these areas of toxic algae. An accurate forecast of the location and movement, and the expected duration of the blooms will help keep fishermen out of these areas.
Fish farms located along the coastline are also interested in environmental monitoring information. State laws enforced by Texas Parks and Wildlife forbid the release of any fish/shrimp from these farms. These farms are greatly affected by extra-tropical storms, since these can cause the fish/shrimp to escape. To avoid this, they must be harvested or killed before the storm arrives. There is a real need here for accurate long-term weather forecasts so that these crops are not harvested unnecessarily or prematurely. An important service that fishermen can perform for the GCOOS network is as Vessels of Opportunity. These vessels would be equipped with passive sensors, which would be maintained by someone else. Considering the wide areas covered and number of vessels in the Gulf of Mexico, a network of passive sensors aboard fishing vessels will vastly increase the amount of current and water quality data collected. This will not replace the data gathered by permanently installed stations, but it will allow more data to be collected at a reduced cost.
Texas Transportation Institute 14 GCOOS Project Report
Government User Many different government agencies use information from coastal ocean observing systems. These include, but are not limited to:
Defense • US Army Corps of Engineers • United States Coast Guard • United States Naval Research Center Environmental & Health • Wildlife and Fisheries • Health Department • Environmental Protection Agency Weather & Atmospheric • National Oceanographic and Atmospheric Agency • National Weather Service
The Corps of Engineers needs highly accurate tidal and current data. When dredging or near shore construction is being done in a coastal area, sensors, (either a contractor’s or their own), are placed to acquire site-specific data. This data is used to develop hydrodynamic models to best fit their needs. Due to their site-specific data requirements, it’s typically difficult to find other sensors in the area for confirmation of data. The Naval Research Center at Stennis develops models for the military. They place their own buoys in areas of interest; those of special interest may remain for 1-2 years. They do use NDBC and other organizations’ data, but usually only as a confirmation of their own data. Every type of model needed by the military is developed through the research center. The needs of most branches of the military are very sensitive, and additional observing systems would only benefit them by providing confirmation of their own data sets or models. The Coast Guard uses some data from observing systems for Search and Rescue. They need up-to-date weather and current data to maximize the effectiveness of their searches. Wildlife and Fisheries provides assistance to their partners to protect, conserve and restore coastal habitats. To best maintain and preserve these habitats historical and real-time data is needed that includes; salinity, water quality, temperature, turbidity and dissolved oxygen. Health departments throughout the Gulf of Mexico are concerned with water quality, harmful algae blooms and their affects on the environment and people. Each state has various programs in place for monitoring their water systems. Historical and current data gathered from various organizations is compared to establish trends for the area. Having more sensors in coastal areas would help establish a better idea of where problematic areas are. The Environmental Protection Agency is particularly interested in the health of estuaries, coral reefs and the Gulf of Mexico. The National Estuary Program (NEP) was developed to monitor varying problems; nutrient levels, invasive species, habitat loss, pathogens, toxic chemicals and
Texas Transportation Institute 15 GCOOS Project Report
decline in fish and wildlife. By monitoring dissolved oxygen, nutrients, salinity, turbidity and temperature they are able to detect sources of point and non-point source pollution, which can cause any of the above mentioned problems. National Oceanographic and Atmospheric Agency (NOAA) is working to better understand and predict our global environment and manage our coastal resources within the United States. Different organizations within NOAA include, the National Weather Service (NWS), National Ocean Service (NOS) and National Data Buoy Center (NDBC). The various observation systems in the Gulf of Mexico allow NOAA to gather more real-time data so they are able to better monitor the coastal environment and predict the occurrence of hazardous conditions such as tropical storms and hurricanes. NOAA is able to provide assistance to the observation systems by allowing their data to be displayed on NDBC’s website and performing data quality control. Differing agencies have differing needs, but the common need of these various government agencies is for additional sensors to be placed in coastal areas so they may be able to better protect and inform the general public. Maritime Vessels User Specific Needs:
• Waves o Average height, significant height o Direction, period
• Wind o Speed o Direction o Gusts
• Tides o Water level o Time
• Currents o Speed o Direction o Forecast
• Water Level • Graphical data format
The shipping industry is extremely dependent on accurate real-time data and accurate forecasts.
Vessels are extremely concerned about the wave height and direction for several reasons. One reason is cost: large seas make it take longer to get to port, and fuel consumption increases. Certain vessels, such as seagoing tugs, have limited sea state conditions in which they can safely operate, compared with other maritime vessels used in the Gulf. It is vitally important that they be able to avoid these situations. According to one user in the Gulf of Mexico, “The weather
Texas Transportation Institute 16 GCOOS Project Report
buoys are giving the period of the waves and swells, but not the wave height or wave direction. The most important data that should be given is the wave height and direction.”
One service that is currently provided by several companies to the maritime industry is computing the cheapest and most efficient route for their customers. Weather, wave information, and currents are assessed for a time-period, and a recommended route is identified. These companies will also alert the customer when conditions change and advise a different route for the vessel. These companies use their own meteorologists to interpret data for the weather forecasts. Strong needs identified by users include: surface and near-shore current data, wind and wave conditions, tidal level, and current and expected weather conditions, including fog and severe storms.
In navigation channels, buoys are used to identify the channel boundaries and some buoys have the capability to provide certain data sets. A lot of vessel operators do not use this “dial-a-buoy” program because they are unaware of its existence. Most will rely on the harbor pilot to know the conditions and to ensure safe passage through the channel. If something seems amiss, they will often not enter the area. Experience is heavily relied on to judge situations.
All maritime vessels are equipped with equipment on the bridge for receiving weather information. National Weather Service (NWS) issues weather alerts over radiotelex from coast stations, and via INMARSAT-C (similar to telex over satellite). NAVTEX receivers also pick up NWS broadcasts from coast stations. In addition, many companies pay for weather information which is relayed to their vessels. An email that contains both text and graphics is sent once a day or more frequently to the maritime company, which is in turn sent to the ship captains. Many operators are happy with these services, and if they become displeased they are readily able to switch to another company for weather information.
There are several different weather prediction companies for mariners in the Gulf of Mexico. These companies employ meteorologists 24 hours a day, 365 days a year to analyze data obtained from the National Weather Service and observation stations. Key parameters of interest for these companies are; surface and near-surface currents, water level, wind and wave characteristics, visibility and precipitation, all of which are available, but with limited spatial resolution. With better spatial resolution these private weather companies could develop better models to more accurately forecast site-specific weather.
Some vessels do not use the buoy/observation systems because they do not have Internet access, and the ones that do have limited time to access data, and often have low bandwidth connections. When they do, they want to be able to easily look up the data and quickly understand what is being presented. In most cases they are dissatisfied with the data sets that are generated by the system, and feel that availability is unreliable. The NDBC buoys are the only ones that are considered reliable and can be counted on remaining on site after a storm passes. Some users contacted for this study noted that certain observing systems, including some discussed in this study, are down so often or so much of the time that they are not even checked anymore.
Another issue in the Gulf of Mexico is lightering operations and Floating Production Storage and Offshore Loading (FPSO) vessels. Many large tankers, such as Very Large Crude Carriers
Texas Transportation Institute 17 GCOOS Project Report
(VLCCs), draw too much water when fully loaded to enter most ports. In order to get around this, smaller lightering vessels are used to partially or completely offload the tankers. When lightering, the two vessels tie up side-by-side in open water, and transfer the crude oil. Having two vessels in such close proximity, transferring petroleum, creates the possibility of damage to the vessels or to the environment, if the weather gets bad. Accurate forecasts are vital for safe lightering operations. Most companies will not allow vessels to moor alongside each other when the wind velocity is greater than 30 knots and wave height is greater than 3 meters. In addition, cargo transfers will cease when the wind velocity is 44 knots and the wave height is 5 meters or more. FPSOs may begin operating in the Gulf of Mexico this year. FPSOs are an alternative to conventional floating oil production platforms. They are in currently being used in many parts of the world, and are often converted tankers. A FPSO gets moored to a rotating turret over an oil well, and typically stores the produced oil onboard. This oil is offloaded to shuttle-tankers for transportation to shore facilities. Lightering a FPSO has weather restrictions similar to, but in excess of, those of conventional lightering vessels. FPSOs and their shuttle-tankers are affected by currents to a much greater extent than other tankers because, unlike the tankers, they are unable to drift from their location. Companies operating FPSOs will need good weather and current forecasts, in order to plan operations. High frequency radar (HF radar) is important for mapping surface current velocities. Data about wave characteristics can also be obtained. A vertically polarized HF signal, that can travel much farther than microwave radar, is broadcast at the ocean surface. By overlapping the returns from two or more radars from different areas, the surface current velocity vector can be found and mapped. These signals are unaffected by rain or fog; this makes them highly usable in many different situations. Depending on the wavelength used and environmental factors, the range of HF radar is 10-220 km. Currently, parts of the Gulf of Mexico are sparsely covered by HF radar. Future plans are being considered for a dense network of HF radar that will cover the entire Gulf coastline. Ports & Pilots - Port pilots are required for most large maritime vessels, and their local knowledge is relied on to safely bring vessels into the port, which means highly accurate water level, currents, and wind speed and direction are needed by the pilots to navigate the channels. Many vessels can only enter ports at certain times because of the draft of their vessel. To ensure a safe transit pilots need to know that clearance below the ship’s keel is adequate. Specifically, many tankers take salinity readings of the water during transit and before leaving/entering a port to ensure proper loading and their safe transit. Many ports in the Gulf of Mexico can only handle deep draft vessels at certain tide levels. Any time spent waiting means monetary loss for the vessel’s owners. Accurate water level predictions will allow less time to be lost. Currents and winds are a major problem for port pilots when negotiating turns or passing other vessels. If they even temporarily lose control of the vessel it could mean disaster for the port, vessel, and environment. Accurate nowcasts and forecasts for the area are vital to this group. Additional data uses and needs are for vessel operations in port that require wind speed and
Texas Transportation Institute 18 GCOOS Project Report
water level information to allow the products to be safely loaded and/or offloaded from the vessel. Very few ports are fortunate enough to have the PORTS system, and those that do use the system on a regular basis. Foreign – US ports and waterways are frequently visited by foreign vessels bringing important commodities to our country. Over fifty percent of the nation’s imports and exports by tonnage are carried by foreign vessels using ports in the Gulf of Mexico each year. Most of the officers and personnel on these vessels know little or no English and need to be able to obtain data in a format that is understandable to them, e.g. graphically. In addition, most utilize the metric measuring system and would benefit from data displayed in a compatible measuring system.
It was particularly difficult to identify the needs of this group, since they are in our country for such a short time period. One of the largest factors affecting this group is communication and English comprehension, which could cause problems with interpreting data that GCOOS will supply. Ideally, data would be presented graphically so that there is little chance of misinterpretation, and so that the maximum number of people can benefit from this system. Oil Drilling and Production User Specific Needs:
• Wave o Average height, significant height o Direction, period
• Currents o Speed o Direction o Forecast
• Wind o Speed o Direction
• Meteorological o Extra-tropical storms o 24 hour forecast of conditions
Producing and drilling for oil and gas in the Gulf of Mexico is a constant operation. Offshore mineral leases earn almost 10 billion dollars a year. As of 2003 the Gulf of Mexico produces 25% of domestic gas supply and “by year-end 2007, Minerals Management Service (MMS) projects [oil and gas] production from deepwater fields will account for 69% of the gulf’s daily output and 28% of daily gas production”3. Over 50% of leased blocks in the Gulf are in water depths greater than 1000 feet. These account for 60% of oil and 24% of natural gas produced4. As our needs for oil and gas increase, and near-shore production declines, the greater the distance offshore companies must go in order to meet this need. Environmental factors, such as 3 “Gulf looks good for oil, not gas,” Petroleum News 11 May, 2004, www.petroeumnews.com/pnarch/030511-05.htm 4 Mineral Management Service – Offshore Minerals Management Program, “Offshore Oil and Gas Facts,” June 2003, www.mms.gov/ooc/press/2004/OCSoilandgasfacts.pdf
Texas Transportation Institute 19 GCOOS Project Report
currents, that are not a problem in shallower water can become a substantial problem in deep water. One of the technologies that have proliferated in the Gulf with the advent of deep-water drilling and production is Dynamic Positioning (DP). DP drilling vessels operate the same way that conventional drilling rigs do, but they are not moored to the bottom. Instead, thrusters are used to maintain the vessels’ position and heading. DP drilling rigs, especially drillships, are much more sensitive to weather and current than conventional rigs, and consequently require much better forecasts. Some of these rigs are even equipped with Doppler radar, and most are equipped with current meters, to help meet these needs.
A majority of companies working in the Gulf of Mexico pay for their weather and hydrographic data. These companies need the most accurate nowcasts and forecasts that they can get, due to the possible endangerment to their personnel and equipment. Many watch the weather channel for non-commercial weather and pay weather companies for location-specific weather. These companies produce text-only forecasts or a combination of text and graphical forecasts. The preference is for, “graphics because they make it easier and faster to obtain information.” Most companies receive their information via the Internet or e-mail, but when the Internet connection is non-operational the information will come by fax.
The NDBC has numerous buoys offshore near the rigs and platforms. Many use the NDBC’s website to gather data from the buoy closet to them for wind speed and direction. At times with large fronts passing or extra tropical storms in the region they may check the website daily to several times a day. During benign times of year (i.e. early summer) they will go days without checking the data. Rarely have problems been encountered with down buoys or erroneous data. According to one user, “Since our primary concern is wind speed, we are covered by this site well. We don't really need any more info.”
Another major concern and problem for the offshore industry is the loop current and the eddies that can spin off. The loop current is the name given to the seasonal intensification and wandering of the Florida Current that can last for a period of days to months. Predicting the movement and intensity of the loop current and the resulting eddy is a major problem for oil companies. In many cases, drilling operations have to cease until the current has passed through the area. Horizon Marine operates Eddy Watch, an observing and forecasting model.5 This service allows paying customers to have weekly real-time ocean current maps. Currently Horizon Marine deploys their own sensors to monitor eddies. With additional drifting buoys, usage of platforms for sensors and additional atmospheric stations more accurate current and weather information would be obtained and modelers will be able to better forecast the movements and the intensity of the currents and weather.
Helicopter pilots servicing oil platforms and vessels fly offshore daily and need current weather to file their flight plans, and to ensure safe operations. They are able to call an automated system that gives them the currently occurring conditions for multiple locations offshore. Prior to landing on a rig or manned platform, the pilots usually ask for the current wind speed and direction. Helicopter pilots would be best served with more automated observing stations and accurate 6 to 8 hour forecasts.
5 Horizon Marine, Inc, Home page http://www.horizonmarine.com/index.html
Texas Transportation Institute 20 GCOOS Project Report
Recreational User Specific needs:
• Meteorological o Cloud cover o Imminent weather conditions
• Currents o Rip currents o Undertow
• Harmful algae bloom forecast Many people enjoy the marine environment by fishing, boating, sailing, surfing, and sunning themselves on the beach. These users would benefit from accurate, descriptive forecasts. This group needs a wide spectrum of forecasts that are easy to access and understand.
The tourism industry in the Gulf of Mexico is worth billions of dollars. Every year millions of people visit Gulf beaches for vacation. Many tourists are unaware of the dangers that may be encountered, such as rip currents, undertow, and algae blooms and will not know how to recognize them. Florida in particular has many incidents and deaths associated with rip currents. Many beaches do post daily warnings of the likelihood of rip currents, but are unable to predict the location or intensity. Having more current meters placed in near shore regions can help forecast these currents to ensure the safety of the tourists. Many health problems can be caused by algae blooms (such as Red Tide). For asthmatics and the elderly these blooms can cause breathing problems and potentially trigger a hospital visit even if they are just in proximity to the bloom and not actually in the water. Better indicators and prediction of these algae blooms can help areas affected warn tourists of the problem so they may avoid the area. In addition, recreational fishermen maybe affected by these blooms and could be warned to avoid affected areas. Many recreational fishermen, with their own vessels, will usually stay within a few miles of shore and are in need of accurate meteorological data for a period of 6-8 hours. Most will access this data on the morning of the trip and will have no way of obtaining information during the trip itself. In the event of quickly changing weather, a radio broadcast for the area or a station they may call into to get this information would be beneficial. Sport fisherman will often pay a captain to take them offshore. The boat captain knows the area, including where the best fishing spots are, and is relied on to keep track of the weather. These vessels are equipped with radios from which they can obtain weather forecasts. Since they are usually just going on day trips, they have a good idea of where the hypoxic areas are located and can avoid them, but they would benefit from accurate forecasts of the movements of these harmful areas. Tourists most likely will not have Internet access while on vacation and will have to obtain their information from newspapers, television, or the local residents. It is important then that the newspapers and local news agencies stress the severity of these conditions and more accurately
Texas Transportation Institute 21 GCOOS Project Report
forecast the likelihood of any of these situations’ occurrence. On a national level most tourists obtain their weather from non-commercial sources and are aware of extra-tropical storms in the area and may be aware of rip currents. This allows them to make any necessary changes to their vacation plans. Extra-tropical storms are something tourists are generally aware of and they would benefit most from more accurate forecasts of the direction and intensity of the storm. In addition to personal safety of tourists and residents, the tourism industry is also affected economically by the forecasts, in that if the storm is predicted to make landfall in their area, most tourists will postpone or cancel their vacations. If the storm changes track this area will lose revenue and the newly affected area will have to contend with warning the tourists of the potential problem. Surfers, scuba divers, and recreational fishermen often go to areas they have little experience with and are greatly affected by currents and weather conditions. These users would benefit from accurate, descriptive forecasts. This user group would get the most benefit from sensors that take data on current characteristics, dissolved oxygen and nutrient levels, water temperature, and meteorological data. Research User Specific needs:
• Weather forecasts • Current models • UV-radiation • Chemistry • Nutrients • Water level • Biology
A majority of researchers primarily use NDBC buoys to gather information such as wind and wave characteristics. One researcher commented, “They give great information and are reliable.” Yet, there seem to be several down sides to the system. One problem is that they do not measure currents, which is something that many researchers are concerned with. Another problem is the method of obtaining data tends to be cumbersome. Each parameter must be downloaded separately, which is time consuming, and it means the data requires further manipulation. Researchers in the state of Texas use the TCOON system to collect tidal and water level data; many are happy with the results. The data is easily accessible online, in a format that is easily transferable for use in models. Since the sensors are on the coastline there are fewer problems with non-operational sensors and any problems can be remedied within a short time span. In Louisiana the WAVCIS is for registered users only, so archived data is inaccessible to a non-proprietary researcher. The LUMCON system allows the user to easily select what data format is required: HTML Table, CSV, or Excel. Downloading the data can be cumbersome, however,
Texas Transportation Institute 22 GCOOS Project Report
because each location must be done separately. In addition, the user can only download the meteorological and hydrographic data sets separately, which increases the amount of time required. A field that has been getting a lot of interest recently is sediment transport. Accurate wave data, covering large areas, would allow a better understanding of coastal sediment transport. Being able to accurately model sediment transport will allow users to build better coastal structures that will be beneficial to the environment. It will also allow beach nourishment projects to be more successful since the conditions of erosion would be better understood. A blanket of offshore buoys would be a good start towards getting the wave data needed to develop this field. Most researchers cannot afford to pay for weather data and so they will use the National Weather Service and non-commercial services for weather conditions before research trips. The majority of researchers contacted for this study indicated they generally are out on day trips and this method for obtaining weather was adequate for their needs. For obtaining long-term data to incorporate into their research they use the National Weather Service. Several researchers mentioned the need for dissolved oxygen and optical back scatter sensors at the mouth of major river systems. These sensors can help identify and model hypoxic environments, which are important to fisheries and the ecology of the system. In addition, more temperature, organic nutrient, salinity, and turbidity sensors would also help model harmful algae blooms and non-point source pollutants. It was mentioned that Louisiana has models of hypoxic environments available for their coastline and it would be nice if other states had the same. Researchers need to know about currents as well, to monitor the transport of larvae, which follow the current, and various other things. Researchers involved with turtle research are concerned with the environmental factors that affect where turtles beach. These include near shore currents, wind, and wave action. Various species of fish will converge on varying locations and many researchers are investigating what makes one place more appealing to those fish than another. Many researchers need digitized historical data for incorporation into models. For best results they need 100 years worth. TCOON has the previous fifteen years digitized and NOAA’s tidal gauges have been digitized. Throughout the Gulf of Mexico many government agencies have taken tidal data over the years. Originally, tidal data was recorded on scrolls, then newer methods arrived and scrolls were no longer used. Some of these agencies were diligent about archiving those scrolls, but others have since “misplaced” them. The Galveston Corps district is one group that felt this data was extremely important and kept the scrolls. However, these scrolls, or any other data sets, do researchers little good if they are not digitized and accessible. Part of the GCOOS mission should be digitizing and making available as much historic data as possible. The states of Texas, Louisiana and Florida, are covered fairly well with coastal observing systems but they do need some future enhancements. The Texas and Louisiana systems would be best improved with offshore buoys that take current, wave, and meteorological conditions and
Texas Transportation Institute 23 GCOOS Project Report
more buoys placed in bays/estuaries to monitor the ecology of the system. Mississippi and Alabama need better coverage in the coastal and offshore regions.
Texas Transportation Institute 24 GCOOS Project Report
RECOMMENDATIONS AND CONCLUSIONS Each user group needs the same basic parameters to be covered by the GCOOS system, such as: currents, wind, waves, etc., as summarized in Figure 1. Although each group uses these particular data sets for varying reasons, the need is strong among them all for consistency. Researchers are interested in what factors cause the migration of fish or sediment, such as near shore currents, wind, and wave action. The oil production and drilling industry is interested in currents at varying depths that could affect subsea equipment or drilling and production operations. The maritime industry is interested in currents, wind, and wave action that could affect safe passage, or special operations like lightering. What is really needed in the GOM is a better network of coverage that will provide basic data to interested parties, who can manipulate the data to gain vital information for the safety and productivity of their user sector. Numerous people have identified websites they use and like, and many websites have been reviewed in this study to identify good formats. Using the suggestions from the user base, a compatible site can be established that will fit the common users’ needs. Website/Information Interface Concept Ideally, on a website providing this information, users would be able to easily identify and find the data they are looking for. There are many ways to design a website, but a set-up like the following would allow easy use by all groups:
• Since there are many groups looking for different data sets of varying complexity, the site should be easily navigable.
• Near the top of the page there could be large buttons with pictures, for example: the link
to weather information should say weather above the button and the button could have a storm depicted on it. This way any user can quickly find what they are looking for.
• Once a button is selected, there should be a page that lets them choose the location they
want data for. This can be entered in a variety of ways, e.g. the user entering the lat/long, city/zip code or selecting a region graphically.
• The navigation will then take them to the data page which will give them the results in a
graphical format. There should be an option to select the display of text only or graphics and text simultaneously.
• The site should show the previous 12 hours, as well as current conditions and should let
them select if they want a 12-hour forecast.
• The user should also be able to easily access other types of data from this page.
Texas Transportation Institute 25 GCOOS Project Report
• Each page should have the same large buttons from the home page at the top of each page.
• The data should be time-stamped, so users know that the data is current.
Researchers’ ability to access archived data needs to be factored into the website design. There are many different needs, so there should be flexible download options. It would be best if it were possible to specify multiple download formats, to best fit users’ needs. Some researchers will likely want raw data, while others will prefer filtered. A page that allows the user to select a time/date range and which parameters they want may be the best way to handle this.
The website should be precise and easily read. An about button should also be present to let users learn about GCOOS and the participating observing systems. It is absolutely essential to keep everything simple and non-cluttered.
Maritime vessels, oil/ gas industry, etc. would use this website for current data. Due to the nature of the ocean environment and the rapid rate at which conditions can change, these users will want to access the data to confirm their subscription forecast and see current conditions which are critically important for their operations. They are paying for site specific data and will always want/need this type of information that is analyzed by experts.
A better observation system is needed to help those forecasters accurately model and forecast weather conditions. Wider coverage is desperately needed in certain areas of the Gulf and some areas are still lacking coverage. Near shore data, including information on rip currents, long shore sediment transport, and wave action would benefit many user groups as well.
Most user groups would highly benefit from a GCOOS system that is reliable, easy to use, simple and trustworthy. Initially, it may be hard to convince certain groups that this system is viable and useful. Once convinced, use will increase and spread to others. Other recommendations for continuation into the next stage of this project are: participation in meetings or functions with the different user groups to gain more knowledge and a better understanding of their needs. This will also increase involvement of user groups in the process of developing the GCOOS system. In addition, the GCOOS system will become more familiar to potential users that currently know little about the program.
Texas Transportation Institute 26 GCOOS Project Report
REFERENCES American Association of Port Authorities. AAPA online. <http://www.aapa-ports.org/pdf/2002_US_Cargo_Rank.pdf> Coastal Ocean Monitoring and Prediction System. COMPS Home Page. <http://comps.marine.usf.edu> CODAR Ocean Sensors. The Unique Nature of HF. <http://www.codaros.com/intro_hf_radar.htm> Cohen B. “Advanced Offshore Forecasting and Ship Routing.” Industry-IOOS Workshop. March 3, 3004. Cooper C. “Oil Industry Cooperation with IOOS.” Industry-IOOS Workshop. March 2, 2004. Coral Health and Monitoring Program. SEAKEYS. <http://www.coral.noaa.gov/seakeys/index.shtml> Division of Nearshore Research. TCOON: Texas Coastal Ocean Observing Network. <http://lighthouse.tamucc.edu/TCOON/HomePage> Feeney J. “Data Product Providers’ Interaction with IOOS.” Industry-IOOS Workshop. March 2, 2004. Florida Marine Research Institute. IMAP. <http://www.floridamarine.org/features/category_main.asp?id=1714> Graham G. Industry-IOOS Workshop. March 3, 2004. Harmful Algae Blooms Observing System. HABSOS Home Page. <http://www.ncddc.noaa.gov/habsos> Horizon Marine, Inc. Home Page. <http://www.horizonmarine.com/index.html> Impact Weather. Home Page. <http://www.impactweather.com/> Louisiana Universities Marine Consortium. LUMCON Home Page. May 24, 2004. <http://www.lumcon.edu> Malone T. “Status & Plans for Implementing the Initial U.S. IOOS.” Industry-IOOS Workshop. March 2, 2004. Mineral Management Service – Offshore Minerals Management Program. “Offshore Oil and Gas Facts.” June 2003. <http://www.mms.gov/ooc/press/2004/OCSoilandgasfacts.pdf>
Texas Transportation Institute 27 GCOOS Project Report
National Office for Integrated and Sustained Ocean Observations: Ocean.US. Home page. <http://www.ocean.us/> National Data Center Buoy. C-MAN program. June 26, 2002. <http://www.ndbc.noaa.gov/cman.phtml> National Data Center Buoy. Moored Buoys. June 6, 2002. <http://www.ndbc.noaa.gov/hull.shtml> NOAA/NOS CO-OPS. NWLON: National Water Level Observing Network. April 1998. <http://www.co-ops.nos.noaa.gov/d_nwlop.html> NOAA Coastal Services Program. Western Gulf of Mexico. <http://www.csc.noaa.gov/coos/texas_gulf.html> NOAA Coastal Services Program. Eastern Gulf of Mexico and Florida Atlantic Coast. <http://www.csc.noaa.gov/coos/florida.html> Northern Gulf of Mexico Littoral Initiative. NGLI Home Page. <https://www.navo.navy.mil/NGLI> Ocean.US, “Lessons Learned from Gulf of Maine Ocean Observing System (GoMOOS) From Start-Up to Operations” <http://www.ocean.us/documents/doc-catalogue.jsp> Oceanweather Inc. Data Page. <http://www.oceanweather.com/data/index.html> Petroleum News. “Gulf looks good for oil, not gas.” 11 May, 2004. <http://www.petroeumnews.com/pnarch/030511-05.htm> Physical Oceanographic Real Time System. Houston/Galveston PORTS. September 14, 2000. <http://www.co-ops.nos.noaa.gov/hgports/hgports.html> Physical Oceanographic Real Time System. Tampa Bay PORTS. November 15, 2001. <http://www.co-ops.nos.noaa.gov/tbports/tbports.html> Schaudt K. “Private Sector Concerns.” Industry-IOOS Workshop. March 2, 2004. TABS. Texas Automated Buoy System. Home Page. <http://resolute.gerg.tamu.edu/Tglo> Titlow J. “Can the private sector help fund the academic and public sectors?” Industry-IOOS Workshop. March 2, 2004. US Army Corps of Engineers Waterways Experiment Station. Coastal Engineering Branch/Operations & Analysis Group. February 20, 2002. <http://sandbar.wes.army.mil/public_html/pmab2web/htdocs/main.html
Texas Transportation Institute 28 GCOOS Project Report
WAVCIS. Wave Current Surge Information Center. Home page. February 10, 2004. <http://wavcis.csi.lsu.edu> Weathernews. Marine Services. <http://www.us.weathernews.com/marine/default.htm>
Texas Transportation Institute 29 GCOOS Project Report
APPENDIX 1: INTERVIEWS A. Anis, personal interview, October 17, 2003, Texas A&M University – Galveston. A. Landry, personal interview, October 29, 2003, Texas A&M University – Galveston. A. Thurlow, personal communication, October 1, 2003, Diamond Offshore Drilling, Inc. B. Blackburn, personal interview, October 17, 2003, Texas Maritime Academy, Texas A&M University – Galveston. C. John, personal interview, March 28, 2004, Cresent. C. Murphy, personal interview, November 10, 2003, Corps of Engineers – Galveston District. D. Morris, personal interview, March 4, 2004, Weatherflow. D. Short, personal interview, December 19, 2003, Crescent River Pilots. E. Chapman, personal interview, November 3, 2003, Military Sealift Command. ERA department head, personal interview, March 26, 2004. G. Ward, personal interview, November 2003, University of Texas Center for Research of Water Resources. J. Quintrell, personal interview, September 24, 2003, GOMOOS. J. Rizzo, personal interview, December 8, 2003, TCOON. J. Schwartz, personal interview, October 29, 2003, Texas A&M University - Galveston. J. Warrelmann, personal communication, December 17, 2003, National Weather Service/NOAA. M. Arhelger, personal interview, November 10, 2003, PBS&J. N. Guinasso, personal interview, August 15, 2003, Texas A&M University - GERG. P. Jenson, personal interview, November 13, 2003, PBS&J. R. Greene, personal communication, February 19, 2004, EPA. T. Dellapena, personal communication, October 15, 2003, Texas A&M University - Galveston. T. Orsi, personal interview, March 15, 2004, NOAA/NCDDC. S. Smith, personal interview, November 3, 2003, Patriot Shipping. V. Wallace, personal interview, February 25, 2004, Alliance Marine Services. W. Ansell, personal interview, October 25, 2003, Eagle Tankers. W. Nowlin, personal interview, August 18, 2003, Texas A&M University. W. Thomas, personal interview, November 3, 2003, Osprey Lines. Y. Park, personal interview, December 3, 2003, Texas A&M University.
Texas Transportation Institute 30 GCOOS Project Report
APPENDIX 2: FUTURE CONTACTS Anis, A. Texas A&M University at Galveston [email protected] 409-740-4987 Landry, A. Texas A&M University at Galveston [email protected] 409-740-4989 Orsi, T. National Oceanographic and Atmospheric Agency/NCDDC [email protected] 228-688-3908 Ward, G. University of Texas Center for Research of Water Resources
[email protected] 512-471-0114
Texas Transportation Institute 31 GCOOS Project Report
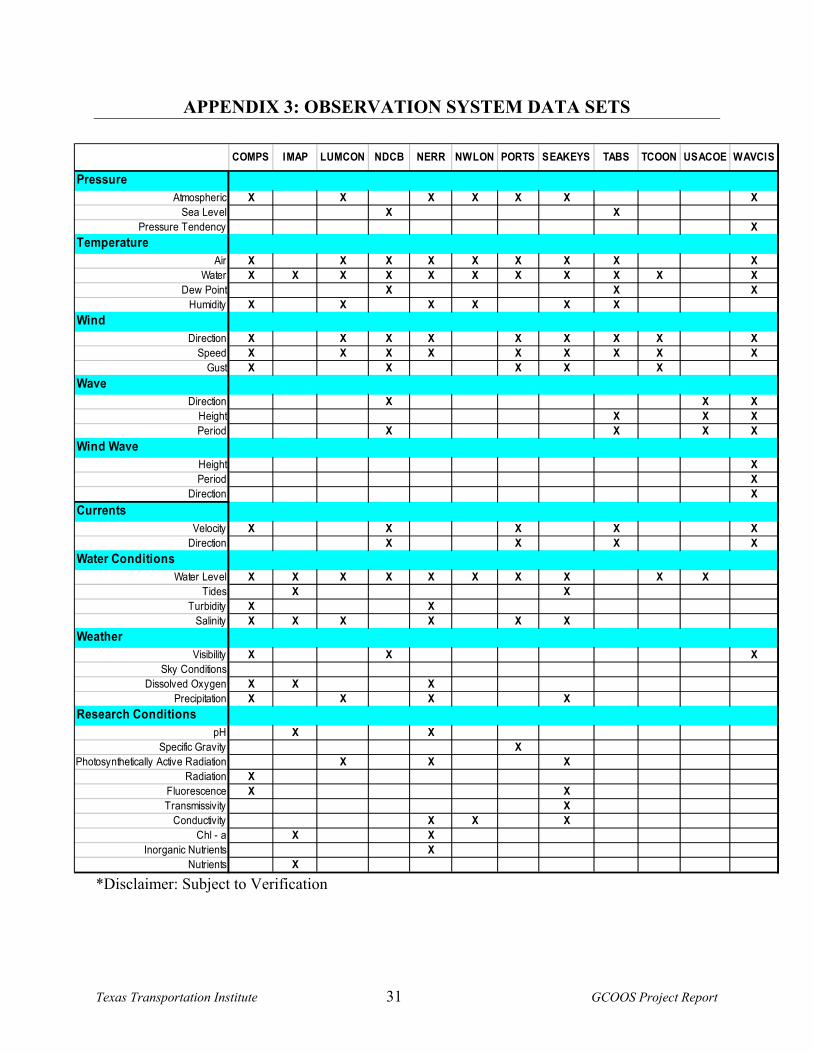
APPENDIX 3: OBSERVATION SYSTEM DATA SETS
*Disclaimer: Subject to Verification
COMPS IMAP LUMCON NDCB NERR NWLON PORTS SEAKEYS TABS TCOON USACOE WAVCIS
PressureAtmospheric X X X X X X X
Sea Level X XPressure Tendency X
TemperatureAir X X X X X X X X X
Water X X X X X X X X X X XDew Point X X X
Humidity X X X X X XWind
Direction X X X X X X X X XSpeed X X X X X X X X X
Gust X X X X XWave
Direction X X XHeight X X XPeriod X X X X
Wind WaveHeight XPeriod X
Direction XCurrents
Velocity X X X X XDirection X X X X
Water ConditionsWater Level X X X X X X X X X X
Tides X XTurbidity X X
Salinity X X X X X XWeather
Visibility X X XSky Conditions
Dissolved Oxygen X X XPrecipitation X X X X
Research ConditionspH X X
Specific Gravity XPhotosynthetically Active Radiation X X X
Radiation XFluorescence X XTransmissivity X
Conductivity X X XChl - a X X
Inorganic Nutrients XNutrients X