a visual approach to fraud detection and investigation - giuseppe francavilla
TRANSCRIPT

A visual approach to fraud detection and investigation
Roma- 24febbraio 2017

Summary
o Graph Technologies
o Platform Overview
o Use Cases
o Graph Techniques
“Are you astonished Aulus, that our friend Fabullinus is so frequently deceived?
A good man has always something to learn in regard to fraud.”
- Marcus Aurelius -

Graph VisualisationGraph visualisation (aka Link Analysis or Network Analysis) is the process of creating images to show graph data.
Graph visualisation allows you to explore connected data and:
- See patterns more clearly - Perform analysis- Answer questions

Interactive Visualisation engages intuition and creativity, making it easy for a user to:
- “Consume” a large amount of data
- Discover, map, group and filter information.
- Understand context and see details
InteractiveVisualisation

1. Data storeStructured &
unstructured data
Feedback loop
Alerts
2. StructureEntity Extraction, Entity Resolution
3. LoadFraud database
4. ProcessRule-based scoring & predictive analytics
Data streamed or loaded
5. Case Management
Client risk ratingInvestigation
Reporting
6. VisualizeAggregate & Network
view
Traditionalplatforms
Traditional“monolithic”,singlesupplier,full-stacksolutions:
Enterprise-ready network analysis tools available on the market:
- tend to be expensive
- lack extensibility
- are unable to cope with demands for information from new data sources
What was great yesterday is average today and poor tomorrow.
Modern web and Big Data technologies can deliver scalable network analysis at reasonable costs.
Challenge: - integrating components into an end to end solution
- robust and user friendly front-end

Technology & Analytics Innovation
Analytics
Data
Architecture
Visualization
IT TeamData Scientist
- Customise- Create- Iterate

UseCasesApplication Fraud
Review FraudIdentity Theft Account Takeover
Claims Fraud Transaction Fraud
Commonfactors:1. Lotsofdenselyconnecteddata
2. Peopleneedtoseeanomaliesorpatterns

GraphTechnologyroles
Graph visualisation can play two roles in combating fraud:
it can be useful in both fraud detection and fraud investigation.

Network with single, connectionpoint
Secondary link outside of hub of network
Detecting- UnusualPatternsWith large numbers of data endpoints, a zoomed-out view helps identify broader patterns in the data.
Zooming in on the graph can reveal which nodes are acting as hubs, holding the graph together, and those nodes are
often important.

Detecting– Linkingitemsincommon
Examplenodes:AccountsPoliciesAddressesVehicles
Examplelinks:TransactionsOwnershipEvents
Fraud is the synthesis of false connectionsVisualization helps humans uncover these anomaliesGlobal v Centered; anomaly detection vs investigation

Link through Account/Policy holder with same address, email & phone.
Fraud ring
Detecting– RingExpansionPattern

Initial claim rejected but policy holder has reclaimed for a similar incident a week later
Detecting– Fraud:MultipleClaimsPattern

“KeyLines has brought a step-change in how we communicate and use data. Within a week, new frauds were detected with the system. By introducing this kind of leading-edge software,
we have fixed a problem for today, and also ensured we can meet our members’ future needs.”
– Simon Fitzgerald, Data Sharing Services Manager
Investigating– FraudCIFAS

Multiplesourcesandbuildingagraphdashboardtoexploreinterconnecteddata
Most aggregated views are only useful once you understand what you need to look for. Graph is the tool to bridge the gap between the tabular presentation and the aggregated views available in dashboards.
✔ Unified Model:Different Graphs for Different Scales and different Questions
✔ MultipurposeConnect / see / interactInspect individual itemsExplore behavior at scale
✔ Visual Spot relationships, patterns, outliers
“Our platform can process 1,000,000 events per second”
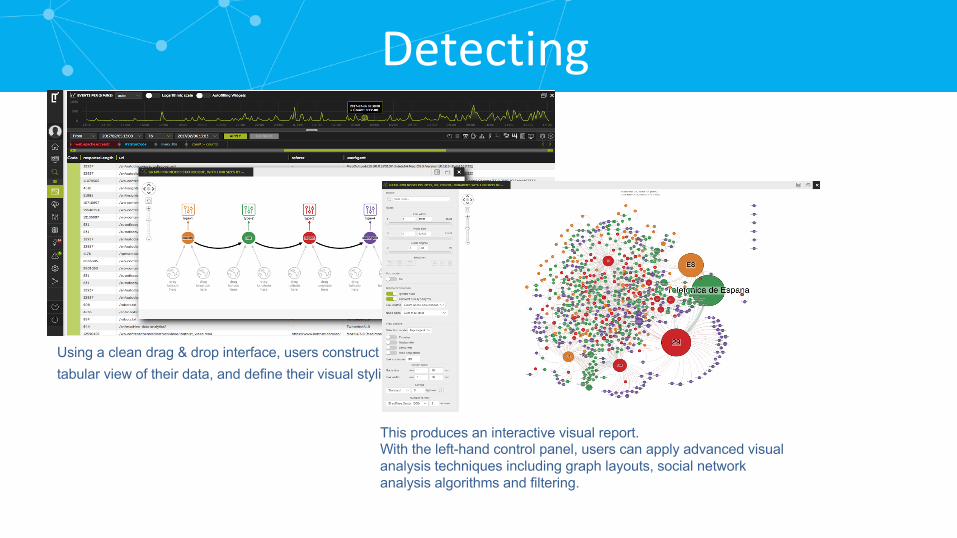
Detecting
Using a clean drag & drop interface, users construct a graph model from a tabular view of their data, and define their visual styling.
This produces an interactive visual report.With the left-hand control panel, users can apply advanced visual analysis techniques including graph layouts, social network analysis algorithms and filtering.

Detecting

ReviewFraud● User written reviews are critical to online
commerce
● Sites like Amazon, TripAdvisor, Booking.comall put their reviews front-and-center to drive sales and site visits
● One study showed a 19% increase in revenue for a 1 star increase in average rating on Yelp
● This creates an ‘unhealthy ecosystem’ of fraudsters looking to artificially inflate or deflate reviews of products
● The volume makes it difficult to read each review individually
● Graph visualization can help

ReviewFraud
● First, we need to format the review data as a graph
● The nodes will be the concrete things in our data
○ First, the products/businesses being reviewed○ Second, the review itself, which has the
date/time of the review submission and the star rating as a property
○ Third, the known properties of the reviewer such as device fingerprint, IP address, and e-mail address
● The edges represent the links between the reviewer, the review, and the business

ReviewFraud
● Let’s zoom in to identify suspicious patterns● On the left, we have used the KeyLines timebar to zoom in to reviews only posted on
a single day● On the right, we see multiple negative reviews of a restaurant that day from users with
no other activity ever. Is this legitimate or an attempt to defame?

ReviewFraud
The graph show use of a donut to illustrate whether the person left positive or negative reviews of shopping experiences.
If this were filtered by timebar, someone who only left positive reviews in a short space of time, especially for venues in places far apart, might be suspicious.
We can spot Zoey straight away without having to look closely at the link colours.

Techniquesfordealingwithlargedatavolumes
How many nodes and links can you add to a graph ?
5000 nodes and 5000 links: loading huge networks will overload your users and not help them find insights

TheMagnificentSeven
5000 nodes and 5000 links: loading huge networks will overload your users and not help them find insights
Efficientlayouts
Aggregation
Geospatial
Filtering
Time
Expandoutwards
SocialNetworkAnalytics

Techniquesfor“Customer360”Dynamicnetworks Aggregation
GeographicFiltering

Techniquesfor“360”view”Structures
CommunitiesNodeimportance-
KeyPlayers
Dependencies
