a62588 emissions testing at company's … · i certify that all work performed in the...
TRANSCRIPT

A62588 EMISSIONS TESTING AT CALIFORNIA PORTLAND CEMENT COMPANY'S COLTON PLANT; COAL FIRING AND COAL WITH TIRES FIRING
PREPARED FOR:
CALIFORNIA PORTLAND CEMENT COMPANY 695 SOUTH RANCHO AVENUE COLTON, CALIFORNIA 92324
FOR SUBMITTAL TO:
SOUTH COAST AIR QUALITY MANAGEMENT DISTRICT 21865 EAST COPLEY DRIVE DIAMOND BAR, CALIFORNIA 91765
PREPARED BY:
DELTA AIR QUALITY SERVICES, INCORPORATED 1845 NORTH CASE STREET ORANGE, CALIFORNIA 92865 (71 4) 279-6777
ARLENE C. BELL
B) SEPTEMBER 1999

AB2588 EMISSIONS TESTING AT CALIFORNIA PORTLAND CEMENT COMPANY'S COLTON PLANT; COAL FIRING AND COAL WITH TIRES FIRING
PREPARED FOR:
CALIFORNIA PORTLAND CEMENT COMPANY 695 SOUTH RANCHO AVENUE COLTON, CALIFORNIA 92324
FOR SUBMITTAL TO:
SOUTH COAST AIR QUALITY MANAGEMENT DISTRICT 21 865 EAST COPLEY DRIVE DIAMOND BAR, CALIFORNIA 91765
PREPARED BY:
DELTA AIR QUALITY SERVICES, INCORPORATED 1845 NORTH CASE STREET ORANGE, CALIFORNIA 92865 (714) 279-6777
ARLENE C. BELL
SEPTEMBER 1999

REPORT REVIEW AND CERTIFICATION
I certify that all work performed in the preparation and production of this report were performed by me or under my supervision and that all data presented are authentic.
Arlene C. Bell Vice President
Date
I certify that I have reviewed this report, both in form and content, and that all data, calculations, and presentations are authentic, accurate, and complete.
Arlene C. Bell Vice President
Date

e CONTENTS
SECTION VOLUME PAGE
1.0 INTRODUCTION AND SUMMARY ............................................. I ..................... 1
2.0 UNIT OPERATION ........................................................................ 1 ..................... 7 2.1 UNIT DESCRIPTION ...................................................... 1 ..................... 7 2.2 UNIT OPERATING CONDITIONS DURING TESTING ...... 1 ..................... 8
..................... 3.0 TEST PROGRAM DESCRIPTION ................................................. I 9 3.1 TEST PROGRAM OVERVIEW ...................................... 1 ..................... 9 3.2 TEST SCHEDULE ........................................................... 1 ..................... 9
..................... 3.3 SAMPLE LOCATION ............................ ............ . . . . . . . . . . . . 1 9 3.4 SAMPLING & ANALYTICAL PROCEDURES ......... .. ....... I ................... 15
................... 4.0 TEST RESULTS ............................................................................ I 26 ...................................................... 4.1 TOTAL PARTICULATE I ................... 26
4.2 PM., ..................... .. ..................................................... 1 ................... 29 4.3 METHANE AND NON-METHANE HYDROCARBONS ....... 1 ................... 32 4.4 TRACE HYDROCARBONS ............................................ 1 ................... 34 4.5 ALDEHYDES .................................................................... 1 ................... 37 4.6 PAH ............................................................................. 1 ................... 40
................... 4.7 DlOXlNlFURAN ................................................................. I 43 4.8 PCB ............................................................................... I ................... 48 4.9 METALS ........................................................................... 1 ................... 51 4.10 TOTAL AND HEXAVALENT CHROMIUM .......................... 1 ................... 54 4.11 HYDROCHLORIC AND HYDROFLUORIC ACID ............... 1 ................... 57 4.1 2 ASBESTOS ........................................................................ 1 ................... 60

LIST OF TABLES VOLUME PAGE
SUMMARY OF EMISSIONS TEST RESULTS. CRITERIA ..................... ............................................................................... POLLUTANTS I 2
SUMMARY OF EMISSIONS TEST RESULTS . VOLATILE ..................... ..................................................................... ORGANIC SPECIES 1 3
SUMMARY OF EMISSIONS TEST RESULTS. ..................... .......................................... SEMI-VOLATILE ORGANIC SPECIES I 4
SUMMARY OF EMISSIONS TEST RESULTS. INORGANIC SPECIES .............................................................................. I ..................... 6
.... ..................... ....................... SUMMARY OF OPERATING CONDITIONS .. 1 8 ................... SUMMARY OF PROGRAM CONTACTS ................................ 1 10
..................... ................... TEST SCHEDULE. BASELINE TESTING ON COAL I 11 ................. ................... TEST SCHEDULE, TESTING ON COAL WITH TIRES 1 13
................... TEST METHODS .......................................................................... 1 15 ........ ................... TRACE METALS ANALYSIS FROM MULTIMETALS TRAIN 1 23 ......... ................... TOTAL PARTICULATE EMISSIONS, BASELINE TESTING I 27
............ ................... TOTAL PARTICULATE EMISSIONS. COAL WITH TIRES 1 28 ................... ........................................ PM,, RESULTS. BASELINE TESTING 1 30 ................... ......................................... PM,, RESULTS, COAL WITH TIRES 1 31
METHANE AND NON-METHANE HYDROCARBONS .................................. ................... EMISSIONS, BASELINE TESTING 1 33
METHANE AND NON-METHANE HYDROCARBONS ..................................... ................... EMISSIONS, COAL WITH TIRES I 33
................... ................... TRACE HYDROCARBON RESULTS, COAL FIRING 1 35 TRACE HYDROCARBON RESULTS. COAL FIRING
WITH TIRES ...................................................................... 1 ................... 36 FORMALDEHYDE, ACETALDEHYDE AND ACROLEIN
................... RESULTS. BASELINE TESTING ....................................... 1 38 FORMALDEHYDE, ACETALDEHYDE AND ACROLEIN
................... ....................................... RESULTS, COAL WITH TIRES 1 39 ..................... ................... PAH EMISSIONS RESULTS. BASELINE TESTING I 41
........................ ................... PAH EMISSIONS RESULTS, COAL WITH TIRES I 42 ......................... ................... PCDDIPCDF EMISSIONS, BASELINE TESTING 1 44
PCDDIPCDF TOXIC EQUIVALENTS USING EPA ..................................... ................... FACTORS, BASELINE TESTING I 45
................... PCDDIPCDF EMISSIONS, COAL WITH TIRES ............................ I 46 PCDDIPCDF TOXIC EQUIVALENTS USING EPA
................... ....................................... FACTORS, COAL WITH TIRES I 47 .................... ................... .............. PCB EMISSIONS. BASELINE TESTING .. 1 49
................... PCB EMISSIONS. COAL WITH TIRES ....................................... 1 50 ................... ................... TRACE METALS EMISSIONS, BASELINE TESTING 1 52
..................... ................... TRACE METALS EMISSIONS, COAL WITH TIRES 1 53 TOTAL AND HEXAVALENT CHROMIUM RESULTS
BASELINE TESTING ......................................................... 1 ................... 55 TOTAL AND HEXAVALENT CHROMIUM RESULTS
................... ............................................................ COAL WITH TIRES 1 56
(continued)
R040836

LIST OF TABLES VOLUME PAGE
4-23 HYDROCHLORIC AND HYDROFLUORIC AClD ................... EMISSIONS, BASELINE TESTING ............................................... I 58
4-24 HYDROCHLORIC AND HYDROFLUORIC ACID ................... EMISSIONS, COAL WITH TIRES .............................................. 1 59 ................... 4-25 ASBESTOS EMISSIONS, BASELINE TESTING ......................... 1 61 ................... 4-26 ASBESTOS EMISSIONS, COAL WITH TIRES ............................. 1 62

LIST OF APPENDICES VOLUME PAGE
................... A .............. ................. QUALITY ASSURANCE INFORMATION .. II A-I A. l SCAQMD and CARB Certification ...................................... II ................. A-2
............................... A.2 Quality Assurance Program Summary II ................. A-3 A.3 CEM System Description l I ................. A-8 A.4 Gas Certification and Equ I ............... A-14
................. B PROCESS DATA ..................................................................... I 8-1 ......................................... ................. 8.1 Plant Operating Data Baseline 11 8-2
................. 8.2 Plant CEMS Data Baseline ll 8-3 ....................... ................. 8.3 Plant Operating Data Coal with Tires Firing II 8-4
8.4 Plant CEMS Data Coal with Tires Firing ............................. II ................. 8-5
C TEST DATA AND LABORATORY REPORTS ............................... I I ................. C-I C.l Sample Location I ................. C-2 C.2 CEM Performance Data Baseline ...................................... I ................. C-3 C.3 CEM Data Baseline ............................................................ ll ................. C-4 C.4 CEM Performance Data with Tires ..................................... II ................. C-5 C.5 CEM Data with Tires ................................................. I ................. C-6 C.6 Particulate Data Baseline ................................................... II ................. C-7 C.7 Particulate Data with Tires ............................................... I ................. C-8 C.8 PM,, Data Baseline ............................................................ II ................. C-9 C.9 PM,, Data with Tires ......................................................... I ............... C-10 C.10 Methane and Total Non-Methane Hydrocarbons
Baseline ............................................................................. II ............... C-I I C . l l Methane and Total Non-Methane Hydrocarbons
With Tires ................................................................... I ............... C-12 C.12 Trace Hydrocarbons Baseline ............................................ II ............... C-13 C.13 Trace Hydrocarbons with Tires .......................................... I ............... C-14 C.14 Formaldehyde, Acetaldehyde. and Acrolein Baseline ......... ll ............... C-15 C.15 Formaldehyde, Acetaldehyde, and Acrolein with Tires ....... ll ............... C-16 C.16 PAH Baseline ..................................................................... II ............... C-17 C.17 PAH with Tires ................................................................. I ............... C-18 C.18 DioxinIPCB Baseline .......................................................... II ............... C-I9
...................................... C.19 DioxinlPCB Comparison Baseline II ............... C-20 C.20 DioxinlPCB with Tires ........................................................ I ............... C-21
.................................... C.21 DioxinlPCB Comparison with Tires II ............... C-22 C.22 Metals Baseline .............................................................. II ............... C-23
................................................................ C.23 Metals with Tires II ............... C-24 ......................... ............... C.24 Total and Hexavalent Chromium Baseline ll C-25
C.25 Total and Hexavalent Chromium with Tires ........................ II ............... C-26 ...................... ............... C.26 Hydrochloric and Hydrofluoric Acid Baseline ll C-27 .................... ............... C.27 Hydrochloric and Hydrofluoric Acid with Tires II C-28
C.28 Asbestos Baseline .......................................................... I ............... C-29 ............... C.29 Asbestos with Tires ............................................................ II C-30
(continued)

LIST OF APPENDICES VOLUME PAGE
................. ........................................................................... D CALCULATIONS 11 D-I
................. ......................................... D . l General Emissions Calculations I1 D-2 ......................................... ................. D.2 Specific Emissions Calculations II D-5
................. ................................................................... E CHAIN OF CUSTODY I1 E-I ........................................................ ................. E.l Baseline Samples I E-2
................. ..................................................... E.2 Coal with Tires Samples II E-3
................. F INSTRUMENT STRIP CHARTS .................................................... I1 F-I . . ................. F.1 Baseline Cond~t~on ........................................................... I1 F-2
................. F.2 Coal with Tires Condition ................................................... 11 F-3
G LABORATORY INSTRUMENT DATA ......................................... Ill ................ G-I ............. ................ G.l AtmAA Baseline (Aldehyde. Total and Trace HC) Ill G-2
................ G.2 AtmAA with Tires (Aldehyde. Total and Trace HC) ............ Ill G-3 ............................ ................ G.3 Curtis and Tompkins (Metals. HCI. HF) 111 G-4
G.4 Research Triangle institute (Total and Hexavalent Chromium ........................................................................ 111 ................ G-5
............................................. G.5 Philip Analytical (Asbestos) 111 ................ G-6 ......................................... ................ G.6 Alta (PCDDIPCDF . PCB. PAH) 111 G-7
vii

1.0 INTRODUCTION AND SUMMARY
California Portland Cement Company (CPCC) contracted Delta Air Quality Services, Incorporated (Delta) to conduct emissions testing on cement kiln number 1 to provide baseline emissions data while firing coal and comparison emissions data while firing coal with tires. The testing consisted of air toxics tests required for AB2588 reporting and criteria pollutant measurements.
The tests that were conducted at each condition were:
Triplicate tests for particulate; Triplicate tests for particulate matter less than 10pm (PM,,);
0 Triplicate tests for methane and total non-methane hydrocarbons; Triplicate tests for trace hydrocarbons; Triplicate tests for formaldehyde, acetaldehyde, and acrolein; Triplicate tests for polycyclicarornatic hydrocarbons (PAH); Triplicate tests for PCDDIPCDF and polychlorinated biphenyls (PCBs); . . ~irkdtaneous comparison tests for PCDDIPCDF and PCBS; Triplicate tests for metals: antimony, arsenic, barium, beryllium, cadmium, chromium, copper, lead, manganese, mercury, nickel, phosphorus, selenium, silver, thallium, and zinc; Triplicate tests for total and hexavalent chromium; Triplicate tests for hydrochloric and hydrofluoric acid; Triplicate tests for asbestos;
During the test periods, the facility collected plant operating data and CEMS data including coal and tire usage, kiln feed input, kiln exit 0, levels, and stack emissions levels of NO,, SO,, CO, CO,, and 0,.
Testing was conducted at the baseline condition from June 14 through June 19, 1999 by Arlene Bell, Stafford Pease, Craig Fry, and Dave Wonderly of Delta. Testing was conducted by Delta on the coal and tire firing condition from June 30 to July 7, 1999 by Arlene Bell, Bob Finken, Stafford Pease, Craig Fry, and Dave Wonderly. Arlene Bell supervised the emissions testing for Delta. Anne McQueen of Environ was the Program Manager. Mr. Gary Thornberry was the on-site plant representative for California Portland Cement.
Tables 1-1 through 1-4 summarize the program results and provide a comparison of emissions results for the two operating conditions.
This report contains a unit description and operating conditions during testing in Section 2. Section 3 contains a test program overview including the responsible organization for each task, the test schedule, sample locations, and test procedures. Section 4 contains detailed results for each test run. The appendices contain quality assurance infonation, process operating data, test data and laboratory reports, example calculations, chain of custody documentation and instrument strip charts.

TABLE 1-1 SUMMARY OF EMISSIONS TEST RESULTS
CRITERIA POLLUTANTS CALIFORNIA PORTLAND CEMENT COMPANY
KILN I JUNE - JULY,1999
Parameter Coal Firing Coal with Tires Firing
ar/dscf - lblhr m f - lblhr
Total Particulate 0.0070 7.35 0.0075 8.01
Front-Half Particulate 0.0065 6.80 0.0052 5.53
Back-Half Particulate 0.0005 0.55 0.0023 2.48
PMIO 0.0033 3.68 0.0053 5.82
G!€El - Iblhr @!3 - Iblhr
Non-Methane Hydrocarbons 57.5 18.16 46.9 14.81
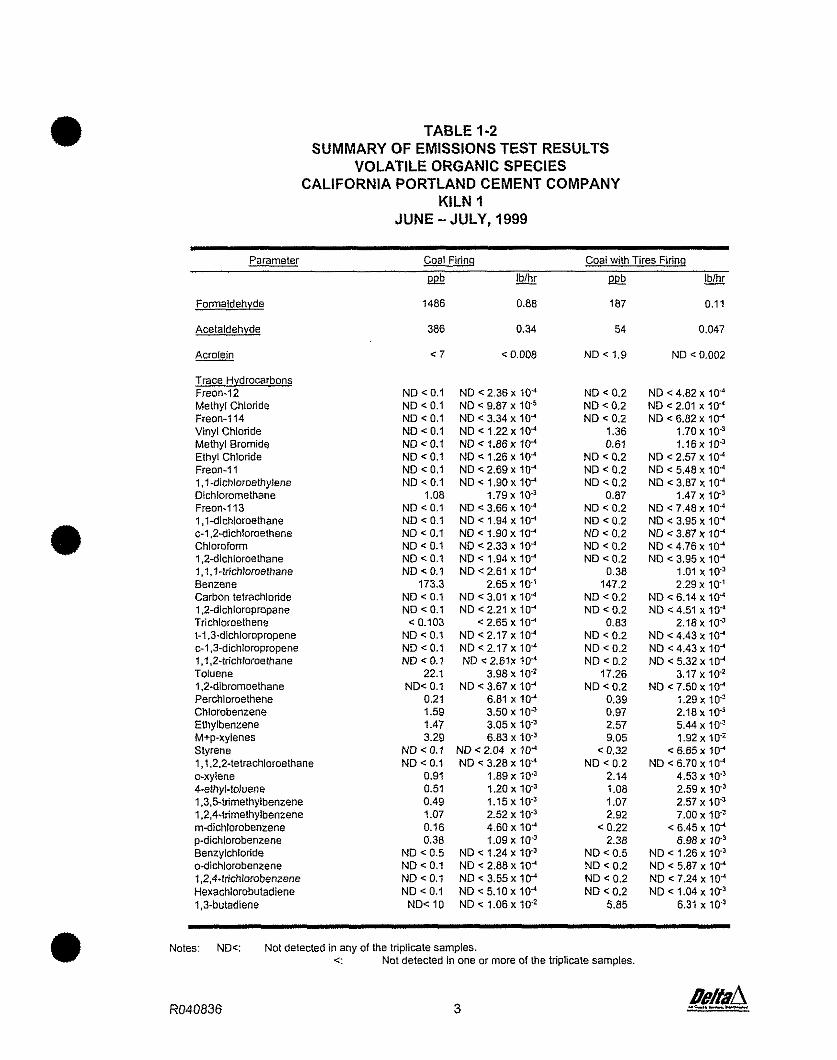
TABLE 1-2 SUMMARY OF EMISSIONS TEST RESULTS
VOLATILE ORGANIC SPECIES CALIFORNIA PORTLAND CEMENT COMPANY
KILN I JUNE -JULY, 1999
Parameter Coal Firing Coal with Tires Firinq
@ - lblhr
Formaldehvde
Acetaldehyde
Trace Hydrocarbons Freon-12 Methyl Chloride Freon-1 14 Vinyl Chloride Methyl Bromide Ethyl Chloride Freon-1 1 1.1-dlchloroethylene Dichloromethane Freon-1 13 1 ,ldichloroethane C-1 2-dichloroethene Chlorofom 1 .Zdichloroethane l .l. 1-trichloroethane Benzene Carbon tetrachloride 1.2-dichloropropane Trichloroethene I-13-dichloropropene C-1 .3-dichloropropene 1.1.2-lnchloroethane Toluene 1.2-dibromoethane Perchloroethene Chlorobenzene Ethylbenzene M+p-xylenes Styrene 1,1.2,2-letrachloroethane o-xylene 4-ethvl-Ioluene
mdichlorobenzene p-dichlorobenzene Benzylchloride o-dichlorobenzene 1,2,4.lrichiorobenzene Hexachlorobutadiene 1,3-butadiene
lblhr -
Notes: NDc: Not detected in any of the triplicate samples. <: Not detected In one or more of the triplicate samples

TABLE 1-3 SUMMARY OF EMISSIONS TEST RESULTS
SEMI-VOLATILE ORGANIC SPECIES CALIFORNIA PORTLAND CEMENT COMPANY
KILN 1 JUNE - JULY 1999
Parameter Coal Firing Coal Firins with Tires
PCDDIPCDF
2378 TCDD 12378 PeCDD 123478 HxCDD 123678 HxCDD 123789 HxCDD 1234678 HpCDD OCDD 2378 TCDF 12378 PeCDF 23478 PeCDF 123478 HxCDF 123678 HxCDF 234678 HxCDF 123789 HxCDF 1234678 HpCDF 1234789 HpCDF OCDF TOTAL TCDD TOTAL PeCDD TOTAL HxCDD TOTAL HoCDD
TOTAL PeCDF TOTAL HxCDF TOTAL HpCDF
Total PCDDIPCDF
2.3.7,8 TCDD Toxic Equivalents
PCB's - Monochiorobiphenyl Dichiorobiohenvi ~richiorob/pheiyi Tetrachlorobiphenyl Pentachlorobiphenyi Hexachlorobiphenyi Heptachiorobiphenyl Octachiorobiphenyl Nonachiorobiphenyi Decachiorobiphenyi
lblhr -
Notes: PCDDIDF and PC8 emissions results are the overall average of the triplicate runs and the average of the two simultaneous comparison runs (4 values contribute to the average result).
(continued on next page)

TABLE 1-3 (continued) SUMMARY OF EMISSIONS TEST RESULTS
SEMI-VOLATILE ORGANIC SPECIES CALIFORNIA PORTLAND CEMENT COMPANY
KILN 1 JUNE - JULY 1999
(continued)
P AH - Napthalene 2-Methylnapthalene Acenaphthylene Acenaphthene Fluorene Phenanthrene Anthracene Fluoranthene Pyrene Benz(a)anthracene Chrysene Benz(b)Ruoranthene Benz(k)fluoranthene Benzo(e)pyrene Benzo(a)pyrene Perylene Indeno(l,2,3-cd)pyrene Dibenzo(a.h)anthracene Benzo(g,h,i)perylene
lblhr ua/dscm 3.94X 10⁻² 70.86 1 . 7 9 ~ 10-3 . 0.102 4.97X 10⁻⁴ . -4 0.0963 1.27X 10⁻⁵ .: ND< 0.0048 4.23X 10⁻⁵ c 0.0097 1 .08x 10-3. 1.76 5.13X 10⁻⁵ 0.0064 2.34X 10⁻⁴ 0.150 3.31X 10⁻⁵ NDc 0.0113 8.19X 10⁻⁶ < 0.0008 2.05X 10⁻⁶ NDc 0.0056
c 4.83X 10⁻⁷ NDc 0.0045 NDc 3.62X 10⁻⁷ NDc 0.0008 NDc 3.62X 10⁻⁷ c 0.0008 NDc 3.62X 10⁻⁷ NDc 0.0008 NDc 3.62X 10⁻⁷ NDc 0.0008 NDc 3.62X 10⁻⁷ ND< 0.0008 ND< 3.62X 10⁻⁷ ND< 0.0008 NDc 3.62X 10.7 < 0.0009
lblhr 3.35 x 10⁻²

TABLE 1-4 SUMMARY OF EMISSIONS TEST RESULTS
INORGANIC SPECIES CALIFORNIA PORTLAND CEMENT COMPANY
JUNE - JULY 1999
Parameter Coal Firing Coal with Tires Firing
Hydrochloric Acid
Hydrofluoric Acid
Asbestos
E!PE - Iblhr PEL! - lblhr
c 0.2 < 0.017 0.6 0.43
0.04 0.016 0.06 0.024
fibersldscf
ND < 407
fibersldscf
ND c 399
iblhr - lblhr -
Total Chromium (from Cr6+ train) 0.74 3.44 x 10⁻⁴ 0.86 3.94 x 10⁻⁴
Hexavalent Chromium 0.48 2.33 x 10⁻⁴ 0.25 1.13 x 10⁻⁴
Antimony
Arsenic
Barium
Beryllium
Cadmium
Copper 2.34 1.11 x 10⁻³ 1.49 7.20 x 1 O4
Lead 2.50 1.19 x 10⁻³ 1.22 5.91 x lv4
Manganese
Mercury
Nickel
Phosphorus 5.03 2.39 x 10⁻³ 6.14 2.95 x 10⁻³
Selenium ND < 0.42 ND < 1.97 X l o 4 ND < 1.35 ND < 6.54 x lo4
Silver
Thallium
Zinc 9.93 4.71 x 10⁻³ 19.53 9.41 x 10⁻³

2.0 UNlT OPERATION
2.1 THE UNlT PROCESS
The production of portland cement is a four step process: 1) acquisition of raw materials; 2) preparation of the raw materials into raw mix; 3) pyroprocessing (high temperature reacting) of the raw mix to form portland cement clinker; and 4) grinding of the clinker into portland cement.
Pyroprocessing is the critical step in the conversion of raw materials into portland cement clinker. The system is generally described as a three-step process:
1. Drvinq and Preheatinq Zone: 70 F - 1650 F (20 C-900 C) Evaporation of free water. Evolution of combined water in the argillaceous components
2. Calcininq Zone: 1100 F - 1650 F (390 C-900 C) Calcination of the calcium carbonate to calcium oxide. Carbon in the form of CO, is a major constituent of the cement raw mix is eliminated during pyroprocessing.
3. Burnina Zone: 2200 F - 2700 F (1200 C - 1480 C) Reaction of calcium oxide with silicate to form dicalcium silicate. Reaction of calcium oxide with the aluminum and iron bearing constituents to form the liquid phase. Formation of the clinker nodules. Reaction of excess calcium oxide with dicalcium silicate to form tricalcium silicate. Flame temperatures often exceed 3400 F (1 870 C)
Colton Kilns:
Two huge ovens each ranging in size from 12 to 15 feet in diameter and 490 feet in length. The kiln is slightly inclined and rotates on its longitudinal axis. Raw materials are fed into the upper end of the kiln while fuels are burned in the lower end. As the kiln rotates, the raw materials move slowly from the upper end to the lower end at a rate controlled by the slope and rotational speed of the kiln.
The combustion gases released from fuels move up the kiln counter to the downward flow of raw materials. Heat energy is supplied to the kiln by burning pulverized coal, petroleum coke, oil, natural gas, and tire derived fuels.
Once the red hot clinker exits the kiln, is quickly cooled in the cooler, passing through the chunk breaker, and is conveyed to storage as an intermediate product.

2.2 UNIT OPERATING CONDITIONS DURING TESTING
Table 2-1 summarizes the operating conditions during each test day. Facility process and CEMS data was generally collected hourly throughout the test day.
Detailed process and CEMS data is contained in appendices B.l and 8.2 for the baseline condition. Appendices 8.3 and 8.4 contain data for the tire and coal fired condition.
Testing was conducted at steady full capacity operation for both test conditions. Testing was suspended on June 15, 1999 for coal mill repairs. Runs 2-PAH. Metals, Cr. and DioxinIPCB were discarded on that day.
TABLE 2-1 SUMMARY OF OPERATING CONDITIONS
CALIFORNIA PORTLAND CEMENT COMPANY JUNE - JULY 1999
Kiln Feed Coal Feed Tire Kiln Exit Stack NO, Stack CO Date Time tonslhr tonslhr Feed O,, % P P ~ P P ~
Baseline Testinq on Coal
43.01 7.62 OFF 41.07 7.96 OFF 42.65 7.96 OFF 44.33 8.07 OFF 44.78 7.87 OFF
Testina on Coal with Tires
Subst~tute Data. Substitute data is the value substituted if the reading falls below 10% of the span and is equal to 10% of span. Note. T~re feed is 1 t re per revolution (11-12% of total fuel).

3.0 TEST DESCRIPTION
3.1 TEST PROGRAM OVERVIEW
Table 3-1 presents a summary of the organizations and individuals responsible for the tasks necessary to complete the California Portland Cement Company Testing including subcontracted laboratories. This table contains each organization's role in the project, it's contact person, and their location and phone number.
3.2 TEST SCHEDULE
Tables 3-2 and 3-3 present the testing schedule for the baseline testing with coal and testing with coal and tires. Triplicate test runs were performed for all emission tests. In addition, two simultaneous DioxinIPCB tests were run at each condition for a total of five DioxinIPCB tests per condition. Testing was suspended on 6/15/99 for coal mill repairs.
3.3 SAMPLE LOCATION
3.3.1 Kiln 1 Stack
The sample location on the Kiln 1 stack is located 46 feet above the inlet breaching. Four sample ports are located at ninety-degree angles on the 138-inch inner- diameter stack. The ports are located 4 diameters downstream and 1.3 diameters upstream of flow disturbances. Twenty-four points were sampled for all tests requiring traverses.
Appendix C.l contains a schematic of the sample location. Cyclonic flow tests were performed by Delta in May 1999 on the Kiln 1 stack. The average flow angle was 0.29' with a standard deviation of 2.67'. This information is also included in Appendix C.1.

TABLE 3-1 SUMMARY OF PROGRAM CONTACTS
Activity Organization
Unit Operating Conditions. Coordination with SCAQMD and Delta
Program Management Coordination with
laboratories, Delta. SCAQMD
Exhaust Gas Emissions Testing, Particulate and
PMlo Analysis
Metals Analysis, HCI analysis, and HF
analysis
Hexavalent and Total Chromium (CARE 425)
Methane and Non- Methane Hydrocarbons Analysis, Aldehyde and
Trace Hydrocarbon analysis
Asbestos Analysis
DioxinlFuranlPCB and PAH Analysis
California Portland Cement
Environ
Delta Air Quality Services
Curtis and Tom~kins
Research Triangle Institute
Philip Analytical Services
Aita Analytical
Contact Location Phone
Gary 695 S. Rancho Avenue (909) 825-4260 Thornberry Colton. CA 92324
Anne McQueen 2010 Main Street (949) 798-3627 Suite 900
Irvine, CA 92614
Arlene Beii 2324 N. Batavia, (714) 279-6777 Bob Finken Suite 109
Orange, CA 92865
John Goyette 2323 5th Street (510) 486-0900 Berkeley, CA 94710
Kate Luk P.O. Box 12194 (919) 541-6569 Research Triangle Park.
NC 27709
Mike Porter 23917 Craftsman Road (818) 223-3277 Kochy Fung Caiabasas, CA 91302
Diana Kehler 4418 Pottsvilie Pike (610) 921-8833 Reading, PA 19605
Robert Mihei 5070 Robert J. Mathews (916) 933-1640 Parkway
El Dorado Hills. CA 95630

TABLE 3-2 TESTSCHEDULE
CALIFORNIA PORTLAND CEMENT COMPANY BASELINE TESTING ON COAL
KILN I JUNE 14-19,1999
--
Date Time Test Comments
PAH Field Blank Testing discontinued for coal mill repairs
3-DioxinlPCB 3-PAH
3-Metals 3-Chromium
DioxinlPCB Field Blank Chromium Field Blank
Metals Field Blank
4-DioxinlPCB 4-PAH
4-Metals 4-Chromium
I-Formaldehyde I-Hydrocarbons
Formaldehyde Field Spike 2-Formaldehyde 2-Hydrocarbons
Formaldehyde Field Blank # I 3-Hydrocarbons 3-Formaldehyde
Formaldehyde Field Blank #2
Formaldehyde Field Blank #3 5A-DioxinlPCB 5B-DioxinlPCB
1 -Trace Hydrocarbons 1-HCI
?-Asbestos
(continued)

TABLE 3-2 (continued) TEST SCHEDULE
CALIFORNIA PORTLAND CEMENT COMPANY BASELINE TESTING ON COAL
KILN I JUNE 14-19,1999
Date Time Test Comments
611 8/99 085210938 2-Trace Hydrocarbons 611 8/99 900 HCI Field Blank 611 8/99 900 Asbestos Field Blank 611 8199 094011030 3-Trace Hydrocarbons 6/18/99 1125-1510 2-HCI 611 8/99 1 127-1 300 2-Asbestos 611 8/99 1325-1355 3-Asbestos
3-HCI I-Particulate
1-PM 10 2-Particulate
Particulate Field Blank PM 10 Field Blank
2-PM 10 3-Particulate
3-PM 10
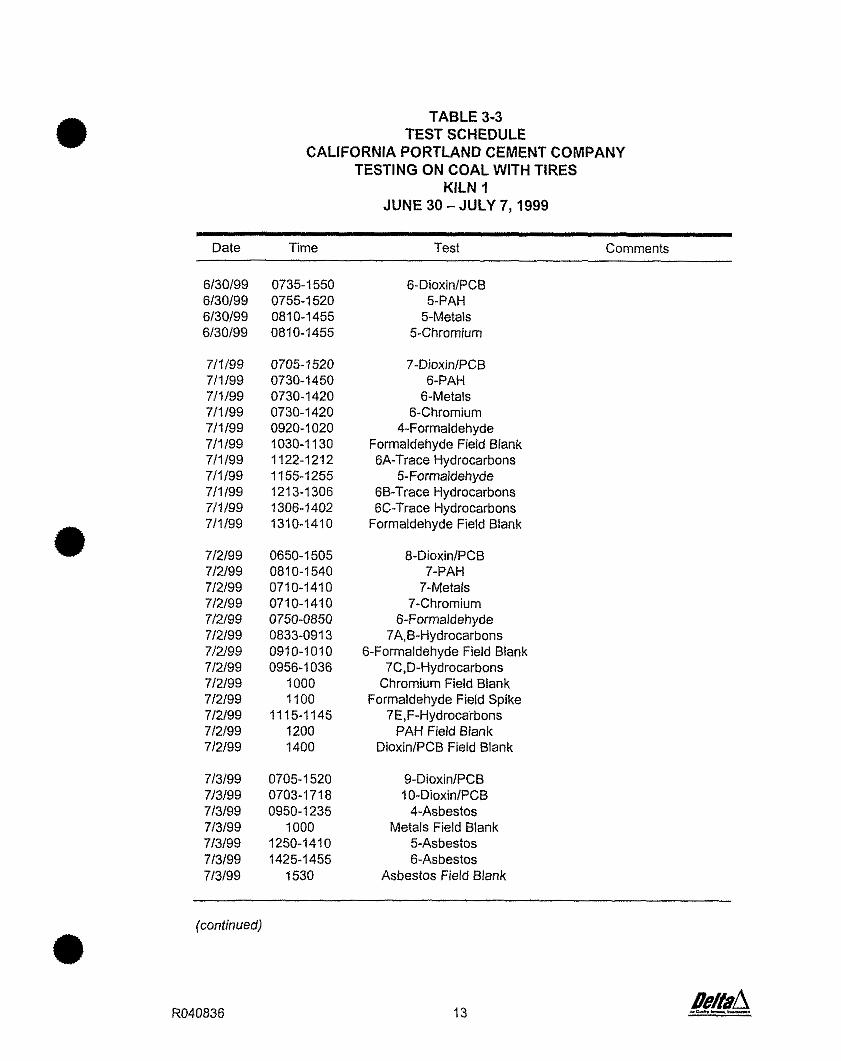
TABLE 3-3 TEST SCHEDULE
CALIFORNIA PORTLAND CEMENT COMPANY TESTING ON COAL WITH TIRES
KILN I JUNE 30 -JULY 7,1999
Date Time Test Comments
7-DioxinlPCB 6-PAH
6-Metals 6-Chromium
4-Formaldehyde Formaldehyde Field Blank 6A-Trace Hydrocarbons
5-Formaldehyde 6B-Trace Hydrocarbons 6C-Trace Hydrocarbons
Formaldehyde Field Blank
8-DioxinlPCB 7-PAH
7-Metals 7-Chromium
6-Formaldehyde 7A,B-Hydrocarbons
6-Formaldehyde Field Blank 7C,D-Hydrocarbons
Chromium Field Blank Formaldehyde Field Spike
7E,F-Hydrocarbons PAH Field Blank
DioxinlPCB Field Blank
9-DioxinlPCB 10-DioxinlPCB
4-Asbestos Metals Field Blank
5-Asbestos 6-Asbestos
Asbestos Field Blank
(continued)

TABLE 3-3 (continued) TEST SCHEDULE
CALIFORNIA PORTLAND CEMENT COMPANY TESTING ON COAL WITH TIRES
KILN I JUNE 30 -JULY 7,1999
Date Time Test Comments
5-PM10 6-HCI
HCI Field Blank Particulate Field Blank
6-PM10 PMlO Field Blank

3.4 SAMPLING AND ANALWICAL PROCEDURES
Test procedures for the California Portland Cement emission tests are presented in Table 3-4. Brief descriptions of the methods that were used and any modifications to standard methods are presented below.
TABLE 3-4 TEST METHODS
CALIFORNIA PORTLAND CEMENT COMPANY
Reference Measurement Detection No. of Duration Parameter Method Principle Limit Replicates of Test
per condition (Min.)
Particulate SCAQMD 5.2 Gravimetric 0.0002 grldscf 3 72
PM,, (including EPA Method Gravimelric 0.0002 grlsdscf 2 72 condensible PM,,) 201N202/5.2
Hydrocarbons (Methane SCAQMO 25.1 GClFlD 10 P P ~ 3 pain 60 and Total Non-Methane)
Trace Hydrocarbons TO-14 GCIMS 0.1-10 ppb 3 60
Formaldehyde. CARE 430 HPLClUV 2-7 ppb 3 60 Acetaldehyde. Acroiein
HCI. HF CARE Ion 0.02 ppm 3 120 Method 421 Chromatography
Dioxins/Furans/ CARE HRGCIHRMS 0.0003-0.0002 ngldscm per 5 480 PCB's Method 428 homologue class for dioxinlfuran.
0.0002 pgldscm per wgener group for PCB's
PAH CARE HRGCIHRMS-SIM 0.0008-0.04 pgldscm per species 3 360 Method 429
Metals (Sb, As. Ea. Be. CARE ICP-AES, graphite 0.16 - 0.83 3 360 Cd. Cr, Cu, Pb. Mn, Hg, Method 436 furace AA and cold pgldscm per element
Ni, P, Se, Ag. TI, Zn) vapor AA microscopy
Hexavalent Chromium CARE 425 Ion 0.004 pgldscm for Cr6+ 3 360 Total Chromium Chromatography1 0.02 pgldscm for total
GFAAS
Asbestos CARE 427 Microscopy 11000 fiberslsampie or 400 3 120-30 frbersldscf
Flow Rate. Moisture SCAQMD Pilot Traverse1 In wnjuncklon wilh Method 1,2.4 gravimetric All tests
02, C02 SCAQMD 100.1 Electrochemical 2% of scale in conjunction with celi1NDIR Ail tests
Note: EPA Method 202 for wndensible PM,, is similar to SCAQMD 5.2 condensible analysis. It invoives a melhylene chloride exlraclion of the impinger catch and ambient temperature evaporation of lhe melhylene chloride extract and low temperature (105OC) evaporation of the water portion. No corrections are made to the weight gain determined.

3.4.7 0,. - and C07 -
0, and CO, were measured using Delta's Continuous Emissions Monitoring System (CEMS). This system meets SCAQMD, CARB and EPA requirements. Details of the system configuration and calibration procedure are located in Appendix A.3.
3.4.2 Velocitv and Moisture
Velocity and moisture were conducted in conjunction with all isokinetic tests using €PA and SCAQMD Methods 1, 2, and 4. lsokinetic testing at the Kiln stack is conducted using a 24-point traverse as specified in Method 1.
For single point tests at the stack (hydrocarbons, aldehydes) the flow rate measured for other tests conducted during the same time intervals was used to calculate mass emissions.
3.4.3 Total Particulate by SCAQMD Method 5.2, with Condensible Analvsis. SCAQMD Source Testinq Manual, March, 1989
Duplicate particulate tests using SCAQMD Method 5.2 with a filter temperature of 250°F were collected. In this method, metered flue gas is collected isokinetically and particulate matter is collected on a heated filter followed by a series of water filled impingers.
The flue gas were collected isokinetically through a glass nozzle, a glass probe, and a filter in a 250°F temperature-controlled oven. This is followed by a teflon sample line, two Smith-Greenburg impingers which contain 100 ml of distilled water, an empty impinger as a knockout and an impinger containing silica-gel. The impingers collect condensible particulate species while the filter collects any species existing as particulate at 250°F.
Following testing, the impingers were weighed for moisture determination and the following sample fractions are recovered:
1. Probe, nozzle, and front-half glassware -water and brushing
2. Filter
3. Back half filter glassware, sample line, impingers and connecting glassware - water wash
The probe wash, filter, and an aliquot of the impinger catch will be evaporated or dried at 105"C, desiccated, and weighed to constant weight. The impinger contents will be extracted with methylene chloride to determine condensible hydrocarbons that are

considered particulate under SCAQMD requirements. Acid base and sulfate analysis was not performed and no corrections were made to the gravimetric results.
3.4.4 PM,, - by EPA Method 201A/202/5.2
Triplicate PM,, samples were collected using EPA Method 201N202. This method separates particulate matter less than l O p n from the flue gas using a cyclone of an EPA approved design. The sample train is operated isokinetically at a constant flow rate using a correctly sized sampling nozzle. Pretest velocity traverses are performed in order to correctly calculate the sampling rate. The cyclone will be followed by the sample probe, a heated Method 5 type filter, a teflon sample line and a series of impingers containing 100ml of Dl water in the first two impingers followed by one empty impinger and an impinger containing silica gel.
The sample train separates particulate greater than 10pm and less than 10pm. The components that represent these fractions are:
1. nozzle and cyclone wash PM>1 Opm
2. cyclone fittings, probe and front half filter glassware PM4Opm
3. filter, PMclO
4. irnpinger catch, line rinse and back half filter glassware PMc10
Sample recovery consists of:
1. acetone washing and brushing of the nozzle and cyclone
2. acetone washing and brushing of the cyclone fittings, probe and front half of the filter holder
3. a methylene chloride rinse of the filter holder and impingers
4. water and methylene chloride rinses of the sample line
Sample analysis of the acetone rinses and filter consists of evaporating or drying the sample, followed by desiccating and weighing the sample. The sample analysis of the impinger catch consists of extracting the entire impinger contents with the methylene chloride rinses and added methylene chloride then evaporating the water at 105'C and the methylene chloride fractions at ambient temperature for particulate determination. The required sample analysis of the impinger catch varies depending upon the resultant pH of the impinger liquid; pH values lower than 5 require additional analytical procedures. However, the pH of the impinger catches was 5.5 to 7 so no additional procedures were required.

This analysis of the impinger catch for the Cal Portland samples was similar to the SCAQMD Method 5.2 condensible analysis. The impinger catch analysis consisted of gravimetric measurements of the methylene chloride extract and water portions only.
3.4.5 Methane and Total Non-Methane Hvdrocarbons bv SCAQMD Method 25.1 -
Triplicate hydrocarbon samples were collected using SCAQMD Method 25.1. This procedure for methane and total non-methane hydrocarbons is used by SCAQMD to determine hydrocarbon emissions. In this procedure the flue gas is drawn through a trap cooled in dry ice, then into a clean evacuated canister. The samples are collected in pairs, with one sample consisting of two traps and two canisters. The results are averaged for the final test result. The samples are analyzed by GCIFID for total non- methane hydrocarbons and methane using SCAQMD Method 25 procedures.
3.4.6 Trace Hydrocarbons bv TO-14
Trace hvdrocarbon soecies were collected in Summa polished canisters and analyzed by GCIMS. The analytes of interest were:
Freon-12 Methyl chloride
Freon-I 14 Vinyl chloride
Methyl bromide Ethyl chloride
Freon-I I 1 ,I-dichloroethylene
Dichioromethane Freon-? 13
1 .I-dichloromethane
c-I ,2-dichloroethane Chloroform
1.2-dichloroethane 1.1 ,I-trichloroethane
Benzene Carbon tetrachlororide
1 .2-dichloropropane Trichioroethene
t-I ,3-dichioropropene c-I ,3-dichloropropene
1,1.2-trichloroethane Toluene
1.2-dibromoethane Perchloroethene Chlorobenzene Ethylbenzene M+p-xylenes
Styrene 1 ,I ,2,24etrachloroethane
o-xylene
4-ethyl-toluene 1,3,5-trimethylbenzene 1,2,4-trimethylbenzene
m-dichlorobenzene p-dichlorobenzene
Benzylchioride o-dichlorobenzene
1,2,4-trichlorobenzene Hexachlorobutadiene
1,3-butadiene
3.4.7 Formaldehyde, Acetaldehyde. and Acrolein
Triplicate samples for formaldehyde, acetaldehyde, and acrolein were collected by CARB 430.
In this method, the exhaust gas is drawn non-isokinetically through a heated glass probe and teflon line into a series of acidified DNPH filled midget impingers. A low-level dry gas meter fitted with a calibrated orifice that restricts the flow rate to 0.5 llmin was used to measure the total volume of exhaust gas sampled. The line is rinsed with a portion of the first impinger catch. Each vial is analyzed separately for formaldehyde, acetaldehyde, and acrolein by HPLC.

The following QAIQC procedures were also conducted per test condition:
Screening of DNPH reagent; Three field blanks; One field spike; One trip blank; One trip spike; Laboratory blanks; Laboratory matrix spike
3.4.8 PAH bv CARB Method 429
Triplicate samples for polycyclic aromatic hydrocarbons (PAH) were collected using CARB Method 429.
In this procedure the flue gas is withdrawn isokinetically and passed through a heated glass probe and Method 5 type Teflon coated filter to a teflon line and an XAD-2 resin column. The resin column is connected to a series of impingers containing 100 ml each of sodium carbonate/sodium bicarbonate in the first two impingers, followed by an empty impinger and an impinger containing silica gel. The teflon coated filter and Na,CO,/Na,HCO, solution prevents degradation of the PAH species by eliminating potential contact with acidic or basic sampling media.
This method is approved for quantitation of the following PAH species
Naphthalene 2-Methylnaphthalene Acenaphthylene Acenaphthene Fluorene Phenanthrene Anthracene Fluoranthene Pyrene Benzo(a)anthracene Chrysene Benzo(b)fluoranthene Benzo(k)fluoranthene Benzo(e)pyrene Benzo(a)pyrene Perylene Indeno(l,2,3-c,d)pyrene Dibenzo(a.h)anthracene Benzo(g,h,i)perylene
All sampling media are pre-cleaned to eliminate PAH contamination and other organic species. The filters are extracted with methylene chloride and stored in petri

dishes lined with hexane rinsed aluminum foil and the XAD-2 resin is extracted until clean. Pre-test analysis for both the XAD-2 resin lot and filter extract is required. The sampling train components (including the probe, glassware and connecting lines) are pre-cleaned using high purity water, acetone, hexane and methylene chloride.
Field spikes are added to each XAD-2 resin module. A field blank is collected during each sampling program.
PAH Samples are recovered with high purity GClMS grade acetone, hexane, and methylene chloride into amber glass bottles cleaned to EPA specifications for organics. Samples are kept at <4"C until extraction and analysis.
Samples are analyzed by HRGCIHRMS-SIM to obtain low detection limits of 1- 5ng per sample per species. Sample analysis also includes analysis of a method blank, blank matrix spikes and spiking of the samples with deuterated PAH species to evaluate the extraction and analysis procedures.
3.4.9 DioxinslFuranslPCBs by CARB Method 428
Triplicate samples for PCDDIPCDF and PCB were collected and analyzed according to CARB Method 428. In this procedure, a sample is collected isokinetically and passed through a heated Method 5 filter followed by an XAD-2 sorbent module in a water-cooled condenser. The sorbent module is followed by an impinger train to collect moisture. The impinger train consists of an empty impinger, an impinger continuing high purity Dl water, an empty impinger and one containing silica gel.
The components of the sampling train were recovered with high purity GClMS grade methanol, toluene and methylene chloride into amber glass bottles cleaned to EPA specifications. Toluene was used as a suitable substitute to the benzene specified in the procedure. The front half, back half and impinger contents and rinses are collected separately, but combined in the laboratory after concentration and methylene chloride extraction of the water catch.
All sampling media are pre-cleaned to ensure that there is no dioxinlfuran contamination and other organic species. The filters are extracted with toluene and stored in petri dishes lined with hexane rinsed aluminum foil and the XAD-2 resin is extracted until clean. Analysis of both the XAD-2 resin lot and filter extract is required. The sampling train components (including the probe, glassware and connecting lines) are pre-cleaned using high purity water, methanol, toluene, and methylene chloride.
Sample analysis includes high resolution gas chromatographylhigh resolution mass spectrometry analysis for tetra through octa PCDDIPCDF and all 2,3,7,8 substituted isomers of the combined extracted filter, XAD-2 resin and methanolltoluene/methylene chloride train rinse and methylene chloride extract from the water catch. A field blank is also collected and analyzed.

Appropriate field, pre-extraction, pre-clean-up and internal spikes as required by the reference method were introduced to the samples by the laboratory and the percent recoveries are reported along with the results.
Additional reporting for dioxins and furans includes; 1) complete emissions data for each 2,3,7,8 isomer and homologue class, 2) PCDDIPCDF toxic equivalents calculations using California DOHS factors, 3) pre-extraction, field spike, pre-clean-up, internal recoveries, and matrix spike recoveries. This information is located in the laboratory reports in Appendix C and with the GClMS raw data in Appendix G.
PCB analysis is obtained from a portion of the sample extract using a separate laboratory clean-up procedure described in Method 428. The PCB analysis is performed by high resolution gas chromatographyllow resolution mass spectrometry (HRGCILRMS) and detects the mono through deca PCB cogener classes. Appropriate field, pre- extraction, pre-clean-up and internal spikes as required by the method were introduced to the samples by the laboratory for the PCB analysis.
3.4.10 Trace Metals bv CARB Method 436 (Multi-metals)
Triplicate samples were collected for metals using the procedure in CARB Method 436. These samples were analyzed for antimony, arsenic, barium, beryllium, cadmium, chromium, copper, lead, manganese, mercury, nickel, phosphorus, selenium, silver, thallium, and zinc.
This procedure isokinetically withdraws flue gas through the sample train described below:
1. The probe and nozzle are glass to prevent metal contamination of the sample.
2. The filter is ultrapure fiberglass to minimize interferences. 3. The first two impingers contain 5% nitric acid and 10% hydrogen peroxide
to collect any volatile metals which pass through the filter. 4. The third impinger is empty to prevent carry over of the HN0,1H202
solution into the permanganate solution. 5. The fourth and fifth impingers contain acidified potassium permanganate
solution to collect any mercury that is not collected in the HN0,1H202 impingers.
6. The sixth impinger contains silica gel.
Sampling reagents and media are all trace metals quality with lot analyses of specific heavy metals available. The sampling train is pre-cleaned with Dl water, nitric acid, and hydrochloric acid before testing and sealed with parafilm.
A field blank at each condition and reagent blank was collected and analyzed for this sampling program.
Sample recovery consists of recovering the following sample fractions:
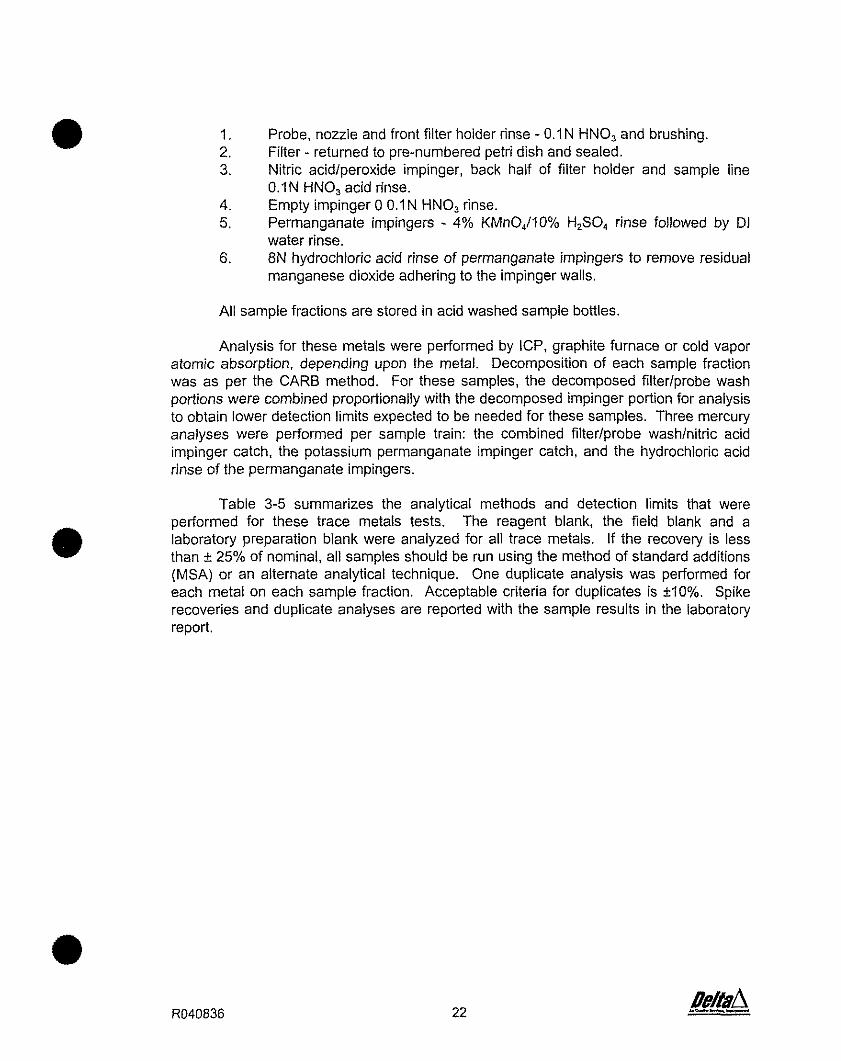
1. Probe, nozzle and front filter holder rinse - 0.1N HNO, and brushing. 2. Filter - returned to pre-numbered petri dish and sealed. 3. Nitric acidlperoxide impinger, back half of filter holder and sample line
O.IN HNO, acid rinse. 4. Empty impinger 0 0.1 N HNO, rinse. 5. Permanganate impingers - 4% KMn04/10% H,S04 rinse followed by Dl
water rinse. 6. 8N hydrochloric acid rinse of permanganate impingers to remove residual
manganese dioxide adhering to the impinger walls.
All sample fractions are stored in acid washed sample bottles.
Analysis for these metals were performed by ICP, graphite furnace or cold vapor atomic absorption, depending upon the metal. Decomposition of each sample fraction was as per the CARB method. For these samples, the decomposed filterlprobe wash portions were combined proportionally with the decomposed impinger portion for analysis to obtain lower detection limits expected to be needed for these samples. Three mercury analyses were performed per sample train: the combined filterlprobe washlnitric acid impinger catch, the potassium permanganate impinger catch, and the hydrochloric acid rinse of the permanganate impingers.
Table 3-5 summarizes the analytical methods and detection limits that were performed for these trace metals tests. The reagent blank, the field blank and a laboratory preparation blank were analyzed for all trace metals. If the recovery is less than t 25% of nominal, all samples should be run using the method of standard additions (MSA) or an alternate analytical technique. One duplicate analysis was performed for each metal on each sample fraction. Acceptable criteria for duplicates is *lo%. Spike recoveries and duplicate analyses are reported with the sample results in the laboratory report.

TABLE 3-5 TRACE METALS ANALYSIS FROM MULTIMETALS TRAIN
CALIFORNIA PORTLAND CEMENT COMPANY JUNE -JULY 1999
Metal Analvtical Method Measurement Principle Detection Limit
Antimony
Arsenic
Barium
Beryllium
Cadmium
Chromium
Copper
Lead
Manganese
Mercury
Nickel
Phosphorus
Selenium
Silver
Thallium
Zinc
EPA SW846 6010
EPA SW846 7060
EPA SW846 601 0
EPA SW846 6010
EPA SW846 6010
EPAS W846 601 0
EPA SW846 6010
EPA SW846 7421
EPA SW846 6010
EPA SW846 747017471
EPA SW846 6010
EPA SW846 6010
EPA SW846 7740
EPA SW846 6010
EPA SW846 7841
EPA SW846 601 0
ICP
Graphite furnace AA wIMSA
ICP
ICP
ICP
ICP
ICP
Graphite furnace AA wlMSA
ICP
Cold Vapor A.A.
ICP
ICP
Graphite furnace AA w l MSA
ICP
Graphite Furnace AA wlMSA
ICP

3.4.1 1 Total and Hexavalent Chromium
Triplicate samples and a field blank were collected for total and hexavalent chromium by CARB Method 425.
In this method, flue gas is extracted isokinetically through a heated glass probe and teflon line into a series of impingers consisting of two impingers containing 0.1 N NaOH, a teflon coated back-up filter, an empty impinger, and an impinger containing silica gel.
After sampling, the following recovery procedures are followed:
Recover probe with at least 100 mi 0.1 N NaOH. Check that pH is greater than 8.0;
0 Recover first impinger and teflon line. The method does not require impinger rinses to minimize dilution. Where needed, rinse with 0.1 N NaOH. Check that pH is greater than 8.0;
0 Add the filter to the first irnpinger rinse; Recover second impinger. Check that pH is greater than 8.0.
Three sample fractions are analyzed for hexavalent chromium per train:
Probe rinse; First impinger liquid and filter; Second impinger liquid.
The samples and a reagent blank are analyzed by ion chromatography for hexavalent chromium. Only results above the detection limit are used in the final calculation if the sample train is recovered in three fractions.
Total chromium analysis is determined from digested aliquots of the recovered sample fractions. At this point, the impinger contents and probe wash are combined for analysis. Analysis is performed by GFAAS.
3.4.12 HCI and HF bv CARB Method 421
Triplicate samples for hydrochloric and hydrofluoric acid analysis were collected by CARB Method 421. CARB Method 421 determines gaseous chloride and fluoride emissions by collecting the flue gas sample isokinetically through a heated probe and Method 5 filter followed by a teflon sample line and a series of impingers containing 10Oml of sodium carbonate/sodium bicarbonate solution in each of the first two impingers, an empty and a silica gel containing impinger. The teflon connecting line and impinger catches are recovered with sodium carbonate/sodium bicarbonate solution for analysis. The chloride and fluoride content is determined by ion chromatography.

3.4.13 Asbestos bv CARB Method 427
Triplicate samples for asbestos were collected by CAR0 Method 427. CARB Method 427 determines asbestos emissions by collecting the flue gas isokinetically through a heated probe and polycarbonate filter followed by a series of impingers to determine the moisture content of the flue gas.
The method recommends taking varying sample sizes to avoid overloading the filter. The probe wash, nozzle, and filter holder are recovered with acetone for analysis. The filter is replaced in its pre-numbered petri-dish.
Analysis consists of transmission electron microscopy of the two sample fractions.

4.0 RESULTS
This section presents detailed test results of the emissions tests performed at California Portland Cement Company on June 14-19, 1999 and June 30 - July 7, 1999. The results are organized by type of test in the following sections:
Total Particulate; PM,o; Methane and Non-Methane Hydrocarbons; Trace Hydrocarbons; Aldehydes; PAH; DioxinlFuran; PCB; Metals; Total and Hexavalent Chromium; Hydrochloric and Hydrofluoric Acid; Asbestos.
Additional information on the sampling and analysis is contained in the Appendices. Appendix A contains Delta's CARE and SCAQMD certifications; quality assurance information, a description of Delta's CEM System and calibration data. Appendix E contains process operating conditions during testing. Data summaries, CEM performance data, field data sheets and laboratory data are contained in Appendix C. Appendix D presents emissions calculations. Appendix E contains chain of custody information, and instrument strip charts are located in Appendix F. Appendix G contains laboratory raw instrument data.
4.1 TOTAL PARTICULATE
Tables 4-1 and 4-2 contain the particulate test results from the two test conditions. Particulate emissions averaged 7.35 lblhr with coal firing and 8.01 lblhr with coal and tires fired.

TABLE 4-1 TOTAL PARTICULATE EMISSIONS
CALIFORNIA PORTLAND CEMENT COMPANY BASELINE TESTING
KILN 1 JUNE 1999
Test No 1 -PM 2-PM 3-PM Average
Date: Time: Flow Rate, dscfm: Sample Volume, dscf: o,, %: co,, %: H,O. %: lsokinetic Ratio, %:
Total Particulate grldscf grldscf @ 12% CO, Ib/hr
Front-Half Particulate grldscf lblhr
Back-Half Particulate grldscf Ib/hr
Particulate Catch Heated Filter, mg Probe Wash, mg lmpinger Catch, mg Organic Extraction, mg
TOTAL, mg
Note: Field Blank 1.0 mg

TABLE 4-2 TOTAL PARTICULATE EMISSIONS
CALIFORNIA PORTLAND CEMENT COMPANY COAL WITH TIRES
KILN 1 JULY 1999
Test No
Date: Time: Flow Rate, dscfm: Sample Volume, dscf: 0,. %: CO,, %: H,O, %: lsokinetic Ratio, %:
6-PM Average
Total Particulate grldscf grldscf @ 12% CO, lblhr
Front-Half Particulate gr/dscf Iblhr
Back-Half Particulate grldscf lblhr
Particulate Catch Heated Filter, mg Probe Wash, mg lmpinger Catch, mg Organic Extraction, mg
TOTAL, mg
Note: Field Blank 0.9 mg

4.2 PM,,
PM,, results are presented in Tables 4-3 and 4-4. PM,, emissions averaged 3.68 lblhr during the baseline testing and 5.82 lblhr during the coal and tires condition.
PM,, averaged 62% of the total particulate collected during the PM,, test during the baseline condition and 72% of the total particulate during testing with tires.

TABLE 4-3 PM,, RESULTS
CALIFORNIA PORTLAND CEMENT COMPANY BASELINE TESTING
KILN 1 JUNE 1999
-- -
Test No I-PMln 2-PM,, 3-PM,, Average
Date: Time: Flow Rate, dscfrn: Sample Volume, dscf: o,, %: co,, %: H,O, %: lsokinetic Ratio, %: D50, IJm
PM Emissions -10 - grldscf Iblhr
Particulate Catch PM > IOprn, rng
PM < IOprn, rng Filter, rng Cyclone, rng Irnpinger Liquid, rng MeCI, extract, rng
Total PM c IOprn, rng
Ratio PM,, to Total PM. %
Note: Fieid blank PMjo = 1.6 mg

TABLE 4-4 PM,, RESULTS
CALIFORNIA PORTLAND CEMENT COMPANY COAL WITH TIRES
KILN I JULY 1999
Test No 4-PM,, 5-PM,, 6-PM,, Average
Date: Time: Flow Rate, dscfm: Sample Volume, dscf: o,, %: CO,, %: H,O, %: lsokinetic Ratio, %: b o x prn
PM Emissions -10 - grldscf Ib/hr
Particulate Catch PM > 1 Opm, mg
PM < IOprn, mg Filter, mg Cyclone, mg lmpinger Liquid, mg MeCI, extract, rng
Total PM < I Oprn, mg
Ratio PM,, to Total PM, %
Note: Field Blank PMlo = 0.8 rng

4.3 METHANE AND NON-METHANE HYDROCARBONS
Methane and non-methane hydrocarbons were determined using paired tanks and traps by SCAQMD Method 25.1. Tables 4-5 and 4-6 present the results for the average of each pair. Non-rnethane hydrocarbons averaged 57.5 pprn or 18.16 lblhr during the baseline testing and 46.9 ppm or 14.81 lblhr during the testing with tires.

TABLE 4-5 METHANE AND NON-METHANE HYDROCARBONS EMISSIONS
CALIFORNIA PORTLAND CEMENT COMPANY BASELINE TESTING
KlLN 1 JUNE 1999
Test No 1-HC 2-HC 3-HC Average
Date: Time:
Methane PPm
TGNMO Hydrocarbons (as methane) PPmv 50.8 76.9 44.8 57.5 lblhr 16.05 24.29 14.15 18.16
Notes: Each test run is the average of a pair of tanks and traps. Flow Rate = 124547 dscfm (flow rate from 4-Metals, Cr. PAH. Dioxin)
TABLE 4-6 METHANE AND NON-METHANE HYDROCARBONS EMISSIONS
CALIFORNIA PORTLAND CEMENT COMPANY COAL WITH TIRES
KlLN 1 JULY 1999
Test No 7A,B-HC 7C,D-HC 7E,F-HC Average
Date: Time:
Methane PPm
TGNMO Hydrocarbons (as methane) PPmv 46.9 50.3 43.6 46.9 lblhr 14.80 15.87 13.76 14.81
Notes: Each test run is the average of a pair of tanks and traps. Flow Rate = 124417 dscfm (flow rate from 7-Metals, Cr, PAH, 8 Dioxin)

4.4 TRACE HYDROCARBONS
Tables 4-7 and 4-8 present the results of the trace hydrocarbon tests. Trace hydrocarbons were determined by GCIMS from Summa canisters. These tables present the results from all species in the GClMS scan.

TABLE 4-7 TRACE HYDROCARBON RESULTS
CALIFORNIA PORTLAND CEMENT COMPANY COAL FIRING
KILN I JUNE 1999
Test No. 1 2 3 Average
Date: Time: Flow Rate:
Compound Freon-12 Methyl Chloride Freon-I I 4 Vinyl Chloride Methyl Bromide Ethyl Chloride Freon-I I 1 ,I- Dichloroethylene Dichloromethane Freon 113 I ,I-dichloroethane c-1,2 dichloroethene Chloroform 1.2-dichloroethane 1 , I ,I-trichloroethane Benzene Carbon Tetrachloride I ,2-dichloropropane Trichloroethene t-1.3-dichloropropene c-I .3-dichloropropene 1 .I ,2-trichloroethane Toluene 1,2-dibromoethane Perchloroethene Chlorobenzene Ethylbenzene M+p-xylenes Styrene 1 , I ,2,2-tetrachloroelhane o-xylene 4-ethyl-toluene 1,3,54rimethylbenzene 1,2,4-trimethylbenzene m-dichlorobenzene p-dichlorobenzene Benzylchloride o-dichlorobenzene 1,2,3-trichlorobenzene Hexachlorobutadiene 1,3-butadiene
0611 8/99 06/18/99 0800-0850 0852-0938
123.697 dscfm

TABLE 4-8 TRACE HYDROCARBON RESULTS
CALIFORNIA PORTLAND CEMENT COMPANY COAL FIRING WITH TIRES
KILN 1 JULY 1999
Test No
Date: Time: Flow Rate:
Methyl Chloride Freon-I I 4 Vinyl Chloride Methyl Bromide Ethyl Chloride Freon-I 1 I ,I-dichloroethylene Dichloromethane Freon-I 13 I ,I-dichloroethane c-I ,2-dichloroethene Chloroform 1,2-dichloroethane 1 ,I ,I-trichloroethane Benzene Carbon tetrachloride 1.2-dichloropropane Trichloroethene t-I .bdichloropropene c-I .3-dichloropropene 1 ,I .24richloroethane Toluene 1,2-dibromoethane Perchloroethene Chlorobenzene Ethylbenzene M+p-xylenes Styrene 1,1,2.2-tetrachloroethane o-xylene 4-ethyl-toluene 1,3,Btrimethylbenzene 1,2,44rimethylbenzene m-dichlorobenzene p-dichlorobenzene Benzytchloride o-dichlorobenzene 1,2,4-trichlorobenzene Hexachlorobutadiene 1,3-butadiene
07/01/99 07/01/99 1122-1212 1213-1306
126,162 dscfm
PEL? ND < 0.2 ND < 0.2 ND < 0.2
1.10 0.30
ND < 0.2 ND < 0.2 ND < 0.2
1.06 ND < 0.2 ND < 0.2 ND < 0.2 ND c 0.2 ND < 0.2
0.46 63.8
ND c 0.2 ND < 0.2
1.04 ND < 0.2 ND < 0.2 ND c 0.2
41 .O ND < 0.2
0.81 1.27 6.48 24.2 0.55
ND < 0.2 5.53 2.07 1.79 6.40 0.22 5.78
ND < 0.5 ND < 0.2 ND c 0.2 ND c 0.2
2.94

4.5 ALDEHYDES
Formaldehyde, acetaldehyde, and acrolein results are presented in Tables 4-9 and 4-10. Acrolein is difficult to quantitate using this method. Acrolein does not react with DNPH as efficiently as formaldehyde or acetaldehyde and forms a less stable derivative with the DNPH. Field spike recoveries were 17% and 15% for the baseline and tire firing conditions. As exhibited by low spike recoveries, the results may be biased low. Acrolein levels in the samples were all less than 1 pg per sample.
Average formaldehyde emissions were 1,486 ppb or 0.88 lblhr at the baseline condition and 187 ppb or 0.1 1 Iblhr while firing tires. Acetaldehyde emissions were 386 ppb or 0.34 lb/hr at the baseline condition and 54 ppb or 0.05 lblhr while firing tires.

TABLE 4-9 FORMALDEHYDE, ACETALDEHYDE AND ACROLEIN RESULTS
CALIFORNIA PORTLAND CEMENT COMPANY BASELINE TESTING
KILN I JUNE 1999
Test No 1 -Form 2-Form 3-Form Average
Date: 0611 7/99 0611 7/99 0611 7/99 Time: 0940-1040 11 15-121 5 1345-1445 Flow Rate, dscfm: 124,547 124,547 124,547 Sample Volume, dscf: 0.830 0.842 0.810
Formaldehyde Emissions P P ~ lblhr
Acetaldehyde Emissions P P ~ lblhr
Acrolein Emissions
Averaqe Field Blank Formaldehyde, ppb Acetaldehyde, ppb Acrolein, ppb
Field Spike Recovery Formaldehyde Acetaldehyde Acrolein
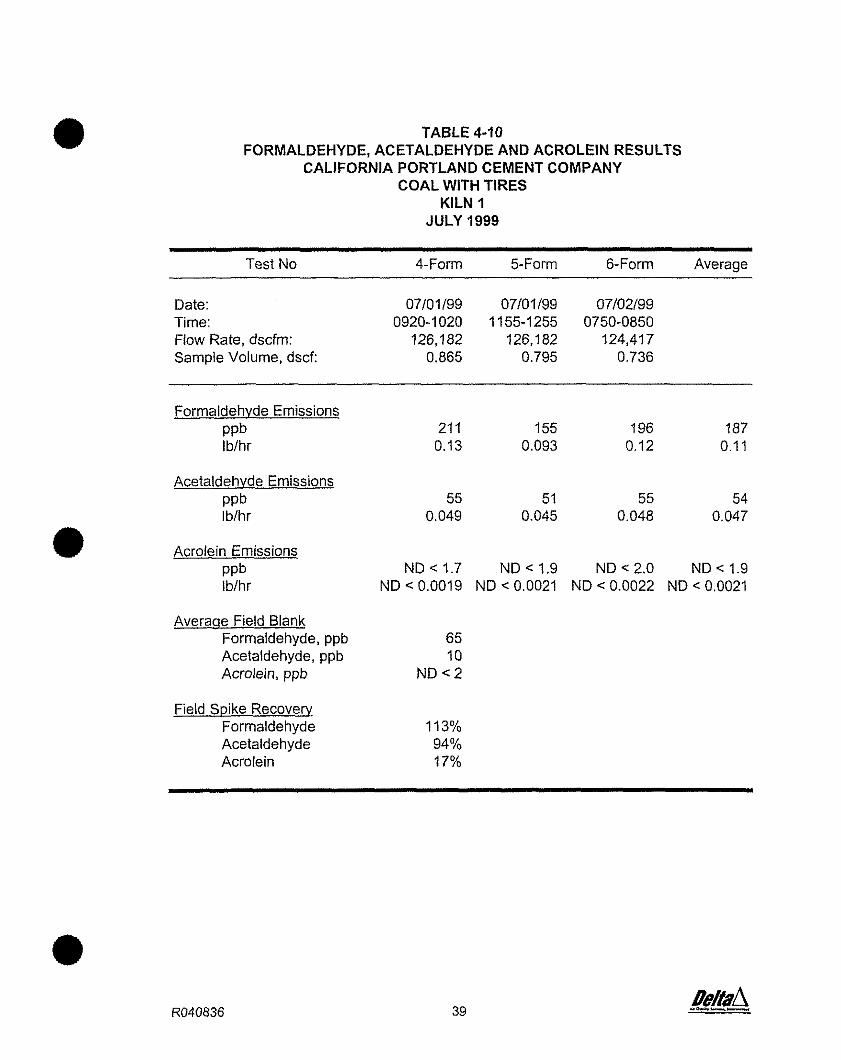
TABLE 4-10 FORMALDEHYDE, ACETALDEHYDE AND ACROLEIN RESULTS
CALIFORNIA PORTLAND CEMENT COMPANY COAL WITH TIRES
KILN 1 JULY 1999
Test No 4-Form 5-Form 6-Form Average
Date: 07/01 199 07/01 199 07/02/99 Time: 0920-1 020 11 55-1255 0750-0850 Flow Rate, dscfm: 126,182 126,182 124,417 Sample Volume, dscf: 0.865 0.795 0.736
Formaldehvde Emissions P P ~ lblhr
Acetaldehvde Emissions P P ~ lblhr
Acrolein Emissions P P ~ Iblhr
Averaqe Field Blank Formaldehyde, ppb Acetaldehyde, ppb Acrolein, ppb
Field Spike Recovery Formaldehyde Acetaldehyde Acrolein

4.6 PAH
PAH results are presented in Tables 4-1 1 and 4-12. Spike recoveries for these samples were generally 50 - 150% as required except for fluorene and phenanthrene surrogate spikes on the baseline samples and naphthalene surrogate spikes on the coal with tires condition. These recoveries were 30 - 40%. The analyses were considered acceptable because the results from these samples were similar to other samples.

TABLE 4-1 1 PAH EMISSIONS RESULTS
CALIFORNIA PORTLAND CEMENT COMPANY BASELINE TESTING
KILN 1 JUNE 1999
Test No. 1-PAH 3-PAH 4-PAH Average
Date: 06/14/99 06/16/99 06/17/99 Time: 0855-1 710 0810-1540 0800-1530 Flow Rate, dscfm: 121.965 123.461 124,335 Sample Volume, dscf: 220.47 218.23 237.00 02, %: 14.04 13.90 14.07 C07, %: 11 .23 11.09 11.22 ~ 2 6 . %: lsokinetic Ratio, %:
Compound Naphthalene 2-Methylnaphthalene Acenaphthylene Acenaphthene Fluorene Phenanthrene Anthracene Fluoranthene Pyrene Benz(a)anthracene Chrysene Benzo(b)fluoranthene Benzo(k)fluoranthene Benzo(e)pyrene Benzo(a)pyrene Perylene Indeno(l.2,3-cd)pyrene Dibenzo(a,h)anthracene Benzo(g,h,i)perylene

TABLE 4-1 2 PAH EMISSIONS RESULTS
CALIFORNIA PORTLAND CEMENT COMPANY COAL WITH TIRES
KILN I JUNE - JULY 1999
Test No. 5-PAH 6-PAH 7-PAH Average
Date: 06130/99 07/07/99 07/02/99 Time: 0755-1520 0730-1450 0700-1435 Flow Rate, dscfm: 125,824 126.261 126,977 Sample Volume, dscf: 232.92 235.54 237.05 02, %: 14.39 14.17 14.31 C02. %: 10.33 10.43 10.50 H20. %: 3.3 3.6 3.7 lsokinetic Ratio, %: 97.9 98.1 98.8
Compound Naphthalene 2-Methylnaphthalene Acenaphthylene Acenaphthene Fluorene Phenanthrene Anthracene Fluoranthene Pyrene Benz(a)anthracene Chrysene Benzo(b)fluoranthene Benzo(k)fluoranthene Benzo(e)pyrene Benzo(a)pyrene Perylene Indeno(l.2,3-cd)pyrene Dibenzo(a,h)anthracene Benzo(g.h,i)perylene
0.150 NDc 0.0049
0.0167 3.94
0.0118
NDc 0.0056 ND< 0.0045 NDc 0.0008
0.0009 NDc 0.0008 NDc 0.0008 NDc 0.0008 NDc 0.0008
0.001 1
NO< 0.0055 NDC 0.0045 NDc 0.0007 NDC 0.0007 NDc 0.0007 NDc 0.0007 NDc 0.0007 NDc 0.0007 NDc 0.0007
0.103 NDc 0.0048 NDc 0.0060
lblhr 3.35 x m-2 4.83 X 10⁻⁵ 4.55 x 10⁻⁵
ND c 2.27 x 10⁻⁶ < 4.58 x 10⁻⁶

Five dioxinlfuran tests were conducted per test condition. The five tests consisted of triplicate test runs and two simultaneous test runs. The simultaneous run results show good agreement for both conditions. Results are presented as the average of all runs. The overall average emissions were calculated using the results from each triplicate run and the average of the simultaneous runs (4 values to make up the average).
The results of the method required spike recoveries were acceptable. These spike recoveries and other laboratory quality control data are located in Appendices C.18, C.19, C.20, and C.21. Appendix C.18 also contains the results of filter proof analyses.
Test I-Dioxin was run sub-isokinetically for the last quarter of the test because of difficulties with the resin packing. The results of this test were kept in the average because the testing problems existed during only part of the test and the subisokinetic conditions would bias the results high rather than low. The results from this test are also similar to the other four dioxin test runs. There were no other testing problems.
The tables contain detailed results of each dioxinlfuran test and calculated 2,3.7,8 TCDD toxic equivalents calculated using U.S. EPA factors (also referred to as international factors). The results for the coal firing condition are contained in Tables 4- 13 and 4-14. The results for testing with tires are contained in Tables 4-15 and 4-16.
For the coal firing condition, the average total PCDDIPCDF emissions were 3.39 ngldscm or 1.58 x 10" Iblhr. Calculated 2,3,7,8 TCDD toxic equivalents were 1.05 x 10" Iblhr.
For the coal and tire firing condition, the average total PCDDIPCDF emissions were 4.11 ngldscm or 1.93 x 10a Ib/hr. Calculated 2,3,7,8 TCDD toxic equivalents were 1.68 x 10" Iblhr.
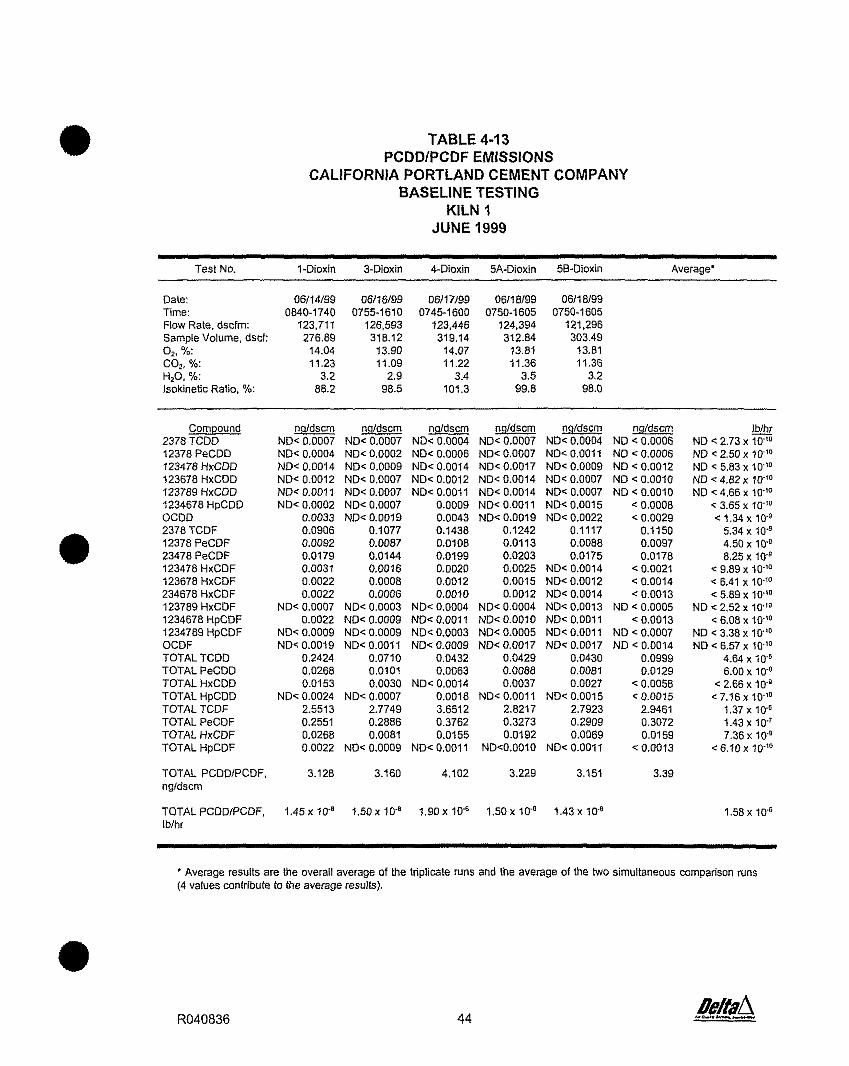
TABLE 4-1 3 PCDDIPCDF EMISSIONS
CALIFORNIA PORTLAND CEMENT COMPANY BASELINE TESTING
KILN 1 JUNE 1999
Tesl No. 1-Dioxin >Dioxin 4-Dioxin 5A-Dioxin 50-Dioxin Average'
Date: 06/14/99 06/76/99 Time: 0840-1740 07554610 Flow Rate. dscfm: 123,711 126.593 Sample Volume, dscf: 276.89 318.12 0.. O/.: 14.04 13.90 -.. - C02, %: 11.23 11 .09 H,O, %: 3.2 2.9 Isokinetic Ratio, %: 88.2 98.5
Compound 2378 TCDD 12378 PeCDD
1234678 HpCDD OCDD 2378 TCDF 12378 PeCDF 23478 PeCDF 123478 HxCDF 123678 HxCDF 234678 HxCDF 123789 dxCDF 1234678 HpCDF 1234789 HpCDF OCDF TOTAL TCDD TOTAL PeCDD TOTAL HxCDD TOTAL HpCDD TOTAL TCDF TOTAL PeCDF
TOTAL PCDD/PCDF. 3.128 3.160 4.102 3.229 3.151 3.39 ngldscm
TOTAL PCDD/PCDF, 1.45 x 10.' 1.50 x 10-a 1.90 x 10" 1.50 x 10.' 1.43 x 10.' 1 . 5 8 ~ ICY6 iblhr
' Average results are the overall average of lhe triplicate runs and the average of Ule two simultaneous comparison runs (4 values contribute to the average resulls).

TABLE 4-14 PCDDIPCDF TOXIC EQUIVALENTS USING EPA FACTORS
CALIFORNIA PORTLAND CEMENT COMPANY BASELINE TESTING
KILN 1 JUNE 1999
Average Test No 1-Dioxin 3-Dioxin 4-Dioxin 5A-Dioxin 50-Dioxin ~ o i i c
Equiv.
Compound
2378 TCDD OTHER TCDD 72378 PCDD OTHER PCDD 123478 HXCDD 123678 HXCDD 123789 HXCDD OTHERHXCDD 1234678 HPCDD OTHERHPCDD OCDD 2378 TCDF OTHER TCDF 12378 PCDF 23478 PCDF OTHER PCDF 123478 HXCOF 123678 HXCDF 234678 HXCDF 123789 HXCDF OTHERHXCDF 1234678 HPCDF 1234789 HPCDF OTHERHPCDF OCDF
Totai PCDD Toxic. Equiv Totai PCDF Toxic Equiv.
Totai Toxic Equiv. (2.3.7.8 TCDD Equiv.)
EP A - Toxic - && Faders %
lblhr - lblhr - && Toxic
Eg& & lblhr - lblhr -
&& &Lr&
ibhr -
Average results are the overall average of the triplicate runs and the average of the two sirnullaneous comparison runs (4 values contribute to the average results).
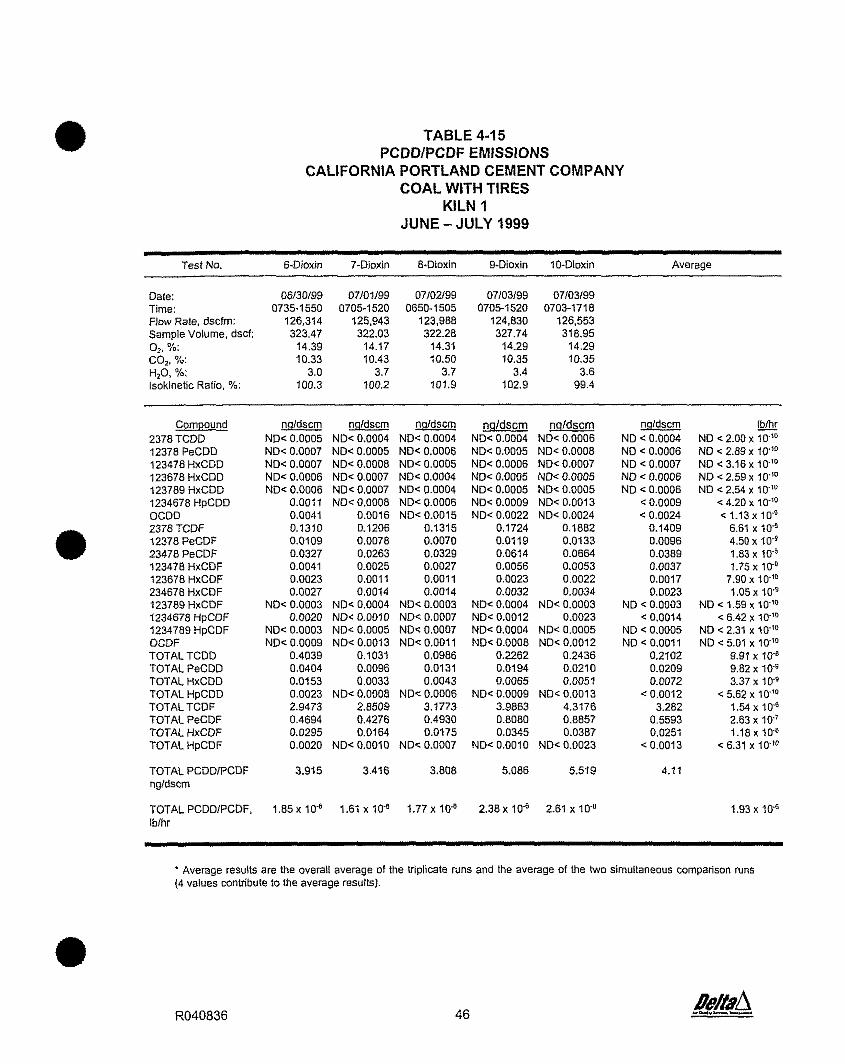
TABLE 4-15 PCDDIPCDF EMISSIONS
CALIFORNIA PORTLAND CEMENT COMPANY COAL WITH TIRES
KILN 1 JUNE - JULY 1999
Test No. 6-Dioxin 7-Dioxin 8.Dioxin 9-Dioxin 10-Dioxin Average
Date: 06130199 07/01/99 07102199 07/03/99 07/03/99 Time: 07351550 0705-1520 0650-1505 0705-1520 0703-1718 Flaw Rate. dschn: 126.314 125.943 123.988 124.830 126.553 . .- ~. Sample Volume, dscf: 323.47 322.03 322.28 327.74 318.95 0,. %: 14.39 14.17 14.31 14.29 14.29 CO.. %: 10.33 10.43 10.50 10.35 10.35 -.'. H,O, %: 3.0 3.7 3.7 3.4 3.6 isokinetic Ratio, %: 100.3 100.2 101.9 102.9 99.4
Compound 2378 TCDD
ND< 0.0007 NDc 0.0008 ND< 0.0005 NDc 0.0006 NDC 0 0007 NDC 0.001)4 NDC 0.0006 NDc 0 0007 hD< 0.0004 123789 HxCDD
1234678 HpCDD OCDD 2378 TCDF 12378 PeCDF 23478 PeCDF
0.0109 0.0078 0.0070 0.0327 0.0263 0.0329 0.0041 0.0025 0.0027 0.0023 0.0011 0.0011 0.0027 0.0014 0.0014
NDC 0.0003 NDC 0.0004 NDc 0.0003 123789 HxCDF 1234678 HpCDF 1234789 HpCDF OCDF TOTAL TCDD TOTAL PeCDD TOTAL HxCDD TOTAL HpCDD TOTAL TCDF TOTAL PeCDF TOTAL HxCDF TOTALHpCDF
TOTAL PCDDlPCDF ngldscm
TOTAL PCDDIPCDF, 1.85 x 10.' 1.61 x 10.' 1.77 x 10" 2.38 x 10.' 2.61 x 10" lblhr
Average results are the overall average of the tripiicate runs and the average of the two simultaneous comparison runs (4 values contribute to the average results).

TABLE 4-16 PCDDIPCDF TOXIC EQUIVALENTS USING EPA FACTORS
CALIFORNIA PORTLAND CEMENT COMPANY COAL WITH TIRES
KILN 1 JUNE -JULY 1999
Average Test No. 6-Dioxin 7-Dioxin 8-Dioxin 9-Dioxin 10-Dioxin Toxic
Compound
2378 TCDD OTHER TCDD 12378 PCDD
OTHERHPCDD OCDD 2378 TCDF OTHER TCDF 12378 PCDF 23478 PCDF OTHER PCDF 123478 HXCDF 123678 HXCDF
1234678 HPCDF 1234789 HPCDF OTHER HPCDF OCDF
Total PCDD Toxic. Equiv Total PCDF Toxic Equiv.
Totai Toxic Equiv. (2,3.7,8 TCDD Equiv.)
EPA - TOXiC Toxic - Toxic && Factors - EJl& EJl& ErJL& EJl& EJl& p&
lblhr - Ibthr - Ibihr - Ibthr - - Iblhr
Average results are lhe overall average of the triplicate runs and the average of the two simultaneous comparison runs (4 values cantribute to the average resulk).

4.8 PCB's
Monochloro through decachloro PCB emissions were determined from analysis of the dioxin trains. Triplicate runs and a simultaneous comparison test were performed at each condition. Tables 4-17 and 4-18 present the results of the tests.
Quality assurance data from the laboratory indicated acceptable spike recoveries (50-150%) except that the rnonochlorinated cogener on Test 1 spike recovery was 47%. Since the result was similar to other tests, Test 1 was included in the average.

TABLE 4-17 PCB EMISSIONS
CALIFORNIA PORTLAND CEMENT COMPANY BASELINE TESTING
KILN 1 JUNE 1999
Test No. 1-PCB 3-PCB 4-PCB 5A-PCB 58-PCB Averase
Date: 06/14/99 06/16/99 06/17/99 06/18/99 06/18/99 Time: 0840-1740 0755-1610 0745-1600 0750-1605 0750-1605 Flow Rate, dscfm: 123,711 126,593 123,446 124,394 121.296 Sample Volume, dscf: 276.89 318.12 319.14 31224 303.49 0,. %: 14.04 13.90 14.07 13.81 13.81 - <.
GO,, %: 11 .23 11 .09 11.22 11.36 11.36 H20. %: 3.2 2.9 3.4 3.5 3.2 lsokinetic Ratio, %: 88.2 98.5 101.3 99.8 98.0
Coqener Group
Monochlorobiohenvl
Tetrachiorobiohenvl ~enlacnlorob~phenyl Hexacnlorobrphenyi Heplach.orob phenyl Oclachlorooiphenyi Nonachiorooiphenyl Decachlorobiphenyl
Average results are the overall average of the triplicate Nns and the average of the two simultaneous comparison Nns (4 values contribute to the average results).

TABLE 4-18 PCB EMISSIONS
CALIFORNIA PORTLAND CEMENT COMPANY COAL WITH TIRES
KILN f JUNE - JULY 1999
Test NO. &PCB 7-PCB 8-PCB 9-PCB 10-PCB Average
Date: 06/30199 07/01/99 07102199 07/03/99 0703199 Time: 0735-1550 0705-1520 0650-1505 07051520 0703-1718 Flow Rate, dscfm: 126.314 125.943 123,988 124,830 126.553 Samole Volume. 323.47 322.03 322.28 327.74 318.95
0,. %: co,, %: H.0 %: < - . ~
lsokinetic Ratio, %: 100.3 100.2 101.9 102.9 99.4
Coqener Group I l q l d s c m I l q l d s c m - - Clqldscm Ilqldscm - lblhr
Monochlorobiphenyl 0.0437 0.0384 0.0426 0.0506 0.0531 0.044 2.07 x 10" Dichlorobiphenyi 0.0731 0.0669 0.0884 0.1067 0.1085 0.084 3.95 x 10.' Trichiorobiohenvi 0.0317 0.0318 0.0349 0.0323 0.0321 0.033 1 .54~10" . . Tetrachlorobiphenyl 0.0742 0.0789 0.0884 0.0722 0.0709 0.078 3.88 x 10.' Pentachlorobiphenyl 0.1310 0.1535 0.1747 0.1616 0.1661 0.157 7.32 x $0.' Hexachlorob~phenyl 0.0884 0.1316 0.1419 0.1616 0.1771 0.133 6.24 x 1D5 Heptachlorobiphenyl 0.0458 0.0724 0.0819 0.1185 0.1328 0.081 3.83 x IC5 Octachlorobiphenyl 0.0032 0.0060 0.0053 0.0089 0.0093 0.0059 2.78 x 10.' Nonachlorobi~henvl NDc 0.0002 0.0002 NDc 0.0002 NDC 0.0002 ND< 0.0002 c 0.0002 c 1 .05~ 10.'
Average results are the overall average of the triplicate runs and the average of the two simultaneous wmparison runs (4 values contribute to the average results).

4.9 METALS
Trace metals results are presented in Tables 4-19 and 4-20. Quality assurance criteria for duplicate and spike analysis were all acceptable except for the following minor deviations:
For the baseline test series, the antimony duplicate analysis had a 28% relative percent difference (RPD) and the spike recovery was 74% (75% is acceptable). One mercury fraction duplicate analysis had a RDP of 24%.
For the test series with tires, the antimony spike recovery was 69% and the silver duplicate analysis was 18%.
Those analytes that exhibited extremely low initial spike recoveries, arsenic, lead, selenium, and thallium, were performed by the method of standard additions.
The antimony spike recoveries were near the acceptance criteria and the results indicated low levels of antimony for all samples.
The duplicate analyses that did not meet the RPD criteria of 10% were not repeated because the analyses were performed on samples with low levels of the analyte (less than lpg).
Reagent and field blank levels were similar to the sample levels for antimony analyses. Samples, field blanks, and reagent blank levels were low at approximately three times the detection limit.
Phosphorus field blank levels were similar to the sample levels. Phosphorus was also contained in the reagent blank and laboratory preparation blank but at levels below the samples. The reagent blank level was the majority contributor tothe field blank level. (63% for the field blank performed at the baseline condition and 52% for the field blank performed at the coal with tires condition).

TABLE 4-19 TRACE METALS EMISSIONS
CALIFORNIA PORTLAND CEMENT COMPANY BASELINE TESTING
KILN 1 JUNE 1999
Test No. I-Metals 3-Metals 4-Metals Average
Date: Time: Flow Rate, dscfm: Sample Volume, dscf: 02, %: C02. %: H20, %: lsokinetic Ratio. %:
Element Irq/dscm Uq/dscm Irq/dscm - Iblhr
Antimony < 0.48 c 0.51 < 0.49 c 0.49 < 2.32 x 10⁻⁴ Arsenic ND< 2.02 ND c 0.43 0.08 < 0.84 c 4.05 x 10⁻⁴ Barium 1.74 2.80 3.10 2.55 1.20 x 10⁻³ Beryllium ND c 0.02 ND c 0.02 ND c 0.02 ND c 0.02 NDC 7.74 x 10⁻⁶ Cadmium 0.22 0.45 0.78 0.48 2.27 x 10⁻⁴ Chromium 0.63 0.88 1.28 0.93 4.41 x 10⁻⁴ Copper 1.64 2.23 3.15 2.34 1.11 x 10⁻³ Lead 2.54 1.64 3.32 2.50 1.19 x 10⁻³ Manganese 2.02 2.94 7.50 4.15 1.96 x 10⁻³ Mercury 11.14 9.75 7.85 9.58 4.54 x 10⁻³ Nickel 0.63 1.70 1.37 1.23 5.81 x 10⁻⁴ Phosphorus 4.61 3.71 6.76 5.03 2.39 x 10⁻³ Selenium ND < 0.40 ND c 0.43 ND c 0.41 ND c 0.42 ND c 1.97 x 10⁻⁴ Silver ND< 0.08 NDc 0.09 NDc 0.06 NDc 0.08 NDc 3.94 x 10⁻⁵ Thallium NDC 0.04 0.08 NDc 0.04 < 0.05 c 2.52 x 10⁻⁵ Zinc 5.89 5.39 18.51 9.93 4.71 x 10⁻³

TABLE 4-20 TRACE METALS EMISSIONS
CALIFORNIA PORTLAND CEMENT COMPANY COAL WITH TIRES
KILN 1 JUNE - JULY 1999
Test No. Average
Date: 06/30199 07/01/99 07/02/99 Time: 0810-1455 0730-1420 0710-1410 Flow Rate, dscfm: 130.180 129,153 126,439 Sample Volume, dscf: 247.35 246.33 242.98 02. %: 14.39 14.17 74.31 C02, %: 10.33 10.43 10.50 H20, %: 3.4 3.6 3.9 lsokinetic Ratio, %: 99.9 100.3 101.1
Element g~.@%~j m ua/dscm - Iblhr
Antimony < 0.47 < 0.47 < 0.48 < 0.47 < 2.28 x 10⁻⁴ Arsenic 0.44 ND< 0.04 ND< 0.04 < 0.17 c 8.48 x 10⁻⁵ Barium 1 .OO 0.80 1.18 0.99 4.77 x 10⁻⁴ Beryllium ND< 0.02 ND< 0.02 ND< 0.02 ND< 0.02 NDc 7.61 x 10⁻⁶ Cadmium 0.43 0.12 0.55 0.37 1.77 x 10⁻⁴ Chromium 0.60 0.62 0.64 0.62 2.98 x 10⁻⁴ Copper I .48 1.63 1.37 1.49 7.02 x 10⁻⁴ Lead 0.96 2.24 0.48 1.22 5.91 x 10⁻⁴ Manganese 3.85 6.45 2.47 4.26 2.06 x 10⁻³ Mercury 15.15 17.55 19.29 17.33 8.33 x 10⁻³ Nickel 0.71 0.47 0.68 0.62 3.00 x 10⁻⁴ Phosphorus 6.71 4.73 6.98 6.14 2.95 x 10⁻³ Selenium NDc 2.00 NDc 2.01 ND< 0.04 NDc 1.35 NDc 6.54 x 10⁻⁴ Silver 0.12 NDq 0.08 NDc 0.08 < 0.09 c 4.55 10-5 Thallium 0.05 0.06 NDC 0.04 c 0.05 c 2.47 x 10⁻⁵ Zinc 15.12 28.08 15.39 19.53 9.41 x 10⁻³

4.10 TOTAL AND HEXAVALENT CHROMIUM
Total and hexavalent chromium emissions were determined by CARB Method 425.
The average emissions of hexavalent and total chromium at the baseline condition were 2.23 x lo4 lblhr and 3.44 x lo4 Iblhr. During the testing with tires, the emissions were 1.13 x lo4 lblhr of hexavalent chromium and 3.94 x lo4 lblhr of total chromium.
Tables 4-21 and 4-22 present detailed results.
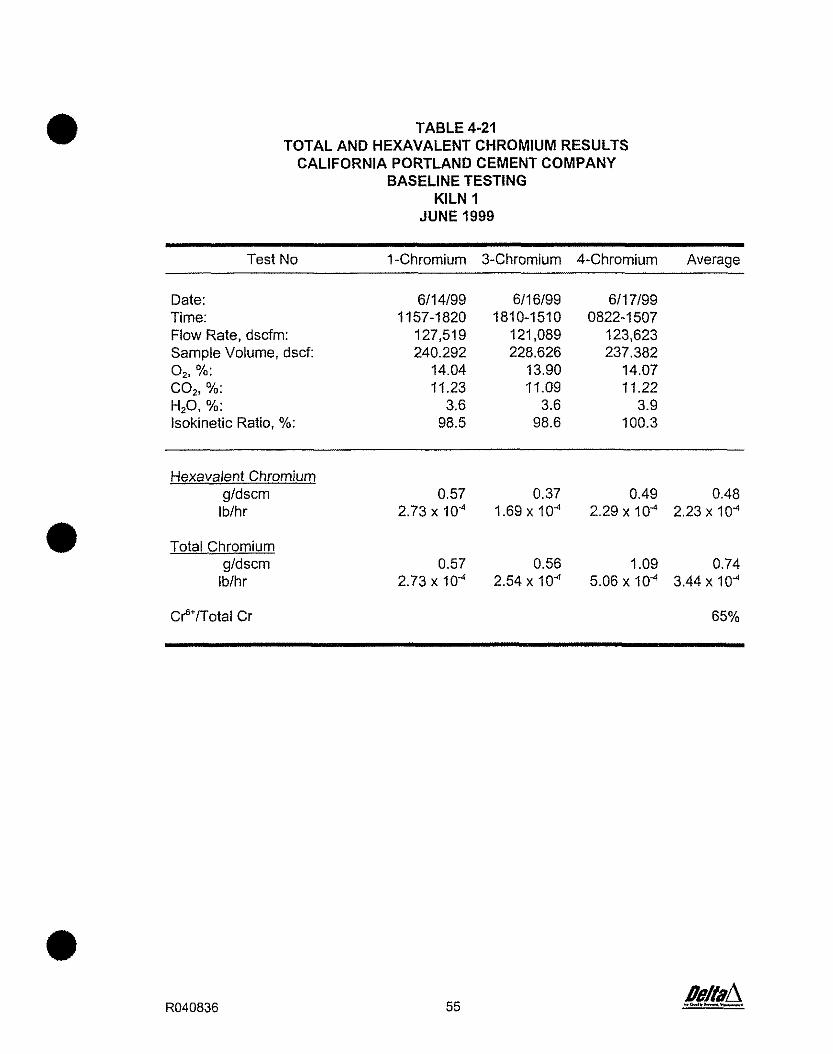
TABLE 4-21 TOTAL AND HEXAVALENT CHROMIUM RESULTS
CALIFORNIA PORTLAND CEMENT COMPANY BASELINE TESTING
KILN I JUNE 1999
Test No I-Chromium 3-Chromium 4-Chromium Average
Date: Time: Flow Rate, dscfm: Sample Volume, dscf: o,, %: co,, %: H,O. %: lsokinetic Ratio, %:
Hexavalent Chromium g/dscm 0.57 0.37 0.49 0.48 Iblhr 2.73x10⁴ 1.69x10⁴ 2.29x10⁴ 2.23x10⁴
Total Chromium aldscm

TABLE 4-22 TOTAL AND HEXAVALENT CHROMIUM RESULTS
CALIFORNIA PORTLAND CEMENT COMPANY COAL WITH TIRES
KILN 1 JUNE - JULY 1999
- -
Test No 5-Chromium 6-Chromium 7-Chromium Average
Date: Time: Flow Rate, dscfm: Sample Volume, dscf: o,, %: co,. %: H,O, %: lsokinetic Ratio, %:
Hexavalent Chromium gldscm 0.24 0.22 0.28 0.25 lblhr 1.13X lo4 1.01 X lo4 1.25X lo4 1.13X lo4
Total Chromium aldscm

4.11 HYDROCHLORIC AND HYDROFLUORIC ACID
Tables 4-23 and 4-24 contain the results of the hydrochloric and hydrofluoric acid testing.
At the baseline condition, hydrochloric acid emissions averaged less than 0.02 ppm or less than 0.017 tblhr. At the tire firing condition, hydrochloric and emissions averaged 0.6 ppm or 0.43 lblhr.
Hydrofluoric acid emissions averaged 0.04 ppm or 0.016 lblhr at the baseline condition and 0.06 ppm or 0.024 lblhr at the tire firing condition.

TABLE 4-23 HYDROCHLORIC AND HYDROFLUORIC ACID EMISSIONS
CALIFORNIA PORTLAND CEMENT COMPANY BASELINE TESTING
KILN 1 JUNE 1999
Test No 1-HCI 2-HCI 3-HCI Average
Date: Time: Flow Rate, dscfm: Sample Volume, dscf: o,, %: co,, %: H,O, %: lsokinetic Ratio, %:
Hvdrochloric Acid PPm lblhr
Hvdrofluoric Acid

TABLE 4-24 HYDROCHLORIC AND HYDROFLUORIC ACID EMISSIONS
CALIFORNIA PORTLAND CEMENT COMPANY COAL WITH TIRES
KILN 1 JULY 1999
Test No 4-HCI 5-HCI 6-HCI Average
Date: Time: Flow Rate, dscfm: Sample Volume, dscf: o,, %: co,, %: H,O, %: lsokinetic Ratio, %:
Hvdrochloric Acid ppm lblhr
Hvdrofluoric Acid PPm Ib/hr
4.12 ASBESTOS
Tables 4-25 and 4-26 present the results of the asbestos tests. These tests were conducted by CARE Method 427 using polycarbonate filters. It is important not to overload the filter because of the microscopy technique used. Therefore, the samples were collected using three different sample volumes as recommended by the method.
Asbestos was not detected in any sample. The samples with the largest sample volumes were acceptable for analysis so they are used for the final result.
The results for these tests were that asbestos was not detected at 407 fibersldscf for the baseline tests and not detected at 399 fibersldscf for the tire firing tests.

TABLE 4-25 ASBESTOS EMISSIONS
CALIFORNIA PORTLAND CEMENT COMPANY BASELINE TESTING
KILN I JUNE 1999
Test No I-Asbestos 2-Asbestos 3-Asbestos Average
Date: Time: Flow Rate, dscfm: Sample Volume, dscf: o,, %: co,, %: H,O, %: lsokinetic Ratio, %:
Asbestos fibers per sample ND< 11,047 ND< 11,047 ND< 11,047 ND< 11,047 fibersldscf ND< 407.0 ND< 786.5 ND< 1656.3 ND< 407

TABLE 4-26 ASBESTOS EMISSIONS
CALIFORNIA PORTLAND CEMENT COMPANY COAL WITH TIRES
KILN I JULY 1999
Test No 4-Asbestos 5-Asbestos 6-Asbestos Average
Date: Time: Flow Rate, dscfm: Sample Volume, dscf: o,, %: co,, %: H,O. %: lsokinetic Ratio, %:
Asbestos fibers per sample ND< 11,060 ND< 11,060 ND< 11.060 ND< 11.060

Parsons Engineering Science, Inc. . A Unit of Parsons Infrastructure & Technology Group Inc. 100 ViieSt Walnut Street . Pasadeni. Caliiornia Eii 124 . (626) 440-4000 Fax: (626) 440-6200
November 01. 1999
Mr. Jay M. Grady Manager Environmental Affairs California Portland Cement Company 2025 E. Financial Way Glendora, CA 91740
Subject: Letter Report presenting the results of the Comparative Health Risk Assessment, for Kilns Fired with Coal versus Coal and Tire Fuels at the CPCC Colton Facility.
Dear Jay:
Parsons Engineering Science, Inc. (Parsons ES) has completed the Health Risk Assessment (HRA) to establish the comparative risks resulting from hazardous air contaminants emitted from the kilns when fired with two different fuels (coal only versus a mixture of coal and tires). A brief description of the methodology used and the results obtained are presented below.
Methodology
Carcinogenic and non-carcinogenic health effects were estimated for both operating scenarios, using the latest versions of the ISC dispersion model and ACE health effects model. Results of the kiln stack source testing performed by Delta Air Quality Services, lnc.' were used to calculate emission rates required by the ACE model. Annual average emission rates were calculated assuming both kilns were operating 24 hourslday, 343 dayslyear2. Maximum hourly emissions, used only in determining acute health effects, were calculated assuming both kilns could operate at a maximum production rate of 50 tons per hour3. Source stack parameters (height, diameter, temperature, and exit velocity), receptor grids, and boundary coordinates established in previous studies4 were used in the HRAs for both operating scenarios. In addition, the current version of the ISC dispersion model utilizes elevation data for sources and receptors.
Toxicological parameters used in this study reflect current CalEPA guidance. CalEPA has recently added separate risk values for many chemical compounds emitted during one or both kiln firing scenarios. The risk values consist of unit risk factors and potency slope for many chemical specific organic compounds. Due to the limited availability of specific toxicological data in the past, exposure to these specific
1 Delta Air Quality Services, Inc; A82588 Emission Testing at CPCC's Colton Plant; September 1999. Grady, Jay; California Portland Cement; Personal communication (e-mail) to Antoine Assioun of Parsons ES; September 3. 1999.
"rady, Jay; California Portland Cement; Personal communication with Heidi Rous of Parsons ES; September 22, 1999.
4 Parsons ES; 1991 and 1992.

Cnlifomia Portland Ceiilenr, Co. Novenzber 01. 1999
Comparative Healtlt Risk Assess~nelzr Pape 2
compounds were treated as similar to the worst-case related pollutant, often resulting in a conservative over estimation of risks. Parsons used the most current toxicological data in performing these HRAs.
Many of the toxic air contaminants considered in these HRAs have multipathway exposure routes (including dermal absorption and consumption of nearby vegetation and animals). The exposure routes and parameters established by Parsons in previous studies were used in these comparative HRAs.
Results
Three potential health effects were studied: increased individual carcinogenic risk (assuming a 70-year residential exposure); non-carcinogenic health effects resulting from short-term exposure, expressed as the acute hazard index (HI); and non-carcinogenic health effects resulting from continuous exposure, chronic III. The results from both operating scenarios are presented on the following table.
Scenario Maximum Cancer Acute HI I Chronic HI Risk (endpoint) (endpoint) I
Coal Only 1.43 x 10 " ( 0.0514 (respiratory) / 0.0285 (respiratory) /
As shown on the table, for the coal only operating scenario, the predicted carcinogenic risk for the maximally exposed individual resident (MEIR) resulting from kiln emissions is 1.4 in one million (1.4 x 10.~). For the coal and tires operating scenario, the predicted carcinogenic risk for the MEIR is 0.76 in one million (7.6 x 10.'). Thus, operating the kiln under the coal and tire fuel scenario would result in a 47% reduction in carcinogenic risk at the MEIR, and all receptors, when compared to coal only.
Coal and Tire
Attachments A and B show the relative contribution from the significant hazardous air contaminants to the total carcinogenic risk for the coal only and the coal and tire fuel operating scenarios, respectively.
As shown on the table, for the coal only operating scenario, the maximum predicted acute HI is 0.0514, and the maximally impacted endpoint (target organ) would be the respiratory system. For the coal and tires operating scenario, the maximum predicted acute HI is 0.0031, also predicted for the respiratory system. Thus, operating the kiln under the coal and tire fuel scenario would result in a 94% reduction in acute health effects when compared to the coal only operating scenario.
0.76 x 10 "
Lastly, for the coal only operating scenario, the maximum predicted chronic HI is 0.0285, for the respiratory system. For the coal and tires operating scenario, the maximum predicted chronic HI is 0.0081, for the liver endpoint. Thus, operating the kiln
0.0031 (respiratory) 0.0081 (liver)

Califonlia Portla~ld Celnenr, Co. Co~~~parur ive Health Risk A s s e s s ~ n e ~ ~ t November 01, 1999 Page 3
under the coal and tire fuel scenario would result in a 72% reduction in chronic health effects over the coal only scenario. It should be noted, in the coal and tires scenario, vinyl chloride emissions contribute significantly to the chronic hazard index for the liver endpoint. This pollutant was not detected during sampling of the coal only scenario. For the sake of a one-to-one comparison between the two scenarios, the respiratory endpoint was predicted to experience a maximum HI of 0.0015 resulting from the coal and tires operating scenario. This reduction in predicted risk (95%) is in accordance with the reduction in formaldehyde and acetaldehyde emissions when tires are introduced into the fuel.
Because the parameters effecting the dispersion of pollutants, such as temperature and exit velocity, are the same regardless of fuel used, the reductions in predicted carcinogenic and non-carcinogenic health effects between the two scenarios are due entirely to the differences in emissions of toxic air contaminants. The sampling confirmed that firing the kilns with a mixture of tires and coal introduces the emission of additional toxic air contaminants not present in the coal only scenario. However, the sampling also determined that reducing the hourly rate of coal fired (by adding tires), results in a reduction in emissions of many other toxic air contaminants; some fall below detection limits. Thus, the overall risk is reduced for the coal and tire fuel scenario.
Spreadsheets containing relevant calculations and complete ACE model output files are included in Attachment C.
If you have any technical questions please contact myself, at (626) 440-6254 or Heidi Rous, at (626) 440-6284. Furthermore, if you need additional assistance, such as a formal report suitable for presentation to the SCAQMD, please feel free to contact me. It has been a pleasure to work with you again.
Sincerely, ,
Principal Engineer Parsons Engineering Science
Attachments A - C

Attachment A
Contribution by Pollutant to Maximum Cancer Risk at Peak Receptor (Coal Only Scenario)
023478 PeCDF (2.01 %)
El 2378 TCDF (2.6 %)
OAcetaldehyde (2.69 %)
0 Benzene (22.5 %)
84 Butadiene-1,3 (0 %)
O Formaldehyde (15.46 %)
Bother Pollutants (0.33 %)
0 Polychlor. biphenyls (7.64 %)
ffd Polvcvclic arom. HC 146.78 %)

Attachment B
Contribution by Pollutant to Maximum Cancer Risk at PC (Coal and Tires Scenario)
!ak Receptor
023478 PeCDF (8.37 %)
IB2378 TCDF (6.05 %)
OAcetaldehyde (0.7 %)
0 Benzene (36.55 %)
$il Butadiene-1,3 (5.9 %)
0 Formaldehyde (3.63 %)
@Other Pollutants (2.1 1 %)
0 Polychlor. biphenyls (13.14
@I Polycyclic arom. HC (23.55

CPCC Attachment C October 7, 1999
T
ACE #
70 1 3
149 90 96 13 146 145 122 29 151 140 48 20 129 130 110 201 202 305 306 307 308 309 310 31 1 312 314
hrslday daylyr
avg feed rate. tonslhr
Name
formaldehyde acetaldehyde acrotein vinyl chloride methyl bromide dichloromethane benzene trichloroethene toluene perchloroethene chlorobenzene xylenes styrene dichlorobenzene 1,3-butadiene PCBs PAH Naphthalene Chrysene Benz(b)fluoranthene 1234678 HpCDD OCDD 2378 TCDF 12378 PeCDF 23478 PeCDF 123478 HxCDF 123678 HxCDF 234678 HxCDF 1234678 HpCDF
Calculation
Source Test one
24 343
43.17
Coal firing
Ib!hr 8.800E-01 3.400E-01 8.000E-03
ND ND
1.790E-03 2.650E-01 2.650E-04 3.980E-02 6.81 0E-04 3.500E-03 8.720E-03
ND
kiln 24
343 38.57
Coal wl tires
tblhr 1.100E-01 4.700E-02
ND 1.70OE-03 1.16OE-03 1.470E-03 2.290E-01 2.180E-03
1 3.170E-02 1 DOE-03 2.180E-03 2.373E-02 6.650E-04
of Emission Rates Used in
Annual Average one
24 365
Coal firing
Iblhr 8.270E-01 3.195E-01 7.518E-03 0.000E+00 0.000E+00 1.682E-03 2.490E-01 2.490E-04 3.740E-02
3.289E-03 8.194E-03 0.000E+00 1.024E-03 0.000E+00 2.968E-04 3.522E-03 1
kiln 24 365
Coal wl tires
lblhr 1.034E-01 4.417E-02 0.000E+00 1.598E-03 1.090E-03 1.381 E-03 2.152E-01 2.049E-03 2.979E-02
6.400E04- 2.049E-03 2.230E-02 6.249E-04 6.559E-03 5.930E-03 2.718E-04 9.437E-04
HRAs
Annual Average
1.090E-03 ] 6.980E-03
two
Coal firing
g!sec 2.084E-01 8.051E-02 1.894E-03 0.000E+00 0.000E+00 4.239E-04 6.275E-02 6.275E-05 9.425E-03
8.288E-04 2.065E-03 0.000E+00 2.581 E-04 0.000E+00 7.480E-05 8.875E-04 9.330E-03 4.855E-07 1.144E-07 8.643E-11 3.173E-10 1.265E-08 1.066E-09 1.954E-09 2.342E-10 1.518E-10 1.395E-10 1.440E-10
Maximum hourly
ND 3.159E-04 3.748E-03 3.940E-02 2.050E-06 4.830E-07 3.650E-10 1.340E-09 5.340E-08 4.500E-09 8.250E-09 9.890E-10 6.410E-10 5.890E-10
kilns
Coal wl tires
glsec 2.605E-02 1 .I 13E-02 0.000E+00 4.026E-04 2.747E-04 3.481 E-04 5.423E-02 5.162E-04 7.507E-03
1 . 6 1 3 E - 0 4 - 3 8 8 ~ - 0 4 5.162E-04 5.619E-03 1.575E-04 1.653E-03 1.494E-03 6.848E-05 2.378E-04 7.933E-03 0.000E+00 0.000E+00 9.946E-I 1 2.676E-10 1.565E-08 1.066E-09 4.334E-09 4.144E-10 1.871 E-70 2.558E-10 1.520E-10
two
50
Coal firing
g!sec 2.568E-01 9.923E-02 2.335E-03 0.000E+00 0.000E+00 5.224E-04 7.734E-02 7.734E-05 1 .I 62E-02
1.022E-03 2.545E-03 0.000E+00 3.181 E-04 0.000E+00 9.219E-05 1 .OWE-03 1.150E-02 5.983E-07 1.410E-07 1.065E-10 3.91 1 E-10 1.559E-08 1.313E-09 2.408E-09 2.887E-10 1.871 E-10 1.719E-10 1.775E-10
6.310E-03 2.892E-04 1.004E-03 3.350E-02
ND ND
4.200E-10 1.130E-09 6.610E-08 4.500E-09 1.830E-08 1.750E-09 7.900E-10 1.080E-09
3.703E-02 1.926E-06 4.539E-07 3.430E-10 1.259E-09 5.018E-08 4.229E-09 7.753E-09 9.294E-10 6.024E-10 5.535E-10 5.714E-10
kilns
50
Coal w/ tires
glsec 3.593E-02 1.535E-02 0.000Ec00 5.553E-04 3.789E-04 4.802E-04 7.481E-02 7.121E-04 1.036E-02 4.214E-04 7.121E-04 7.752E-03 2.172E-04 2.280E-03 2.061E-03 9.447E-05 3.280E-04 1.094E-02 0.000E+00 0.000E+00 1.372E-10 3.691E-10 2.159E-08 1.470E-09 5.978E-09 5.717E-10 2.581E-10 3.528E-10 2.097E-10 6.080E-10 ( 6.420E-10
3.148E-02 0.000E+00 0.000E+00 3.947E-10 1.062E-09 6.212E-08 4.229E-09 1.720E-08 1.645E-09 7.424E-10 1.015E-09 6.033E-10