aapm initiatives in quantitative imaging · aapm initiatives in quantitative imaging. john m....
TRANSCRIPT

AAPM Initiatives in Quantitative Imaging
John M. Boone, Ph.D., FAAPM, FSBI, FACR
Chair, AAPM Science CouncilChair, Ad Hoc Committee on Quantitative ImagingChair, TG on QI in CT
Professor and Vice Chair (Research) of RadiologyProfessor of Biomedical EngineeringUniversity of California Davis Medical Center
Disclosures:
• Varian Imaging Systems, Paid Consultant
• Artemis, Paid Consultant
• Varian Imaging Systems, Research Funding
• Hologic Corporation, Research Funding
• Fuji Medical Systems, Research Funding

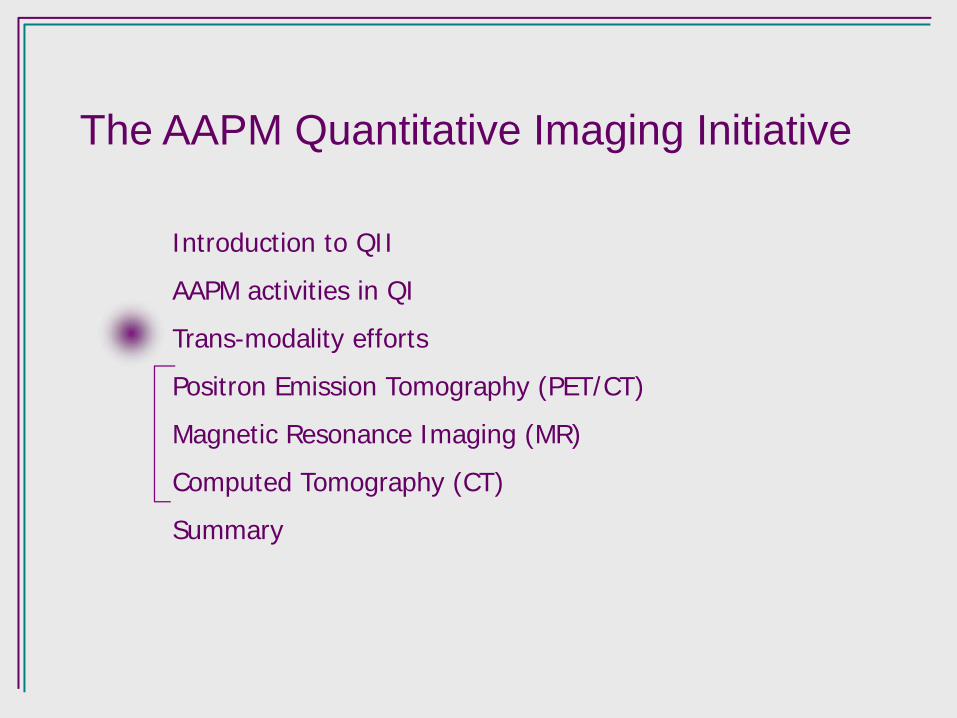
The AAPM Quantitative Imaging Initiative
Introduction to QII
AAPM activities in QI
Trans-modality efforts
Positron Emission Tomography (PET/CT)
Magnetic Resonance Imaging (MR)
Computed Tomography (CT)
Summary
Currently used Image-
based Quantitative Metrics

Bone mineral density analysis
2D
3D
RISK

Cardiac Imaging
Atrial & Ventricular Volume
Ejection Fraction
Stroke Volume
Cardiac Output
Myocardial Perfusion
Percent Stenosis
Etc.
FUNCTION
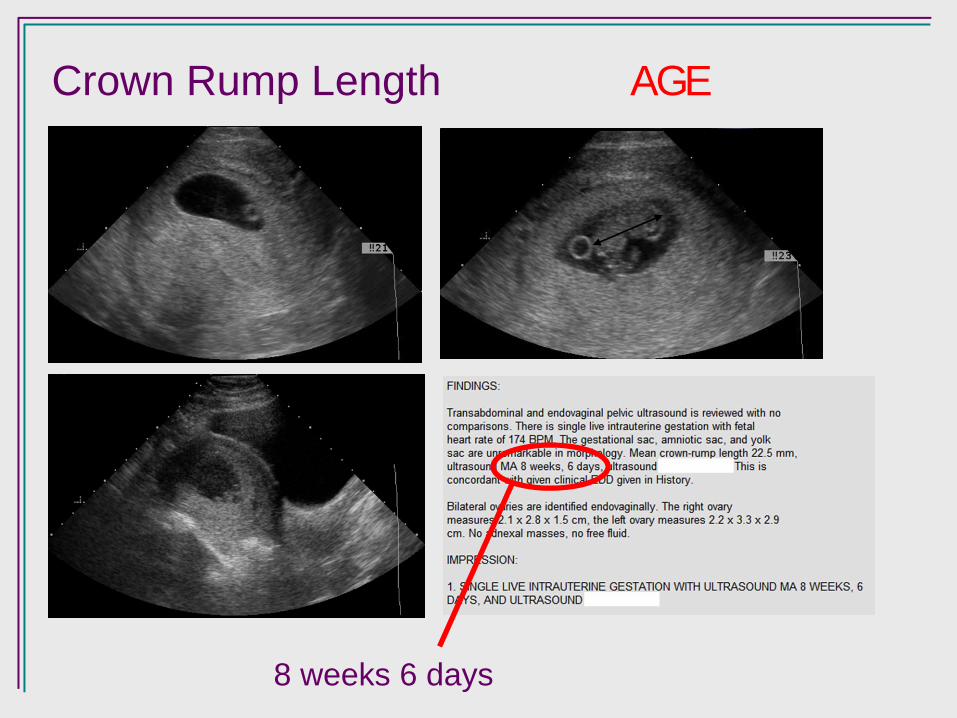
Crown Rump Length
8 weeks 6 days
AGE

Jour
nal o
f Abd
omin
al Im
agin
g 29
, 200
4Liver R Kidney
Pancreas Spleen
SIZE

RECIST
Uni-dimensional measurement of tumor “size”
Progression / Stable disease / Partial Response / Complete Response
NIH-required imaging surrogate
Response evaluation criteria in solid tumors
time 1 time 2
RESPONSE

Radiation Therapy
LOCALIZATIONTREATMENT PLANNING

Future potential for Image-
based Quantitative Metrics

2009199819881978196819581943 1948year
PACS
The history of radiology:Part 1: Past History
mostly analog mostly digital

21002080206020402009 2020year
The history of radiology:Part 2: Future “History”
mostly qualitative mostly quantitative
2109
virtually all digital
Era of Quantitative Imaging

The AAPM Quantitative Imaging Initiative
Introduction to QII
AAPM activities in QI
Trans-modality efforts
Positron Emission Tomography (PET/CT)
Magnetic Resonance Imaging (MR)
Computed Tomography (CT)
Summary
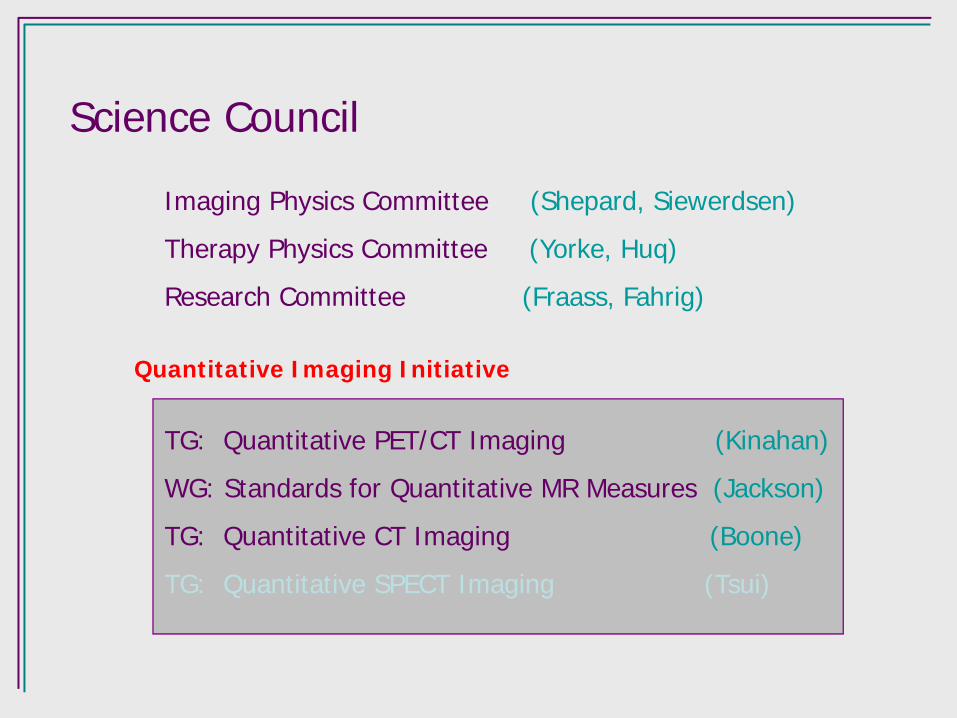
Science Council
Imaging Physics Committee (Shepard, Siewerdsen)
Therapy Physics Committee (Yorke, Huq)
Research Committee (Fraass, Fahrig)
TG: Quantitative PET/CT Imaging (Kinahan)
WG: Standards for Quantitative MR Measures (Jackson)
TG: Quantitative CT Imaging (Boone)
TG: Quantitative SPECT Imaging (Tsui)
Quantitative Imaging Initiative

AAPM FOREM March 30-31, 2009 in Chicago, 20 participants
Model observers for tomosynthesis and CT of the breast: Theoretical and Practical considerations.
AAPM Proton Therapy SymposiumMay 8-9, 2009 in Baltimore, ~200 participants

Imaging for Treatment Assessment in Radiation Therapy – iTART 2010
• Imaging for target definition• Imaging for treatment assessment• Image quantification• Industry, regulatory issues
June 21-22, 2010Lansdowne, VA
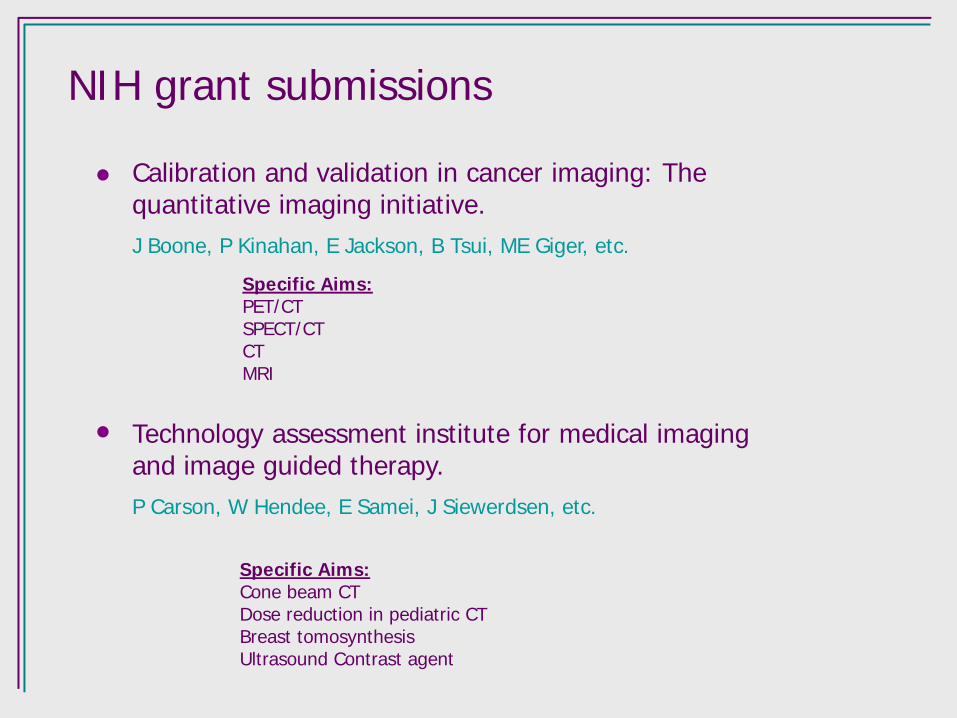
NIH grant submissions
Calibration and validation in cancer imaging: The quantitative imaging initiative.J Boone, P Kinahan, E Jackson, B Tsui, ME Giger, etc.
Technology assessment institute for medical imaging and image guided therapy.P Carson, W Hendee, E Samei, J Siewerdsen, etc.
Specific Aims:Cone beam CTDose reduction in pediatric CTBreast tomosynthesisUltrasound Contrast agent
Specific Aims:PET/CTSPECT/CTCTMRI
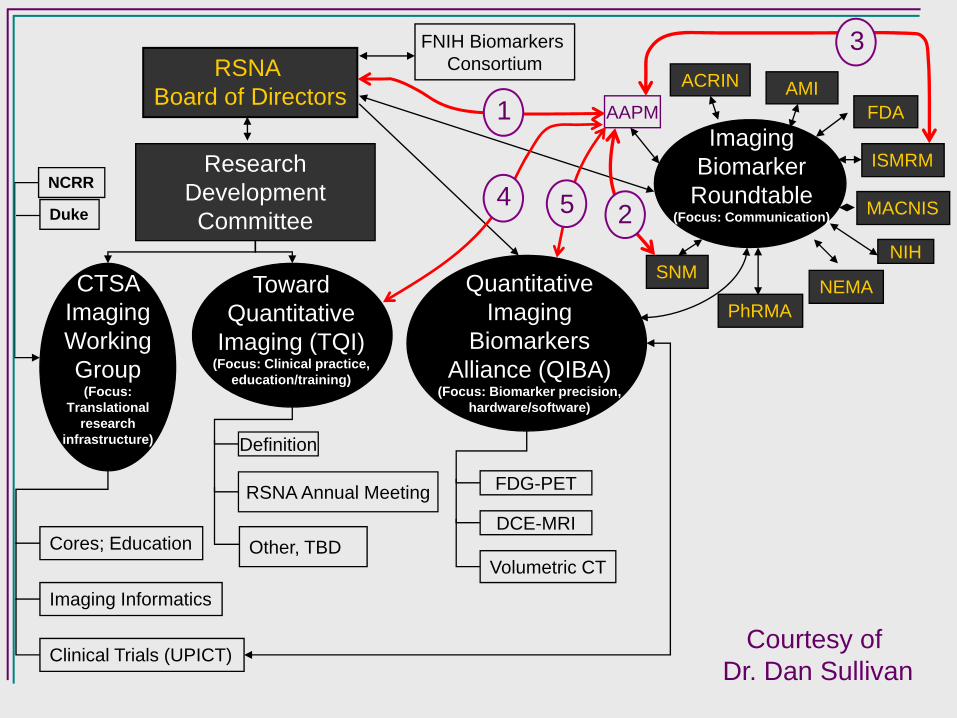
RSNA Board of Directors
Research Development Committee
Imaging Biomarker
Roundtable(Focus: Communication)
Toward Quantitative
Imaging (TQI)(Focus: Clinical practice,
education/training)
Quantitative Imaging
Biomarkers Alliance (QIBA)
(Focus: Biomarker precision, hardware/software)
CTSA Imaging Working Group
(Focus: Translational
research infrastructure)
SNM
PhRMA
MACNIS
ISMRM
Cores; Education
Imaging Informatics
Clinical Trials (UPICT)
FDG-PET
DCE-MRI
Volumetric CT
Definition
RSNA Annual Meeting
NIH
FNIH Biomarkers Consortium
AAPM
ACRIN AMIFDA
Duke
NCRR
NEMA
Other, TBD
Courtesy of Dr. Dan Sullivan
1
2
3
4 5

The AAPM Quantitative Imaging Initiative
Introduction to QII
AAPM activities in QI
Trans-modality efforts
Positron Emission Tomography (PET/CT)
Magnetic Resonance Imaging (MR)
Computed Tomography (CT)
Summary

Specific methods in QI for Image Calibration
Phantom Fabrication
Image Calibration
PhantomImage
Analysis
PhantomImaging
Correction Techniques
IndependentValidation
PhantomDesign

Spatial integrity ([x,y,z] distance, area, volume)
Gray scale (HU) calibration
Flow rate accuracy
Temporal accuracy
Physiologic/anatomic parameters
Volume change, Uptake, flow, perfusion, kinetic assessment, permeability. others….
Quantitative Parameters of Interest
Precision over time with same scanner
Precision between different scanners

General themes in QI for imaging systems
ScannerCalibration
Protocol Development
Implementation Demonstration of QI utility
1. Do this do that
2. Do that then this
3. Don’t do that
4. Do this and that
5. Wait for a while
6. Weigh patient
7. Perform patient survey
8. Bundle images
9. Recruit readers
10. Patient follow-up
Variance Reduction

The AAPM Quantitative Imaging Initiative
Introduction to QII
AAPM activities in QI
Trans-modality efforts
Positron Emission Tomography (PET/CT)
Magnetic Resonance Imaging (MR)
Computed Tomography (CT)
Summary

Time to Treatment Failure by Percent CT Reduction Days 21-40
0 5 10 15 20 25 30 35
0.0
0.2
0.4
0.6
0.8
1.0
Time (Months)
Prop
ortio
n A
live
and
Failu
re F
ree
CT Percent Reduction < 50%CT Percent Reduction >= 50%Logrank p=0.55
Holdsworth, et al - Dana-Farber Cancer Institute
Gleevec / GIST

Time to Treatment Failure by SUVmax Percent Reduction
0 5 10 15 20 25 30 35
0.0
0.2
0.4
0.6
0.8
1.0
Time (Months)
Prop
ortio
n A
live
and
Failu
re F
ree
SUVmax Percent Reduction < 25%SUVmax Percent Reduction >= 25%Logrank p=0.003
Van den Abbeele, et al - Dana-Farber Cancer Institute

Quantitative Imaging Using PET/CT
Paul Kinahan, PhD
Director of PET/CT PhysicsImaging Research Laboratory, Department of Radiology
University of Washington, Seattle, WA
SNM Clinical Trials Network Community WorkshopFebruary 8-9, 2009
Clearwater, FL
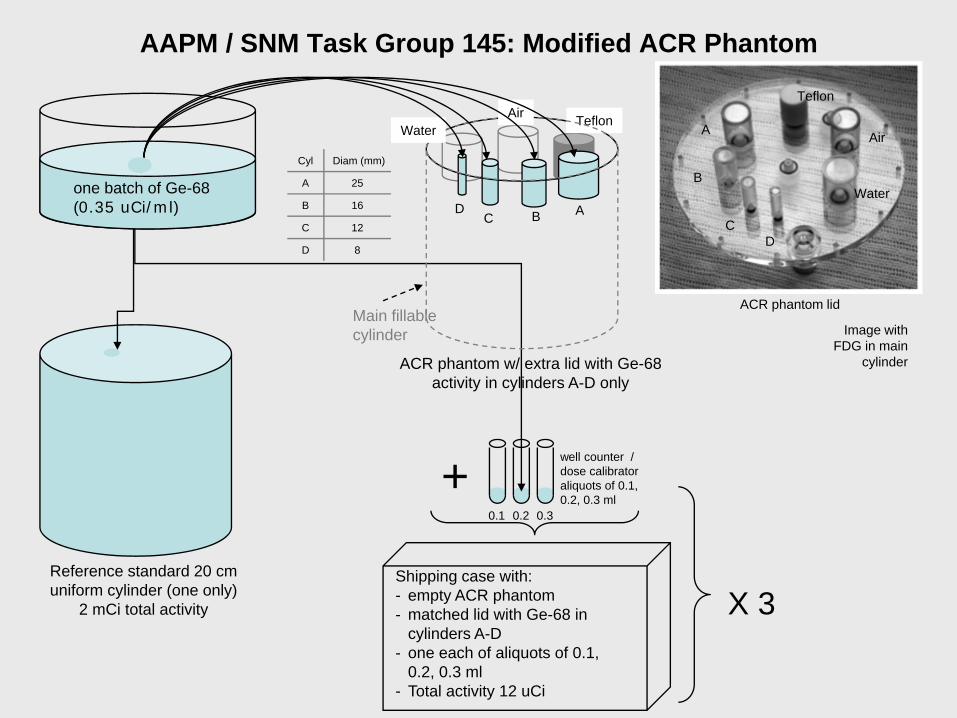
0.1 0.2 0.3
ABCD
TeflonWater
Air
one batch of Ge-68 (0.35 uCi/ml)
A
B
CD
Air
Water
Teflon
ACR phantom lid
ACR phantom w/ extra lid with Ge-68 activity in cylinders A-D only
well counter / dose calibrator aliquots of 0.1, 0.2, 0.3 ml
Reference standard 20 cm uniform cylinder (one only)
2 mCi total activity
Main fillable cylinder
Shipping case with:- empty ACR phantom- matched lid with Ge-68 in
cylinders A-D- one each of aliquots of 0.1,
0.2, 0.3 ml- Total activity 12 uCi
X 3
+
Image with FDG in main
cylinder
Cyl Diam (mm)
A 25
B 16
C 12
D 8
AAPM / SNM Task Group 145: Modified ACR Phantom

Sample Image Sections from Six Different Scanners

‘Coffee Break’ Repeat PET/CT scans with Repositioning
GE DSTE-16 PET/CT Scanner Siemens Biograph HI-REZ-16 PET/CT Scanner
20%
30%
40%
50%
60%
70%
80%
90%
100%
5 10 15 20 25 30 35Sphere Diameter (mm
Max
Mean
20%
30%
40%
50%
60%
70%
80%
90%
100%
5 10 15 20 25 30 35Sphere Diameter (mm)
Max
Mean
SUVs from 20 3D-OSEM scans with 7-mm smoothing
• Intra-scanner short-term variability is 3% - 4%

The AAPM Quantitative Imaging Initiative
Introduction to QII
AAPM activities in QI
Trans-modality efforts
Positron Emission Tomography (PET/CT)
Magnetic Resonance Imaging (MR)
Computed Tomography (CT)
Summary

Sketches of DCE-MRI phantom
Cross hatch indicates spheres out of center planeM. H. Buonocore, IRAT MRI Subcommittee Joshua Levy, Phantom Laboratory

Locations of Posterior, Middle and Anterior slices
Posterior
Anterior
M. Buonocore, IRAT MRI Subcommittee
Anterior slice
Middle slice
Posterior slice

Figure A.13, Figure A.14
Alignment lights and landmarkshould be aligned and set with center band of velcro strap.
MH Buonocore, IRAT MRI Subcommittee 35Feb 12, 2008

FSPGR (Anterior slice, Position‐S)
3° 6° 9°
15° 24° 35°M. Buonocore, IRAT MRI Subcommittee

Top Left Bottom Right Middle“S” 237.8 783.9 310.8 480.2 411.6“R” 468.4 252.2 728.5 331.8 413.5“I” 326.2 489.1 237.0 769.5 419.9“L” 719.3 335.9 439.1 240.0 401.1
Ave (“S”) 241.8 750.3 326.2 469.2 411.5
Expected 295.0 804.5 385.7 532.2 417.5
T1 values (Posterior slice)
Top Left Bottom Right Middle“S” 354.5 215.2 537.6 275.1 412.4“R” 261.2 371.8 201.3 563.9 401.1“I” 540.5 276.5 368.9 214.7 407.4“L” 205.7 579.4 275.3 386.0 416.4
Ave (“S”) 370.3 209.2 555.4 272.0 409.3
Expected 449.4 260.0 644.3 335.1 417.5
T1 values (Anterior slice)
M. Buonocore, IRAT MRI Subcommittee

3° 6° 9°
15° 24° 35°M. Buonocore, IRAT MRI Subcommittee
use of calibration methods (phantoms and software) acrossscanner platforms and acquisition techniques.
Variability between scanners

The AAPM Quantitative Imaging Initiative
Introduction to QII
AAPM activities in QI
Trans-modality efforts
Positron Emission Tomography (PET/CT)
Magnetic Resonance Imaging (MR)
Computed Tomography (CT)
Summary

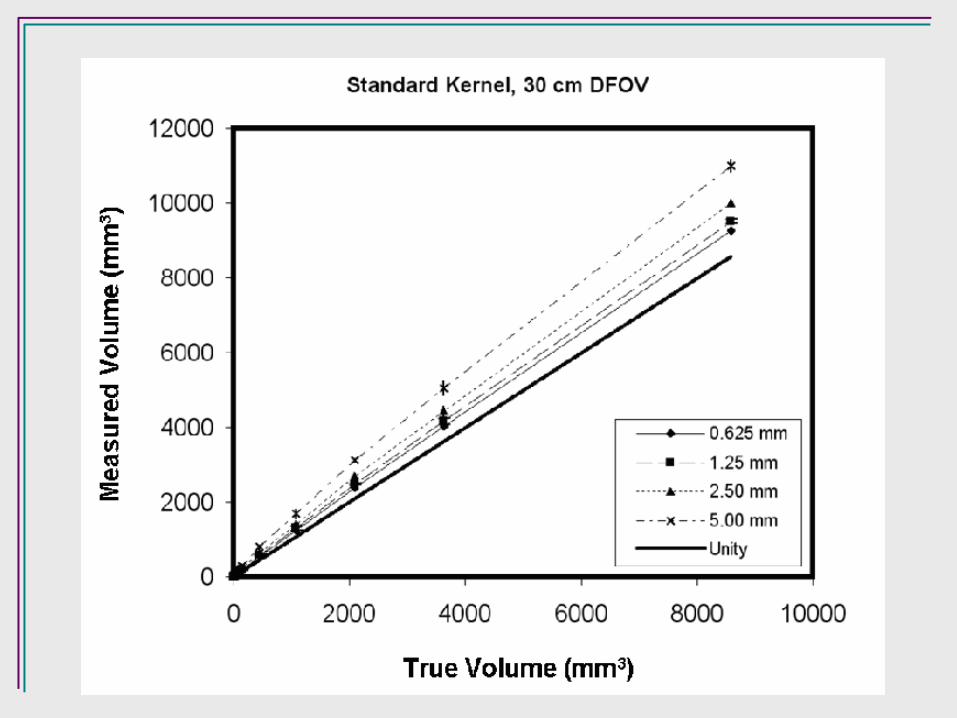
CT volume accuracy
Ave
rage
per
cen
t er
ror


MTF(f)
NPS(f)
(x,y) (z)

spatialresolution
dosimetry
contrast resolution
contrast

spatialresolution
dosimetry
contrast resolution
contrast volume assessment
known volume
mea
sure
d vo
lum
e
The AAPM Quantitative Imaging Initiative
Introduction to QII
AAPM activities in QI
Trans-modality efforts
Positron Emission Tomography (PET/CT)
Magnetic Resonance Imaging (MR)
Computed Tomography (CT)
Summary

A
B
CD
Air
Water
Teflon