about the independent fiscal office
TRANSCRIPT


About the Independent Fiscal Office
The Independent Fiscal Office (IFO) provides revenue projections for use
in the state budget process along with impartial and timely analysis of
fiscal, economic and budgetary issues to assist Commonwealth residents
and the General Assembly in their evaluation of policy decisions. In that
capacity, the IFO does not support or oppose any policy it analyzes, and
will disclose the methodologies, data sources and assumptions used in
published reports and estimates.
Independent Fiscal Office
Rachel Carson State Office Building
400 Market Street
Harrisburg, PA 17105
Telephone: 717-230-8293
Email: [email protected]
Website: www.ifo.state.pa.us
___________________________________________________________
The Independent Fiscal Office was created
by the Act of Nov. 23, 2010 (P.L.1269, No.120).
___________________________________________________________

- This page intentionally left blank. -

INDEPENDENT FISCAL OFFICE
March 22, 2019
This report provides an analysis of the tax and revenue proposals included in the 2019-20 Executive
Budget released in February 2019. The Independent Fiscal Office (IFO) publishes this report to fulfill its
statutory duties as provided under Section 604-B (a)(4) of the Administrative Code of 1929. The statute
requires that the IFO “provide an analysis, including economic impact, of all tax and revenue proposals
submitted by the Governor or the Office of the Budget.”
This report uses various data sources to derive estimates of the revenue proposals included in the budget.
All data sources and methodologies used to derive those estimates are noted in the relevant sections of
this document. The IFO would like to thank the various organizations that provided input for this report.
Questions or comments regarding the contents of this report may be submitted to
Sincerely,
MATTHEW J. KNITTEL
Director
Rachel Carson State Office Building, 400 Market Street, Harrisburg PA 17105 www.ifo.state.pa.us | (717) 230-8293 | [email protected]

- This page intentionally left blank. -

Table of Contents
Introduction .............................................................................................................................. 1
Tax and Revenue Proposals ...................................................................................................... 3
Corporate Net Income Tax ............................................................................................................... 3
Sales and Use Tax ........................................................................................................................... 8
Personal Income Tax ....................................................................................................................... 9
Resource Enhancement Tax Credit ................................................................................................... 9
Raising the Minimum Wage .................................................................................................... 11
Minimum Wage Across States ........................................................................................................ 12
Recent Minimum Wage Studies ...................................................................................................... 14
Workers Affected by a $12 per Hour Minimum Wage ....................................................................... 19
Businesses Affected by a $12 per Hour Minimum Wage ................................................................... 22
Employment Impact from a $12 per Hour Minimum Wage ............................................................... 23
Income Effects for Affected Workers .............................................................................................. 25
General Price Impact ..................................................................................................................... 26
Impact on General Fund Revenues ................................................................................................. 28
Impact on State and Local Government Expenditures ...................................................................... 29
Income Mobility of Low-Wage Workers ........................................................................................... 32
Impact on Tipped Workers ............................................................................................................. 34
Moving from a $12 to $15 per Hour Minimum Wage ........................................................................ 37
Summary ...................................................................................................................................... 38

- This page intentionally left blank. -

Introduction | Page 1
Introduction
This report provides revenue estimates for the tax and revenue proposals contained in the 2019-20 Execu-
tive Budget released in February 2019. The Independent Fiscal Office (IFO) publishes this report to fulfill its
statutory duties as provided under Section 604-B (a)(4) of the Administrative Code of 1929. The statute
requires that the IFO “provide an analysis, including economic impact, of all tax and revenue proposals
submitted by the Governor or the Office of the Budget.”
The report contains two sections. The first section analyzes the tax and revenue proposals included in the
2019-20 Executive Budget and the corresponding impact on General Fund revenues over a five-year period.
The text includes brief descriptions of the data sources and methodologies used to derive the revenue
estimates, as well as an interstate comparison of CNIT rates and filing methods. The second section analyzes
the proposal to increase the state minimum wage from $7.25 to $12.00 per hour. It discusses potential
employment effects, income effects and implications for General Fund revenues and expenditures. Due to
lack of current research, the section provides only general comments on the proposed increase in the min-
imum wage from $12.00 to $15.00 per hour over a six-year period.
The analyses contained in this report are based on descriptions from the 2019-20 Executive Budget and,
when available, technical language provided by the administration. For this year, the administration pro-
vided language for the proposed increase in the minimum wage, but language was not available for the
proposed corporate net income tax rate reduction, enactment of combined reporting or the newly proposed
transfers.

- This page intentionally left blank. -

Tax and Revenue Proposals | Page 3
Tax and Revenue Proposals
The 2019-20 Executive Budget proposes changes to the corporate net income tax, new transfers from the
personal income tax and the sales and use tax to various funds and an expansion of the Resource Enhance-
ment Tax Credit. This analysis projects that the proposals will reduce General Fund revenues by $192
million in fiscal year (FY) 2019-20. The reduction is projected to increase to $873 million by FY 2023-24.
Corporate Net Income Tax
The administration’s proposal (1) reduces the corporate net income tax (CNIT) rate from 9.99 percent to
8.99 percent for tax years beginning in 2020; 8.29 percent for tax years beginning in 2021; 7.49 percent
for tax years beginning in 2022; 6.99 percent for tax years beginning in 2023; and 5.99 percent for tax
years beginning in 2024 and thereafter and (2) requires corporations that are members of a unitary busi-
ness group to apportion their income via a combined annual report for tax purposes, a filing method com-
monly known as combined reporting, effective for tax years beginning in 2020 and thereafter.1
Methodology
The CNIT proposal was analyzed in the following order: (1) rate reduction and (2) combined reporting. The
stacking order does not affect the total net impact of the proposal, but it does change the relative magni-
tudes of the rate reduction and combined reporting estimates.
1 A unitary business is a single economic enterprise that is comprised of separate parts of a single business entity or of a commonly controlled group of business entities that are sufficiently interdependent, integrated and interrelated through their activities so as to provide a synergy and mutual benefit that produces a sharing or exchange of value among them and a significant flow of value to the separate parts. Source: “Allocation and Apportionment Regulations” Multistate Tax Commission (MTC) www.mtc.gov/uploadedFiles/Multistate_Tax_Commission/Uniformity/Uni-formity_Projects/A_-_Z/AllocaitonandApportionmentReg.pdf.
18-19 19-20 20-21 21-22 22-23 23-24
Corporate Net Income Tax n.a. -$2 -$26 -$222 -$418 -$658
Sales and Use Tax n.a. -135 -168 -172 -172 -172
Personal Income Tax n.a. -52 -43 -43 -42 -40
Resource Enhancement Tax Credit n.a. -3 -3 -3 -3 -3
Total n.a. -192 -240 -440 -634 -873
Table 1.1
General Fund Revenue Impact Summary
Note: Figures in dollar millions.

Tax and Revenue Proposals | Page 4
Rate Reduction
The estimate applies the proposed rate reduction to the IFO’s most recent CNIT baseline projection. The
estimate includes a behavioral impact that partially offsets the static revenue loss due to the lower tax rate
because corporations have less incentive to use tax planning techniques to reduce Pennsylvania corporate
tax liability if tax rates are reduced. In addition, when fully phased in, the 40 percent reduction in the tax
rate would likely be sufficient to have a positive impact on firms’ location decisions.
Combined Reporting
Under mandatory combined reporting, multi-state businesses that form a unitary group are required to file
a combined return as if the related entities were a single corporation. The combined return reflects the net
income or loss associated with the business operations of all members of the unitary group and income is
apportioned to the taxing jurisdiction based on the activity of the combined group in that jurisdiction.
Supporters believe this filing method reduces a taxpayer’s ability to shift profits to low or no tax states
through related party transactions and is subject to less manipulation by taxpayers. Supporters also note
that the filing method will “level the playing field” because Pennsylvania-only firms cannot shift profits to
other states. Opponents believe it will subject profits to tax that have little or no economic connection to
the state and constrain economic growth. They also believe that the filing method will introduce significant
administrative complexity.
Determination of the unitary group is a key component of combined reporting and is generally based on
the ownership of the group, as well as the relationships between the corporations within the group. Esti-
mating the impact from the shift to combined reporting is subject to uncertainty, largely because taxing
authorities lack full information regarding the characteristics of potential unitary groups. The overall taxable
income and apportionment for each group will change based on the group’s composition, and some groups
will realize an increase in tax liability compared to separate entity reporting, while others realize a decline.
The determination of the composition of the unitary group can also be complicated and subjective. As a
result, the members included in a unitary group may be subject to significant litigation. Despite the uncer-
tainty, combined reporting is generally assumed to increase tax collections in high rate states due to various
methods that can be used to shift profits to low or no tax states.
In 2013, the IFO issued a report which used research from states that implemented combined reporting
during the previous decade to examine the revenue impact from that filing method.2 The report found that
combined reporting could increase revenues by roughly 9 to 13 percent. As an update to that analysis, the
IFO reviewed CNIT collections and GDP data for the six states (“CR states”) that have implemented com-
bined reporting since 2006 to determine the impact that filing method had on state tax collections.3
2 See “Corporate Tax Base Erosion: Analysis of Policy Options,” Independent Fiscal Office (March 2013) http://www.ifo.state.pa.us./Releases.cfm. 3 The CR states include Connecticut, Massachusetts, New York, Rhode Island, Vermont and Wisconsin. Kentucky and New Jersey implemented combined reporting for 2019 but were excluded from the analysis because data were not available for the post-combined reporting period. For states that enacted a rate reduction, revenues were adjusted for the rate change. West Virginia and Michigan also enacted combined reporting during that period but were excluded from the analysis due to other fundamental changes to the tax system (Michigan) or a collapse of the tax base moti-vated by natural resource firms (West Virginia).

Tax and Revenue Proposals | Page 5
The analysis uses a relatively simple test for this purpose. The test compares the difference in average
growth rates for private state GDP and CNIT revenues for CR states and 10 control states from 2005 to
2018.4 5 Overall, there should be a positive relationship between state economic growth and CNIT tax
revenues over the 13-year period: higher state economic growth should be positively correlated with cor-
porate profits and CNIT revenues. For the 10 control states, the analysis finds that average CNIT revenue
growth (1.2 percent) lagged state GDP growth (3.5 percent) by 2.3 (weighted average) to 1.5 (unweighted
average) percentage points during the time period under consideration. (See Table 1.2.) By comparison,
for CR states, the growth rate differential is only 1.0 (weighted) or 0.9 (unweighted) percentage points
because average CNIT revenue growth lags GDP growth by a smaller percentage. Overall, the difference
in the growth rate differential between the two groups is roughly 1.3 (weighted) to 0.6 (unweighted)
percentage points.
This simple comparison suggests that the change in filing method expanded the tax base in CR states and
led to higher CNIT revenue growth rates than would otherwise be expected. Given average state GDP
growth rate of 3.0 to 3.5 percent per annum, a 1.0 percentage point differential between the two groups
is roughly equivalent to a 12 percent expansion of the tax base for CR states. It is noted that this is an
average result, and certain CR states recorded stronger gains (MA and WI), while others recorded a reduc-
tion (RI) using this comparison methodology.
4 The 10 control states did not enact major tax law changes during the time period, such as a rate reduction (except Maryland). They are also economically diversified states and are not dependent on natural resources or particular sectors (e.g., high tech). Control states include Pennsylvania, Florida, Georgia, Maryland, New Jersey (prior to imple-mentation of combined reporting), Virginia, Minnesota, Iowa, Alabama and Missouri. 5 The analysis used two-year averages at the start and end of the period due to the inherent volatility of CNIT revenues. For example, the starting level for CNIT revenues is the average of FY 2004-05 and FY 2005-06 and the end point is the average of FY 2016-17 and FY 2017-18. For GDP, the starting point is the average of calendar year (CY) 2004 and CY 2005 and the end point uses CY 2016 and CY 2017. The GDP computation excludes the government sector.
CNIT2GDP Difference
Control States
Weighted 1.2% 3.5% -2.3%
Unweighted 1.6 3.1 -1.5
Combined Reporting States
Weighted 2.7 3.7 -1.0
Unweighted 2.1 3.1 -0.9
Table 1.2
1 See footnote 5 for a description of the growth rate computation.
Sources: U.S. Census, U.S. Bureau of Economic Analysis and various state websites.
2005 to 2018 Average Growth Rates1
Combined Reporting Base Expansion
2 Data through FY 2016-17 are from the U.S. Census Bureau's Annual Survey of State Government Tax
Collections. Data for FY 2017-18 are estimated based on information published on various state websites.

Tax and Revenue Proposals | Page 6
Having determined the general impact of combined reporting for CR states, the IFO considered three ad-
ditional factors to determine the appropriate base expansion parameter to use for the estimate: (1) pro-
posed restrictions on the use of net operating losses (NOLs), (2) by FY 2023-24, the CNIT rate will have
declined by 4.0 percentage points under the administration’s proposal and (3) the Department of Revenue
estimates that the addback provision for intangible expenses enacted in 2013 generates roughly $40-$50
million annually.6 The addback provision reverses certain tax shifting transactions that combined reporting
is designed to prevent, thereby reducing the revenue impact from a change to mandatory combined re-
porting. Combined reporting could also be less effective (i.e., a smaller relative base expansion and revenue
impact) at lower tax rates because firms have less incentive to engage in tax planning. However, Pennsyl-
vania also has a higher tax rate than the six CR states and more restrictive NOL provisions. Both charac-
teristics suggest that combined reporting could have larger revenue implications for Pennsylvania. The
analysis assumes that these effects generally offset each other and uses a 12 percent base expansion
parameter upon enactment of combined reporting, but the parameter declines to 10 percent as the statu-
tory tax rate decreases under the first part of the proposal.
The combined reporting estimate reflects timing issues related to state or taxpayer challenges under the
new reporting regime. It is not unusual for states or taxpayers to dispute the inclusion or exclusion of
entities that comprise a unitary group. Resolution of those issues could take several years. The full imple-
mentation of the new reporting regime by a state tax authority will also require additional resources for
audit and enforcement purposes.
Revenue Impact
Table 1.3 displays the estimated net revenue impact of the CNIT proposal over the next five fiscal years.
The proposal has no impact on FY 2018-19 and reduces revenue by $2 million for FY 2019-20. By the end
of the five-year window, the net impact of the proposal is a revenue reduction of $658 million due to the
CNIT rate reduction. The Department of Revenue anticipates that the proposal will require updates to the
business tax system and additional staff training at a one-time cost of $1 million (not included in table).
6 Under the administration’s proposal, sharing of NOLs between members of a unitary business group is not permitted and the 40 percent NOL cap is applied to the member’s apportionable share of the combined business income (essen-tially a separate company basis).
18-19 19-20 20-21 21-22 22-23 23-24
Rate Reduction n.a. -$78 -$313 -$538 -$762 -$984
Combined Reporting n.a. 76 287 315 344 326
Total n.a. -2 -26 -222 -418 -658
Note: Figures in dollar millions.
Table 1.3
Corporate Net Income Tax Detail
Tax and Revenue Proposals | Page 7
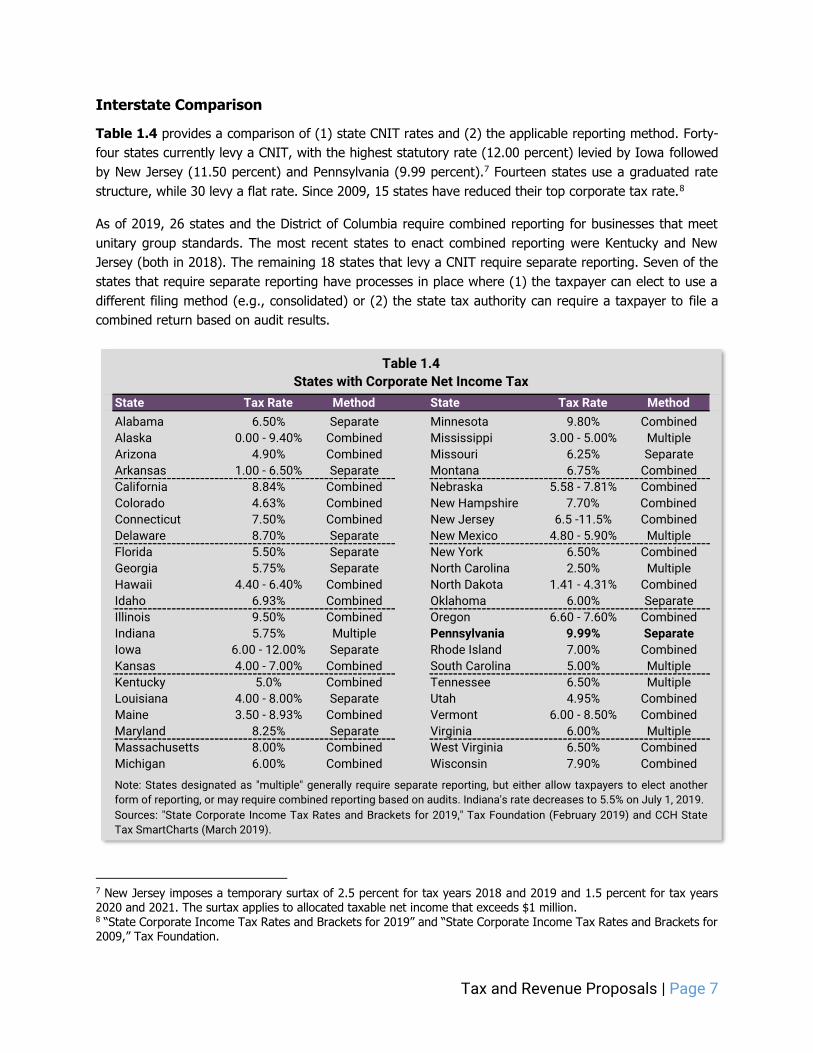
Interstate Comparison
Table 1.4 provides a comparison of (1) state CNIT rates and (2) the applicable reporting method. Forty-
four states currently levy a CNIT, with the highest statutory rate (12.00 percent) levied by Iowa followed
by New Jersey (11.50 percent) and Pennsylvania (9.99 percent).7 Fourteen states use a graduated rate
structure, while 30 levy a flat rate. Since 2009, 15 states have reduced their top corporate tax rate.8
As of 2019, 26 states and the District of Columbia require combined reporting for businesses that meet
unitary group standards. The most recent states to enact combined reporting were Kentucky and New
Jersey (both in 2018). The remaining 18 states that levy a CNIT require separate reporting. Seven of the
states that require separate reporting have processes in place where (1) the taxpayer can elect to use a
different filing method (e.g., consolidated) or (2) the state tax authority can require a taxpayer to file a
combined return based on audit results.
7 New Jersey imposes a temporary surtax of 2.5 percent for tax years 2018 and 2019 and 1.5 percent for tax years 2020 and 2021. The surtax applies to allocated taxable net income that exceeds $1 million. 8 “State Corporate Income Tax Rates and Brackets for 2019” and “State Corporate Income Tax Rates and Brackets for 2009,” Tax Foundation.
State Tax Rate Method State Tax Rate Method
Alabama 6.50% Separate Minnesota 9.80% Combined
Alaska 0.00 - 9.40% Combined Mississippi 3.00 - 5.00% Multiple
Arizona 4.90% Combined Missouri 6.25% Separate
Arkansas 1.00 - 6.50% Separate Montana 6.75% Combined
California 8.84% Combined Nebraska 5.58 - 7.81% Combined
Colorado 4.63% Combined New Hampshire 7.70% Combined
Connecticut 7.50% Combined New Jersey 6.5 -11.5% Combined
Delaware 8.70% Separate New Mexico 4.80 - 5.90% Multiple
Florida 5.50% Separate New York 6.50% Combined
Georgia 5.75% Separate North Carolina 2.50% Multiple
Hawaii 4.40 - 6.40% Combined North Dakota 1.41 - 4.31% Combined
Idaho 6.93% Combined Oklahoma 6.00% Separate
Illinois 9.50% Combined Oregon 6.60 - 7.60% Combined
Indiana 5.75% Multiple Pennsylvania 9.99% Separate
Iowa 6.00 - 12.00% Separate Rhode Island 7.00% Combined
Kansas 4.00 - 7.00% Combined South Carolina 5.00% Multiple
Kentucky 5.0% Combined Tennessee 6.50% Multiple
Louisiana 4.00 - 8.00% Separate Utah 4.95% Combined
Maine 3.50 - 8.93% Combined Vermont 6.00 - 8.50% Combined
Maryland 8.25% Separate Virginia 6.00% Multiple
Massachusetts 8.00% Combined West Virginia 6.50% Combined
Michigan 6.00% Combined Wisconsin 7.90% Combined
Table 1.4
States with Corporate Net Income Tax
Note: States designated as "multiple" generally require separate reporting, but either allow taxpayers to elect another
form of reporting, or may require combined reporting based on audits. Indiana's rate decreases to 5.5% on July 1, 2019.
Sources: "State Corporate Income Tax Rates and Brackets for 2019," Tax Foundation (February 2019) and CCH State
Tax SmartCharts (March 2019).

Tax and Revenue Proposals | Page 8
Sales and Use Tax
Transfer to Tobacco Settlement Fund
The administration’s proposal creates a sales and use tax (SUT) transfer to the Tobacco Settlement Fund
for debt service payments. This provision is expected to reduce FY 2019-20 non-motor SUT revenues by
$115 million. See Table 1.5 for this transfer and the transfer that follows.
Transfer to Commonwealth Financing Authority
The administration’s proposal increases the SUT transfer to the Commonwealth Financing Authority for
school construction (PlanCon) debt service payments. This provision is expected to reduce FY 2019-20 non-
motor SUT revenues by $20 million.
18-19 19-20 20-21 21-22 22-23 23-24
Tobacco Settlement Fund n.a. -$115 -$115 -$115 -$115 -$115
Commonwealth Financing Authority n.a. -20 -53 -57 -57 -57
Total n.a. -135 -168 -172 -172 -172
Note: Figures in dollar millions. Estimates provided by the Department of Revenue.
Table 1.5
Sales and Use Tax Transfer Detail

Tax and Revenue Proposals | Page 9
Personal Income Tax
Transfer to Environmental Stewardship Fund
The administration’s proposal creates a personal income tax (PIT) transfer to the Environmental Steward-
ship Fund for Growing Greener debt service payments. This provision is expected to reduce FY 2019-20
PIT withholding revenues by $20 million. See Table 1.6 for this transfer and all transfers that follow.
Transfer to Farm Show Lease Fund
The administration’s proposal creates a PIT transfer to the Farm Show Lease Fund for Farm Show lease
payments. This provision is expected to reduce FY 2019-20 PIT withholding revenues by $13 million.
Transfer to School Safety and Security Fund
The administration’s proposal creates a PIT transfer to the School Safety and Security Fund for grants. This
provision is expected to reduce FY 2019-20 PIT withholding revenues by $15 million.
Transfer to SERS - Defined Contribution Fund
The administration’s proposal creates a PIT transfer to the Defined Contribution Fund for costs associated
with the SERS Defined Contribution Plan. This one-time transfer is expected to reduce FY 2019-20 PIT
withholding revenues by $4 million.
Resource Enhancement Tax Credit
The administration’s proposal increases the annual cap for the Resource Enhancement Tax Credit from $10
million to $13 million, effective July 1, 2019. Beginning in FY 2019-20, the proposal would reduce General
Fund revenues by $3 million annually. See Table 1.1.
18-19 19-20 20-21 21-22 22-23 23-24
Environmental Stewardship Fund n.a. -$20 -$15 -$15 -$14 -$12
Farm Show Lease Fund n.a. -13 -13 -13 -13 -13
School Safety and Security Fund n.a. -15 -15 -15 -15 -15
SERS - Defined Contribution Fund n.a. -4 0 0 0 0
Total n.a. -52 -43 -43 -42 -40
Note: Figures in dollar millions. Estimates provided by the Department of Revenue.
Table 1.6
Personal Income Tax Transfer Detail

Tax and Revenue Proposals | Page 10
- This page intentionally left blank. -

Minimum Wage | Page 11
Raising the Minimum Wage
The administration proposes to raise the state minimum wage from the federal minimum of $7.25 to $12.00
per hour on July 1, 2019, and increase that amount by $0.50 every year until the minimum wage is $15.00
beginning on July 1, 2025. On July 1, 2026 and every year thereafter, the minimum wage would increase
by an annual cost-of-living adjustment based on the Consumer Price Index for All Urban Consumers (CPI-
U) for the Pennsylvania, New Jersey, Delaware and Maryland region. The proposal also removes the ability
of employers to count tips when calculating an employee’s hourly wage. In other words, employers must
also pay tipped employees the regular minimum wage.
The IFO has published analyses of various minimum wage proposals the past four years with the most
recent analysis released April 2018. The following bullets list major changes from last year’s analysis that
will impact the updated estimates:
The analysis uses U.S. Census data for 2018 instead of 2017. Those data show a notable drop in
the number of non-tipped Pennsylvania workers earning under $10.00 per hour (-65,000, primary
jobs only) and a large increase in workers earning $15.00 per hour or more (+150,000).9
Last year’s analysis assumed a three-year phase-in to $12.00 per hour. The current analysis as-
sumes the new wage rate of $12.00 is effective immediately on July 1, 2019.
The current analysis assumes that some of the negative employment effect manifests itself as a
reduction in hours worked, as opposed to lower employment.
Last year’s proposal did not change the hourly wage rate for tipped workers ($2.83). The current
proposal treats tipped workers the same as other workers. Due to the high degree of uncertainty
regarding the impact of raising the hourly wage for tipped workers from $2.83 to $12.00 per hour,
the analysis does not combine tipped and non-tipped workers, and a more limited analysis is per-
formed for tipped workers.
Much new research has been published in the past three years. Overall, those studies suggest that
the proposal could have a more moderate impact on employment opportunities for an increase to
$12.00 per hour, in part because new Census data show fewer workers at very low wage rates
where a higher minimum wage would have the greatest negative employment impact. However,
research is much less clear on increases above $12.00, and a recent study suggests that negative
employment effects could accelerate quickly after that level.
In previous analyses, the IFO did not attempt to account for secondary jobs that were not included
in the U.S. Census Current Population Survey dataset. This analysis imputes those missing second-
ary jobs across wage groups and other characteristics of affected workers such as gender, part- or
full-time status and marital status. This imputation adds 430,000 individuals who hold more than
one job, and the analysis assumes they are all part-time because those jobs were not identified as
a primary job. This imputation is discussed in further detail below.
9 This shift may, in part, reflect the higher wages implemented in 2018 by several large national employers including Walmart ($11.00 per hour), CVS ($11.00), Target ($12.00) and Costco ($14.00). Costco and Amazon recently an-nounced that they will increase the hourly wage to $15.00 this year.

Minimum Wage | Page 12
The Pennsylvania labor market continues to be tight, with relatively low unemployment. Barring a
recession, demographic trends (i.e., a contracting working age cohort between the ages of 20 and
64) suggest that will likely continue over the next decade. Recent studies also find that some low-
wage workers have not received wage gains that are commensurate with higher productivity due
to a labor market that is not fully competitive for low-wage workers. Under these conditions, a
higher minimum wage will cause less disruption than if there were slack in the labor market or a
perfectly competitive labor market.
The analysis begins with a comparison of state minimum wage rates and a review of recent minimum wage
studies. The analysis then examines the characteristics of lower-wage workers based on hourly wage rates,
part- or full-time status, gender, age and marital/child status. Employer characteristics are also examined
based on industry and employer size. Following these descriptive statistics, the analysis computes the
impact of the higher proposed minimum wage on employment, incomes and General Fund revenues and
expenditures. The analysis concludes with sections that examine tipped workers, the income mobility of
low-income wage earners and the proposed phased-in increase from $12.00 to $15.00 per hour.
The focus of this analysis is on the immediate movement to a $12.00 minimum wage, and it provides only
a brief discussion for the phased-in increase to $15.00 over the six years that follow. This approach is used
to keep the analysis tractable and focused on near-term outcomes. Due to the lack of research, it is also
less clear what the impact will be moving from $12.00 to $15.00 per hour. The IFO is not aware of any
current studies that examine the statewide impact of a $15.00 minimum wage. Therefore, any estimates
or projections for that portion of the proposal would be speculative.
Minimum Wage Across States
As of January 1, 2019, Pennsylvania and 20 other states do not require employers to pay a wage that
exceeds the federal minimum of $7.25 per hour. (See Table 2.1 on next page.) By contrast, 13 states and
the District of Columbia require employers to pay an hourly wage of $10.00 or more. By January 1, 2023,
11 states and the District of Columbia will require employers to pay an hourly wage of $12.00 or more
under current law.
Currently, all border states have a minimum wage that exceeds Pennsylvania by at least $1.00 per hour,
and two states (New York and Maryland) have a minimum wage that is at least $2.00 higher.10 If Pennsyl-
vania increases the minimum wage to $12.00 in 2019, it would be exceeded only by Washington D.C. and
tied with Washington, California and Massachusetts for the second highest minimum wage. If Pennsylvania
continues to increase the minimum wage to $15.00 over the subsequent six years, on January 1, 2027, it
would join six other states (Washington, California, Massachusetts, New Jersey, Illinois and Nevada) and
Washington D.C. with a minimum wage that meets or exceeds $15.00.
10 As of July 1, 2019, New Jersey will also exceed Pennsylvania’s minimum wage by more than $2.00, as the state minimum wage will increase to $10.00 per hour.

Minimum Wage | Page 13
2019 Rank 2019 2020 2021 2022 2023
Washington D.C.1 1 $13.25 $14.00 $15.00 $15.38 $15.73
Washington1 2 12.00 13.50 13.84 14.19 14.52
California1,2 2 12.00 13.00 14.00 15.00 15.35
Massachusetts 2 12.00 12.75 13.50 14.25 15.00
Colorado1 5 11.10 12.00 12.30 12.61 12.90
New York1 5 11.10 11.80 12.50 12.81 13.11
Arizona1 7 11.00 12.00 12.30 12.61 12.90
Maine1 7 11.00 12.00 12.30 12.61 12.90
Vermont1 9 10.77 10.98 11.26 11.54 11.81
Oregon 10 10.75 11.25 12.00 12.75 13.50
Rhode Island 11 10.50 10.50 10.50 10.50 10.50
Connecticut 12 10.10 10.10 10.10 10.10 10.10
Hawaii 12 10.10 10.10 10.10 10.10 10.10
Maryland 12 10.10 10.10 10.10 10.10 10.10
Alaska1 15 9.89 10.08 10.34 10.60 10.84
Minnesota1 16 9.86 10.05 10.31 10.57 10.81
Arkansas 17 9.25 10.00 11.00 11.00 11.00
Michigan 17 9.25 9.65 9.87 10.10 10.33
South Dakota1 19 9.10 9.28 9.51 9.75 9.98
Nebraska 20 9.00 9.00 9.00 9.00 9.00
New Jersey 21 8.85 11.00 12.00 13.00 14.00
Delaware 22 8.75 9.25 9.25 9.25 9.25
West Virginia 22 8.75 8.75 8.75 8.75 8.75
Missouri 24 8.60 9.45 10.30 11.15 12.00
Ohio1 25 8.55 8.72 8.94 9.16 9.37
Montana1 26 8.50 8.67 8.89 9.11 9.32
Florida1 27 8.46 8.63 8.84 9.07 9.28
Illinois 28 8.25 9.25 11.00 12.00 13.00
Nevada1 28 8.25 8.41 8.63 8.84 9.05
New Mexico 30 7.50 7.50 7.50 7.50 7.50
Pennsylvania 31 7.25 7.25 7.25 7.25 7.25
Other 31 7.25 7.25 7.25 7.25 7.25
Note: Over 50 localities have adopted a minimum wage above their state's minimum wage.
2 The minimum wage in 2019 is $11/hour for employers with <26 employees and $12/hour for all others.
Source: The Economic Policy Institute. Minimum Wage Tracker (as of March 1, 2019).
Table 2.1
Minimum Wage Rates by State (as of January 1st)
1 All inflation adjustments in this table use IHS Markit's U.S. CPI-U year-over-year growth rate to estimate
inflation adjustments for future years.

Minimum Wage | Page 14
Recent Minimum Wage Studies
The text that follows provides the main findings and results from prominent minimum wage studies that
have been published recently. The studies appear in chronological order. In order to interpret the results,
it is necessary to define the term “employment elasticity.” The employment elasticity is the percentage
change in employment divided by the percentage change in the minimum wage. For example, an elasticity
of -0.1 implies that a 10.0 percent increase in the minimum wage would reduce employment by 1.0 percent
(-1.0 / 10.0).
Congressional Budget Office (2014)11
Based on a review of a large body of research, the CBO determined an employment elasticity for teenagers
from raising the federal minimum wage from $7.25 to $10.10. That parameter ranged from -0.2 to a small
negative, with a central estimate of -0.1. The CBO then modified that estimate to (1) apply only to teen-
agers directly affected by a higher minimum wage (as opposed to all teenagers) and (2) take into account
the actual wage distribution of those workers (as opposed to only the statutory minimum wage). The
adjusted elasticity was higher at -0.45, but applied to a smaller group. For adult workers directly affected
by the higher minimum wage, CBO used an elasticity that was one-third as large (-0.15). The CBO found
that an increase in the federal minimum wage from $7.25 to $10.10 (39 percent) would reduce employment
for all directly-affected workers by 2.9 percent (-500,000), and yield higher incomes for workers who retain
employment (16.5 million). Workers slightly above the minimum wage would also receive a modest pay
increase.
Neumark (2015)12
Based on a review of existing studies, this research note from the Federal Reserve Board of San Francisco
finds that “the overall body of recent evidence suggests that the most credible conclusion is a higher
minimum wage results in some job loss for the least-skilled workers — with possibly larger adverse effects
than earlier research suggested.” Neumark notes that “(a)mong the studies that find job loss effects, esti-
mated employment elasticities of -0.1 to -0.2 are at the lower range but are more defensible than the
estimates of no employment effects (p. 4).”
Dube et al. (2015)13
The authors use U.S. data for teens and restaurant workers from the Quarterly Workforce Indicators data-
base and focus on the period from 2000 to 2011. The paper exploits differences between border counties
in states that did and did not raise their minimum wage. The authors “find striking evidence that separa-
tions, hires, and turnover rates for teens and restaurant workers fall substantially following a minimum
wage increase — with most of the reductions coming within the first three quarters of the higher minimum
(p. 2).” For both teens and restaurant workers, the authors could not identify a statistically significant
negative effect on employment from a higher minimum wage.
11 “The Effects of a Minimum Wage Increase on Employment and Family Income,” Congressional Budget Office (Feb-ruary 2014). 12 “The Effects of Minimum Wage on Employment,” FRBSF Economic Letter 2015-37 (December 2015). 13 Dube et al. “Minimum Wage Shocks, Employment Flows and Labor Market Frictions,” Journal of Labor Economics, 34(3) (2016).

Minimum Wage | Page 15
Institute for Research on Labor and Employment (2015)14
The authors examine recent studies and find general agreement on an employment elasticity for restaurant
workers that ranges from -0.06 to 0.04, with consensus towards a small, negative value. However, they
find substantial disagreement for teen employment. The authors make allowance for certain state-specific
trends and find a negative bias in traditional minimum wage studies. The authors find that correction of
that bias implies teen employment elasticities that are not significantly different than zero (i.e., no impact
from a higher minimum wage).
Wolfson and Belman (2016)15
The authors perform a meta-analysis of 37 credible studies published from 2002 to 2015 on the impact of
minimum wage on employment levels. They find that recent research has reduced the consensus estimate
range of employment elasticities from -0.3 to -0.1 down to -0.12 to -0.05. For teens and restaurant workers,
the estimates range from -0.11 to -0.08.
Upjohn Institute (2016)16
This study finds that the pass-through effect on prices from higher minimum wages is entirely concentrated
in the month the new minimum wage becomes effective, and the impact on prices is smaller than estimated
by existing research. While previous research had found that the entire cost was passed forward to con-
sumers via higher prices, this study estimates that consumers bear roughly one-half of the cost from higher
minimum wages. The authors also note that “large minimum wage hikes have clear positive effects on
output prices (p. 35)” and the effects of a change in a federal, state or city minimum wage will differ.
Finally, the authors find much stronger price effects from large “one shot” increases in the minimum wage
versus a phased-in approach because “more predictable changes may allow business to better prepare for
and take account of increases in labor costs” and “more moderate changes… could also allow firms to more
easily absorb the increase in costs (p. 33).” Consistent with prior research, the study notes that two mod-
erate minimum wage changes are not the same as a single large one, and moderation regarding the phase-
in could temper the pass-through effect to consumer prices.
University of Washington I (2016)17
The first of three studies that examine the impact of raising the minimum wage in Seattle. The report
analyzes the increase from $9.47 to $11.00 per hour for most employers.18 The study finds that low-wage
workers’ median wage increased by $1.18, and that $0.73 was due to the higher minimum wage and $0.45
was due to favorable economic conditions. The 16.2 percent increase in the statutory minimum wage (or
14 Allegretto et al. “Credible Research Designs for Minimum Wage Studies: A Response to Neumark, Salas and Wascher,” University of California Berkeley, IRLE Working Paper No. 116-15 (September 2015). 15 Wolfson, Paul and D. Belman. “15 Years of Research on U.S. Employment and the Minimum Wage,” Dartmouth College and Michigan State University (December 2016). 16 MacDonald, D. and E. Nilsson. “The Effects of Increasing the Minimum Wage on Prices: Analyzing the Incidence of Policy Design and Context,” Upjohn Institute for Employment Research, Upjohn Institute Working Paper 16-260 (2016). 17 The Seattle Minimum Wage Study Team. “Report on the Impact of Seattle’s Minimum Wage Ordinance and Wages, Workers, Jobs and Establishments Through 2015,” University of Washington (July 2016). 18 For employers with less than 500 employees who offer health insurance or the employees earn tips, the minimum wage increased to $10.00 per hour.

Minimum Wage | Page 16
10.3 percent increase in the median affected wage of $9.97) resulted in a 1.2 percent reduction in employ-
ment, and a modest reduction in hours worked per quarter. (Note: the results apply to all affected workers,
not just teens or restaurant workers.) The strength of this study is that it utilizes detailed administrative
data that tracked actual wages, hours worked and outcomes for individual workers affected across all age
groups and industries. However, the analysis only includes single location establishments and excludes
multi-location establishments because it was not possible to determine the exact location of workers for
multi-location firms (i.e., it was not clear if the workers were employed within the city limits). Those firms
employed roughly 40 percent of the workforce in Seattle.
Center on Wage and Employment Dynamics (2017)19
This study also examines the increase in the Seattle minimum wage to $11.00 per hour, but uses the
Quarterly Census of Employment and Wages (QCEW) dataset and only examines the food service/restau-
rant industry because it employs a high proportion of low-wage workers and the aggregated data cannot
separately identify workers directly affected by a higher minimum wage. For all types of restaurants, the
analysis finds employment elasticities that are not significantly different than zero (i.e., the higher minimum
wage had no discernable impact on employment). The authors note several reasons for that outcome: (1)
the labor market is not perfectly competitive (i.e., firms have wage-setting power), (2) higher wages in-
crease productivity, (3) it is difficult to replace labor in low-paid service occupations, (4) affected workers
comprised a relatively small portion of total employer costs and (5) lower-wage workers spend all extra
income, thereby increasing overall demand.
University of Washington II (2017/2018)20
The second (revised) study on the Seattle minimum wage examines raising the level from $11.00 to $13.00
per hour for certain employers. The authors find much larger negative employment effects from the second
minimum wage hike and note that the effects appear to be non-linear: negative employment impacts
become progressively stronger as the minimum wage increases. Similar to the first study, administrative
data allow the authors to identify actual wages earned, hours worked and industry of employment, but the
study excludes roughly 37 percent of workers employed by multi-location firms. The authors find that
traditional employment elasticities are substantially understated, largely because previous studies based
the percentage increase in the wage rate on the statutory floor (e.g., $7.25 for Pennsylvania) due to lack
of specific data, versus what employees actually earned. The authors believe that the relatively high level
of the minimum wage in Seattle, the smaller locality (i.e., a city and not a state) and inclusion of non-
restaurant employees in the dataset also contributed to the much higher negative employment response.
The authors conclude that the movement to a $13.00 minimum wage yielded lower incomes of $74 per
month for the average low-wage worker (reflects lower employment and reduced hours). It should be
noted that some researchers strongly disagree with these findings and believe methodological issues drive
much of the result.
19 Reich et al. “Seattle’s Minimum Wage Experience 2015-16,” Institute for Research on Labor and Employment, Center on Wage and Employment Dynamics, University of California, Berkeley (June 2017). 20 Jardim et al. “Minimum Wage Increases, Wages and Low-Wage Employment: Evidence from Seattle,” NBER Working Paper 23532 (May 2018).

Minimum Wage | Page 17
Economic Policy Institute (2017)21
This paper was released in response to the second University of Washington study (originally released June
2017). The authors raise concerns about the validity of the strong, negative employment response found
in the second study because (1) the results were very different than existing research, (2) it found effects
on high wage workers where there should be none, and (3) the study omits 37 percent of the Seattle
workforce employed by larger multi-location firms.
University of Washington III (2018)22
The latest research from the Seattle Minimum Wage Study Team examines the minimum wage increase
from $9.47 to $11.00 to $13.00 and follows workers based on their level of work experience. The analysis
focuses on the impact of the wage increase from $11.00 to $13.00 for the first three quarters of 2016.
Across all workers, the study finds that average hours worked declined by one-half to one hour per week
and average pre-tax income increased by $8 to $12 per week. For more experienced workers that retained
employment, the reduction in average hours worked was more modest and pre-tax income gains were
roughly $19 per week. For inexperienced workers, the reduction in hours worked offset the increase in the
hourly wage rate, yielding negligible income gains. The authors also find a relative and absolute reduction
in the flow of new employees into Seattle’s low-wage labor market. The authors believe this factor moti-
vated their findings in previous research of an overall net negative impact on workers from the increase in
the minimum wage to $13.00. Essentially, the inflow of new (inexperienced) minimum wage workers was
considerably lower than the counterfactual level that should have been realized, as suggested by a control
group. The authors note that the higher minimum wage appears to have successfully raised incomes for
experienced workers but at the expense of the ability of new workers to enter the market (e.g., high school
and college students). Finally, the paper finds an eight percent reduction in labor turnover rates for all
employees, regardless of experience, due to the higher minimum wage.
Cengiz et al. (2019)23
The authors employ a new methodology to examine 138 state-level minimum wage changes from 1979 to
2016 where the mean real increase in the minimum wage was 10.1 percent. The dataset used is the same
used for this analysis: the Merged Outgoing Rotation Group dataset from the U.S. Census Bureau’s Current
Population Survey. The authors discuss three main results. First, higher minimum wages do not appear to
impact employment, assuming that the ratio of the new minimum wage to the state median wage does not
exceed 55 percent. (Discussed further below.) The study found that job gains at or slightly above the new
minimum wage closely matched those lost that were below the new minimum wage. Second, impacts
varied across sectors: employment in the manufacturing and retail/wholesale trade sectors could be ad-
versely impacted, while workers in other sectors are largely unaffected. Third, positive wage “spillovers”
extend up to $3 above the new minimum wage and can account for up to 40 percent of the overall income
gains from a higher minimum wage.
21 Zipperer, Ben and J. Schmidt. “The ‘high road’ Seattle labor market and the effects of the minimum wage increase,” Economic Policy Institute (June 2017). 22 Jardim et al. “Minimum Wage Increases and Individual Employment Trajectories,” NBER Working Paper 25182 (Oc-tober 2018). 23 Cengiz et al. “The Effect of Minimum Wages on Low-Wage Jobs: Evidence from the United States Using a Bunching Estimator,” NBER Working Paper 25434 (January 2019).

Minimum Wage | Page 18
Take-Aways from Recent Studies and Events
Based on recent studies, the following points of emphasis are relevant for this updated analysis:
Moderate increases in the minimum wage likely have a modest negative impact on employment
levels. However, it is unclear how to define a “moderate increase.” Nearly all research on the
minimum wage examine values of the Kaitz index that do not exceed 55 percent, or real minimum
wage increases that average roughly 10 percent. The Kaitz index is the ratio of the new minimum
wage to the state median wage. The higher the ratio, the greater impact the new wage rate will
have on the overall wage distribution, and hence employment. Based on the data used for this
analysis, the IFO computed a median wage rate for all Pennsylvania workers of $19.70 (full- and
part-time, all non-tipped workers). Therefore, the Kaitz index would equal $12.00 / $19.70, or 60.9
percent, which is just outside the range of most studies.24 However, it is also the case that very
few workers actually earn the statutory minimum wage ($7.25): the median (average) wage for
non-tipped workers earning less than $12.00 per hour was $10.00 ($9.73), and the increase to
$12.00 is 20.0 percent (23.3 percent), as opposed to the 65.5 percent relative to $7.25 per hour.
For Pennsylvania, the statutory minimum wage is not “binding” because so few employers pay that
wage. Therefore, one may presume that consensus elasticity estimates are generally relevant for
Pennsylvania, but the employment response for an increase to $12.00 per hour would be on the
high end of the plausible range of estimates.
More moderate effects could be expected if a higher wage rate is phased-in. Research finds a
greater impact on prices and employment from large “one shot” increases compared to smaller,
phased-in changes.
Similar to other states and cities, the Pennsylvania labor market for low-wage workers is not per-
fectly competitive. If the labor market were perfectly competitive, workers would realize wage
gains from higher productivity and a higher minimum wage would largely be passed forward to
consumers through higher prices. However, research suggests that firms have some degree of
wage-setting power for low-wage labor. If that holds, then a higher minimum wage will, to some
extent, reduce business profits rather than increase prices. It would also serve to moderate any
negative employment response.
Other factors that benefit employers should be included in an analysis. Recent studies generally
confirm established research that finds higher minimum wages increase employee productivity and
reduce turnover. Both factors should produce employer cost savings.
24 Some researchers use full-time jobs only, in which case the median wage for Pennsylvania is $21.15 and the Kaitz index is 56.7 percent. An alternative data source is the U.S. Bureau of Labor Statistics’ Occupational Employment Statistics, which has a median wage of $18.12 for all Pennsylvania payroll workers, including part- and full-time and tipped workers (tips are included with wages). See https://www.bls.gov/oes/current/oes_pa.htm#00-0000.

Minimum Wage | Page 19
Pennsylvania does not resemble Seattle, or other large cities, that have recently enacted large
minimum wage increases. The Seattle labor market grew very rapidly during the phase-in to the
$13.00 minimum wage, and that impact is difficult to separate from the impact of a higher minimum
wage. Moreover, a much larger geographic region (such as a state) should generally be less sen-
sitive to wage changes. However, rural areas and small employers will be more sensitive to higher
wages. The IFO expects that rural areas would experience stronger negative employment effects
than urban areas due to a higher Kaitz index and a lower cost of living.25
A handful of large, national firms have recently increased wages for low-wage workers. These
national employers include Walmart, CVS, Costco, Amazon and Target. The most recent state data
for 2018 may already reflect these changes as it shows a material decline in workers earning less
than $10.00 per hour. A similar shift might also occur for 2019 if the significant wage hikes at those
(and other) firms are not fully reflected in the 2018 data. As noted, low-wage workers are dispro-
portionately affected by higher minimum wages compared to workers who earn a wage closer to
the new minimum.
The subsections that follow utilize U.S. Census data to project the impact from the proposed $12.00 mini-
mum wage on Pennsylvania workers, businesses, General Fund revenues and expenditures. The final sub-
sections consider the implications for tipped workers and the six-year phase-in to a $15.00 minimum wage.
Workers Affected by a $12 per Hour Minimum Wage
This analysis uses data from the Merged Outgoing Rotation Group dataset from the 2018 Current Population
Survey (CPS).26 The CPS provides data on the labor force, employment levels, unemployment rates and
various demographic characteristics. The monthly survey includes 60,000 U.S. households and is designed
so that state specific observations can be weighted to yield population totals for individual states.
The CPS asks respondents to report their hourly wage or weekly salary, occupation, number of hours
worked per week, age, gender and other demographic information. Many hourly‐paid workers report com-
pensation that falls below the federal minimum and most are employees who traditionally earn tips, such
as food servers and bartenders. Employers may pay less than the federal minimum if a tipped worker earns
at least $30 per month in tips or commissions and total compensation yields an hourly wage rate of $7.25
or more. For Pennsylvania, such employees can be paid a wage as low as $2.83 per hour.
For 2018, the CPS dataset for Pennsylvania represents 5.58 million workers: 3.43 million reported an hourly
wage, and 2.15 million were salaried workers.27 The majority of workers affected by an increase in the
minimum wage are hourly-paid workers. However, the analysis includes certain salaried workers if their
computed hourly wage was less than $12.00 per hour.28 The data also contain 37,800 workers who reported
25 It is likely that rural employers are generally smaller than suburban and urban employers. Those smaller rural employers also likely have a lower wage distribution for their employees due to the lower cost of living. Hence, a given dollar increase in the mandatory minimum wage will have stronger implications for rural workers and employers. 26 The Current Population Survey is a survey sponsored jointly by the U.S. Census Bureau and the U.S. Bureau of Labor Statistics. 27 Excludes self-employed individuals and workers who were not paid for their labor. 28 Following the convention used by the U.S. Congressional Budget Office (CBO), the analysis includes salaried workers who earn an effective hourly wage that is below the proposed $12.00 minimum wage. For respondents who reported weekly earnings instead of an hourly wage, an effective hourly wage was computed as their reported usual earnings

Minimum Wage | Page 20
a wage less than $7.25 per hour and were employed in occupations that typically receive tips.29 The impact
of the higher minimum wage on those workers is discussed in a later subsection.
The CPS data only reflect primary jobs, and the data do not include secondary jobs. Hence, the dataset
excludes a significant number of part-time jobs, and many would represent tipped workers employed in
the food service sector and non-tipped workers in the retail sector. Other employment data from the Bureau
of Labor Statistics include all payroll jobs, but do not include specific detail such as wage rates, hours
worked, age and gender.30 The more complete dataset suggests that the CPS dataset understates second-
ary jobs by roughly 430,000. For this analysis, those missing jobs are imputed and merged with data on
primary jobs, and they appear in all tabulations in this section.
In order to impute secondary jobs to specific sectors and various worker characteristics (e.g., age and
gender), the analysis reconciles the discrepancies between the two data sources and uses data from the
CPS for part-time workers only. The analysis assumes that all secondary jobs are part-time. A comparison
of the two data sources suggests that the majority of missing part-time jobs reside in the food service,
retail, healthcare and administrative sectors. The analysis imputes jobs to those sectors and assumes that
100,000 of the jobs are tipped workers in the food service sector. It is noted that there is uncertainty
regarding that figure: although a reconciliation of the two datasets suggests the sectors that have missing
workers, the comparison cannot distinguish between tipped and non-tipped workers. For other character-
istics of non-tipped secondary jobs, the analysis assumes that the imputed jobs have characteristics similar
to primary part-time jobs. For example, the analysis assumes those secondary part-time jobs have a similar
wage distribution as primary part-time jobs. The same assumption holds for other characteristics such as
age and gender.
Table 2.2 provides a breakdown based on wage level for primary and secondary jobs for all non-tipped
workers. For 2018, the analysis contains 5.39 million primary jobs and 330,000 secondary jobs. For primary
jobs, 928,000 were part-time (less than 35 hours per week) and 4.46 million were full-time. However, for
“directly affected” workers who earn less than $12.00 per hour, half of the primary jobs were part-time,
and 56.6 percent were female workers. As noted, the analysis assumes that all secondary jobs are part-
time, and they are distributed among wage groups and genders in a pattern that is similar to all primary
part-time jobs.
For both categories, the analysis finds that 1.11 million non-tipped workers would be impacted by a $12.00
minimum wage (directly affected) and another 827,000 workers earning between $12.00 to $14.99 would
likely also be affected due to wage compression or spillovers (indirectly affected).
per week divided by their reported usual hours worked per week. See “The Effects of a Minimum Wage Increase on Employment and Family Income,” CBO (February 2014). 29 This figure is lower than a recent report issued by the Pennsylvania Department of Labor and Industry because the IFO analysis assumes that workers who reported a wage of $7.00 to $7.24 per hour misreported their wage and actually received the federal minimum. The approach follows the convention used by the CBO study. The adjustment applied to 8,800 workers, and the great majority were employed in occupations that did not receive tips. The analysis also corrected obvious errors in reported hourly wages, such as wage rates that were less than $1.00 per hour. For those cases, other reported data or an industry-wide average for the occupation were used to determine an hourly wage rate. See “Analysis of the Pennsylvania Minimum Wage,” Pennsylvania Department of Labor and Industry (March 2019). 30 This dataset is the state-level Current Employment Statistics published each month by the U.S. Bureau of Labor Statistics.

Minimum Wage | Page 21
Table 2.3 provides similar breakdowns based on age and marital/child status. The data show that 179,000
(3 percent) primary jobs were held by workers between the ages of 16 and 19 and 87 percent earned a
wage under $12.00 per hour. College age workers (20 to 24) comprised 494,000 primary jobs, and 39
percent earned less than $12.00 per hour. For workers age 40 and older, most primary jobs (76 percent)
earned $15.00 or more per hour.
The columns to the right provide detail on marital and child status. For primary jobs, roughly 60 percent of
workers directly affected by a $12.00 minimum wage are single with no children. An additional 15 percent
are married with no children.
Primary Jobs Part-Time Full-Time Male Female Total
$7.25 to $7.99 66 26 41 50 91
$8.00 to $9.99 176 137 144 170 314
$10.00 to $10.99 143 170 136 177 313
$11.00 to $11.99 88 137 88 136 224
$12.00 to $14.99 151 621 354 419 773
$15.00 or more 304 3,368 2,034 1,638 3,672
Total 928 4,459 2,797 2,590 5,387
Secondary Jobs Part-Time Full-Time Male Female Total
$7.25 to $7.99 23 0 10 14 23
$8.00 to $9.99 63 0 25 38 63
$10.00 to $10.99 51 0 21 29 51
$11.00 to $11.99 31 0 12 20 31
$12.00 to $14.99 54 0 18 36 54
$15.00 or more 108 0 28 80 108
Total 330 0 114 216 330
Directly Affected 641 470 477 634 1,110
Indirectly Affected 205 621 372 455 827
Source: U.S. Census Bureau, Current Population Survey and Merged Outgoing Rotation Group dataset (2018)
compiled by the National Bureau of Economic Research.
Table 2.2
Workers Affected by a $12 Minimum Wage for 2018
Employment Status (000s) Employee Gender (000s)
Employment Status (000s) Employee Gender (000s)
Note: Data do not include tipped workers. Indirectly affected workers earn $12.00 to $14.99 per hour.

Minimum Wage | Page 22
Businesses Affected by a $12 per Hour Minimum Wage
Table 2.4 displays the industries affected by a $12.00 minimum wage. The column labeled “Affected
Workers” is an estimate of the total number of non-tipped workers who earned less than $12.00 per hour
in 2018. As discussed in the previous subsection, this table assumes that secondary part-time jobs are
distributed across the retail, food service, administrative and healthcare sectors. The analysis estimates
that nearly one-third (348,000) of the total affected jobs reside in retail-wholesale trade sector. Other
sectors with a substantial number of affected workers include the healthcare and social assistance (186,000
jobs) sector and the accommodation-food service (165,000 jobs) subsector (included with leisure-hospital-
ity).
Primary Jobs 16-19 20-24 25-39 40+
Single
no kids
Single
kids
Married
no kids
Married
kids
$7.25 to $7.99 33 22 15 21 70 3 10 9
$8.00 to $9.99 77 70 69 97 208 25 37 44
$10.00 to $10.99 33 72 89 120 183 30 53 47
$11.00 to $11.99 12 28 74 110 105 23 54 42
$12.00 to $14.99 20 112 270 371 353 81 183 156
$15.00 or more 5 189 1,210 2,268 1,257 230 1,156 1,030
Total 179 494 1,727 2,987 2,176 391 1,493 1,327
Secondary Jobs 16-19 20-24 25-39 40+Single
no kids
Single
kids
Married
no kids
Married
kids
$7.25 to $7.99 12 5 1 5 21 0 1 1
$8.00 to $9.99 22 15 9 17 48 4 6 5
$10.00 to $10.99 8 13 8 22 32 3 10 6
$11.00 to $11.99 3 4 9 15 15 3 9 4
$12.00 to $14.99 4 10 14 26 26 6 14 9
$15.00 or more 0 6 29 73 32 7 37 32
Total 49 53 70 158 174 23 76 57
Directly Affected 200 229 274 407 682 91 180 158
Indirectly Affected 24 122 284 397 379 87 197 165
Workers Affected by a $12 Minimum Wage for 2018
Table 2.3
Source: U.S. Census Bureau, Current Population Survey and Merged Outgoing Rotation Group dataset (2018)
compiled by the National Bureau of Economic Research.
Note: Data do not include tipped workers. Indirectly affected workers earn $12.00 to $14.99 per hour.
Age (000s)
Age (000s)
Type of Household (000s)
Type of Household (000s)

Minimum Wage | Page 23
The last three columns distribute workers earning under $12.00 per hour based on the size of the employer,
as measured by the total number of employees. The affected workers are distributed based on the total
number of employees in Pennsylvania firms with less than 50 employees, 50 to 499 employees and 500 or
more employees by industry using data from the U.S. Census Bureau’s County Business Patterns 2016. For
example, if those data show that one half of all employees (regardless of wage rate) in the leisure-hospi-
tality sector worked for a firm with less than 50 employees, then Table 2.4 assumes the same distribution
for workers earning under $12.00 per hour. It is noted that the true distribution could deviate from this
assumption. Overall, it is likely that this methodology could understate the share of workers earning under
$12.00 per hour employed by small firms.31 However, more detailed data are not available to inform the
distribution of low-wage workers based on employer size.
Employment Impact from a $12 per Hour Minimum Wage
Table 2.5 displays the projected employment impact due to the enactment of a $12.00 minimum wage.
The data are for 2018, and the analysis did not attempt to project those data forward to July 1, 2019. The
top third of the table shows the average wage by wage group and part/full-time status, and the percentage
change if the minimum wage increases to $12.00 per hour. For the lowest paid workers, the proposal
increases the hourly wage by nearly two-thirds. For the highest paid workers affected, the increase is
roughly seven percent. While not directly affected by the proposal, the analysis assumes that workers
earning $12.00 to $14.99 per hour would also realize a modest wage increase of four percent.
31 The overall wage distribution for smaller firms is likely lower compared to larger firms in the same industry. As noted previously, smaller firms are more likely to be rural employers that pay a lower wage due to a lower cost of living.
Affected
Industry Workers (000s) <50 50 to 499 500+
Leisure-hospitality 199 112 71 14
Retail-wholesale trade 348 175 165 8
Healthcare and social assistance 186 57 70 58
Manufacturing 51 12 28 11
Construction 18 10 6 2
Admin. support and waste management 67 19 31 18
Transportation and warehousing 25 7 11 7
Professional and scientific 15 7 5 2
Educational services 61 8 12 41
Personal and other services 58 46 11 1
All other 82 36 27 20
Total 1,110 489 437 182
Table 2.4
Industry and Firm Size Impacted by a $12 Minimum Wage for 2018
Source: U.S. Census Bureau, County Business Patterns, Current Population Survey and Merged Outgoing
Rotation Group dataset (2018) compiled by the National Bureau of Economic Research.
Number of Employees in Firm (000s)

Minimum Wage | Page 24
The middle portion of the table displays the number of workers and the employment response parameters,
based on a review of minimum wage studies. For very low-wage workers who are mostly high school and
college age, the analysis assumes an elasticity of -0.2, which implies a 2.0 percent employment reduction
for a 10.0 percent increase in the (average) wage paid for that group. Research finds that employment of
this age cohort is more sensitive to wage changes because they are part-time, are less experienced and
have a high degree of turnover. Moreover, the percentage increase in the wage is very large for this group,
and employers would be especially sensitive to their employment compared to other groups under a $12.00
minimum.
The analysis assumes that the elasticities (1) are slightly higher for part-time workers and (2) would decline
for each group as the percentage increase in the wage paid declines. The projected employment impact is
then equal to: number employed * percent change in wage * responsiveness parameter or elasticity. The
analysis finds a reduction in part-time jobs of 26,000 (4.0 percent of directly affected part-time workers)
and 8,000 for full-time jobs (1.8 percent), and an overall reduction of 34,000 (3.1 percent). The proposal
Part-Time Full-Time Part-Time Full-Time
$7.25 to $7.99 $7.35 $7.49 63.3% 60.2%
$8.00 to $9.99 8.68 9.03 38.2% 32.9%
$10.00 to $10.99 10.15 10.22 18.2% 17.4%
$11.00 to $11.99 11.20 11.25 7.1% 6.7%
$12.00 to $14.99 12.93 13.29 4.0% 4.0%
Part-Time Full-Time Part-Time Full-Time
$7.25 to $7.99 89 26 -0.200 -0.150
$8.00 to $9.99 239 137 -0.125 -0.100
$10.00 to $10.99 194 170 -0.075 -0.050
$11.00 to $11.99 119 137 -0.025 -0.025
$12.00 to $14.99 205 621 0.000 0.000
TOTAL 846 1,091
Part-Time Full-Time Part-Time Full-Time
$7.25 to $7.99 -11 -2 78 24
$8.00 to $9.99 -11 -5 228 132
$10.00 to $10.99 -3 -1 191 169
$11.00 to $11.99 0 0 119 137
$12.00 to $14.99 0 0 205 621
TOTAL -26 -8 820 1,083
Table 2.5
Employment Impact: $12 Minimum Wage in 2018
Source: U.S. Census Bureau, Current Population Survey and Merged Outgoing Rotation Group dataset (2018)
compiled by the National Bureau of Economic Research.
Average Wage
Number of Workers (000s)
Projected Reduction (000s)
Percent Change to $12
Response Parameter
Retain Employment (000s)

Minimum Wage | Page 25
disproportionately affects part-time jobs because they comprise a greater share of low-wage workers. The
analysis also assumes a reduction in total hours worked (discussed below), which was not included in last
year’s analysis. Recent studies find that some of the negative employment impact would manifest itself in
shorter workweeks, as opposed to fewer jobs. This effect is included in the computation of the income
gains in the subsection that follows. The net impact on labor is the same as reduced employment levels,
but the manifestation is different.
It is noted that the projected employment contraction would not all occur at the same time and in the same
manner. While some part-time workers might be released, other firms may simply defer filling vacant
positions over an extended period of time. Research finds that new entrants to the labor market will be
affected more than current employees.
Income Effects for Affected Workers
Table 2.6 provides the analysis for the projected impact on income levels from the higher minimum wage
for affected workers. The top portion of the table displays the current wage distribution, number of workers
and total income of those workers. For the income computations, the analysis assumes that part-time
employees work 20 hours per week for 50 weeks per year while full-time employees work 40 hours per
week for 50 weeks per year. Total wage income for all workers shown is $34.6 billion.
The middle portion of the table adjusts the minimum wage to $12.00 per hour and includes the projected
employment contraction from Table 2.5. Based on recent studies, the computations also assume that work-
ers who previously earned less than $11.00 per hour would work roughly six to seven hours less per quarter
(0.5 hours per week). As noted, the analysis also assumes a four percent wage increase for workers earning
between $12.00 to $14.99 per hour. Total wage income increases to $38.1 billion.
The bottom portion of the table displays the differential. Total wage income increases by $3.5 billion. If
mandatory federal payroll tax is deducted (7.65 percent, employee share only), the increase declines to
$3.2 billion. The bottom of the table shows an average annual net income gain of $1,856 for part-time
workers ($38 per week) and $3,306 for full-time workers ($64 per week). (Note: these figures are for
directly-affected workers only. They do not include the modest gains for indirectly-affected workers.)
It is noted that the presentation in Table 2.6 is an oversimplification because it assumes that all workers
under $12.00 per hour would receive exactly $12.00 per hour under the proposal. In practice, while there
would be some “wage compression” due to the higher minimum wage, employers would likely attempt to
maintain some of the wage differentials that were effective prior to the higher minimum wage. Therefore,
the estimates in Table 2.6 could be viewed as a lower bound. However, to the extent those wages are
raised above $12.00 per hour, it would also imply a larger negative employment response.

Minimum Wage | Page 26
General Price Impact
The analysis projects that the net wage income of low-wage workers will increase by $3.5 billion under the
proposal. A pertinent question is the source of that extra income and how it will impact consumers and
businesses. Potential sources include higher consumer prices, lower business profits, reduced employee
benefits and business savings due to reduced employee turnover and higher employee productivity.32 As
discussed further in the subsection that follows, the analysis assumes that 65 percent of the higher wages
is passed forward to consumers through higher prices, or $2.3 billion of wage costs ($3.5 billion * 0.65).
32 The higher productivity would arise from the retention of more productive workers, the implementation of cost cutting and efficiency measures and greater job satisfaction of workers who retain employment.
Part-Time Full-Time Total Part-Time Full-Time Total
Current Minimum Wage
$7.25 to $7.99 89 26 115 $654 $389 $1,044
$8.00 to $9.99 239 137 376 2,075 2,474 4,549
$10.00 to $10.99 194 170 364 1,969 3,475 5,444
$11.00 to $11.99 119 137 256 1,333 3,083 4,415
$12.00 to $14.99 205 621 826 2,651 16,506 19,157
Total 846 1,091 1,937 8,681 25,927 34,608
$12.00 Minimum Wage
$7.25 to $7.99 78 24 101 896 556 1,452
$8.00 to $9.99 228 132 360 2,649 3,132 5,781
$10.00 to $10.99 191 169 360 2,250 4,004 6,254
$11.00 to $11.99 119 137 256 1,425 3,283 4,708
$12.00 to $14.99 205 621 826 2,757 17,166 19,923
Total 820 1,083 1,903 9,977 28,141 38,118
Change Based on Current Wage Levels
$7.25 to $7.99 -11 -2 -14 241 167 408
$8.00 to $9.99 -11 -5 -16 574 658 1,232
$10.00 to $10.99 -3 -1 -4 281 529 810
$11.00 to $11.99 0 0 0 93 200 293
$12.00 to $14.99 0 0 0 106 660 766
Total -26 -8 -34 1,296 2,214 3,510
Average Gain - Directly Affected Workers (in dollars) 1,856 3,306 2,470
Table 2.6
Income Impact: $12 Minimum Wage in 2018
Source: U.S. Census Bureau, Current Population Survey and Merged Outgoing Rotation Group dataset (2018)
compiled by the National Bureau of Economic Research. Calculations by the IFO.
Number of Jobs (000s) Total Income ($ millions)

Minimum Wage | Page 27
Due to a lack of detailed data, it is not possible to estimate the exact increase in prices for the sectors and
products/services that would be affected by a higher minimum wage. However, general data and reason-
able assumptions can provide an order of magnitude regarding the potential impact on statewide price
levels:
For 2018, total wages paid to all Pennsylvania workers was $349 billion, and the analysis projects
that will increase by $3.5 billion (1.0 percent) due to the higher minimum wage for non-tipped
workers.33
For 2018, total personal consumption expenditures (i.e., spending by all final consumers, excludes
business and government) will be roughly $570 billion. If all higher wage costs were passed forward
to consumer purchases, economy-wide price levels would increase by roughly 0.6 percent ($3.5 /
$570 billion) if the same mix and quantity of goods and services were purchased. If higher employer
payroll taxes are included, the figure increases to 0.7 percent.
However, the analysis assumes that only 65 percent of the cost would be passed forward in higher
prices, so the economy-wide price level would increase by 0.4 percent.
Spending on other goods and services throughout the state economy would fall by a small amount
because more spending would be directed towards goods and services affected by the higher
minimum wage.34 This would moderate price pressures for those goods and services and constrain
the increase in statewide price levels.
This illustration is an oversimplification of the true price adjustment process, and is meant only to provide
a general order of magnitude for the potential impact on statewide price levels in the year the higher
minimum wage is enacted.
The impact on prices would vary across the state economy depending on the sector, consumer responsive-
ness to prices of specific goods and services and local market conditions. Due to the relatively high propor-
tion of lower-wage workers, the food service and retail sectors would be most affected by a $12.00 mini-
mum wage. Other data can be used to gauge the potential price implications for those sectors. For example,
the analysis finds that roughly 16 percent of the higher wage income/costs ($3.5 billion) would flow to the
food service sector, or $560 million ($3.5 billion * 0.16). Data from the U.S. Department of Labor show
total wages for that sector of $7.2 billion, so that wages would increase by 7.8 percent ($560 million / $7.2
billion).35 Federal tax data show that wage compensation comprises roughly one-quarter of total costs for
the food service sector, and if so, prices would need to increase by 1.9 percent (0.078 * 0.25) if all higher
wage costs were passed forward and quantity purchased did not change. If employer payroll taxes on the
higher wages are included, the figure increases to 2.1 percent. Allowing for a reduction in sales due to
higher prices roughly doubles the price increase required to fund higher wages to 4.2 percent. Finally, the
analysis assumes that only 65 percent of the costs are passed forward, which implies a price increase
across the entire sector of 2.7 percent.36
33 Wages include the U.S. Bureau of Economic Analysis adjustment for residence. 34 This assumes that the price elasticity of demand for goods and services significantly impacted by the higher minimum wage (e.g., food services and general retail sales) is lower than -1.0, which is confirmed by research. 35 These data are from the Quarterly Census of Employment and Wages. 36 This example and the one that follows assume a general price elasticity of demand of -0.5 (i.e., quantity demanded falls by 5 percent if price increases by 10 percent). Both computations exclude any impact of a higher minimum wage

Minimum Wage | Page 28
For the retail sector, the analysis finds that 27 percent of the higher wage income/costs would flow to that
sector, or $950 million ($3.5 billion * 0.27). For 2018, total wages for the sector were $15.1 billion (excludes
auto dealers and wholesalers), so that wages would increase by 6.3 percent ($950 million / $15.1 billion).
Federal tax data show that wage costs comprise roughly 10 percent of total costs for the sector (most costs
are related to purchases, since items are purchased for resale) so prices would need to increase by 0.6
percent (0.063 * 0.1) if all higher wage costs were passed forward and quantity purchased did not change.
If employer payroll taxes are included, the figure increases to 0.7 percent. Allowing for a reduction in sales
due to higher prices roughly doubles the price increase required to fund the higher wages to 1.4 percent.
Finally, the analysis assumes that only 65 percent of wage costs are passed forward, which implies a price
increase of 0.9 percent across the entire sector. If retailers purchase goods from other industries that are
also affected by the higher minimum wage, those costs would also get pushed forward into final consumer
prices and the price increase would be greater.
Due to higher price levels, all consumers would lose a small amount of real purchasing power to fund most
of the higher wages paid to low-wage workers under a higher minimum wage. Research finds that other
funding sources include lower business profits, reduced employee benefits, productivity gains and lower
costs related to employee turnover.
Impact on General Fund Revenues
In order to estimate the impact from the higher minimum wage on General Fund revenues, the analysis
must identify the source of the income gains to low-wage workers. Based on recent studies, this analysis
makes the following assumptions regarding the source of the wage gains:
5 percent is from higher prices paid by tourists or out-of-state consumers;
10 percent is attributable to higher worker productivity and reduced turnover;
10 percent is from lower profits of pass-through entities (partnerships, S corporations and sole
proprietors);
10 percent is from lower profits of C corporations; and
65 percent is from higher prices paid by Pennsylvania consumers.
The first and second bullets represent pure revenue gains because those effects do not need to be offset
by less spending or lower incomes elsewhere in the state economy. Higher spending by tourists or visitors
acts like a spending injection into the state economy, while higher worker productivity and lower turnover
costs imply higher output and profits for the same number of workers.
However, the last three bullets do require offsets and the extra income that now flows to low-wage workers
would have flowed to other residents or businesses instead. For pass-through entities, the lower profits
would have been taxed at the personal income tax rate (PIT) of 3.07 percent. For C corporations, the lower
profits would have been taxed at 9.99 percent, but the analysis assumes an effective rate of 8.0 percent
for tipped workers. It is noted that the price increase would be higher for fast food establishments compared to the entire food service sector.

Minimum Wage | Page 29
due to the treatment of losses and loss carryforwards.37 38 Finally, the $2.3 billion spending shift from
higher prices (65 percent of the $3.5 billion in higher incomes for low-wage workers) would have been
spent on other goods and services throughout the state economy, and much of that spending would have
translated into taxable income. Overall, the net effect from the shift in spending patterns and income
distribution yields $20 million in higher PIT revenues. The main causes of the increase are the higher
productivity/reduced turnover from retained workers and the fact that most of the redirected spending is
funneled to Pennsylvania labor, as opposed to spending on general goods and services where some
amounts would flow to out-of-state residents or businesses.
Other General Fund revenue effects from the higher minimum wage include the following:
The higher incomes for low-income filers would reduce net claims for Tax Forgiveness (+$10 mil-
lion).39
Employers must remit the employer share of payroll tax (7.65 percent) on the higher employee
wages, which reduces taxable profits. The analysis assumes half would be paid by pass-through
entities and half by corporations (-$10 million).
Overall spending and economic output will increase under the proposal because low-wage workers
have a higher marginal propensity to spend any income they receive. This result is noted in nearly
all minimum wage studies. This extra spending also has “multiplier effects” that increase the size
of the state economy and increases PIT, SUT and other consumption tax revenues (+$30 million).
A general cutback due to a potential shift to underground economic activity. Given the higher wage
rate, some firms might elect to pay employees under the table (negative, but not quantified).
Overall, the analysis finds a $50 million increase in General Fund revenues. However, it is noted that the
revenue impact from the multiplier effects would not materialize fully in the first year following enactment.
Impact on State and Local Government Expenditures
Due to the increase in the minimum wage, many low-income families would be pulled above the federal
poverty level (FPL) and would be eligible for less state assistance. Table 2.7 details the number and share
of families at various ratios of income to FPL in 2017. For that year, the FPL was $16,240 for a family of
two; $20,430 for a family of three; $24,600 for a family of four; and an extra $4,180 for each additional
dependent. The top half of the table shows that roughly eight percent (255,788) of all Pennsylvania families
have income below the FPL and likely qualify for certain state and federal programs. An additional 13
percent (413,050) of families fall between 100 and 200 percent of the FPL and likely also qualify for certain
state programs (e.g., subsidized childcare). The lower half of the table details the number of families within
various income groups. Roughly 11 percent of all Pennsylvania families (364,041) make less than $25,000
and most likely qualify for state and federal subsidy programs depending on the number of family members.
37 It is noted that the corporate profit reduction due to higher wages may not directly translate to the taxable base due to the sales-only apportionment factor. 38 Lower profits would mainly impact firms with a high proportion of minimum wage workers, but it would also be dispersed throughout the state economy as overall spending shifts to lower-wage sectors and declines in other sectors. 39 The simulation used the 2016 Personal Income Tax micro data file for filers who claimed Tax Forgiveness and reported compensation income.
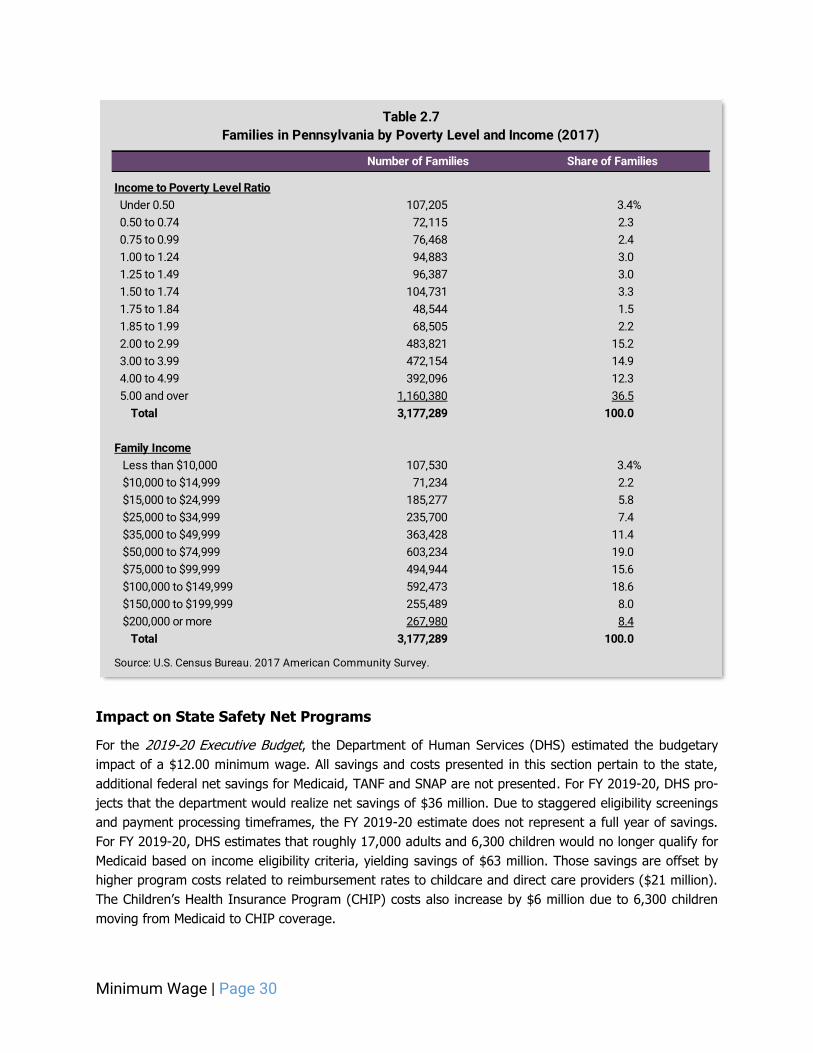
Minimum Wage | Page 30
Impact on State Safety Net Programs
For the 2019-20 Executive Budget, the Department of Human Services (DHS) estimated the budgetary
impact of a $12.00 minimum wage. All savings and costs presented in this section pertain to the state,
additional federal net savings for Medicaid, TANF and SNAP are not presented. For FY 2019-20, DHS pro-
jects that the department would realize net savings of $36 million. Due to staggered eligibility screenings
and payment processing timeframes, the FY 2019-20 estimate does not represent a full year of savings.
For FY 2019-20, DHS estimates that roughly 17,000 adults and 6,300 children would no longer qualify for
Medicaid based on income eligibility criteria, yielding savings of $63 million. Those savings are offset by
higher program costs related to reimbursement rates to childcare and direct care providers ($21 million).
The Children’s Health Insurance Program (CHIP) costs also increase by $6 million due to 6,300 children
moving from Medicaid to CHIP coverage.
Income to Poverty Level Ratio
Under 0.50 107,205 3.4%
0.50 to 0.74 72,115 2.3
0.75 to 0.99 76,468 2.4
1.00 to 1.24 94,883 3.0
1.25 to 1.49 96,387 3.0
1.50 to 1.74 104,731 3.3
1.75 to 1.84 48,544 1.5
1.85 to 1.99 68,505 2.2
2.00 to 2.99 483,821 15.2
3.00 to 3.99 472,154 14.9
4.00 to 4.99 392,096 12.3
5.00 and over 1,160,380 36.5
Total 3,177,289 100.0
Family Income
Less than $10,000 107,530 3.4%
$10,000 to $14,999 71,234 2.2
$15,000 to $24,999 185,277 5.8
$25,000 to $34,999 235,700 7.4
$35,000 to $49,999 363,428 11.4
$50,000 to $74,999 603,234 19.0
$75,000 to $99,999 494,944 15.6
$100,000 to $149,999 592,473 18.6
$150,000 to $199,999 255,489 8.0
$200,000 or more 267,980 8.4
Total 3,177,289 100.0
Source: U.S. Census Bureau. 2017 American Community Survey.
Table 2.7
Families in Pennsylvania by Poverty Level and Income (2017)
Number of Families Share of Families

Minimum Wage | Page 31
For FY 2020-21, DHS projects net state savings of $119 million. A decline in eligible Medicaid enrollees
(68,800 adults, 25,500 children) produces state savings of $256 million. Those savings are offset by children
moving from Medicaid to CHIP ($23 million) and higher reimbursement rates to childcare and direct care
workers. For community-based programs for persons with physical disabilities and seniors, DHS assumed
that (1) direct care workers receive an average wage of $11.51 per hour, (2) each program participant
receives an average of 5.8 hours of personal care services per day and (3) there are 80,000 participants in
these programs. Estimated costs for these community-based programs are $40 million in state funds. For
the childcare subsidy program, the estimated cost to the state is $74 million. This assumes that (1) the
average wage of childcare workers is $10.42 and (2) 40 percent of children in childcare receive a subsidy.
Other Costs and Savings to State and Local Governments
In July 2018, the Governor issued an executive order that increased the minimum wage for state employees
and contracted employees to $12.00 per hour. Hence, the proposed higher minimum wage would not
impact direct costs for state employees or contractors.40
The analysis also reviewed potential costs to school districts if the minimum wage increased to $12.00 per
hour. Unlike teachers and professional staff for which detailed micro-level salary data are readily available,
there is much less detail for school district support staff such as custodial staff, bus drivers and cafeteria
workers. This analysis reviewed nearly 50 school district collective bargaining agreements throughout the
commonwealth. The review suggests that the great majority of contracts pay educational and support staff
at least $12.00 per hour. Hence, the proposal would likely impact only a small portion of districts across
the state, and for those contracts, the impact would be minimal.
State prison costs could also be affected by a higher minimum wage. A recent study uses administrative
prison release records from nearly six million offenders released between 2000 to 2014 and more than two
hundred state-level increases in the minimum wage during that time period.41 The authors find that the
average minimum wage increase of 50 cents reduces the probability that men and women return to prison
within one year by 2.8 percent, and within three years by 2.2 percent. The higher minimum wage draws
those recently released into the legal labor market, and away from illegal activity.42 The authors note that
their results pertain only to minimum wages up to $9.50 per hour, and that it would be difficult to project
their findings to minimum wages that increase up to $15.00 per hour. The IFO analysis does not attempt
to project or include any potential savings from reduced recidivism that might result from the proposed
higher minimum wage.
Other research notes the tradeoff between higher minimum wages, employment effects and lower youth
crime rates. A recent study finds that for very large minimum wage increases, the negative employment
effects dominate the positive incentive effects of higher wages for youth to avoid illegal activities (i.e.,
property crimes).43 The study concludes by noting that minimum wages as high as $15.00 per hour “lead
40 Commonwealth of Pennsylvania, Governor’s Office, Executive Order 2016-02 Amended (June 28, 2018). 41 Agan, A. and M. Makowsky. “The Minimum Wage, EITC and Criminal Recidivism,” NBER Working Paper 25116 (September 2018). 42 The authors note two main limitations to their data. First, the data cannot capture those who reoffend in a different state and they will appear as one who does not reoffend. Second, the data only reflect a return to state prison, and not rearrest or prosecution. Their results apply only to property and drug crimes, not violent crimes. 43 Braun, C. “Crime and the Minimum Wage,” University of California Santa Clara (October 2017).

Minimum Wage | Page 32
to minimum to median wage ratios for young and uneducated workers well above not only welfare max-
imizing levels, but also crime minimizing levels (p. 36).” The negative employment effect dominates be-
cause young, inexperienced workers have a more difficult time entering the job market at the higher min-
imum wage.
Income Mobility of Low-Wage Workers
A concern noted by minimum wage advocates is that many low-wage workers have not received pay raises
that facilitate upward income mobility. Instead, incomes stagnate and those workers remain at the low end
of the income distribution. Conversely, opponents note that minimum wages are intended to be “starter”
wages for inexperienced high school and college students who work limited hours. Over time, those indi-
viduals will receive higher wages commensurate with their education and experience. Opponents believe
that higher minimum wages will prevent students from obtaining employment and gaining valuable work
experience.
The need for a higher minimum wage, to some extent, depends on which of these outcomes occur. Greater
income mobility of low-wage workers would generally imply less need for a higher minimum wage because
lower wages are temporary and appropriate due to the lower productivity and uncertainty that surrounds
new hires, especially inexperienced new hires. However, if many low-wage workers remain stuck at those
wage levels, then a higher minimum wage could alleviate the lack of real income gains and improve quality
of life.
To examine income mobility for low-wage workers, the analysis used the personal income tax micro data
file for tax years 2010 and 2016. The files contain data on all income tax returns filed for those tax years.
The analysis used single filers reporting $15,000 to $24,999 of wage compensation and married filers
reporting $15,000 to $34,999 of wage compensation in tax year 2010. Most of those filers likely earned a
wage that paid $12.00 or less per hour.44 Moreover, the income thresholds should eliminate the great
majority of dependents, college students and part-time low-wage workers. The analysis used only “wage
earners” where wage compensation comprised at least 90 percent of taxable income reported on the tax
return. Those filers were matched to the 2016 dataset to examine outcomes six years later. Because filers
must be wage earners in both years, the upward (or downward) mobility must generally be due to changes
in wage compensation.45 46
Table 2.8 lists the results of the match. Results for singles are displayed in the top portion of the table
and they are sub-divided into two groups. For the first group that reported between $15,000 to $19,999 of
wage compensation in 2010, 106,602 filers were matched to a return in 2016, and they reported median
wage compensation of $17,461 in 2010 and $26,141 in 2016, an average growth rate of 7.0 percent per
44 For example, a single worker earning $7.50 an hour who works 40 hours per week for 50 weeks would earn $15,000 for the year, while one earning $12.00 per hour would earn $24,000. For married filing joint filers, if one assumes that on average 1.5 persons work full-time, then the figures are $22,500 and $36,000, respectively. A single filer working 30 hours per week at $10.00 per hour would earn $15,000, while a married filer would earn $22,500. 45 For the purpose of the match, filers must maintain the same filing status (i.e., single or married filing joint) and must be full-year residents in both tax years. 46 All filers that reported more than a 50 percent drop in wage compensation were removed from the matched dataset. It is likely those filers experienced a major life event, such as entering retirement or a temporary layoff from a job. This exclusion reduced the matched dataset by 8 to 10 percent.

Minimum Wage | Page 33
annum. The columns that follow place filers into three groups based on the average annual growth rate
realized during the six years: less than 2.0 percent per annum, 2.0 percent to 9.99 percent and 10.0 percent
or more. A 2.0 percent cut-off is used for the bottom group because inflation during that time period was
roughly 1.5 percent per annum, and a conservative estimate for productivity gains for low-wage workers
could be 0.5 percent per annum. Hence, the 2.0 percent per annum increase is what could be expected if
workers received pay raises to compensate them for inflation and a small raise for higher productivity.
For the first group, the data show that 25.2 percent of filers realized average wage gains of less than 2.0
percent per annum. Conversely, 36.1 percent of filers realized very strong wage gains that exceeded 10
percent or more per annum. This latter group would include filers who received promotions, switched jobs
for better pay and individuals working more hours. It may also include college students transitioning to a
profession in their primary field of study, but they must have earned at least $15,000 in 2010 to be included,
and that would eliminate most who held temporary jobs during the school year.
Data for the second group of single filers show similar results, although a higher proportion of filers remain
in the lower group by 2016 because they start from a higher absolute income level. There is also a smaller
share that realize very large income gains in the top group.
Data for married filing joint filers also show similar patterns, as just under one-third of filers realize average
wage gains of less than 2.0 percent per annum, and between one-quarter to one-third of filers realize very
strong wage gains.
Overall, these data suggest that some low-wage workers had significant income mobility, while others
reported very limited wage gains. Unfortunately, the personal income tax data do not identify age, wage
2010 2016 AAGR <2% 2.00% - 9.99% 10%+
Singles
$15,000 to $19,999 106,602 $17,461 $26,141 7.0% 26,878 41,291 38,433
25.2% 38.7% 36.1%
$20,000 to $24,999 103,398 $22,456 $29,639 4.7% 30,893 49,291 23,214
29.9% 47.7% 22.5%
Married
$15,000 to $24,999 32,448 $20,480 $28,488 5.7% 10,112 11,419 10,917
31.2% 35.2% 33.6%
$25,000 to $34,999 44,309 $30,400 $39,403 4.4% 14,655 18,440 11,214
33.1% 41.6% 25.3%
Source: Pennsylvania Personal Income Tax micro data file for 2010 and 2016.
Matched
Filers
Average Annual Growth RateMedian Compensation
Table 2.8
Pennsylvania Wage Earner Income Mobility (2010 to 2016)
Note: Matched filers are filers that (1) filed a PA income tax return in both 2010 and 2016, (2) were a full-year
Pennsylvania resident, (3) did not change filing status, (4) reported gross compensation that did not decline more
than 50% between the two years and (5) were wage earners (i.e., a tax filer whose gross compensation income is
greater than 90% of their total taxable income).

Minimum Wage | Page 34
rates or profession that would facilitate a more detailed analysis. The analysis cannot identify the reasons
for the gains or stagnant incomes. Despite these limitations, the data demonstrate that there is considerable
variation for filers even within narrow income ranges. Although average gains may appear strong, it masks
a broad spectrum of outcomes where many filers report solid or very strong wages gains, while a smaller
group reports minimal gains or even income reductions.47
Impact on Tipped Workers
Table 2.9 details the minimum wages for tipped workers by state as of January 1, 2019. The table contains
three groups of states:
Seven states (California, Washington, Oregon, Alaska, Minnesota, Montana and Nevada) set their
tipped minimum wage at the regular state minimum wage and do not allow employers to include
tips in the calculation of the minimum wage. For those seven states, four have a lower tipped wage
for small businesses (California, Minnesota and Montana) and/or businesses that provide health
insurance to their employees (Nevada).
Twenty-five states and Washington D.C. have tipped minimum wages above the federal minimum
cash wage of $2.13, including Pennsylvania and all border states except New Jersey.48 All of these
states require employers to pay a cash wage between $2.23 (Delaware) and $9.35 (Hawaii). Nine-
teen states and Washington D.C. require a tipped plus cash wage greater than the federal minimum
wage of $7.25 per hour.
The remaining 18 states only require employers to pay the federal minimum tipped cash wage
($2.13). Three states (Nebraska, New Jersey and New Mexico) have a combined cash and tipped
minimum wage greater than the federal minimum of $7.25 per hour.
47 It is noted that the matched dataset may reflect more successful outcomes compared to all filers in those income groups because it would exclude filers who dropped out of the labor force or had to transition to temporary jobs where wage income declined by more than 50 percent. 48 New Jersey recently passed legislation that will increase their tipped minimum cash wage to $2.63 on July 1, 2019.

Minimum Wage | Page 35
Jurisdiction
Combined
Cash & Tip
Min. Wage
Min.
Cash
Wage Notes
California $12.00 $12.00 Employers with <26 employees, min. cash wage is $11.00/hr.
Washington 12.00 12.00
Oregon 10.75 10.75
Alaska 9.89 9.89
Minnesota 9.86 9.86 Employers with annual gross revenue <$500,000, min. cash wage is $8.04/hr.
Montana 8.50 8.50 Employers with gross annual sales of $110,000 or less, min. cash wage is $4.00/hr.
Nevada 8.25 8.25 Employers that provide health insur. to employees, min. cash wage is $7.25/hr.
Hawaii 10.10 9.35
Colorado 11.10 8.08
Arizona 11.00 8.00
New York 11.10 7.50 For tipped service employees, minimum cash wage is $9.25/hr.
Connecticut 10.10 6.38 For bartenders who receive tips, minimum cash wage is $8.23/hr.
Maine 11.00 5.50
Florida 8.46 5.44
Vermont 10.78 5.39
Illinois 8.25 4.95
North Dakota 7.25 4.86
South Dakota 9.10 4.55
Iowa 7.25 4.35
Missouri 8.60 4.30
Ohio 8.55 4.30 Employers w/ ann. gross rec. <$305k, combined cash & tips min. wage is $7.25/hr.
Washington D.C. 13.25 3.89
Rhode Island 10.50 3.89
Massachusetts 11.00 3.75
Maryland 10.10 3.63
Michigan 9.45 3.59
Idaho 7.25 3.35
New Hampshire 7.25 3.26
Pennsylvania 7.25 2.83
Arkansas 9.25 2.63
West Virginia 8.75 2.62 State min. wage law applies only to employers with 6+ employees.
Wisconsin 7.25 2.33 Employees <20 years old & employed <91 days, min. cash wage is $2.13/hr.
Delaware 8.75 2.23
Nebraska 9.00 2.13
New Jersey 8.85 2.13
New Mexico 7.50 2.13
Other 7.25 2.13
State minimum cash wage payment is the same as the federal Fair Labor Standards Act ($2.13/hr)
Source: U.S. Department of Labor. Wage and Hour Division. Minimum Wages for Tipped Employees.
Table 2.9
State Minimum Wages for Tipped Employees (as of January 1, 2019)
State requires employers to pay tipped employees full state minimum wage before tips
State requires employers to pay tipped employees a minimum cash wage above the federal minimum cash wage ($2.13/hr)
Note: Other includes Alabama, Georgia, Indiana, Kansas, Kentucky, Louisiana, Mississippi, North Carolina, Oklahoma, South
Carolina, Tennessee, Texas, Utah, Virginia and Wyoming.

Minimum Wage | Page 36
Table 2.10 lists the cash wage rate, employment status and gender for all tipped Pennsylvania workers.
For the purpose of the table, tipped workers include the following occupations: bartenders, wait staff, food
servers, barbers, hairdressers, miscellaneous personal appearance, miscellaneous personal care and service
workers, baggage handlers, gaming service workers and taxi drivers. It is noted that the figures do not
include independent contractors, such as those working for Uber or Lyft, and the wage rates do not include
any tips earned. Other workers may also receive tips (e.g., counter service workers), but those jobs are
included with non-tipped workers. Various sales personnel who may receive commissions are also included
with non-tipped workers because the data do not allow the analysis to separately identify those workers.
As noted, the analysis imputed 100,000 secondary jobs into the tipped worker dataset based on discrep-
ancies between the Census Bureau CPS and Bureau of Labor Statistics data. It is likely that nearly all of
those jobs are wait staff jobs, and many would pay a cash wage of $2.83. Due to lack of data, the analysis
did not attempt to apportion those jobs among wage groups.
The IFO did not perform a formal analysis for the increase in cash wages for tipped workers from $2.83 to
$12.00 per hour (324 percent) because no research exists on which to model the proposed change. The
food service industry has a relatively low profit margin, and a cost increase of this magnitude and immedi-
acy has potential to cause material reductions in employment and higher prices. Wait staff might also
receive lower tips if patrons factor in the much higher cash wage, and a significant portion of the higher
wage could be reflected in higher prices. Employers would also be liable for the increase in payroll taxes
due to the higher wage.
Recently, New York City increased the cash wage for tipped food service workers from $7.50 per hour in
2017 to $8.65 in 2018 and $10.00 for 2019. When combined with the credit for tips received, the overall
wage rate was $11.00 (2017), $13.00 (2018) and $15.00 (2019).49 The minimum wage for non-tipped
49 Applies to employers with 11 or more employees.
Primary Jobs Part-Time Full-Time Male Female Total
$2.83 to $2.99 13 3 3 13 16
$3.00 to $7.24 15 7 5 17 22
$7.25 to $11.99 65 29 29 65 94
$12.00 or more 29 35 19 44 63
Total 122 73 55 140 195
Secondary Jobs Part-Time Full-Time Male Female Total
Total 100 0 28 72 100
Source: U.S. Census Bureau, Current Population Survey and Merged Outgoing Rotation Group dataset (2018)
compiled by the National Bureau of Economic Research.
Table 2.10
Tipped Workers Affected by a $12 Minimum Wage for 2018
Employment Status (000s) Employee Gender (000s)
Employment Status (000s) Employee Gender (000s)

Minimum Wage | Page 37
workers also increased from $13.00 (2018) to $15.00 (2019). Tipped food service workers are generally
employed by full-service restaurants and preliminary data from the U.S. Bureau of Labor Statistics reveal
an employment reduction for that subsector in New York City starting in May 2018.50 Through the fourth
quarter of 2018 and January 2019, the data show an approximate four percent employment contraction
for that subsector. However, there are several caveats that should be noted regarding the employment
contraction in the city:
The most recent data since September 2018 are survey data and they are preliminary. They have
not been benchmarked to the full universe of employers and they will be revised.
A simple year-over-year employment comparison disregards the true counterfactual scenario, or
what could be expected if wage rates had not changed.
Although the data for New York City show an employment decline for full-service restaurants, they
show solid gains for limited-service restaurants that employ fast food workers. For 2018, wages
for fast food workers in New York City increased from $12.00 to $13.50 per hour. For 2019, the
wage increased to $15.00 per hour.
Similar to Seattle, the labor market and cost of living for New York City is very different than Pennsylvania,
and any results from those two urban areas will not fully translate to the state.
Moving from a $12 to $15 per Hour Minimum Wage
Following the enactment of a $12.00 minimum wage, the proposal increases the minimum wage by 50
cents per annum beginning July 1, 2020. By July 1, 2025, the minimum wage reaches $15.00 and is indexed
to inflation annually thereafter. There is no research available on states that have raised the minimum
wage to that level, so it is not possible to assess the potential implications for Pennsylvania. However, a
few items can be noted:
For 2018, there were 1.94 million positions that paid less than $15.00 per hour (includes secondary
jobs). That figure represents 32.2 percent of all payroll jobs (tipped and non-tipped) in the state.
For those workers, the phased-in increase would represent a significant real wage gain. For exam-
ple, for the first year the increase would be 4.2 percent ($0.50 / $12.00). By the final year, the
increase would be 3.4 percent ($0.50 / $14.50). By comparison, most economic forecasting firms
project a long-term inflation rate of roughly 2.0 percent per annum.
Similar to the increase to $12.00, much of any negative employment impact would likely be borne
by new entrants to the labor market, and existing workers would reap most of the gains.
At a rate of $15.00 per hour, the value of the Kaitz index (ratio of minimum wage to state median
wage) referred to previously would exceed results from all previous minimum wage studies. At
those levels, results from existing minimum wage studies are no longer relevant. At least one study
has found rapidly accelerating negative impacts from high minimum wages, but further research is
necessary to corroborate those results.
50 See https://www.bls.gov/sae/. Data are for non-seasonally adjusted payroll employment.

Minimum Wage | Page 38
Firms might also respond to higher wages through a reduction in benefits such as healthcare and
retirement plans. Low-wage workers earning under $12.00 per hour likely receive few benefits, but
workers who currently earn $12.00 to $14.99 per hour likely receive some form of healthcare or
retirement savings benefits.
Summary
Similar to other policy changes, policymakers face tradeoffs from a higher minimum wage. There will be
many who benefit from the change, but a smaller group will be adversely impacted too. Policymakers will
need to decide whether the projected gains outweigh the drawbacks.
The analysis found the following gains from a $12.00 per hour minimum wage for non-tipped workers:
Roughly 1.08 million payroll jobs would receive a higher wage.
Net wage income for low-wage workers would increase by $3.5 billion, roughly $38 per week for
part-time workers and $64 per week for full-time.
The overall size of the economy would expand because low-wage workers will spend nearly all of
the new income they receive.
General Fund revenues would increase by roughly $50 million per annum once all economic multi-
plier effects have been fully realized.
The Department of Human Services projects that expenditures would decline, largely due to re-
duced Medicaid enrollment, by $119 million in FY 2020-21 as a result of a $12.00 minimum wage.
Fewer families would also fall below the current federal poverty level.
Although businesses would incur higher labor costs, they should also realize cost savings through
an increase in worker productivity and reduced labor turnover.
There would be wage spillover effects for workers earning $12.00 to $15.00 per hour. The analysis
assumes a four percent pay increase, and some research finds that figure could be higher.
The analysis also found the following drawbacks from the proposal:
An employment reduction of 34,000 positions, 26,000 part-time and 8,000 full-time.
A reduction in the average workweek for all affected workers of roughly one-half hour per week.
More difficult entry into the labor market for inexperienced workers, especially part-time high school
and college students.
Higher price levels for sectors affected by the higher minimum wage, in particular the food service
and retail sectors.
Stronger effects for rural areas that have a lower cost of living and a greater share of small, regional
employers.
Lower profit levels that can be reinvested in business operations.

- This page intentionally left blank. -