independent fiscal office
TRANSCRIPT


Independent Fiscal Office Rachel Carson State Office Building
400 Market Street
Harrisburg, PA 17105
717-230-8293 | [email protected] | www.ifo.state.pa.us
Staff Acknowledgements
Brenda Warburton, Deputy Director
Stacey Knavel, Principal Revenue Analyst
Karen Maynard, Budget Analyst II
Lesley McLaughlin, Revenue Analyst II
Jesse Bushman, Revenue Analyst II
Joseph Shockey, Revenue Analyst II
Mathieu Taylor, Fiscal Analyst II
Kathleen Hall, Modeling & Development Analyst II
Robyn Toth, Revenue Analyst I
Rachel Flaugh, Revenue Analyst I
Michaela Bowers, Revenue Analyst I
Kara Hale, Office Manager

- This page intentionally left blank. -

Rachel Carson State Office Building, 400 Market Street, Harrisburg PA 17105 www.ifo.state.pa.us | (717) 230-8293 | [email protected]
INDEPENDENT FISCAL OFFICE
January 21, 2021
The Honorable Members of the Pennsylvania General Assembly:
Section 604-B (a)(2) of the Administrative Code of 1929 specifies that the Independent Fiscal Office
(IFO) shall “provide an assessment of the state’s current fiscal condition and a projection of what the
fiscal condition will be during the next five years. The assessment shall take into account the state of
the economy, demographics, revenues and expenditures.” In fulfillment of that obligation, the IFO submits
this report to the residents of the Commonwealth and members of the General Assembly. In accordance
with the mission of the office, this report does not make any policy recommendations.
The data and projections presented in this report are from various sources. Economic projections for
Pennsylvania are from the IFO, while projections for the U.S. are from the Congressional Budget Office or
IHS Markit. Demographic projections are from the IFO based on tabulations from the 2019 Population
Estimates by the U.S. Census Bureau and data supplied by the Pennsylvania Department of Health. His-
torical revenue and expenditure data are from the Governor’s Executive Budget, the state accounting
system and various departmental reports. All revenue and expenditure projections are from the IFO. Other
data sources are noted in the relevant sections of this report.
The office would like to thank all of the individuals, agencies and organizations that assisted in the pro-
duction of this report. Questions and comments can be submitted to [email protected]. Sincerely,
Dr. Matthew J. Knittel
Director

- This page intentionally left blank. -

Contents
Executive Summary .................................................................................................................. 1
Section 1: Introduction ............................................................................................................. 3
Section 2: Demographic Outlook .............................................................................................. 5
Components of Population Change ................................................................................................... 6
Dependency Ratios .......................................................................................................................... 7
Labor Force Participation Rates ........................................................................................................ 8
Section 3: Economic Outlook .................................................................................................... 9
Federal Relief and Stimulus ............................................................................................................ 11
Payroll Employment ....................................................................................................................... 13
Labor Force Trends ....................................................................................................................... 16
Income Trends .............................................................................................................................. 17
Financial Trends ............................................................................................................................ 19
Section 4: Revenue Outlook .................................................................................................... 21
Personal Income Tax ..................................................................................................................... 22
Sales and Use Tax ......................................................................................................................... 23
Corporate Net Income Tax ............................................................................................................. 24
Other Revenue Sources ................................................................................................................. 25
Section 5: Expenditure Outlook .............................................................................................. 27
Current Services Versus Cost-to-Carry Baselines .............................................................................. 30
General Fund Pensions .................................................................................................................. 31
General Fund Debt Service ............................................................................................................. 33
Human Services ............................................................................................................................ 33
Education ..................................................................................................................................... 36
Criminal Justice ............................................................................................................................. 37
All Other Expenditures ................................................................................................................... 39
Section 6: Fiscal Outlook ......................................................................................................... 41
Appendix ................................................................................................................................. 43

- This page intentionally left blank.

Executive Summary | Page 1
Executive Summary
This report examines the demographic, economic, revenue and expenditure trends that will affect the
Commonwealth’s fiscal condition through fiscal year (FY) 2025-26. Based on the economic and demographic
assumptions used by this report, the analysis projects a substantial surplus for FY 2020-21, but operating
deficits for all future years.
For FY 2021-22, revenues contract by 4.6 percent because the prior fiscal year includes one-time transfers
from special funds ($531 million) and delayed tax payments shifted into the year ($1.9 billion). The analysis
also projects flat income growth for the current calendar year as various federal relief programs end and
consumer spending slows. From FY 2021-22 to FY 2025-26, the forecast projects that General Fund reve-
nues will increase at an average rate of 3.6 percent per annum. Following a two-year recovery period, the
forecast assumes that the Pennsylvania economy operates at its long-term potential, energy prices and
interest rates do not increase dramatically and a recession does not occur. Therefore, the forecast likely
reflects an optimistic scenario.
For FY 2021-22, expenditures increase by 14.6 percent due to the use of substantial federal monies, pay-
ment delays and other one-time measures in the prior fiscal year. From FY 2021-22 to FY 2025-26, General
Fund expenditures expand at an average rate of 3.1 percent per annum. When combined with available
revenues, the projected operating deficit peaks in FY 2022-23 at $2.6 billion and then declines to $2.0
billion by FY 2025-26. The deficit peaks in FY 2022-23 due to a new, permanent transfer from sales and
use tax revenues ($469 million) that begins that year.
Fiscal Year 19-20 20-21 21-22 22-23 23-24 24-25 25-26
Beginning Balance1
$30 -$2,734 -- -- -- -- --
Current Year Revenues 32,276 38,437 $36,675 $37,851 $39,352 $40,828 $42,321
Less Refund Reserve -1,150 -1,300 -1,326 -1,353 -1,380 -1,407 -1,435
Net Revenue 31,126 37,137 35,349 36,498 37,972 39,421 40,885
State Expenditures2
-34,090 -33,141 -37,975 -39,223 -40,586 -41,877 -42,971-------- -------- -------- -------- -------- -------- --------
Current Year Balance -2,934 1,263 -2,626 -2,725 -2,613 -2,455 -2,086
Adjustment for Lapses3
200 219 125 125 125 125 125
Preliminary Ending Balance -2,734 1,481 -2,501 -2,600 -2,488 -2,330 -1,961
General Fund Financial Statement
Note: Millions of dollars.
1 Beginning balance omitted for FY 21-22 and thereafter.
2 Based on appropriations. Includes current year lapses and approved supplemental appropriations.
3 Prior year lapses and actual transfers to the Budget Stabilization Reserve Fund.

Executive Summary | Page 2
- This page intentionally left blank. -

Section 1: Introduction | Page 3
Section 1: Introduction
This report provides an overview of the demographic, economic, revenue and expenditure trends that will
affect the Commonwealth’s fiscal condition through fiscal year (FY) 2025-26. The report examines long-
term trends to facilitate an assessment of current tax and spending policies. The projections are best viewed
as plausible outcomes from the application of reasonable economic assumptions and the continuation of
current policies and demographic trends. Actual revenues and expenditures could deviate significantly from
the projections in this report due to the uncertainty of economic outcomes and unanticipated technical
factors, such as changes to federal tax laws and federal matching funds.
The economic projections displayed in this report motivate most General Fund revenues through FY 2025-
26. The projections do not represent a formal economic forecast, but rather a controlled simulation. They
assume that economic growth is consistent with full employment, historical labor productivity gains and
inflation expectations. The economic simulation provides a neutral baseline that policymakers can use to
assess fiscal sustainability, and it does not assume that a recession occurs over the five-year budget win-
dow. In this manner, the economic forecast represents an optimistic scenario.
The report designates FY 2020-21 as the base year. All revenue and expenditure projections use that year
as a reference year and assume that the policy choices embedded therein do not change through FY 2025-
26. The report makes two forecasts of baseline expenditures. The first forecast represents a “cost to carry”
concept and only includes increases in mandatory spending such as debt service, pension contributions and
entitlement programs. The second forecast assumes that expenditures grow in a manner that is sufficient
to maintain the level of real services provided to service populations in the base year. Hence, most ex-
penditure projections include an inflationary adjustment to compensate for rising prices. Combined, the
two forecasts provide a reasonable lower and upper bound for future spending.
The report projects expenditures supported by General Fund revenues, as well as other revenue sources.
To that end, the report includes projections for the Lottery, Tobacco Settlement and Oil and Gas Lease
Funds. Certain disbursements from those funds support General Fund programs, and the projections allow
policymakers to determine if legislative or policy changes are needed so the funds can maintain their current
levels of support. Projections of non-General Fund revenues are included in the Appendix.
The report starts with the demographic and economic outlooks. Those outlooks provide the foundation for
the five-year projections of General Fund tax revenues and expenditures that follow. Several appendices
provide further details on all forecasts contained in this report.

Section 1: Introduction | Page 4
- This page intentionally left blank. -

Section 2: Demographic Outlook | Page 5
Section 2: Demographic Outlook
Demographics are a critical factor that motivate long-term economic, revenue and expenditure trends.
Demographic trends determine key populations, such as the potential labor force that affects economic
growth, elementary and secondary students who require educational services and elderly residents who
may require long-term care. All population projections and certain descriptive text contained in this section
are from the IFO report Pennsylvania Demographic Outlook (September 2020).1 Some detail tables and
figures from that report are included in the Appendix to this report.
Figure 2.1 presents the average annual growth rates of various age cohorts for three time periods. Those
periods are: 2015 to 2020 (the recent past), 2020 to 2025 (near-term projections) and 2025 to 2030 (long-
term projections). As explained in the September release, it is likely that near-term projections will be
similar to actual population estimates. However, long-term projections are less certain because birth, death
and migration rates can vary more significantly in the long term than in the short term due to factors such
as changing economic conditions, immigration policies, domestic migration incentives and health care.
1 Page 2 of the Pennsylvania Demographic Outlook notes that since the COVID-19 impact on overall deaths and births remains unknown, it is not explicitly built into the demographic projections. That report used data from the U.S. Census Bureau and Pennsylvania Department of Health (DOH). For more details, see http://www.ifo.state.pa.us/re-leases/395/Demographic-Outlook/.
Figure 2.1
PA Demographic Trends and Projections by Age Group
Note: Percents listed between bars are the average annual growth rates of the age group between years.
3,040 2,956 2,867 2,768
7,568 7,389 7,137 6,933
1,561 1,834 2,080 2,140
616 623 684 827
0
2,000
4,000
6,000
8,000
10,000
12,000
14,000
2015 2020 2025 2030
Num
ber
of
Resid
ents
(000s)
0-19 20-64 65-79 80+
-0.5%
-0.6%
0.2%
3.3%
1.9%
2.6%
-0.7%
-0.6%
3.9%
0.6%
-0.6%
-0.7%
12,785 12,802 12,768 12,6680.0% -0.1% -0.2%

Section 2: Demographic Outlook | Page 6
Figure 2.1 reveals the following trends:
The total state population was nearly flat from 2015 to 2020 and is projected to contract slightly
in the near term (-0.1 percent per annum) and long term (-0.2 percent per annum).
The school-age cohort (age 0 to 19) declined 0.6 percent per annum from 2015 to 2020 and is
projected to contract at the same rate in the near term but slightly more in the long term (-0.7
percent per annum).
The working-age cohort (age 20 to 64) declined 0.5 percent per annum from 2015 to 2020 and
is projected to contract in the near term (-0.7 percent per annum) and the long term (-0.6 percent
per annum). In 2025, this group includes Generation X (born between 1965 and 1980) and Millen-
nials (1981 to 1997) and a portion of Generation Z (1998 to 2015). If labor force participation rates
do not increase, then this trend will constrain economic and revenue growth in the future.
The retiree cohort (age 65 to 79) increased 3.3 percent per annum from 2015 to 2020 and is
projected to expand in the near term (2.6 percent per annum) and the long term (0.6 percent per
annum). In 2025, this group includes most of the Baby Boom Generation (1946 to 1964). The
expansion of this age cohort and the older cohort implies strong demand for health care and long-
term care services moving forward.
The elderly cohort (age 80+) increased 0.2 percent per annum from 2015 to 2020 and is pro-
jected to expand in the near term (1.9 percent per annum) and the long term (3.9 percent per
annum). In 2025, this group mostly includes the Silent Generation (1926 to 1945) and a small
number of individuals from the Greatest Generation (1905 to 1925).
Components of Population Change
Table 2.1 deconstructs the change in state population from 2010 to 2030 to illustrate the factors that
motivate low population growth rates. Three factors drive the trends during the 20-year time period:
The forecast projects that the number of births will decline while the number of deaths will increase.
From 2010 to 2015, births (706,000) outnumbered deaths (641,000) by 65,000. By 2020 to 2025,
deaths are projected to outnumber births by 50,000.
From 2010 to 2015, net migration was 9,000 and is projected to increase to 13,000 (2015 to 2020),
16,000 (2020 to 2025) and 20,000 (2025 to 2030). The overall positive net migration is due to net
inflows from international migration. The most recent data also reveal a reduction in outflows from
net domestic migration.
Although not shown explicitly in the table, declining college enrollment also impacts state demo-
graphic trends. Pennsylvania typically receives a large influx of non-resident students who attend
college. The temporary students are counted as residents for the purpose of the Census. While
most return to their home state, some secure employment and remain in the state.

Section 2: Demographic Outlook | Page 7
Dependency Ratios
Working-age residents remit the majority of state tax revenues that support dependents attending school
and elderly residents who require dedicated healthcare services. Demographers use two metrics known as
dependency ratios to illustrate the relationships between these three groups. The two ratios are the work-
ing-age (age 20-64) to youth (age <20) and working-age to retiree (65+) populations. From 2015 to 2030,
the working-age to youth ratio is projected to remain stable at roughly 2.5 to 2.6 for Pennsylvania and 2.3
to 2.4 for the United States. For Pennsylvania, this implies that there are roughly 2.5 to 2.6 working-age
adults per youth.
Unlike the working-age to youth ra-
tio, the working-age to retiree ratio
is trending downward for both
Pennsylvania and the United
States. Figure 2.2 displays this ra-
tio for Pennsylvania and the United
States for 2015, 2020 (estimate),
2025 (projected) and 2030 (pro-
jected). In 2015, there were 3.5
working-age residents per retiree in
Pennsylvania and 4.0 for the United
States. Both ratios are projected to
decline substantially in 2020 (3.1 for
Pennsylvania, 3.5 for the United States) and continue to decline through 2030 (2.3 for Pennsylvania, 2.7
for the United States). The downward trend directly corresponds to the retirement of Baby Boomers and
the contraction of the working-age population.
2010-15 2015-20 2020-25 2025-30
Start of Period 12,711 12,785 12,802 12,768
Natural Increase 65 4 -50 -120
Births 706 679 644 618
Deaths -641 -675 -694 -738
Net Migration 9 13 16 20
End of Period 12,785 12,802 12,768 12,668
Total Population Gain 74 17 -34 -101
Table 2.1
Components of Pennsylvania Population Change by Time Period
Note: Thousands of residents.
Sources: The 2010 through 2019 data are from the U.S. Census Bureau 2019 Population Estimates and
Pennsylvania DOH. The 2020 through 2030 data are projections by IFO using data from the U.S. Census
Bureau and Pennsylvania DOH. Calculations by IFO.
Figure 2.2
Working-Age (20-64) to Retiree (65+) Ratios
Sources: Data for 2015 are from the U.S. Census Bureau 2019 Population
Estimates. The 2020, 2025 and 2030 Pennsylvania data are projections by the
IFO. The 2020, 2025 and 2030 U.S. data are from the U.S. Census Bureau
Population Projections 2017.
3.5 3.1 2.6 2.34.0 3.5 3.0 2.7
2015 2020 2025 2030
PA U.S.

Section 2: Demographic Outlook | Page 8
Labor Force Participation Rates
Labor force participation rates determine the size of the actual Pennsylvania labor force. The labor force
includes all residents age 16 or older if they are employed or actively seek employment. The statewide
labor force participation rate is equal to the ratio of the labor force to all non-institutionalized residents age
16 or older. Overall job growth in the Commonwealth requires that either the working-age population
expands or a larger share of the working-age population participates in the labor force.
Figure 2.3 displays labor force participation rates at 10-year intervals for Pennsylvania and the U.S. for
various age groups. From 1999 through 2019, the Pennsylvania labor force participation rate declined 1.2
percentage points from 64.4 to 63.2 percent while the U.S. rate declined 4.6 percentage points (67.1 to
63.1 percent). Pennsylvania’s rate declined less than the U.S. rate primarily due to the Commonwealth’s
large senior population. Over the last 20 years, Pennsylvania residents age 65 years and older roughly
doubled their labor force participation rate from 10.5 percent (1999) to 21.4 percent (2019). While the U.S.
recorded a similar trend, Pennsylvania has a larger share of older residents compared to the U.S., and this
population prevented Pennsylvania’s labor force participation rate from declining as much as the U.S. rate
did during the same time period.
In addition to the 65 years and
older population, the 55- to 64-
year-old population also recorded
solid labor force participation
growth from 60.2 percent (1999)
to 67.5 percent (2019) in Pennsyl-
vania. The U.S. data show a similar
trend for that age group, although
at a slightly lower overall rate.
The COVID-19 pandemic had a sig-
nificant impact on labor force par-
ticipation rates. As of November
2020, the U.S. Bureau of Labor
Statistics reported that the U.S.
overall labor force participation
rate declined to 61.5 percent com-
pared to 63.2 percent in the prior
year. It is expected that a portion
of this reduction will reverse as
COVID-19 vaccines are distributed
during the first half of 2021.
Figure 2.3
Pennsylvania Labor Force Participation Rates
U.S. Labor Force Participation Rates
Source: U.S. Bureau of Labor Statistics. CPS data.
64.4%
51.9%
83.0%
60.2%
10.5%
63.2%
41.5%
82.7%
67.5%
21.4%
Total 16-19 yrs 20-54 yrs. 55-64 yrs. 65 yrs.+
67.1%
52.0%
83.2%
59.3%
12.3%
63.1%
35.1%
81.0%
65.4%
20.2%
Total 16-19 yrs 20-54 yrs. 55-64 yrs. 65 yrs.+
1999 2009 2019

Section 3: Economic Outlook | Page 9
Section 3: Economic Outlook
Due to the COVID-19 pandemic, calendar year (CY) 2020 was a tumultuous year for state economic growth.
In March 2020, business closures related to COVID-19 and mitigation efforts caused an immediate and
severe contraction of the national and state economies. In May, businesses in certain counties partially
reopened and economic growth began to recover. By August, a rapid recovery had slowed notably and
now proceeds at a modest, albeit halting pace. There is a general expectation that widely available vaccines
will allow for an acceleration of the recovery by late spring or early summer.
Table 3.1 displays the economic forecast used for this report. The forecast assumes continued economic
recovery in CY 2021 and CY 2022 (blue shading) and a reversion to steady state or typical economic growth
in CY 2023 and later years (beige shading). The economic growth lost due to the pandemic is treated as a
permanent loss, and the state economy does not revert to the growth path assumed prior to the pandemic.
The forecast reflects these assumptions for the current calendar year:
Although it is likely that Congress enacts additional stimulus or extensions, the analysis does not
incorporate further relief beyond the package passed at the end of CY 2020.
All residents who desire a vaccination can receive one by mid-summer.
Schools, restaurants and other businesses resume normal operations by mid-summer.
Many jobs lost to the pandemic do not return. Those jobs are concentrated in the food service,
accommodation, travel, retail trade, government and personal service sectors.
For CY 2023 and later years, the forecast reflects a long-run growth rate that is consistent with full em-
ployment, low inflation and normal productivity gains. For these projections, the forecast assumes that:
The Federal Reserve achieves its target inflation rate of 2.0 percent.
Interest rates remain relatively low. Energy prices do not increase dramatically.
Wage earners receive raises that exceed inflation (i.e., real wages increase).
Payroll employment does not return to its pre-pandemic level until CY 2026.
2019 2020 2021 2022 2023 2024 2025 2026
Real GDP 2.4% -4.1% 3.5% 2.8% 2.4% 2.1% 2.0% 1.9%
Wages and Salaries 4.3% -1.2% 4.8% 4.4% 4.3% 4.2% 4.1% 4.0%
Philadelphia CPI-U 2.0% 0.9% 1.6% 2.1% 2.2% 2.2% 2.2% 2.2%
Payroll Job Gains (000s) 54 -450 120 100 80 59 54 48
Table 3.1
Annual Growth Rates for Pennsylvania Economic Variables
Note: Payroll Job Gains exclude self-employed.
Source: U.S. Bureau of Economic Analysis and U.S. Bureau of Labor Statistics. Forecast by IFO.

Section 3: Economic Outlook | Page 10
Although many factors drive economic growth, four state metrics are key to the forecast: (1) real gross
domestic product (GDP, excludes inflation), (2) the Philadelphia consumer price index (CPI-U), (3) wages
and salaries and (4) the annual change in payroll employment (i.e., net job gains, excludes self-employed).
These variables motivate most General Fund revenue projections contained in the next section of this
report. Further technical details regarding the economic forecast can be found in the Appendix.
Statewide economic growth is typically measured by the change in real GDP, which represents the value
of all final goods and services produced by the state economy during a calendar year. For CY 2020, pre-
liminary data reveal a significant economic contraction (data through 2020 Q3). After CY 2020, the eco-
nomic forecast does not include a recession because the purpose of the analysis is to provide insights into
the long-term fiscal position of the Commonwealth and any potential structural surplus or deficit. By defi-
nition, the determination of a structural budget surplus or deficit assumes an economy that operates at
full-employment and excludes all one-time measures such as temporary borrowing, shifting of funds or
payment delays.
Table 3.2 displays published state economic and U.S. labor productivity data for recent quarters. Notable
trends include:
In 2020 Q3, real GDP growth offset much of the loss from the prior quarter.
Personal income recorded strong growth due to special unemployment compensation programs,
economic impact payments and Paycheck Protection Program (PPP) loans.2
For 2020 Q4, the latest data reveal year-over-year wage growth after two quarters of contraction.
The unemployment rate continues to improve, partly due to a contraction of the labor force.
2 The National Income and Product Accounts include PPP loans with Proprietor’s Income or Personal Dividend Income, which are part of state Personal Income. Those amounts include forgiven loans received by sole proprietors and part-nerships (Proprietor’s Income) and S corporations (Personal Dividend Income).
2019 2020 Q1 2020 Q2 2020 Q3 2020 Q4
Real GDP 2.4% -5.8% -34.0% 35.5% --
Personal Income 3.6% 2.5% 13.1% 9.6% --
Wages and Salaries 4.3% 3.3% -6.6% -2.6% 0.6%
Philadelphia CPI-U 2.0% 2.6% 0.0% 0.4% 0.9%
Unemployment Rate (level) 4.4% 5.4% 14.0% 10.4% 6.6%
Change Payroll Jobs (000s) 54 28 -849 -504 -460
Change Labor Force (000s) 68 92 -17 -134 -206
U.S. Labor Productivity 1.7% -0.3% 10.6% 4.6% --
Table 3.2
Recent Pennsylvania Economic Growth Rates or Change
Notes: Real GDP is quarterly annualized growth rate. Wage growth for 2020 Q3 and Q4 based on adjusted withholding.
Change in Payroll Jobs and Labor Force is change from prior year. Labor market data are not seasonally adjusted. U.S.
Labor Productivity for All Nonfarm Businesses is a quarterly annualized rate. State productivity data not published.
Sources: U.S. Bureau of Economic Analysis, U.S. Bureau of Labor Statistics.

Section 3: Economic Outlook | Page 11
For CY 2020, preliminary data show large gains in U.S. labor productivity, which is not unusual
during an economic downturn. Labor productivity often improves during recessions as businesses
reduce costs, adopt labor-saving technologies and ask workers who retain employment to do more.
The forecast assumes those productivity gains are not reversed.
A rapid recovery of wage growth has occurred despite the significant contraction in payroll employment
that remains in 2020 Q4 (-460,000 jobs, -7.5 percent from prior year). This outcome is attributable to the
fact that many unrecovered jobs share similar characteristics: low hourly wage rate, part-time and dispro-
portionately receive unreported tip income. Many of the unrecovered jobs are in the retail trade, food
service, accommodation and personal services sectors. This outcome is explored further in the subsections
that follow.
Federal Relief and Stimulus
In response to the COVID-19 pandemic, numerous federal programs have injected or will inject significant
funds into the state economy. Table 3.3 displays amounts for funds that have been received (CY 2020)
and estimates of additional monies that will flow to Pennsylvania residents and businesses (CY 2021), as
well as state unemployment compensation payments attributable to COVID-19.
Details regarding the federal programs are as follows:
State and federal unemployment compensation (UC) payments include (1) state UC pay-
ments, (2) Federal Pandemic Unemployment Compensation (FPUC) bonus payments, (3) federal
Pandemic Unemployment Assistance (PUA) for part-time, gig and other normally non-qualifying
workers and (4) other federal UC benefits including extended benefits, Lost Wage Assistance pay-
ments and the first week of unemployment for all affected workers.
The Consolidated Appropriations Act, 2021 (CAA), the most recent stimulus legislation, provides
FPUC bonus payments of $300 per week through the week ending March 13 (11 weeks). In CY
2020, FPUC payments were available for 16 weeks at $600 per week.
Federal UC programs, including PUA, will end by early April. After the week ending March 13, no
new claims for these programs will be accepted. State UC payments represent the entire calendar
year, and exclude typical state UC payments unrelated to the pandemic.
State UC claims peaked at 1.1 million claims in April 2020, and fell to nearly 341,000 by the end of
the calendar year. The IFO estimates continued claims will fall to 178,000 by the end of CY 2021.
PUA claims peaked at 3.4 million (includes weeks claimed retroactively) in July 2020, but fell to
nearly 500,000 in the final week of 2020. After an initial spike, the IFO projects the level of PUA
claims will return to this level by the end of 2021 Q1.
The first round of economic impact payments flowed to 6.6 million residents and totaled $11.0
billion in CY 2020. The second round ($600 per adult and dependents under age 17) began in early
January and the IFO projects total payments of $6.3 billion in CY 2021.
Commonwealth firms and non-profits received $20.7 billion of forgivable PPP loans in CY 2020:
$11.3 billion to pass through businesses (sole proprietors, partnerships, S corporations), $7.6 billion
to C corporations and $1.9 billion to non-profits. For CY 2021, the IFO projects another $11.2 billion
will be disbursed.

Section 3: Economic Outlook | Page 12
The Commonwealth received approval from the U.S. Department of Agriculture to issue emergency
allotments for Supplemental Nutrition Assistance Program (SNAP) recipients. This emer-
gency funding provides all SNAP households the maximum monthly benefit based on size of house-
hold. The amount for CY 2021 ($0.6 billion) represents six months (January through June) of
emergency benefits.
Direct state sup-
port reflects funds
allocated directly to
states for general
and targeted pro-
grammatic needs.
For CY 2020, $3.9
billion represents
general state aid
that was utilized in
FY 2019-20 and FY
2020-21.3 Compara-
ble aid was not in-
cluded in the CAA.
Projections for CY
2021 include tar-
geted funding for
education ($2.4 bil-
lion), health ($829
million), transporta-
tion ($416 million)
and human services ($327 million).
Direct local support reflects funds allocated directly to local governments and includes $1.0
billion in general aid and $1.0 billion in transit agency support in CY 2020. As with direct state
support, no funds were included for general local aid in CY 2021. Targeted funds for public transit
($451 million) and rental assistance programs ($278 million) provided to local housing authorities
compose most of the projected amount for CY 2021.
Other support was authorized by the federal government for CY 2020 and CY 2021. Funds were
awarded directly to healthcare providers, educational institutions, non-profits and specific industry
partners. For CY 2021, Pennsylvania allocations have not all been released at this time.
3 The state support amount does not include federal funds associated with the temporary increase in the Federal Medical Assistance Percentage (FMAP) used to reimburse states for Medicaid program costs (effective January 1, 2020 until the termination of the national public health emergency declaration).
2020 2021
Payments to Individuals
State Unemployment Compensation $5.2 $1.6
Federal Pandemic Unemployment Comp (FPUC) 16.2 3.6
Pandemic Unemployment Assistance (PUA) 7.0 1.2
Other Federal Assistance 3.3 0.8
SNAP Benefits 0.9 0.6
Economic Impact Payments 11.0 6.3
Total 43.6 14.2
Other Federal Programs
Paycheck Protection Program (PPP) $20.7 $11.2
Direct State Support 5.9 4.6
Direct Local Support 2.5 0.8
Other Support 4.7 0.8
Table 3.3
Federal Relief Extended to CY 2021
Note: Figures in dollar billions.

Section 3: Economic Outlook | Page 13
Payroll Employment
Since the onset of the pandemic, the Pennsylvania labor market has partially recovered, but the pace has
slowed in recent months. In April 2020, payroll employment contracted by 1.06 million jobs (-17.5 percent,
excludes self-employed) relative to April 2019. (See Table 3.4. Data are not seasonally adjusted.) By
August, more than half of the lost jobs had been recovered, mainly in the construction, retail trade,
healthcare and food service sectors. During the next three months, another 46,000 payroll jobs (prelimi-
nary) were recovered, and the latest published data for November show a contraction in payroll employ-
ment of 455,000 (-7.4 percent) from the prior year. The data show that:
By far, the largest sector affected is accommodations-food service with 115,000 (-24.3 percent)
fewer payroll jobs.
The education sector (excludes local school districts) has not recovered since last April. Many lost
jobs were at colleges and universities.
The government sector shows more contraction in recent months. This is mainly due to local gov-
ernments (both municipal and local school districts) and federal jobs, due to the end of the Census
that employed roughly 9,000 state residents, most in a part-time capacity.
Recovery for the transportation-warehousing and financial-real estate sectors.
Apr Aug Nov Apr Aug Nov
Total -1,062 -502 -455 -17.5% -8.3% -7.4%
Construction -104 -16 -7 -40.1 -6.0 -2.7
Manufacturing -77 -39 -37 -13.3 -6.7 -6.5
Retail and Wholesale Trade -155 -72 -62 -18.9 -8.7 -7.3
Transport and Warehouse -27 -22 1 -9.1 -7.5 0.2
Financial and Real Estate -3 0 -1 -0.9 0.0 -0.3
Professional and Technical -21 -18 -18 -5.8 -5.0 -4.8
Admin and Waste Management -53 -34 -36 -16.8 -10.7 -10.8
Education (excludes local SD) -42 -12 -38 -16.1 -5.9 -14.5
Healthcare-Social Assistance -120 -50 -34 -11.4 -4.7 -3.2
Arts-Entertainment -58 -32 -19 -60.9 -25.5 -21.4
Accomm-Food Service -280 -140 -115 -58.6 -28.6 -24.3
Other Services -86 -36 -34 -32.8 -13.4 -12.9
All Government -17 -7 -33 -2.3 -1.0 -4.5
All Other -21 -23 -23 -8.2 -9.2 -8.9
Source: U.S. Bureau of Labor Statistics, CES State and Metro Area Employment.
Table 3.4
2020 Payroll Employment Recovers Quickly, but Recently Decelerates
YOY Number Change (000s) YOY Percent Change
Note: Data are not seasonally adjusted. Figures for November are preliminary. YOY is year-over-year.
Section 3: Economic Outlook | Page 14
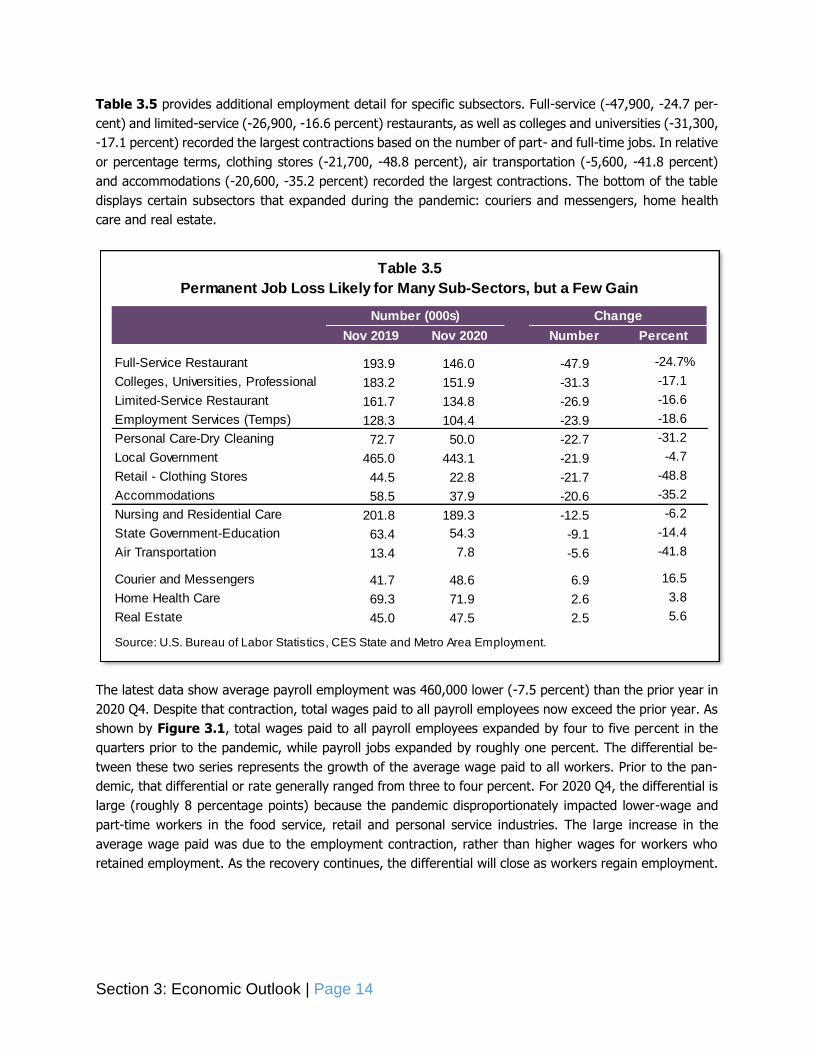
Table 3.5 provides additional employment detail for specific subsectors. Full-service (-47,900, -24.7 per-
cent) and limited-service (-26,900, -16.6 percent) restaurants, as well as colleges and universities (-31,300,
-17.1 percent) recorded the largest contractions based on the number of part- and full-time jobs. In relative
or percentage terms, clothing stores (-21,700, -48.8 percent), air transportation (-5,600, -41.8 percent)
and accommodations (-20,600, -35.2 percent) recorded the largest contractions. The bottom of the table
displays certain subsectors that expanded during the pandemic: couriers and messengers, home health
care and real estate.
The latest data show average payroll employment was 460,000 lower (-7.5 percent) than the prior year in
2020 Q4. Despite that contraction, total wages paid to all payroll employees now exceed the prior year. As
shown by Figure 3.1, total wages paid to all payroll employees expanded by four to five percent in the
quarters prior to the pandemic, while payroll jobs expanded by roughly one percent. The differential be-
tween these two series represents the growth of the average wage paid to all workers. Prior to the pan-
demic, that differential or rate generally ranged from three to four percent. For 2020 Q4, the differential is
large (roughly 8 percentage points) because the pandemic disproportionately impacted lower-wage and
part-time workers in the food service, retail and personal service industries. The large increase in the
average wage paid was due to the employment contraction, rather than higher wages for workers who
retained employment. As the recovery continues, the differential will close as workers regain employment.
Nov 2019 Nov 2020 Number Percent
Full-Service Restaurant 193.9 146.0 -47.9 -24.7%
Colleges, Universities, Professional 183.2 151.9 -31.3 -17.1
Limited-Service Restaurant 161.7 134.8 -26.9 -16.6
Employment Services (Temps) 128.3 104.4 -23.9 -18.6
Personal Care-Dry Cleaning 72.7 50.0 -22.7 -31.2
Local Government 465.0 443.1 -21.9 -4.7
Retail - Clothing Stores 44.5 22.8 -21.7 -48.8
Accommodations 58.5 37.9 -20.6 -35.2
Nursing and Residential Care 201.8 189.3 -12.5 -6.2
State Government-Education 63.4 54.3 -9.1 -14.4
Air Transportation 13.4 7.8 -5.6 -41.8
Courier and Messengers 41.7 48.6 6.9 16.5
Home Health Care 69.3 71.9 2.6 3.8
Real Estate 45.0 47.5 2.5 5.6
Source: U.S. Bureau of Labor Statistics, CES State and Metro Area Employment.
Table 3.5
Permanent Job Loss Likely for Many Sub-Sectors, but a Few Gain
Number (000s) Change

Section 3: Economic Outlook | Page 15
After CY 2021, payroll employment continues to recover, but the analysis assumes that it will not fully
recover until CY 2026 due to the severity of the COVID-19 recession. Figure 3.2 displays the decline in
payroll employment relative to the pre-recession peak for the three prior recessions and the COVID-19
recession. In terms of employment, the data show that the 1990 and 2001 recessions were relatively mild,
as payroll employment contracted by roughly 2 percent. The housing and financial crisis of 2008 was more
severe as payroll employment contracted by more than 4 percent and required six years to revert to the
pre-recession peak. At the start of the COVID-19 recession, Pennsylvania payroll employment contracted
immediately by 1.1 million jobs and the analysis assumes that payroll employment will also require six years
to revert to the pre-recession level.
Figure 3.1
Wage and Jobs Growth
Note: Grow th rates are year-over-year.
Source: U.S. Bureau of Labor Statistics. Forecast by IFO.
-15%
-10%
-5%
0%
5%
10%
2018.2 2018.4 2019.2 2019.4 2020.2 2020.4 2021.2 2021.4
totalwages paid
payroll
jobs
-14.0%
-6.4%
Figure 3.2
Years Needed for Full Jobs Recovery
Source: U.S. Bureau of Labor Statistics, CES State and Metro Area Employment.
-20%
-16%
-12%
-8%
-4%
0%
0 1 2 3 4 5 6
Number of Years Since Peak Employment
percent change in PA payrollemployment from
pre-recession peak month
2001
1990
2008
2020
Apr 2020
Aug 2020
forecast

Section 3: Economic Outlook | Page 16
Labor Force Trends
Table 3.6 displays selected metrics for the Pennsylvania labor market. The top part of the table displays
data and trends for 2010, 2015 and 2020 (preliminary). These data points show that:
In CY 2020, average payroll employment will be roughly the same as CY 2010.
The labor force is the number of residents age 16 or older who work or seek employment. That
metric increased over the past decade, driven by (1) a larger share of residents age 20 to 64 who
work and (2) a much higher share of residents age 65 to 74 who work (not shown in table).
The labor force participation rate is the share of residents age 16 or older who work or seek
employment. Over the past decade, that ratio declined by 1.0 percentage point and nearly all of
the reduction occurred in CY 2020 due to the COVID-19 pandemic. (Value was 63.2 for CY 2019.)
Due to the contraction of working-age residents (see Demographic Outlook section), overall labor force
participation rates must increase to allow the number and supply of workers to grow in the Commonwealth.
For state residents age 65 and older, labor force participation rates increased dramatically from 2010 (16.5
percent) to 2015 (18.8 percent) and 2019 (21.4 percent, 2020 data not published). Currently, it is unknown
how the COVID-19 pandemic has affected job prospects and employment levels for residents age 65 or
older. Anecdotal news stories suggest that older workers near retirement may have departed the labor
force earlier than intended due in part to the pandemic.
The bottom portion of Table 3.6 shows recent data for three quarters and the change from the prior year.
These data points show that:
Payroll employment increased by 41,000 jobs in 2019 Q4 and the unemployment rate was low (4.4
percent). However, that low rate was still higher than the prior year (3.7 percent) and the rate
increased due to a large influx of residents into the labor force seeking employment (107,000).
Compared to the prior year, 2020 Q2 recorded a severe contraction of 849,000 payroll jobs, an
average unemployment rate of 14.0 percent and modest change in the labor force and labor force
participation rate.
Compared to the prior year, 2020 Q4 recorded a dramatic contraction in payroll employment
(-460,000), labor force (-206,000) and labor force participation rate (-1.9 percentage points).
These data are preliminary and will be revised.
These last two trends can impact future economic growth in various ways. If workers permanently exit the
labor force, it could create labor supply constraints. It could also be the case that former two-earner house-
holds decide that a spouse or partner will remain at home to school children and/or provide care for elderly
parents who prefer not to reside in nursing homes. In general, that outcome would translate to lower
economic growth as those family units reduce consumption in response to the lower income stream.

Section 3: Economic Outlook | Page 17
Income Trends
The COVID-19 pandemic had significant implications for the amount and type of income received by state
residents. For the purpose of the economic and revenue forecast, the IFO constructs an income concept
called Pennsylvania Cash Income that includes all types of income received by state residents that can be
spent or saved such as wages, business income, capital income (capital gains, interest, dividends and rent),
retirement income (e.g., Social Security, pensions received, IRA disbursements) and income assistance
(SSI, veterans benefits, unemployment compensation, SNAP, refundable tax credits).4 Unlike state Personal
Income published by the U.S. Bureau of Economic Analysis, it does not include imputed dividend, rent and
interest income, but does include capital gains.
Preliminary data for CY 2020 suggest that federal programs more than backfilled wage, business or capital
income that was lost through business closures and layoffs. (See Figure 3.3.) It should be noted that
amounts for income assistance, retirement and wage income are largely known, but figures for business
and capital income are estimates based on limited data. Final data for CY 2020 will not be available until
tax returns are filed and tabulated in mid-2022.
4 Due to lack of reliable data, Cash Income does not include unreported tip income, and that income source likely declined precipitously in CY 2020. Cash Income does include estimates for other income that is not reported on tax returns based on IRS Tax Gap studies. See https://www.irs.gov/pub/irs-pdf/p1415.pdf for the latest IRS study used by the IFO to impute unreported income by source.
2010 2015 2020 2010-15 2015-20 2010-20
Payroll Employment (000s) 5,622 5,835 5,618 213 -217 -4
Labor Force (000s) 6,381 6,413 6,425 32 12 44
Labor Force Participation Rate (%) 63.5 62.8 62.5 -0.7 -0.3 -1.0
2019.4 2020.2 2020.4 2019.4 2020.2 2020.4
Payroll Employment (000s) 6,135 5,230 5,675 41 -849 -460
Labor Force (000s) 6,535 6,437 6,329 107 -17 -206
Labor Force Participation Rate (%) 63.5 62.5 61.6 0.9 -0.3 -1.9
Unemployment Rate (%) 4.4 14.0 6.4 0.7 10.1 2.0
Source: U.S. Bureau of Labor Statistics.
Table 3.6
Pennsylvania Employment and Labor Force Trends
Annual Average Change
Quarterly Average Change from Prior Year

Section 3: Economic Outlook | Page 18
Recent trends in Cash Income include:
In CY 2020, wage income fell by $5 billion and the forecast assumes that business-capital income
fell by an estimated $8 billion. Unreported tip income is not included in these figures and forgivable
PPP loans are included with income assistance and not business income.
Retirement and savings income increased by $6 billion. Income assistance increased by $59 billion.5
Overall Cash Income increased to $679 billion, a net gain of $52 billion (8.3 percent). This repre-
sents the strongest Cash Income growth since CY 1998 and is the primary factor that motivates
the 2.6 percent increase (adjusted for shifts and one-time transfers) in General Fund revenues for
the first six months of the fiscal year.
For CY 2021, the analysis projects a reduction in Cash Income (-$5 billion, -0.8 percent) due to the
phase-out of federal programs. As noted, that outcome assumes that further federal stimulus is
not enacted.
5 For CY 2020, income assistance includes PPP loans to pass through entities ($11.3 billion) and non-profits ($1.9 billion) only (excludes C corporations). For published figures in the U.S. Bureau of Economic Analysis’ National Income and Product Accounts (NIPA), those amounts will be included in Proprietor’s Income (sole proprietors and partnerships) or corporate profits (S corporations). The analysis assumes that all loans are forgiven for CY 2020 and CY 2021.
Figure 3.3
Pennsylvania Cash Income
Source: Cash Income uses data published by various federal and state agencies. For a description, see the IFO Official
Revenue Estimate Methodology released July 2020 and posted to the IFO website.
-$40
-$20
$0
$20
$40
$60
$80
wages-$5b
businessand capital
-$8b
retirement& savings
+$6b
income assistance:UC +$32bimpact pay +$11bPPP +$13bother +$3b
2021 Cash Income$674 billion-$5b | -0.8%
+$17b+$9b
+$3b
-$34b
2020 Cash Income$679 billion
+$52b | +8.3%

Section 3: Economic Outlook | Page 19
Financial Trends
The economics section concludes with financial and consumer debt data. Overall, CY 2020 was a solid year
for equity and housing markets. Table 3.7 shows year-over-year growth rates for the latest four quarters
and the CY 2020 annual average. Notable results include:
The S&P 500 Index increased in all four quarters and was up 8.8 percent for the year (annual
average based on month-end values).
Preliminary dividend data for the S&P 500 was down in third and fourth quarters but flat for all of
CY 2020.
The Pennsylvania Home Price Index published by the Federal Housing Finance Agency (purchase
transactions only) showed very strong gains for 2020 Q3 (8.0 percent) relative to the prior year.
Per capita consumer debt data from the New York Federal Reserve Board reveal unexpected re-
ductions in credit card and home equity line of credit debt for Pennsylvania consumers.
Mortgage debt more than 90 days delinquent declined due to the entry of distressed homeowners
into the federal mortgage forbearance program. Those mortgages are not considered delinquent.
Part of the recent reduction in home equity line of credit (open-ended) debt is attributable to the pandemic
as lenders are less willing to make those loans in downturns or times of economic uncertainty. However,
even before the onset of the pandemic, that category of debt had been contracting.
Overall, these data suggest solid fundamentals for most consumers that own homes. Less reliable data are
available for renters. One of the risks to the near-term economic forecast is the expiration of the renter
eviction moratorium, and how missed payments impact landlords and the long-term rental market.
2020.1 2020.2 2020.3 2020.4 2020
S&P 500 Index 10.9% 0.3% 11.9% 12.0% 8.8%
S&P 500 Dividends 6.8% 0.0% -6.5% -0.8% -0.2%
PA Home Price Index 5.1% 4.5% 8.0% n.a. 5.9%
PA Per Capita Consumer Debt
Auto Loan 6.1% -1.7% 1.9% n.a. n.a.
Credit Card 1.3% -8.2% -8.9% n.a. n.a.
Primary Mortgage 4.7% 2.1% 0.2% n.a. n.a.
Home Equity Line of Credit -8.0% -10.7% -11.9% n.a. n.a.
Student Loan 3.9% 3.3% 0.9% n.a. n.a.
% Mortgage Debt Delinquent 1.07 0.87 0.78 n.a. n.a.
Table 3.7
Financial and Consumer Data
Year-Over-Year Growth
Note: Average gain in Home Price Index for 2020 based on first three quarters of year. Primary mortgage includes
closed-end home equity loans. Delinquent mortgage debt is more than 90 days late.
Source: Wall Street Journal, Yardeni.com, Federal Housing Finance Agency and Federal Reserve Board of New York.

Section 3: Economic Outlook | Page 20
- This page intentionally left blank. -
Section 4: Revenue Outlook | Page 21
Section 4: Revenue Outlook
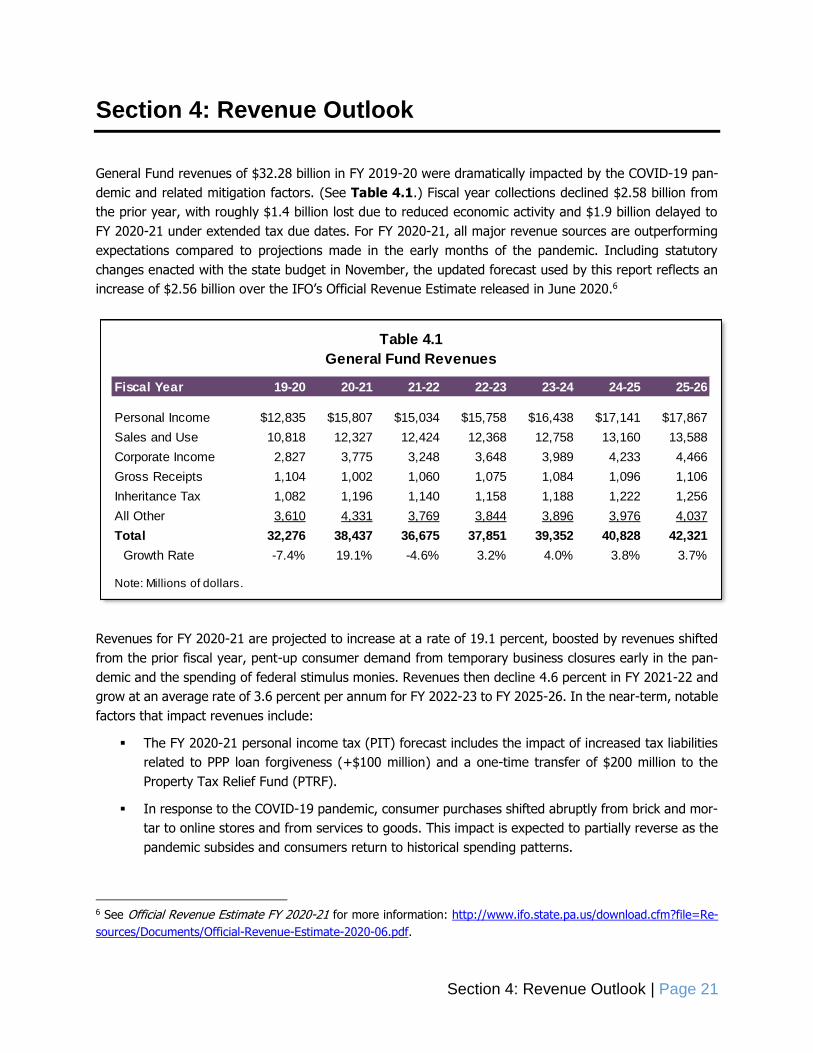
General Fund revenues of $32.28 billion in FY 2019-20 were dramatically impacted by the COVID-19 pan-
demic and related mitigation factors. (See Table 4.1.) Fiscal year collections declined $2.58 billion from
the prior year, with roughly $1.4 billion lost due to reduced economic activity and $1.9 billion delayed to
FY 2020-21 under extended tax due dates. For FY 2020-21, all major revenue sources are outperforming
expectations compared to projections made in the early months of the pandemic. Including statutory
changes enacted with the state budget in November, the updated forecast used by this report reflects an
increase of $2.56 billion over the IFO’s Official Revenue Estimate released in June 2020.6
Revenues for FY 2020-21 are projected to increase at a rate of 19.1 percent, boosted by revenues shifted
from the prior fiscal year, pent-up consumer demand from temporary business closures early in the pan-
demic and the spending of federal stimulus monies. Revenues then decline 4.6 percent in FY 2021-22 and
grow at an average rate of 3.6 percent per annum for FY 2022-23 to FY 2025-26. In the near-term, notable
factors that impact revenues include:
The FY 2020-21 personal income tax (PIT) forecast includes the impact of increased tax liabilities
related to PPP loan forgiveness (+$100 million) and a one-time transfer of $200 million to the
Property Tax Relief Fund (PTRF).
In response to the COVID-19 pandemic, consumer purchases shifted abruptly from brick and mor-
tar to online stores and from services to goods. This impact is expected to partially reverse as the
pandemic subsides and consumers return to historical spending patterns.
6 See Official Revenue Estimate FY 2020-21 for more information: http://www.ifo.state.pa.us/download.cfm?file=Re-
sources/Documents/Official-Revenue-Estimate-2020-06.pdf.
Fiscal Year 19-20 20-21 21-22 22-23 23-24 24-25 25-26
Personal Income $12,835 $15,807 $15,034 $15,758 $16,438 $17,141 $17,867
Sales and Use 10,818 12,327 12,424 12,368 12,758 13,160 13,588
Corporate Income 2,827 3,775 3,248 3,648 3,989 4,233 4,466
Gross Receipts 1,104 1,002 1,060 1,075 1,084 1,096 1,106
Inheritance Tax 1,082 1,196 1,140 1,158 1,188 1,222 1,256
All Other 3,610 4,331 3,769 3,844 3,896 3,976 4,037
Total 32,276 38,437 36,675 37,851 39,352 40,828 42,321
Growth Rate -7.4% 19.1% -4.6% 3.2% 4.0% 3.8% 3.7%
Table 4.1
General Fund Revenues
Note: Millions of dollars.

Section 4: Revenue Outlook | Page 22
A new transfer from sales and use tax (SUT) to the Public Transportation Trust Fund (PTTF) begins
in FY 2022-23. For that year, the forecast projects a transfer of $469 million and that increases to
$515 million in FY 2025-26.
Corporate net income tax (CNIT) revenues are significantly impacted by the federal tax treatment
of certain provisions enacted under the CARES Act (i.e., deductibility of expenses paid with PPP
loans and the ability to defer certain 2020 employer payroll taxes).
The primary determinant of revenue growth for FY
2020-21 is the rate of economic recovery after
COVID-related temporary business closures in the
spring of 2020. Table 4.2 contains a comparison
of year-over-year growth rates for the first and
last six months of CY 2020. Delayed tax due dates
implemented to mitigate the impact of the pan-
demic on Pennsylvania taxpayers shifted signifi-
cant amounts of revenue to the second half of the
calendar year ($1.9 billion). For purposes of this
comparison, growth rates are adjusted to reverse
the shift, as well as to exclude the impact of one-
time transfers or extra due dates (i.e., Wednes-
days for employer withholding).
The table illustrates the dramatic contraction of
revenue during the first six months of CY 2020.
(Note: Year-over-year inheritance tax growth of
28 percent for January to March 2020 was more
than sufficient to offset the decline in revenues
during the three following months, yielding a
growth rate of roughly 11 percent for the period.) The revenue declines were most notable in the motor
vehicle SUT, CNIT and realty transfer taxes, with subsequent recovery in the second half of CY 2020. The
recovery in motor vehicle SUT and realty transfer taxes was primarily driven by pent-up demand resulting
from the cessation of most sales of vehicles and housing in the spring.
The text that follows provides a brief discussion of revenue trends and the outlook for three of the largest
General Fund revenue sources. The final subsection provides an overview of other revenue sources. His-
torical data for General Fund revenues can be found in the Appendix.
Personal Income Tax
Projected PIT revenues of $15.81 billion for FY 2020-21 are $428 million higher than the IFO’s Official
Estimate and are expected to increase at a rate of 23.2 percent over the prior fiscal year. (See Table 4.3.)
The increase is due largely to $1.34 billion in quarterly and annual payments ($440 million and $895 million,
respectively) that were shifted from the prior year. In addition, FY 2020-21 reflects increased tax liabilities
related to PPP loan forgiveness (+$100 million to annuals) and a transfer to the PTRF (-$200 million to
withholding) in accordance with Act 114 of 2020.
Jan-June July-Dec
PIT - Withholding -1.1% -1.0%
PIT - Other -5.6 -6.4
Sales - Non-Motor -2.4 3.8
Sales - Motor Vehicle -21.5 16.6
Corporate Net Income -11.6 12.2
Inheritance 10.9 -3.4
Realty Transfer -15.7 12.8
All Other Tax -10.3 2.5
All Non-Tax -9.6 -11.7
Total -5.2 2.6
Table 4.2
CY 2020 General Fund Revenue Growth
Note: Growth rates adjusted to reverse the shift of
revenues to FY 2020-21, as well as the impact of one-
time transfers or extra due dates (i.e., Wednesdays for
employer withholding).

Section 4: Revenue Outlook | Page 23
The PIT forecast normalizes (declines 4.9 percent) in FY 2021-22, followed by average growth of 4.4 per-
cent per annum for FY 2022-23 to FY 2025-26. Wages and withholding tax revenues are expected to
increase by 2.8 percent for FY 2020-21, and at an average rate of 4.0 percent per annum for FY 2022-23
to FY 2025-26. Non-withholding revenues expand at a faster pace (5.7 percent per annum) over the same
period.
Sales and Use Tax
The FY 2020-21 SUT estimate reflects an increase of $875 million from the IFO’s official projection due to
strength in both non-motor and motor vehicle collections. (See Table 4.4.) Particularly in the early months
of the fiscal year, consumer spending was boosted by the first round of economic impact payments, FPUC
bonus payments and pent-up demand resulting from temporary business closures. The pandemic also
produced a sudden shift in behavior as consumers purchased more goods online (as opposed to brick and
mortar stores) and fewer services. The forecast assumes that consumers partially return to historical spend-
ing patterns in the short term, but online sales continue to increase over time. For motor SUT, the response
to the impact of the COVID-19 pandemic caused an overall decline in the number of U.S. car sales (ap-
proximately -15 percent year-over-year) in CY 2020, but car sales are expected to recover in CY 2021. The
average price of vehicles is expected to increase at a rate of 2.1 percent per annum from CY 2020 to CY
2025.
For FY 2022-23 to FY 2025-26, the forecast projects that SUT will expand at an average rate of 2.3 percent
per annum, which is restrained due to a new transfer to the PTTF. The new transfer begins in FY 2022-23
and is estimated to be $469 million for that fiscal year and increase to $515 million in FY 2025-26.7 The
forecast projects that non-motor vehicle revenues will expand at a rate of 2.4 percent per annum for the
same period. If the new PTTF transfer is excluded, then the average growth rate increases to 3.4 percent
per annum. For motor vehicles, revenues expand at an average rate of 1.1 percent per annum for FY 2022-
23 to FY 2025-26.
7 The transfer is equal to the greater of (1) the ratio of $450 million to FY 2020-21 sales tax receipts multiplied by current year sales tax receipts or (2) $450 million.
Fiscal Year 19-20 20-21 21-22 22-23 23-24 24-25 25-26
Withholding $10,543 $10,837 $11,313 $11,785 $12,248 $12,725 $13,221
Quarterly 1,529 2,289 2,099 2,230 2,351 2,476 2,603
Annuals 764 2,681 1,622 1,744 1,839 1,940 2,043
Total Revenue 12,835 15,807 15,034 15,758 16,438 17,141 17,867
Growth Rate -8.9% 23.2% -4.9% 4.8% 4.3% 4.3% 4.2%
Note: Millions of dollars.
Personal Income Tax Revenue
Table 4.3

Section 4: Revenue Outlook | Page 24
Corporate Net Income Tax
The forecast projects that CNIT revenues grow 33.5 percent to $3,775 million in FY 2020-21, an increase
of $586 million from the IFO’s Official Estimate. After declining 13.9 percent in FY 2021-22, revenues are
projected to expand at an average growth rate of 8.3 percent per annum for the remainder of the forecast
period. (See Table 4.5.)
Revenues over the forecast horizon are influenced by corporate profits growth and tax provisions enacted
in response to the COVID-19 pandemic designed to soften negative shocks to business activity. In the short
term (FY 2020-21 to FY 2023-24), revenues fluctuate as a result of tax provisions including:
The extension of the due date for most tax year 2019 final payments to August 14, 2020, which
shifted an estimated $375 million in CNIT collections from FY 2019-20 to FY 2020-21.
A law change in the CAA allowing for deduction of expenses paid with forgiven PPP loans. This
recent change may have resulted in overpayments to the extent that firms had assumed that these
expenses were not deductible when making tax year 2020 estimated payments.
The ability to defer certain 2020 employer payroll taxes to December 2021 and December 2022.
The increased limit on business interest expense deductions.
Several other minor provisions that reduce short-term tax liability for impacted businesses.
Long-term revenue growth (FY 2024-25 to FY 2025-26), is influenced by economic trends and is consistent
with long-term profits growth for non-recessionary periods.
Fiscal Year 19-20 20-21 21-22 22-23 23-24 24-25 25-26
Non-Motor $9,453 $10,640 $10,799 $10,771 $11,127 $11,496 $11,890
Motor 1,365 1,687 1,626 1,598 1,631 1,664 1,698
Total Revenue 10,818 12,327 12,424 12,368 12,758 13,160 13,588
Growth Rate -2.5% 13.9% 0.8% -0.5% 3.2% 3.2% 3.2%
Note: Millions of dollars.
Table 4.4
Sales and Use Tax Revenue

Section 4: Revenue Outlook | Page 25
Other Revenue Sources
Other notable trends that affect General Fund revenues include the following:
Cigarette tax revenues are assumed to be reduced by $115 million annually for debt service related
to the Tobacco Settlement Bonds.
The gaming estimate assumes that the second Philadelphia category 2 facility will open in February
2021 and will increase table game revenues by $2 million in FY 2020-21.
The licenses and fees estimate for FY 2020-21 includes the impact of sports betting ($30 million),
iGaming ($10 million) and two category 4 table game fees ($5 million).
Other miscellaneous collections for FY 2020-21 include one-time transfers from special funds ($431
million) and the Budget Stabilization Fund ($100 million) authorized under Act 114 of 2020.
The estimates assume that $185 million will be available annually for transfer from the State Stores
Fund to the General Fund.
Fiscal Year 19-20 20-21 21-22 22-23 23-24 24-25 25-26
Total Revenue $2,827 $3,775 $3,248 $3,648 $3,989 $4,233 $4,466
Growth Rate -16.8% 33.5% -13.9% 12.3% 9.3% 6.1% 5.5%
Note: Millions of dollars.
Table 4.5
Corporate Net Income Tax Revenue

Section 4: Revenue Outlook | Page 26
Fiscal Year 19-20 20-21 21-22 22-23 23-24 24-25 25-26
Accelerated Deposits $4 $0 $0 $0 $0 $0 $0
Utility Property 38 38 39 39 39 40 40
Insurance Premiums 474 424 456 464 468 503 508
Financial Institutions 393 382 402 419 438 457 477
Cigarette 924 936 863 826 789 754 720
Other Tobacco Products 127 130 134 137 140 143 146
Malt Beverage 23 23 24 24 24 24 24
Liquor 366 412 429 446 464 482 501
Realty Transfer 498 585 594 613 633 654 682
Gaming 143 223 262 290 297 307 321
Minor and Repealed -44 -44 -58 -60 -62 -65 -69
Liquor Store Profits 185 185 185 185 185 185 185
Licenses, Fees & Misc. 412 966 370 389 408 416 425
Fines, Penalties & Int. 68 69 71 73 74 76 76
Total Revenue 3,610 4,331 3,769 3,844 3,896 3,976 4,037
Growth Rate -19.4% 20.0% -13.0% 2.0% 1.4% 2.1% 1.5%
Note: Millions of dollars.
Table 4.6
Other General Fund Revenue Sources

Section 5: Expenditure Outlook | Page 27
Section 5: Expenditure Outlook
For FY 2020-21, total General Fund appropriations are $33.14 billion, a $949 million decrease (-2.8 percent)
over FY 2019-20.8 However, the FY 2020-21 budget utilizes $1.33 billion from the Coronavirus Aid, Relief,
and Economic Security (CARES) Act Coronavirus Relief Fund (CRF) to temporarily reduce state General
Fund expenditures in the Department of Criminal Justice (DCJ, $1.06 billion), Pennsylvania State Police
(PSP, $226 million), Department of Human Services (DHS, $30 million) and Department of Health (DOH,
$14 million). These amounts are in addition to $2.07 billion in federal matching funds provided to DHS for
Medical Assistance programs in FY 2020-21.
The projections throughout most of this section represent General Fund appropriations required to maintain
the same level of services provided in the FY 2020-21 base year. Unless otherwise noted, the analysis
assumes that FY 2020-21 expenditures supported by funds such as federal funds and other state funds or
user fees (sometimes referred to as augmentations) continue to receive support from those sources. An
exception occurs when it is clear that the funding source will be unable to provide the same level of relative
support in future years. A primary example of this type of funding source is the CARES Act CRF and other
federal stimulus dollars. These funds are currently not assumed to be available in FY 2021-22 for General
Fund use, and as a result, it is assumed that General Fund state dollars will be used to replace these funds.
Other instances of funding sources not able to maintain the same level of support are described in greater
detail in the relevant subsections that follow, as well as the Other Funds subsection in the Appendix.
From FY 2020-21 to FY 2021-22, General Fund expenditures are expected to increase by $4.83 billion (14.6
percent). In addition to $3.4 billion in federal stimulus funds (e.g., CARES Act CRF and enhanced federal
matching rate for Medical Assistance), other significant factors include:
The use of one-time funding and other measures to reduce DHS expenditures in FY 2020-21 that
will not be available in FY 2021-22, including a transfer from the Pennsylvania Professional Liability
Joint Underwriting Association ($200 million) and a short-term managed care payment shift ($480
million).
A temporary reduction in agency payments to the Pennsylvania Employees Benefit Trust Fund
(PEBTF) for the Retirement Employee Health Program (REHP) ends in FY 2020-21.
For FY 2022-23 to FY 2025-26, General Fund expenditures are projected to increase at an average rate of
3.1 percent per annum. The overall trends in the out years are driven by the DHS and the Department of
Education (PDE), as those two agencies comprise approximately 80 percent of total General Fund expend-
itures. Three factors motivate the trends in total expenditures:
Service populations that expand or contract (e.g., school-age children).
The growth of employee wages, pensions and employee and retiree healthcare.
Various inflation adjustments that maintain the purchasing power of funds appropriated in the base
year for all future years.
8 The text in this section uses the terms appropriation and expenditure interchangeably. However, the spending au-thority granted to a particular department or agency (i.e., the appropriation) need not equal actual expenditures for that year. Unused spending authority is reflected as a lapse that reduces budget shortfalls or increases budget sur-pluses.

Section 5: Expenditure Outlook | Page 28
Tables 5.1 and 5.2 provide detail based on department and expenditure category. Notable factors not
mentioned above include:
The State Employee Retirement System (SERS) and Pennsylvania School Employee Retirement
System (PSERS) contribution growth rates continue to moderate after many years of significant
growth. For FY 2022-23 to FY 2025-26, the average growth rate of SERS contributions is estimated
to grow modestly at 0.8 percent per annum while PSERS per annum growth rate is 5.1 percent.
The increase in FY 2021-22 is due to the use of temporary federal funds to pick up the costs of
certain state personnel expenses, including pension costs.
Pre-K to Grade 12 expenditures grow modestly due to contraction of the school-age population.
The uptick in growth for FY 2023-24 (3.7 percent) is due to the return of the authority rentals and
sinking fund requirements (commonly known as PlanCon reimbursements, discussed further in the
education subsection).
The strong growth rate in the All Other line item in FY 2024-25 followed by a decline in the growth
rate in FY 2025-26 is due to a FY 2024-25 repayment of a $165 million transfer originally from the
Workers’ Compensation Security Fund to the General Fund in May 2017.
The Appendix provides more details on the general methodology for the various extrapolators used to
project future years. The remainder of this section details (1) the differences between the current service
versus cost-to-carry baselines, (2) general fund pensions, (3) general fund debt service, (4) more details
on DHS, PDE and DCJ and (5) a brief discussion of other agencies.
Fiscal Year 19-20 20-21 21-22 22-23 23-24 24-25 25-26
Amount
Education1 $14,378 $14,433 $14,753 $15,154 $15,732 $16,104 $16,523
Human Services 12,593 12,683 15,677 16,254 16,808 17,384 17,953
Criminal Justice2 2,616 1,612 2,694 2,788 2,852 2,908 2,976
Treasury 1,197 1,235 1,283 1,321 1,387 1,417 1,514
All Other 3,306 3,177 3,568 3,706 3,807 4,063 4,005
Total Expenditures 34,090 33,141 37,975 39,223 40,586 41,877 42,971
Growth Rates
Education1 4.6% 0.4% 2.2% 2.7% 3.8% 2.4% 2.6%
Human Services -1.6 0.7 23.6 3.7 3.4 3.4 3.3
Criminal Justice2 2.1 -38.4 67.1 3.5 2.3 2.0 2.3
Treasury 2.8 3.2 3.9 2.9 5.0 2.2 6.9
All Other 5.8 -3.9 12.3 3.9 2.7 6.7 -1.4
Total Expenditures 2.1 -2.8 14.6 3.3 3.5 3.2 2.6
1 Includes the State System of Higher Education and Thaddeus Stevens College of Technology.
2 Includes the Department of Corrections and the Board of Probation and Parole.
Table 5.1
General Fund Expenditures by Agency
Note: Millions of dollars.

Section 5: Expenditure Outlook | Page 29
Fiscal Year 19-20 20-21 21-22 22-23 23-24 24-25 25-26
Expenditure Type
Wages1 $2,579 $1,948 $2,781 $2,889 $2,966 $3,044 $3,125
Pensions (SERS/PSERS) 3,505 3,352 3,747 3,962 4,114 4,235 4,404
Healthcare/Benefits2 952 631 989 1,040 1,091 1,144 1,200
Pre-K-12 Education3 10,239 10,223 10,402 10,607 11,003 11,201 11,418
Medical Assistance 3,785 3,934 5,132 5,339 5,544 5,772 5,996
Long-Term Living 3,307 3,330 4,472 4,648 4,825 5,001 5,166
Intellectual Disability 1,997 1,962 2,312 2,381 2,452 2,526 2,602
Other Human Services 2,843 2,880 3,145 3,243 3,329 3,415 3,502
Debt Service 1,144 1,182 1,227 1,263 1,328 1,356 1,452
All Other 3,741 3,698 3,768 3,850 3,934 4,184 4,106
Total Expenditures 34,090 33,141 37,975 39,223 40,586 41,877 42,971
Growth Rates
Wages1 -24.4% 42.7% 3.9% 2.7% 2.6% 2.6%
Pensions (SERS/PSERS) -4.4 11.8 5.7 3.8 3.0 4.0
Healthcare/Benefits2 -33.8 56.9 5.1 4.9 4.9 5.0
Pre-K-12 Education3 -0.2 1.8 2.0 3.7 1.8 1.9
Medical Assistance 3.9 30.4 4.1 3.8 4.1 3.9
Long-Term Living 0.7 34.3 3.9 3.8 3.6 3.3
Intellectual Disability -1.7 17.8 3.0 3.0 3.0 3.0
Other Human Services 1.3 9.2 3.1 2.6 2.6 2.5
Debt Service 3.4 3.8 2.9 5.2 2.2 7.0
All Other -1.1 1.9 2.2 2.2 6.4 -1.8
Total Expenditures -2.8 14.6 3.3 3.5 3.2 2.6
1 Includes wages, salaries, bonuses and payroll taxes (Medicare and Social Security).
2 Includes all non-pension benefits such as health and life insurance and other miscellaneous benefits for
retirees and employees.
3 Excludes department personnel expenses and the state share of PSERS funding.
Table 5.2
General Fund Expenditures by Category
Note: Millions of dollars.
Section 5: Expenditure Outlook | Page 30
Current Services Versus Cost-to-Carry Baselines
Expenditures can be forecast using various methods. A “current services” concept is reflected in Tables 5.1
and 5.2 and used throughout this section. The current services method applies inflationary or demographic
adjustments to maintain the level of real services provided to residents of the Commonwealth in the base
year. Another method to project expenditures is the cost-to-carry approach. The cost-to-carry concept only
increases funding for programs or line items that must be funded due to state or federal law, debt or
pension obligations or the care of individuals under the jurisdiction of a state agency. For the purpose of
the cost-to-carry concept, the following items increase at the same rate as the current services approach:
Programs administered by DHS, DCJ and PSP;
State employee personnel costs including wages, retiree healthcare and current employee
healthcare and other benefits;
General obligation debt service funded by the General Fund;
Pension contributions funded by the General Fund including reimbursements to school districts for
school employee pensions (PSERS) and state employee pensions (SERS);
Payments to school districts for partial reimbursement of school employee Social Security employer
costs; and
PlanCon reimbursements and repayment of the $165 million transfer from the Workers’ Compen-
sation Security Fund to the General Fund in May 2017.
All other programs or line items (referred to as discretionary spending) are held flat at FY 2020-21 funding
levels. Those items include the basic and special education subsidies, as well as funds for non-personnel
expenses such as office supplies, rent, utilities, furniture, computers and travel.9
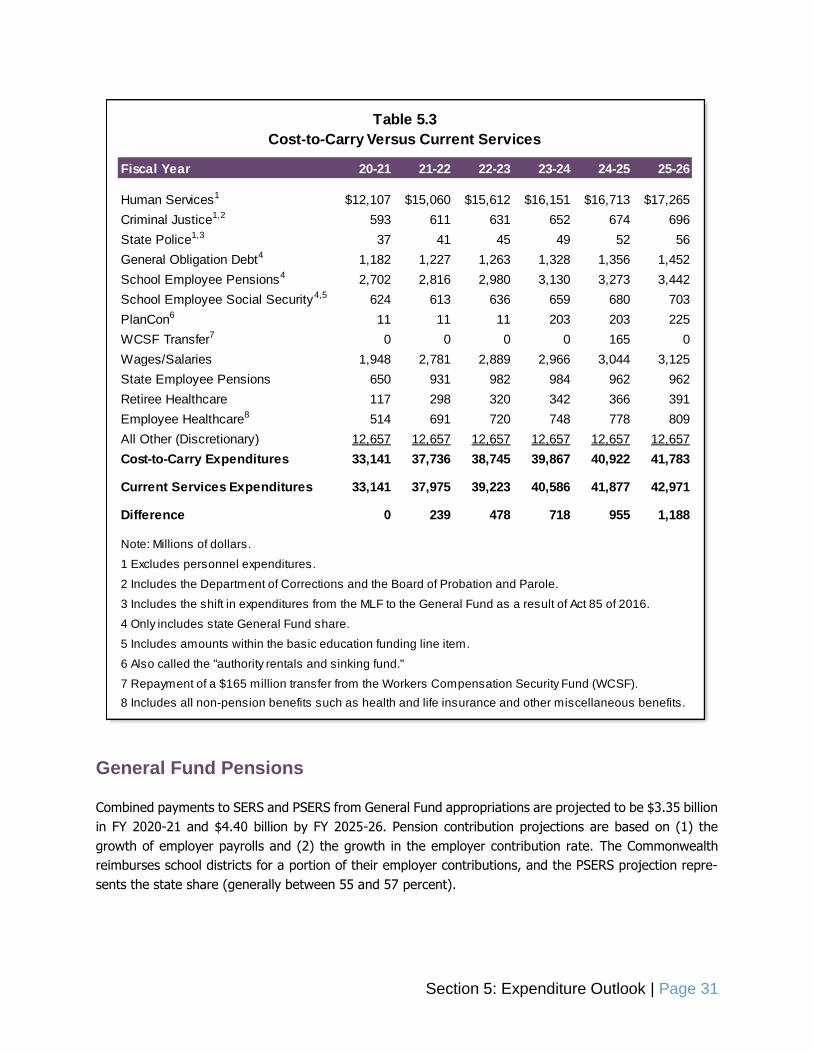
Table 5.3 provides details on the cost-to-carry concept and a comparison to the current services concept
at the bottom of the table. The difference between the current services and cost-to-carry forecasts in-
creases from $239 million in FY 2021-22 to $1.19 billion in FY 2025-26. The cost-to-carry forecast grows
at an average rate of 4.7 percent per annum while the current services forecast grows by 5.3 percent per
annum. There is strong growth in both concepts from FY 2020-21 into FY 2021-22 due to the state General
Fund replacing expenses that were paid for by various federal funds in FY 2020-21. Excluding the growth
into FY 2021-22 from the calculations, the cost-to-carry forecast grows at an average rate of 2.6 percent
per annum while the current services forecast grows by 3.1 percent per annum in the out years. The
subsections that follow use the current services approach.
9 Within the basic education subsidy, the school employee Social Security portion is allowed to grow.
Section 5: Expenditure Outlook | Page 31
General Fund Pensions
Combined payments to SERS and PSERS from General Fund appropriations are projected to be $3.35 billion
in FY 2020-21 and $4.40 billion by FY 2025-26. Pension contribution projections are based on (1) the
growth of employer payrolls and (2) the growth in the employer contribution rate. The Commonwealth
reimburses school districts for a portion of their employer contributions, and the PSERS projection repre-
sents the state share (generally between 55 and 57 percent).
Fiscal Year 20-21 21-22 22-23 23-24 24-25 25-26
Human Services1 $12,107 $15,060 $15,612 $16,151 $16,713 $17,265
Criminal Justice1,2 593 611 631 652 674 696
State Police1,3 37 41 45 49 52 56
General Obligation Debt4 1,182 1,227 1,263 1,328 1,356 1,452
School Employee Pensions4 2,702 2,816 2,980 3,130 3,273 3,442
School Employee Social Security4,5 624 613 636 659 680 703
PlanCon6 11 11 11 203 203 225
WCSF Transfer7 0 0 0 0 165 0
Wages/Salaries 1,948 2,781 2,889 2,966 3,044 3,125
State Employee Pensions 650 931 982 984 962 962
Retiree Healthcare 117 298 320 342 366 391
Employee Healthcare8 514 691 720 748 778 809
All Other (Discretionary) 12,657 12,657 12,657 12,657 12,657 12,657
Cost-to-Carry Expenditures 33,141 37,736 38,745 39,867 40,922 41,783
Current Services Expenditures 33,141 37,975 39,223 40,586 41,877 42,971
Difference 0 239 478 718 955 1,188
8 Includes all non-pension benefits such as health and life insurance and other miscellaneous benefits.
2 Includes the Department of Corrections and the Board of Probation and Parole.
3 Includes the shift in expenditures from the MLF to the General Fund as a result of Act 85 of 2016.
4 Only includes state General Fund share.
5 Includes amounts within the basic education funding line item.
6 Also called the "authority rentals and sinking fund."
7 Repayment of a $165 million transfer from the Workers Compensation Security Fund (WCSF).
1 Excludes personnel expenditures.
Table 5.3
Cost-to-Carry Versus Current Services
Note: Millions of dollars.

Section 5: Expenditure Outlook | Page 32
In July 2020, the State Employees’ Retirement Board reduced the long-term assumed rate of investment
return from 7.125 percent to 7.00 percent. The change in assumed rate of return became official at the
end of CY 2020 (to coincide with SERS’ actuarial valuation period), and the change is reflected in the
projections below. No changes were made to the long-term assumed return rate for PSERS, which remains
7.25 percent. Table 5.4 reflects the most recent estimates for employer contribution rates from the two
pension systems.
The SERS projections in Table 5.5 represent only the amounts estimated to be paid from General Fund
appropriations. In addition to these appropriations, state agencies make employer contributions from other
sources such as augmentations, federal funds and other state funds. In the current fiscal year personnel
expenditures have been shifted away from the General Fund in order to utilize federal dollars available
through the CARES Act CRF. These expenditure shifts reduce the share of pension funds paid by the General
Fund in FY 2020-21. This forecast assumes the return of these expenditures to the General Fund in FY
2021-22, leading to an above average growth rate.
SERS PSERS SERS PSERS
2017-18 33.22% 32.57% 12.6% 8.5%
2018-19 32.90 33.43 -1.0 2.6
2019-20 33.53 34.29 1.9 2.6
2020-21 33.45 34.51 -0.2 0.6
2021-22 33.38 34.95 -0.2 1.3
2022-23 33.85 35.62 1.4 1.9
2023-24 33.02 36.12 -2.5 1.4
2024-25 31.47 36.60 -4.7 1.3
2025-26 30.65 37.23 -2.6 1.7
1 Expressed as a percentage of payroll.
Source: Rates are from information transmitted to the IFO by SERS and PSERS.
Table 5.4
Employer Contribution Rates
Fiscal Year
Employer Rate1 % Change in Rate
Fiscal Year 19-20 20-21 21-22 22-23 23-24 24-25 25-26
SERS $877 $650 $931 $982 $984 $962 $962
PSERS 2,628 2,702 2,816 2,980 3,130 3,273 3,442
Total 3,505 3,352 3,747 3,962 4,114 4,235 4,404
Growth Rate 4.8% -4.4% 11.8% 5.7% 3.8% 3.0% 4.0%
Note: Millions of dollars.
Table 5.5
Employer Pension Contributions - State General Fund Share
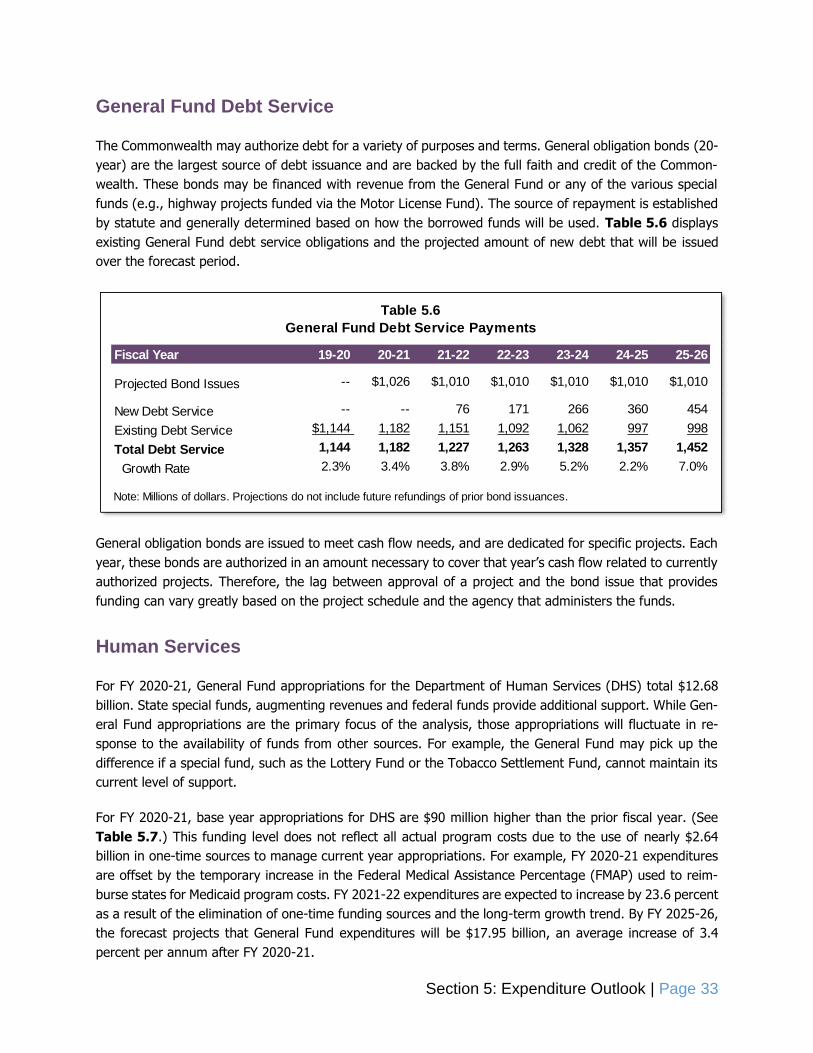
Section 5: Expenditure Outlook | Page 33
General Fund Debt Service
The Commonwealth may authorize debt for a variety of purposes and terms. General obligation bonds (20-
year) are the largest source of debt issuance and are backed by the full faith and credit of the Common-
wealth. These bonds may be financed with revenue from the General Fund or any of the various special
funds (e.g., highway projects funded via the Motor License Fund). The source of repayment is established
by statute and generally determined based on how the borrowed funds will be used. Table 5.6 displays
existing General Fund debt service obligations and the projected amount of new debt that will be issued
over the forecast period.
General obligation bonds are issued to meet cash flow needs, and are dedicated for specific projects. Each
year, these bonds are authorized in an amount necessary to cover that year’s cash flow related to currently
authorized projects. Therefore, the lag between approval of a project and the bond issue that provides
funding can vary greatly based on the project schedule and the agency that administers the funds.
Human Services
For FY 2020-21, General Fund appropriations for the Department of Human Services (DHS) total $12.68
billion. State special funds, augmenting revenues and federal funds provide additional support. While Gen-
eral Fund appropriations are the primary focus of the analysis, those appropriations will fluctuate in re-
sponse to the availability of funds from other sources. For example, the General Fund may pick up the
difference if a special fund, such as the Lottery Fund or the Tobacco Settlement Fund, cannot maintain its
current level of support.
For FY 2020-21, base year appropriations for DHS are $90 million higher than the prior fiscal year. (See
Table 5.7.) This funding level does not reflect all actual program costs due to the use of nearly $2.64
billion in one-time sources to manage current year appropriations. For example, FY 2020-21 expenditures
are offset by the temporary increase in the Federal Medical Assistance Percentage (FMAP) used to reim-
burse states for Medicaid program costs. FY 2021-22 expenditures are expected to increase by 23.6 percent
as a result of the elimination of one-time funding sources and the long-term growth trend. By FY 2025-26,
the forecast projects that General Fund expenditures will be $17.95 billion, an average increase of 3.4
percent per annum after FY 2020-21.
Fiscal Year 19-20 20-21 21-22 22-23 23-24 24-25 25-26
Projected Bond Issues -- $1,026 $1,010 $1,010 $1,010 $1,010 $1,010
New Debt Service -- -- 76 171 266 360 454
Existing Debt Service $1,144 1,182 1,151 1,092 1,062 997 998
Total Debt Service 1,144 1,182 1,227 1,263 1,328 1,357 1,452
Growth Rate 2.3% 3.4% 3.8% 2.9% 5.2% 2.2% 7.0%
Table 5.6
General Fund Debt Service Payments
Note: Millions of dollars. Projections do not include future refundings of prior bond issuances.

Section 5: Expenditure Outlook | Page 34
The provision of Medicaid services comprises the largest share of expenditures for DHS. Medicaid is a joint
state/federal program that plays an important role in the provision of (1) physical and behavioral healthcare
services to eligible low-income individuals and families and (2) home and community-based and long-term
care services to eligible residents who have physical or cognitive disabilities. Medicaid services are provided
through various programs grouped under the Medical Assistance (MA), Long-Term Living (LTL) and Intel-
lectual Disabilities (ID) categories. These program categories comprise roughly three-quarters of DHS Gen-
eral Fund expenditures, and the forecast projects that they will increase at an average rate of 3.7 percent
per annum for FY 2022-23 to FY 2025-26.
The basic components of the forecast are identified in the following bullets. Additional factors that affect
expenditure projections for FY 2020-21 and beyond are discussed in the paragraphs that follow.
The projections assume costs per enrollee for MA will increase by 3.0 percent per annum and LTL
will increase by 3.3 percent per annum. These rates are motivated by inflation.
Increases in the service population track the growth in the age 60 or older population (1.4 percent
per annum) for LTL programs while the service populations essentially remain flat for the MA and
ID programs.
Appropriations from the Lottery Fund and the Tobacco Settlement Fund supplement General Fund expend-
itures for the MA and LTL program groups. The Lottery Fund is projected to supply $388 million for DHS
expenditures in FY 2021-22 and remain at that level through FY 2025-26. The Tobacco Settlement Fund is
Fiscal Year 19-20 20-21 21-22 22-23 23-24 24-25 25-26
Wages1
$328 $243 $251 $260 $266 $273 $280
Pensions 133 133 137 144 144 141 141
Retiree Healthcare 72 24 47 49 52 55 58
Employee Healthcare2
129 177 182 189 196 202 210
All Other
Medical Assistance 3,785 3,934 5,132 5,339 5,544 5,772 5,996
Long-Term Living 3,307 3,330 4,472 4,648 4,825 5,001 5,166
Intellectual Disabilities 1,997 1,962 2,312 2,381 2,452 2,526 2,602
Human Services Programs 1,353 1,262 1,441 1,501 1,548 1,595 1,643
Mental Health 669 708 749 771 794 818 843
Child Development 467 477 497 503 509 514 519
Income Maintenance 195 232 236 241 246 251 256
Human Services Support 128 132 134 137 140 143 146
Children’s Health Insurance 31 69 87 90 92 94 96
Total 12,593 12,683 15,677 16,254 16,808 17,384 17,953
Growth Rate -1.6% 0.7% 23.6% 3.7% 3.4% 3.4% 3.3%
1 Includes wages, salaries, bonuses and payroll taxes (Medicare and Social Security).
2 Includes all non-pension benefits such as health and life insurance and other miscellaneous benefits.
Table 5.7
General Fund Expenditures - Department of Human Services
Note: Millions of dollars.

Section 5: Expenditure Outlook | Page 35
projected to supply $245 million in FY 2020-21. The forecast assumes a reduction to $237 million for FY
2021-22 and future years based on annual Tobacco Settlement Fund revenues available for MA and LTL
programs. In the forecast, the General Fund absorbs any reduction in support from these special funds.
See the Appendix for additional information regarding the relevant special fund forecasts.
The analysis includes the impact of Medicaid expansion on General Fund appropriations. Beginning in cal-
endar year 2017, the Commonwealth is responsible for a portion of the costs from enrollees eligible under
Medicaid expansion. The state share began at 5 percent for 2017 and increases to 10 percent by 2020 and
thereafter. The MA forecast includes the projected impact on General Fund appropriations from a phase
down of the enhanced federal matching rate for Medicaid expansion.
Support for MA and LTL programs is derived from augmenting revenues from various assessments (e.g.,
MCOs, hospitals and nursing homes). These assessments expire at various points prior to the end of the
forecast period in this report (June 2025), but the analysis assumes that they are extended. The forecast
further assumes that the augmenting facility assessments, along with the corresponding federal matching
revenues, supply the same share of funding for total DHS expenditures as supplied in the base year.
The following bullets list significant factors that affect DHS expenditures for the current fiscal year and
forecast period:
Use of one-time funds to pay current fiscal year expenses. This method of temporarily reducing
current year appropriations (e.g., MA capitation and MA Community HealthChoices) creates a sig-
nificant increase in appropriation levels the following year unless additional funds become available.
For example, the enacted budget for FY 2020-21 relies on a $200 million transfer from the Penn-
sylvania Professional Joint Liability Underwriting Association (JUA) as a one-time funding mecha-
nism to offset DHS program costs. Other one-time measures to reduce expenditures in FY 2020-
21 include the use of a short-term managed care payment shift ($480 million) and the delay of
county child welfare costs until FY 2021-22 ($75 million).
Use of a temporarily-enhanced federal matching rate. Due to the COVID-19 pandemic, the federal
government allows a higher matching rate to state funds, providing $2.07 billion in additional fed-
eral funds for FY 2020-21. The forecast assumes that the enhanced federal matching rate continues
through 2021 Q2 and assumes that these funds will need to be replaced with additional state funds
unless the enhanced federal match is extended.
Use of federal CARES Act CRF funds ($30 million) for Youth Development Centers and Forestry
Camps. This funding will need to be replaced in FY 2021-22 and beyond.
The shift of expenditures between fiscal years. FY 2020-21 includes $917 million of prior year
expenditures that will not carry forward into FY 2021-22. However, enrollment and long-term
growth trends suggest supplemental funds may be needed in FY 2020-21 that would push up
spending levels in FY 2021-22.
Section 5: Expenditure Outlook | Page 36
Education
The Pennsylvania Department of Education (PDE) provides resources, support and oversight to the state’s
500 school districts and grants and subsidies to post-secondary institutions including: 14 universities within
the Pennsylvania State System of Higher Education (PASSHE), 14 community colleges and 4 state-related
universities. PDE appropriations can be separated into three broad categories: (1) pre-kindergarten through
grade 12 (Pre-K-12), (2) post-secondary and (3) other. The text that follows provides brief descriptions of
these categories.
Pre-K to Grade 12
Most PDE appropriations (nearly 90 percent) are dedicated to Pre-K-12 purposes. For FY 2020-21, Pre-K-
12 appropriations are $12.93 billion, $58 million (0.5 percent) higher than FY 2019-20 appropriations. (See
Table 5.8.) These amounts include the basic education and special education subsidies, the state share of
school employees’ retirement contributions, pupil transportation, school employees’ Social Security, early
intervention, Ready to Learn Block Grant and other miscellaneous expenditures.
Demographic projections show that the 5- to 17-year age cohort will contract by 0.6 percent per annum
through FY 2025-26. Despite this contraction, Pre-K to grade 12 expenditures expand at a faster pace (2.8
percent per annum) to $14.87 billion, due primarily to solid growth in state reimbursements for school
district retirement contributions (5.0 percent per annum) and the authority rentals and sinking fund appro-
priation. The authority rentals and sinking fund appropriation, also known as PlanCon, provides funds to
reimburse school districts for school construction costs. The appropriation also supports roughly $10.5
million in annual charter school lease reimbursements. IFO projections build in another two years of the
use of bond proceeds until the authorization cap of $2.5 billion is reached. The line item projection then
increases to $203 million in FY 2023-24 and FY 2024-25 and increases further to $225 million FY 2025-26.
The basic education and special education subsidies expand at a rate of 1.9 percent per annum to maintain
a current level of service.
Post-Secondary
For FY 2020-21, PDE’s post-secondary appropriations are $1.40 billion, level-funding from FY 2019-20 ap-
propriations. These amounts comprise slightly less than 10 percent of total expenditures by PDE and include
state-owned and state-related universities, community colleges and Thaddeus Stevens College of Technol-
ogy. While the number of students attending post-secondary institutions has declined, appropriations for
recent years suggest that policymakers desire to provide a level of funding that grows at roughly the same
rate as inflation. Therefore, the forecast assumes that all post-secondary line items grow with general
inflation (2.0 percent per annum) to $1.54 billion in FY 2025-26.
Other and Summary
PDE also receives appropriations to provide subsidies to libraries and to fund personnel costs. For FY 2020-
21, those amounts are $105 million and increase to $117 million by FY 2025-26 (2.2 percent per annum).
For FY 2020-21, PDE’s total appropriation is $14.43 billion, a $55 million (0.4 percent) increase from the
prior fiscal year. The forecast projects that expenditures will increase to $16.52 billion (2.7 percent per
annum) by FY 2025-26.

Section 5: Expenditure Outlook | Page 37
Criminal Justice
The Department of Criminal Justice (DCJ) includes the Department of Corrections (DOC) and the Pennsyl-
vania Board of Probation and Parole (PBPP). The Department of Criminal Justice (1) provides for the care
Fiscal Year 19-20 20-21 21-22 22-23 23-24 24-25 25-26
Pre-K through Grade 12
Basic Education Subsidy1 $6,255 $6,255 $6,384 $6,511 $6,639 $6,763 $6,883
School Employees' Retirement 2,628 2,702 2,816 2,980 3,130 3,273 3,442
Special Education Subsidy 1,187 1,187 1,211 1,235 1,260 1,283 1,306
Pupil Transportation 706 606 620 629 639 647 656
School Employees' Social Sec.1 552 624 613 636 659 680 703
Early Intervention 315 326 328 331 334 338 342
Ready To Learn Block Grant 268 268 272 276 280 283 287
Authority Rentals and Sinking Fund 11 11 11 11 203 203 225
All Other2 950 951 970 983 997 1,010 1,023
Total Pre-K through Grade 12 12,871 12,929 13,223 13,592 14,139 14,479 14,866
Post-Secondary
State-Related Universities 597 597 608 620 632 645 658
Community Colleges3 302 302 307 313 320 326 332
PASSHE-State Universities 477 477 486 496 505 516 526
Thaddeus Stevens Coll. of Tech. 19 19 19 19 20 20 21
Other Post-Secondary 3 3 3 4 4 4 4
Total Post-Secondary 1,398 1,398 1,423 1,451 1,480 1,510 1,540
General Government Operations 28 25 26 27 28 28 29
Libraries4 80 80 81 83 85 86 88
Grand Total 14,378 14,433 14,753 15,154 15,732 16,104 16,523
Growth Rate 4.6% 0.4% 2.2% 2.7% 3.8% 2.4% 2.6%
1 The school district Social Security subsidy is excluded from the basic education subsidy line and included in
the school employees' Social Security line.
2 Includes Pre-K Counts, special education-approved private schools, services to nonpublic schools,
nonpublic and charter school pupil transportation and other line items.
3 Includes community colleges, transfer to Community College Capital Fund, Northern PA Regional College
and regional community colleges.
4 Includes library services for the disabled, public library subsidy, library access and state library.
Note: Millions of dollars.
Table 5.8
General Fund Expenditures - Department of Education

Section 5: Expenditure Outlook | Page 38
and supervision of all offenders under its jurisdiction and (2) ensures citizen safety through careful selection
of offenders who qualify for parole and their re-entry into society. Although still legally separate, the agen-
cies operate under a memorandum of understanding that combined certain offices and yielded cost savings
through the elimination of administrative redundancies.
Table 5.9 displays a time series of inmates and parolees under the jurisdiction of DCJ. From CY 2013 to
CY 2019, the inmate population decreased at a rate of 1.9 percent per annum, while the parolee population
expanded at a rate of 1.5 percent per annum. These trends were motivated by structural and data-driven
changes implemented by the Justice Reinvestment Initiative, which diverted technical parole violators
(TPVs) from state prisons to contracted county jails and community corrections centers. There were 39,493
inmates at the end of CY 2020, a decrease of 6,382 inmates (-13.9 percent) from the end of CY 2019. This
represents a larger decline than the last six years combined. This temporary reduction is the result of
various factors related to the COVID-19 pandemic, including court closures and increased diversion of
offenders from prison.
For FY 2020-21, total General Fund appropriations for DCJ are $1.61 billion, $1.00 billion (-38.4 percent)
less than FY 2019-20 appropriations. Most of the reduction is attributable to state correctional institutions
(-$914 million) and inmate medical care (-$72 million, includes personnel costs). These reductions corre-
spond to federal funding from the CRF, which includes $967 million for state correctional institutions and
$95 million for inmate medical care. Also included in the FY 2020-21 appropriations are estimated carryover
costs (or costs from previous years) of $105 million in inmate medical care and state correctional institu-
tions. With CRF funding included and the carryovers removed, FY 2020-21 expenditures are $2.57 billion.
Table 5.10 displays the expenditures for DCJ. The forecast assumes that, beginning in FY 2021-22, the
expenditures replaced by the CRF in FY 2020-21 will return to General Fund support and no carryover costs
will be needed in FY 2021-22. It is projected that DCJ expenditures will grow by 2.5 percent per annum
during the forecast period.
2013 2014 2015 2016 2017 2018 2019 2020
Inmate Population 51,512 50,756 49,914 49,301 48,438 47,370 45,875 39,493
Annual Change 328 -756 -842 -613 -863 -1,068 -1,495 -6,382
Percent Change 0.6% -0.8% -1.7% -1.2% -1.8% -2.2% -3.2% -13.9%
Parolee Population 37,971 39,726 41,226 41,500 42,069 41,305 41,459 41,962
Annual Change 1,989 1,755 1,500 274 569 -764 154 503
Percent Change 5.5% 10.4% 3.8% 0.7% 1.4% -1.8% 0.4% 1.2%
Table 5.9
Populations - Department of Criminal Justice
Note: Parolee population is reported on a fiscal year basis.
Source: Pennsylvania Department of Corrections, Annual Statistical Report (various years). Pennsylvania Board
of Probation and Parole, Monthly Statistics (various years).

Section 5: Expenditure Outlook | Page 39
All Other Expenditures
The forecasts for all other agencies use the extrapolators shown in the Appendix. As Table 5.11 details,
total General Fund expenditures for these agencies are projected to have a strong annual growth rate at
12.3 percent in FY 2021-22. A large portion of that growth rate is due to technical factors within PSP and
DOH that are explained in more detail in the bullets below. Another factor is that many smaller state agency
budgets have a larger share of their budgets going towards personnel expenses, including employee retiree
health benefits. Agency contributions for these benefits were temporarily reduced in the FY 2020-21 budget
and are projected to return to normal levels in FY 2021-22. For FY 2022-23 to FY 2025-26, most of the
agencies listed in Table 5.11 have a projected per annum growth rate between 2.2 and 3.0 percent.
Notable assumptions across these agencies include:
The State Police General Fund FY 2021-22 budget is projected to grow by $268 million (128.5
percent) over FY 2020-21 primarily due to nearly $226 million in CARES Act CRF dollars used in the
FY 2020-21 budget to replace General Fund state dollars. State Police’s strong per annum growth
rate of 6.2 percent for FY 2022-23 to FY 2025-26 is primarily due to the continued shift away from
the use of Motor License Fund dollars to supplement the State Police’s budget as a result of Act 85
of 2016.
The Department of Health General Fund FY 2021-22 budget is projected to grow $19 million (10.6
percent) from FY 2020-21 expenditures. In FY 2020-21, the department received $14 million in
CARES Act CRF dollars, which were used to offset personnel services and general operating ex-
penditures. These funds are assumed to be replaced with General Fund support in FY 2021-22.
Budget growth moderates in the out years, growing at an average annual growth rate of 2.3 per-
cent for FY 2022-23 to FY 2025-26.
Fiscal Year 19-20 20-21 21-22 22-23 23-24 24-25 25-26
Wages1 $1,231 $696 $1,329 $1,371 $1,400 $1,429 $1,460
Pensions 397 192 394 413 411 400 398
Retiree Healthcare 98 7 101 106 112 119 125
Employee Healthcare2 261 124 258 267 277 287 297
Inmate Medical Care3 192 205 216 228 241 255 269
All Other 436 388 395 403 411 419 427
Total 2,616 1,612 2,694 2,788 2,852 2,908 2,976
Growth Rate 2.1% -38.4% 67.1% 3.5% 2.3% 2.0% 2.3%
2 Includes all non-pension benefits such as health and life insurance and other miscellaneous benefits.
3 Excludes personnel costs.
Table 5.10
General Fund Expenditures - Department of Criminal Justice
Note: Millions of dollars.
1 Includes wages, salaries, bonuses and payroll taxes (Medicare and Social Security).

Section 5: Expenditure Outlook | Page 40
The Pennsylvania Higher Education Assistance Agency (PHEAA) has a low per annum growth rate
(0.8 percent) from FY 2020-21 to FY 2025-26 because the projected growth rate is equal to the
product of inflation (2.0 percent per annum) and decline in total student population at colleges and
universities within the state over the last 10 years (-1.1 percent per annum).
Budgeted Department of Environmental Protection expenditures for FY 2020-21 represent an in-
crease of $22 million (16.5 percent) from the prior year. This is largely due to a return to full
General Fund support for various line items that were funded by the Environmental Stewardship
and Recycling Funds in FY 2019-20.
Department of Conservation and Natural Resources expenditures are projected to increase by $24
million (17.4 percent) in FY 2021-22 due to reduced support from the Oil and Gas Lease Fund
(OGLF). Due to diminished royalty revenues resulting from low natural gas prices, the OGLF will
not be able to support DCNR expenditures at historical levels and maintain the $35 million annual
transfer to the Marcellus Legacy Fund.
The strong growth in FY 2024-25 is due to the scheduled repayment of the $165 million transfer
from the Workers’ Compensation Security Fund to the General Fund.10
10 Transfer occurred in May 2017. Act 20 of 2019 amends the Fiscal Code to require repayment by July 1, 2024. The analysis assumes that repayment occurs in FY 2024-25.
Fiscal Year 19-20 20-21 21-22 22-23 23-24 24-25 25-26
State Police $369 $209 $478 $523 $552 $577 $609
Legislature1 421 420 435 452 465 476 490
PHEAA 369 369 372 375 378 381 384
Judiciary 356 356 369 384 394 403 414
Revenue 194 189 196 202 207 211 216
Health 201 183 202 208 213 217 222
Community & Economic Dev. 179 182 186 191 195 199 203
Agriculture 171 170 174 178 182 185 189
Military & Veterans Affairs 157 157 164 169 173 177 181
Environmental Protection 134 156 164 170 175 179 183
Executive Offices 140 150 157 162 166 170 174
Cons. & Natural Resources 117 135 158 164 168 171 175
All Others2 497 501 513 529 541 717 565
Total 3,306 3,177 3,568 3,706 3,807 4,063 4,005
Growth Rate 5.8% -3.9% 12.3% 3.9% 2.7% 6.7% -1.4%
2 Includes all other agencies not listed above with the exception of PDE, DHS, DCJ and Treasury.
Table 5.11
General Fund Expenditures - All Other Agencies
Note: Millions of dollars.
1 Includes government support agencies.

Section 6: Fiscal Outlook | Page 41
Section 6: Fiscal Outlook
This report provides an assessment of the Commonwealth’s fiscal outlook based on demographic and eco-
nomic trends. To facilitate that assessment, Table 6.1 combines the revenue and expenditure projections
from previous sections to identify any potential long-term structural imbalance over the forecast period.11
In November 2019, the IFO released its previous long-term assessment and identified an approximate $1.0
billion structural deficit by the end of that five-year forecast window (FY 2024-25). For this update, the
long-term structural deficit increases by another $1.0 billion from (1) lower revenues due to lost economic
growth from the COVID-19 recession and (2) higher expenditures largely attributable to programs admin-
istered by the Department of Human Services (DHS).
Similar to previous budgets, the enacted budget for FY 2020-21 relies on various one-time revenues:
Special fund transfers of $431 million.
A $100 million transfer from the Budget Stabilization Fund authorized under Act 114 of 2020.
A $200 million transfer from the Pennsylvania Professional Liability Joint Underwriting Association
(JUA) to offset DHS program costs. The transfer has been challenged in federal court and it is
uncertain whether these funds will be received in the current fiscal year.
11 A long-term structural imbalance is an imbalance that remains after unusual economic conditions or other factors (e.g., one-time revenue transfers) are no longer relevant or available.
Fiscal Year 19-20 20-21 21-22 22-23 23-24 24-25 25-26
Beginning Balance1
$30 -$2,734 -- -- -- -- --
Current Year Revenues 32,276 38,437 $36,675 $37,851 $39,352 $40,828 $42,321
Less Refund Reserve -1,150 -1,300 -1,326 -1,353 -1,380 -1,407 -1,435
Net Revenue 31,126 37,137 35,349 36,498 37,972 39,421 40,885
State Expenditures2
-34,090 -33,141 -37,975 -39,223 -40,586 -41,877 -42,971
-------- -------- -------- -------- -------- -------- --------
Current Year Balance -2,934 1,263 -2,626 -2,725 -2,613 -2,455 -2,086
Adjustment for Lapses3
200 219 125 125 125 125 125
Preliminary Ending Balance -2,734 1,481 -2,501 -2,600 -2,488 -2,330 -1,961
Table 6.1
General Fund Financial Statement
Note: Millions of dollars.
1 Beginning balance omitted for FY 21-22 and thereafter.
2 Based on appropriations. Includes current year lapses and approved supplemental appropriations.
3 Prior year lapses and actual transfers to the Budget Stabilization Reserve Fund.

Section 6: Fiscal Outlook | Page 42
The enacted FY 2020-21 budget also includes $1.06 billion in expenses from FY 2019-20 that have been
rolled forward. While these expenditures are not expected to recur in FY 2021-22, certain DHS programs
may require supplemental appropriations in FY 2020-21 if the JUA transfer does not occur and/or DHS and
other program costs exceed enacted funding levels. For the current fiscal year, the revenue outlook has
improved since the budget was enacted and the projected ending balance for FY 2020-21 would enable
these costs to be covered with a supplemental appropriation. Any enacted supplementals would directly
reduce the projected ending balance for the current fiscal year.
For FY 2021-22, the major factors that drive expenditure growth include:
The use of $1.33 billion in federal CARES Act CRF funds to offset General Fund costs in FY 2020-
21 for the Department of Criminal Justice ($1.06 billion), the Pennsylvania State Police ($226 mil-
lion), the Department of Human Services ($30 million) and the Department of Health ($14 million).
Federal funds associated with the temporary FMAP increase used to reimburse states for Medicaid
program costs provide $2.07 billion in state support in FY 2020-21. The enhanced FMAP expires
following the termination of the national public health emergency declaration related to COVID-19.
Two one-time measures reduce DHS expenditures in FY 2020-21: (1) a short-term managed care
payment shift ($480 million) and (2) the delay of county child welfare costs until FY 2021-22 ($75
million).
The temporary reduction in agency contributions for retiree healthcare in FY 2020-21 that is not
expected to continue in FY 2021-22.
For FY 2022-23, the projected deficit peaks at $2.6 billion due to the new SUT transfer to the Public
Transportation Trust Fund ($469 million). For FY 2022-23 to FY 2025-26, average revenue growth (3.6
percent) exceeds average expenditure growth (3.1 percent) and the deficit contracts. The moderate ex-
penditure growth is motivated, in part, by the assumed low growth of the basic education subsidy (1.9
percent per annum) as the forecast incorporates the contraction of the school-age population. As noted,
these trends assume the absence of a recession, low interest rates and moderate inflation, and therefore
likely represent a scenario that leans optimistic.12
12 Excluding the new transfer from SUT to the Public Transportation Trust Fund ($515 million in FY 2025-26), the average net revenue growth is 4.0 percent per annum.

Appendix | Page 43
Appendix
Demographics
The tables that follow are from a previously released IFO report titled Pennsylvania Demographic Outlook
(September 2020). That report used data from the U.S. Census Bureau and Pennsylvania Department of
Health (DOH). However, all demographic projections are by the IFO.
Age 2010 2011 2012 2013 2014 2015 2016 2017 2018 2019
0-4 729 726 721 715 715 714 711 709 705 698
5-9 752 749 749 747 742 737 733 729 726 726
10-14 790 785 778 772 768 760 754 755 755 750
15-19 902 886 867 851 837 829 822 814 809 804
20-24 877 888 893 891 881 862 844 826 812 799
25-29 785 800 811 826 844 858 865 870 869 861
30-34 734 753 769 782 790 796 806 816 830 848
35-39 758 729 717 717 725 738 754 769 782 792
40-44 849 844 831 811 785 756 726 714 715 722
45-49 952 927 903 878 854 839 832 817 798 774
50-54 985 987 975 960 948 930 903 879 854 831
55-59 885 904 924 939 947 950 949 937 922 910
60-64 752 790 787 800 818 839 856 874 888 895
65-69 555 565 613 635 664 696 730 727 738 755
70-74 428 435 449 473 488 499 507 551 572 599
75-79 360 356 354 358 364 366 373 385 407 420
80-84 311 307 302 293 287 282 280 279 283 288
85-89 202 204 206 206 206 205 204 202 199 196
90-94 82 86 91 94 97 98 100 100 100 100
95-99 21 22 23 24 25 26 28 30 31 32
100+ 3 3 3 4 4 4 4 5 5 5
Total 12,711 12,746 12,767 12,776 12,788 12,785 12,782 12,788 12,801 12,802
Table A.1
Pennsylvania Historical Population 2010 to 2019
Note: Thousands of residents.
Source: Data are from the U.S. Census Bureau 2019 Population Projections. Age groups 85-89, 90-94, 95-99 and
100+ are estimations by IFO.

Appendix | Page 44
Age 2020 2021 2022 2023 2024 2025 2026 2027 2028 2029 2030
0-4 690 682 675 668 662 657 651 646 641 635 630
5-9 726 724 721 716 709 701 693 686 679 673 667
10-14 745 742 737 732 732 732 730 727 723 716 707
15-19 796 790 789 788 782 778 774 769 764 764 763
20-24 792 786 778 772 767 759 754 754 752 747 743
25-29 845 829 811 796 783 776 770 762 757 752 744
30-34 864 873 880 878 871 854 838 820 805 792 785
35-39 798 808 818 831 849 865 874 881 880 872 856
40-44 736 753 768 781 790 796 807 816 829 847 863
45-49 746 717 705 706 713 728 744 759 771 780 787
50-54 816 811 798 779 756 729 701 689 690 698 712
55-59 893 868 845 821 798 785 781 768 749 727 701
60-64 898 899 887 872 861 845 821 800 777 755 743
65-69 775 792 809 822 828 831 831 819 806 796 781
70-74 628 660 655 667 684 702 716 732 744 749 751
75-79 430 438 479 496 521 546 574 564 578 592 609
80-84 291 297 308 328 337 345 351 391 399 422 442
85-89 194 195 196 200 204 205 211 220 236 241 246
90-94 100 99 97 96 94 94 95 96 99 100 99
95-99 33 33 33 33 32 33 32 31 31 30 32
100+ 6 6 6 7 7 7 7 7 7 7 8
Total 12,802 12,800 12,796 12,789 12,780 12,768 12,754 12,737 12,718 12,695 12,668
Table A.2
Pennsylvania Population Projections 2020 to 2030
Note: Thousands of residents.
Source: Data are projections by IFO using data from the U.S. Census Bureau and PA Department of Health.
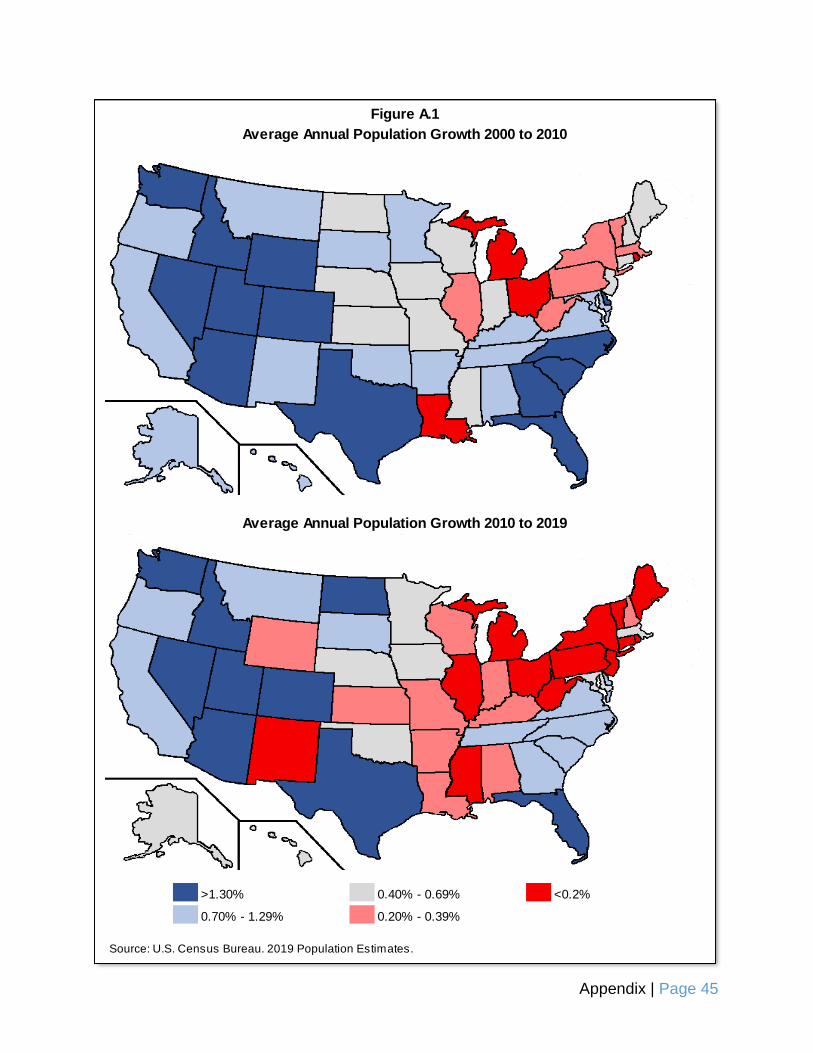
Appendix | Page 45
>1.30% 0.40% - 0.69% <0.2%
0.70% - 1.29% 0.20% - 0.39%
Source: U.S. Census Bureau. 2019 Population Estimates.
Figure A.1
Average Annual Population Growth 2000 to 2010
Average Annual Population Growth 2010 to 2019

Appendix | Page 46
Economics
The economic forecast used for this report follows the general methodology used by the U.S. Congressional
Budget Office (CBO). The approach is a simplified “growth accounting” framework, where real economic
output or Gross Domestic Product (GDP) is equal to the product of (1) growth in employment and (2)
growth in average worker output, also known as labor productivity. For example, if the number of individ-
uals employed grows by 1.0 percentage point and the average productivity of all workers grows by 0.5
percentage points, then real economic growth would equal (1.01) * (1.005) - 1.0, or 1.5 percent. Hence,
an increase (decrease) in employment growth or labor productivity will translate into higher (lower) eco-
nomic growth.
The state economic forecast is built upon four basic assumptions. They are as follows:
The Federal Reserve achieves its target inflation rate of 2.0 percent, as measured by the personal
consumption expenditures price index. Based on historical trends, the more widely-used consumer
price index (CPI-U) would increase at a slightly faster pace, and the analysis assumes that rate is
2.2 percent.
The Philadelphia CPI-U grows at the same rate as the U.S. CPI-U.
Statewide labor productivity reverts to a historical average and is consistent with U.S. projections.
The average worker’s wage grows by inflation plus a modest premium that is consistent with his-
torical trends for the U.S. and Pennsylvania.
The economic forecast is somewhat different than forecasts typically issued by government entities or
private firms. The forecast assumes that certain economic variables revert to historical rates of growth that
are consistent with (1) forecasts for the U.S. economy and (2) demographic projections by the IFO. The
main purpose of the forecast is to serve as a neutral benchmark against which policymakers could assess
the sustainability of fiscal policies over a five-year time horizon. Therefore, the economic forecast employs
a simple methodology and does not attempt to capture the many intricacies of the Pennsylvania economy
that may ultimately drive economic growth.
The model first establishes the real growth rate of the Pennsylvania economy, which is a function of em-
ployment growth and labor productivity. Prior to 2020, the Pennsylvania economy generated an average
of 50,000 to 60,000 net jobs per year. The forecast assumes a moderate reduction in that trend through
2026. This assumption yields an upward trend in the employment to population ratio, which is consistent
with recent historical data. (See Table A.3.) This trend is also consistent with the assumption of higher
labor force participation rates. The middle of Table A.3 displays the average output per worker, and the
growth in that metric, which may also generally be viewed as labor productivity. For 2019, the average
worker produced $119,800 of real output or production. The forecast assumes that labor productivity
greatly accelerates in 2020 and reverts to a historical rate of growth of roughly 1.1 percent per annum.
The employment and worker productivity forecasts yield real economic growth of roughly 2.0 percent per
annum.
The bottom of Table A.3 displays the forecast for the Philadelphia CPI-U. As noted, the forecast assumes
that the regional inflation measure follows the level and trends of the national inflation forecast. The CBO
forecast assumes that the national CPI-U will increase at an average rate of 2.4 percent per annum from
2020 to 2026. The average regional rate used by this report is slightly lower (2.2 percent).

Appendix | Page 47
The final primary economic variable is total wages and salaries paid to workers. The Pennsylvania forecast
assumes that wages for the average worker will increase by the rate of inflation, plus a modest premium
so that the purchasing power of those wages increases over time. For this analysis, that premium ranges
from 1.0 to 1.1 percent per annum. The CBO forecast also includes a premium for U.S. workers, and the
premium generally ranges from 1.3 to 1.4 percent per annum. The Pennsylvania premium is consistent
with historical state trends.
Given these assumptions, the average wage for all workers increases by roughly 3.0 percent per annum.
If employment expands by 1.0 percent per annum, then total wages paid to all workers will increase by
the product of those growth rates, or roughly 4.0 percent per annum. Similar to the other forecasts, Penn-
sylvania wages and salaries expand at a somewhat slower pace than the CBO national forecast (4.2 per-
cent) of total wages.

Appendix | Page 48
2012 2013 2014 2015 2016 2017 2018 2019 2020 2021 2022 2023 2024 2025 2026
Payroll Employment15,726 5,741 5,789 5,835 5,883 5,941 6,010 6,064 5,614 5,734 5,834 5,914 5,973 6,027 6,075
Change 40.2 14.5 48.0 46.8 47.5 58.4 68.4 54.0 -450.0 120.0 100.0 80.0 59.1 53.8 48.2
Growth Rate 0.7% 0.3% 0.8% 0.8% 0.8% 1.0% 1.2% 0.9% -7.4% 2.1% 1.7% 1.4% 1.0% 0.9% 0.8%
Residents: Age 20 to 6918,673 8,712 8,745 8,763 8,772 8,780 8,781 8,785 8,793 8,796 8,754 8,726 8,700 8,670 8,638
Employ / Population 0.660 0.659 0.662 0.666 0.671 0.677 0.684 0.690 0.638 0.652 0.666 0.678 0.687 0.695 0.703
Avg. Output per Worker1$111.9 $113.4 $115.1 $117.0 $117.5 $117.1 $118.0 $119.8 $124.1 $125.7 $126.9 $128.2 $129.6 $131.0 $132.5
Growth Rate 0.8% 1.3% 1.6% 1.6% 0.5% -0.4% 0.8% 1.5% 3.6% 1.3% 1.0% 1.0% 1.1% 1.1% 1.1%
Real GDP2$640.7 $650.8 $666.6 $682.5 $691.3 $695.6 $708.9 $726.2 $696.5 $720.6 $740.5 $758.2 $774.2 $789.8 $804.8
Growth Rate 1.5% 1.6% 2.4% 2.4% 1.3% 0.6% 1.9% 2.4% -4.1% 3.5% 2.8% 2.4% 2.1% 2.0% 1.9%
Philadelphia CPI-U 238.1 240.9 244.1 243.9 245.3 248.4 251.6 256.6 258.7 262.6 267.8 273.2 278.6 284.2 289.9
Growth Rate 1.8% 1.2% 1.3% -0.1% 0.6% 1.3% 1.3% 2.0% 0.9% 1.6% 2.1% 2.2% 2.2% 2.2% 2.2%
Wages-Salaries2$280.0 $285.2 $296.4 $308.4 $312.7 $325.3 $339.2 $353.8 $349.6 $366.4 $382.4 $398.6 $415.1 $432.0 $449.0
Average Wage1$48.9 $49.7 $51.2 $52.8 $53.1 $54.7 $56.4 $58.4 $62.3 $63.9 $65.6 $67.4 $69.5 $71.7 $73.9
Growth Rate 3.1% 1.6% 3.0% 3.2% 0.6% 3.0% 3.1% 3.4% 6.7% 2.6% 2.6% 2.8% 3.1% 3.1% 3.1%
2 Billions of dollars.
Table A.3
Pennsylvania Economic Variables
1 Thousands of units or dollars.

Appendix | Page 49
Revenues
2000 $1,860 $2,333 $7,018 $7,066 $1,980 $20,257 174.1 $399.4
2001 1,603 2,260 7,204 7,492 2,003 20,562 178.9 416.5
2002 1,419 2,183 7,293 7,139 2,027 20,060 183.2 430.6
2003 1,397 2,354 7,520 7,106 2,938 21,315 187.0 445.5
2004 1,678 2,673 7,729 7,734 3,015 22,828 192.7 467.7
2005 1,921 2,830 8,000 8,747 2,810 24,309 200.4 492.8
2006 2,302 2,888 8,334 9,524 2,806 25,854 208.2 515.3
2007 2,493 2,984 8,591 10,262 3,121 27,449 214.4 542.4
2008 2,418 3,040 8,497 10,908 3,066 27,928 220.4 570.3
2009 1,980 2,854 8,136 10,199 2,361 25,530 223.7 579.2
2010 1,791 2,788 8,029 9,969 5,071 27,648 225.5 588.0
2011 2,132 2,761 8,590 10,436 3,579 27,497 230.8 608.8
2012 2,022 2,941 8,772 10,801 3,141 27,678 236.0 629.6
2013 2,423 2,766 8,894 11,371 3,192 28,647 239.5 652.0
2014 2,502 2,397 9,130 11,437 3,142 28,607 242.5 677.3
2015 2,811 2,305 9,493 12,107 3,875 30,593 244.0 701.5
2016 2,842 2,295 9,795 12,506 3,463 30,902 244.6 719.3
2017 2,751 2,030 10,004 12,664 4,219 31,669 246.9 736.0
2018 2,879 2,010 10,381 13,399 5,898 34,567 250.0 761.8
2019 3,398 2,113 11,100 14,096 4,152 34,858 254.1 793.6
2020 2,827 2,012 10,818 12,835 3,784 32,276 257.7 793.4
2021 3,775 1,846 12,327 15,807 4,683 38,437 260.7 797.6
2022 3,248 1,956 12,424 15,034 4,013 36,675 265.2 835.2
2023 3,648 1,997 12,368 15,758 4,080 37,851 270.5 871.6
2024 3,989 2,029 12,758 16,438 4,138 39,352 275.9 907.6
2025 4,233 2,096 13,160 17,141 4,198 40,828 281.4 944.3
2026 4,466 2,131 13,588 17,867 4,268 42,321 287.0 983.0
2000 to 2010 -0.4% 1.8% 1.4% 3.5% 9.9% 3.2% 2.6% 3.9%
2010 to 2020 4.7% -3.2% 3.0% 2.6% -2.9% 1.6% 1.3% 3.0%
2020 to 2026 7.9% 1.0% 3.9% 5.7% 2.0% 4.6% 1.8% 3.6%
Table A.4
General Fund Revenues
Source: Executive Budget, various years. Projections by IFO.
Amounts ($ millions)
Average Annual Growth Rates
FY Ending
Corporate
Net
Regional
CPI-U
(levels)
Nominal
State
GDP ($
billions)
Other
Corporate
Sales and
Use
Personal
Income
All
Other
General
Fund

Appendix | Page 50
Expenditures
Table A.5 lists the economic and demographic forecasts used to extrapolate General Fund expenditures
from the FY 2020-21 base year through FY 2025-26. Projected expenditures are a function of (1) service
populations, (2) inflation and (3) various technical factors (e.g., the increasing state share under Medicaid
expansion or a shift in expenditures between funding sources).
When possible, base year expenditures were disaggregated into five categories across all agencies: (1)
wages, (2) pensions, (3) employee healthcare and other benefits, (4) retiree healthcare and (5) other
expenditures (e.g., grants and subsidies, non-personnel expenses). Those categories were forecast sepa-
rately for each agency using the extrapolators displayed in Table A.5 and then recombined at the agency
level.
Wage compensation comprises roughly seven percent of total General Fund expenditures. For each agency,
wages were extrapolated using two factors. The first factor is an agency-specific employee turnover rate
based on data compiled by the Office of Administration (not shown). For most agencies, that factor is
negative due to retirements at the upper end of the pay scale that are replaced by younger workers who
receive lower wages. The second factor is a general adjustment that reflects (1) a cost of living increase
and (2) a general step increase. The forecast assumes that factor is the same across most agencies (4.1
percent per annum). When combined, the two factors yield a growth rate of roughly three to four percent
per annum. (See Table A.5.)
Fiscal Year 21-22 22-23 23-24 24-25 25-26
Demographic Groups
Age 5 to 17 -0.4% -0.5% -0.5% -0.6% -0.7%
Age 65 and Older 2.6 2.5 2.4 2.2 2.0
All Residents 0.0 0.0 -0.1 -0.1 -0.1
Personnel Expenses
Wages1 4.0 4.1 3.0 3.0 3.0
Pensions - SERS2 -0.2 1.4 -2.5 -4.7 -2.6
Retiree Healthcare3 91.7 5.6 5.6 5.6 5.6
Employee Healthcare3 3.3 3.5 3.5 3.5 3.5
Non-Personnel Expenses 1.8 2.0 2.0 2.0 2.0
Source: Forecasts by IFO.
Table A.5
General Fund Expenditure Extrapolators
1 Reflects an average employee turnover factor. Turnover factors vary by department.
2 Growth in employer contribution rates only.
3 The growth rate in FY 21-22 is higher than typical due to the temporary reduction of REHP payments to the
PEBTF in FY 20-21 within executive agencies and row offices. Separate extrapolators are used for
Pennsylvania State Police troopers, Legislature and Judiciary (not shown).

Appendix | Page 51
The State Employees’ Retirement System (SERS) pension extrapolator represents the change in pension
contributions based on projected employer contribution rates. The SERS extrapolator in Table A.5 does not
reflect the projected growth in wages or personnel. Hence, the total growth in pension contributions would
equal the product of the growth rates for SERS contribution rates, wages and any assumed growth or
decline in the state complement.
The forecast assumes that payments for active employee healthcare increases at an average rate of 3.5
percent per annum after FY 2021-22. That rate is equal to general consumer inflation plus a 1.5 percentage
point premium for healthcare costs. It is also roughly equivalent to the increase in the per capita active
employee healthcare premiums for the past six fiscal years. The retiree healthcare extrapolator assumes
that the employer contribution rate will dramatically increase in FY 2020-21 to return the rate to normal
rate after the temporary rate reduction in FY 2020-21. The extrapolator rate then returns to 5.6 percent
per annum. The projected growth rates are based on the latest projection of employer benefit payments
published by the actuary for the REHP.
Non-personnel expenses include items such as computers, office supplies and utilities. The forecast as-
sumes those expenditures grow at the same rate as the regional CPI-U. Non-personnel expenses also
include grants or subsidies made to local units and institutions. Forecasts for grants and subsidies generally
assume that the relevant service population grows with demographic projections, and the average cost to
provide services grows with inflation. Two exceptions are the basic and special education subsidies. For
those amounts, the relevant extrapolator (roughly 1.9 percent per annum) reflects an average pay increase
(3.5 percent per annum), a general turnover factor (-1.0 percent) and a demographic component (-0.7 to
-0.4 percent).
Table A.6 provides both historical and future projections on General Fund expenditures by the largest
departments and overall and compares that to the Regional CPI-U levels and Nominal State GDP. The
bottom half of the table provide average annual growth rates.
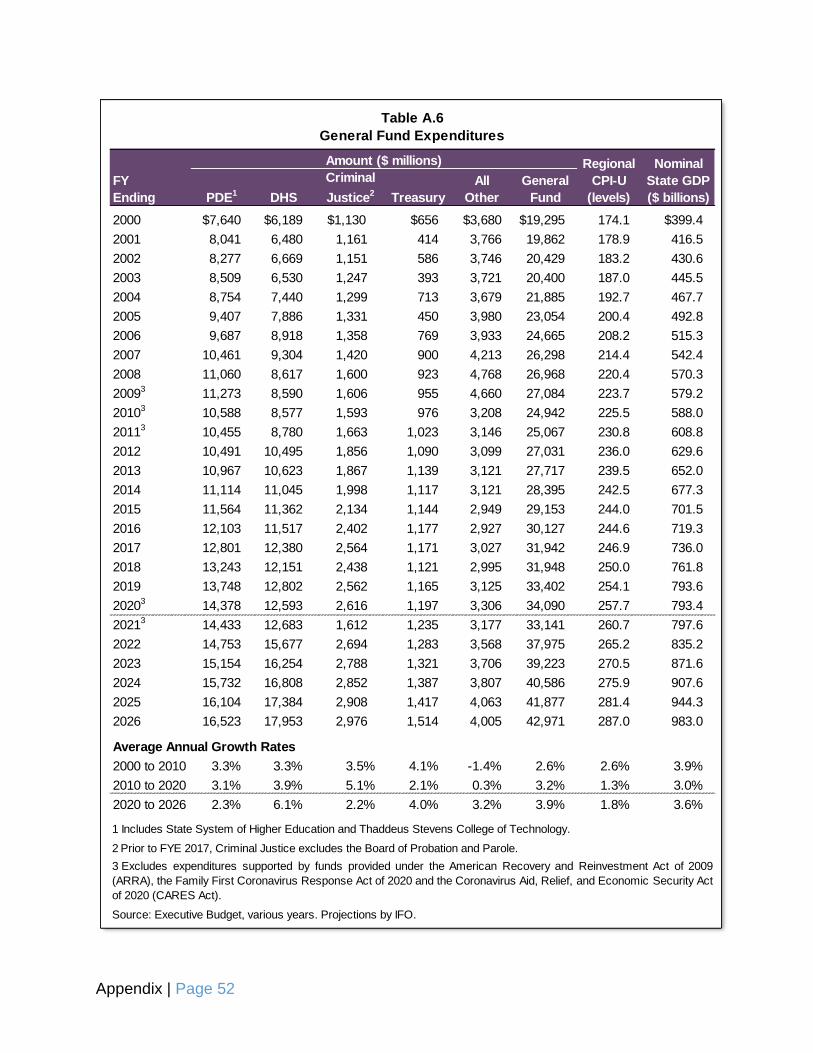
Appendix | Page 52
FY
Ending PDE1
DHS
Criminal
Justice2
Treasury
All
Other
General
Fund
2000 $7,640 $6,189 $1,130 $656 $3,680 $19,295 174.1 $399.4
2001 8,041 6,480 1,161 414 3,766 19,862 178.9 416.5
2002 8,277 6,669 1,151 586 3,746 20,429 183.2 430.6
2003 8,509 6,530 1,247 393 3,721 20,400 187.0 445.5
2004 8,754 7,440 1,299 713 3,679 21,885 192.7 467.7
2005 9,407 7,886 1,331 450 3,980 23,054 200.4 492.8
2006 9,687 8,918 1,358 769 3,933 24,665 208.2 515.3
2007 10,461 9,304 1,420 900 4,213 26,298 214.4 542.4
2008 11,060 8,617 1,600 923 4,768 26,968 220.4 570.3
20093
11,273 8,590 1,606 955 4,660 27,084 223.7 579.2
20103
10,588 8,577 1,593 976 3,208 24,942 225.5 588.0
20113
10,455 8,780 1,663 1,023 3,146 25,067 230.8 608.8
2012 10,491 10,495 1,856 1,090 3,099 27,031 236.0 629.6
2013 10,967 10,623 1,867 1,139 3,121 27,717 239.5 652.0
2014 11,114 11,045 1,998 1,117 3,121 28,395 242.5 677.3
2015 11,564 11,362 2,134 1,144 2,949 29,153 244.0 701.5
2016 12,103 11,517 2,402 1,177 2,927 30,127 244.6 719.3
2017 12,801 12,380 2,564 1,171 3,027 31,942 246.9 736.0
2018 13,243 12,151 2,438 1,121 2,995 31,948 250.0 761.8
2019 13,748 12,802 2,562 1,165 3,125 33,402 254.1 793.6
20203
14,378 12,593 2,616 1,197 3,306 34,090 257.7 793.4
20213
14,433 12,683 1,612 1,235 3,177 33,141 260.7 797.6
2022 14,753 15,677 2,694 1,283 3,568 37,975 265.2 835.2
2023 15,154 16,254 2,788 1,321 3,706 39,223 270.5 871.6
2024 15,732 16,808 2,852 1,387 3,807 40,586 275.9 907.6
2025 16,104 17,384 2,908 1,417 4,063 41,877 281.4 944.3
2026 16,523 17,953 2,976 1,514 4,005 42,971 287.0 983.0
2000 to 2010 3.3% 3.3% 3.5% 4.1% -1.4% 2.6% 2.6% 3.9%
2010 to 2020 3.1% 3.9% 5.1% 2.1% 0.3% 3.2% 1.3% 3.0%
2020 to 2026 2.3% 6.1% 2.2% 4.0% 3.2% 3.9% 1.8% 3.6%
1 Includes State System of Higher Education and Thaddeus Stevens College of Technology.
2 Prior to FYE 2017, Criminal Justice excludes the Board of Probation and Parole.
3.Excludes expenditures supported by funds provided under the American Recovery and Reinvestment Act of 2009
(ARRA), the Family First Coronavirus Response Act of 2020 and the Coronavirus Aid, Relief, and Economic Security Act
of 2020 (CARES Act).
Source: Executive Budget, various years. Projections by IFO.
Table A.6
General Fund Expenditures
Amount ($ millions) Regional
CPI-U
(levels)
Nominal
State GDP
($ billions)
Average Annual Growth Rates

Appendix | Page 53
Other Funds
In addition to the General Fund, the Commonwealth maintains numerous special funds dedicated to specific
purposes. In general, this report does not address those funds; however, three special funds have unique
implications for General Fund expenditures. For recent fiscal years, General Fund appropriations for the
Departments of Human Services and Conservation and Natural Resources have been supplemented by the
Lottery Fund (Human Services), the Tobacco Settlement Fund (Human Services) and the Oil and Gas Lease
Fund (Conservation and Natural Resources). Table A.7 displays a history and forecast for special funds
that augment General Fund expenditures.
Due to the interrelation between these special funds and certain General Fund appropriations, this Appendix
projects revenues and expenditures for the Lottery Fund, Tobacco Settlement Fund and Oil and Gas Lease
Fund for FY 2020-21 to FY 2025-26. These forecasts inform the projection of General Fund appropriations
Fiscal Year Lottery1 Tobacco2 Oil & Gas3 Total
2008-09 $301 $248 $12 $561
2009-10 178 263 19 460
2010-11 178 228 24 430
2011-12 178 290 60 528
2012-13 309 255 68 632
2013-14 330 256 102 688
2014-15 477 326 132 935
2015-16 310 284 86 680
2016-17 308 297 50 655
2017-18 253 303 58 614
2018-19 372 291 48 710
2019-20 338 290 70 698
2020-21 352 299 53 704
2021-22 388 264 29 681
2022-23 388 264 29 681
2023-24 388 264 29 681
2024-25 388 264 29 681
2025-26 388 264 29 681
1 Includes MA Long-Term Care, Home and Community-Based Services, Community HealthChoices and MA
Transportation.
3..Includes General Government, State Parks and State Forests.
2..Includes MA for Workers with Disabilities, Long-Term Care, Home and Community-Based Services,
Community HealthChoices and Uncompensated Care.
Table A.7
Other Fund Disbursements to Offset General Fund Expenditures
Note: Millions of dollars.

Appendix | Page 54
found in the main body of the report. Unless otherwise noted, if special funds cannot sustain the same
level of funding provided in prior years, the analysis assumes that future General Fund appropriations will
increase to make up the difference.
Lottery Fund
The majority of Lottery Fund revenues support programs that address the needs of a growing elderly
population in Pennsylvania. The Departments of Human Services, Revenue and Transportation receive
General Fund and Lottery Fund appropriations. Lottery monies fund most of the budget for the Department
of Aging, and that agency does not receive any General Fund appropriations.
For FY 2019-20, Lottery Fund expenditures ($2.08 billion) exceeded funds available ($1.96 billion) resulting
in a $120 million negative ending balance. (See Table A.8.) The forecast assumes that (1) the Lottery
Fund will absorb $352 million of DHS program costs in FY 2020-21 and $388 million in FY 2021-22, and (2)
programs administered by the Department of Transportation will be flat funded for all future years. Com-
bined with higher revenues, these assumptions allow the Lottery Fund to generate a $120 million ending
balance in FY 2020-21 and maintain a positive ending balance in future fiscal years.
Gross ticket sales are projected to grow at an average rate of 1.8 percent per annum from FY 2020-21 to
FY 2025-26:
Instant ticket sales grow by 2.3 percent per annum, as the model projects very strong growth for
FY 2020-21 (10.3 percent), followed by flat growth in FY 2021-22 as casinos, restaurants and
entertainment establishments fully reopen.
Multi-state Lottery sales are primarily driven by large jackpots and grow at an average rate of 1.2
percent per annum.
Other traditional game (in-state lottery, numbers and raffle) sales decline by 0.8 percent per an-
num. Numbers games are projected to decline by 2.4 percent per annum, while in-state lottery
sales are projected to increase by 2.7 percent per annum.
Sales for iLottery are projected to total $884 million in FY 2020-21 and were likely impacted by the
closure of casinos in response to the COVID-19 pandemic, as consumption shifted to online plat-
forms. Sales in future fiscal years grow at an anticipated rate of 2.9 percent per annum.
The forecast projects that net revenues (gross ticket sales less prizes, commissions, transfers and other
amounts) grow at an average rate of 1.8 percent per annum from FY 2020-21 to FY 2025-26 while total
expenditures increase by 4.4 percent per annum. The department details are as follows:
Department of Aging appropriations grow by 2.8 percent per annum. Those revenues are ear-
marked for general operations, PENNCARE, Pre-Admission Assessment, Caregiver Support, Alz-
heimer’s Outreach, Pharmaceutical Assistance Fund and Grants to Senior Centers. PENNCARE ap-
propriations for FY 2020-21 decline due to program cost shifts to the Community HealthChoices
appropriation in DHS and grow at a rate of 4.3 percent per annum thereafter. The Pharmaceutical
Assistance Fund forecast assumes flat funded appropriations in all years as the program’s income
thresholds limit the growth in the eligible population. Other programs are projected based on trends
for the 65 or older age cohort or the total population and the CPI-U.

Appendix | Page 55
Projections for DHS appropriations (primarily MA Community HealthChoices) assume the Lottery
Fund will absorb $352 million of program costs in FY 2020-21 and $388 million in FY 2021-22. This
level of DHS support allows the Lottery Fund to maintain a positive balance in future fiscal years.
Annual budget shortfalls in FY 2021-22 and subsequent years are offset by the $120 million pro-
jected ending balance in FY 2020-21.
Department of Revenue (DOR) appropriations grow by 36.1 percent in FY 2021-22 and by 1.4
percent per annum thereafter. Approximately two-thirds of appropriations are used for administra-
tive and advertising expenses, vendor commissions and the payment of prize monies. A transfer
to the Lottery Fund for the Property Tax Rent Rebate (PTRR) program that would have occurred
in FY 2020-21 was shifted into FY 2019-20. For FY 2021-22 and future years, the transfer reverts
to a normal level and that reversion drives the high growth rate in FY 2021-22. The PTRR forecast
declines over the forecast period due to the program’s statutorily set rebate amounts and income
eligibility thresholds. As incomes rise over time, more households will exceed the income limits.
Department of Transportation appropriations are held flat through the forecast period. The reve-
nues are earmarked for the Older Pennsylvanians Shared Ride program and a transfer to the Public
Transportation Trust Fund.
Tobacco Settlement Fund
The Tobacco Settlement Fund receives monies paid to the Commonwealth under the Tobacco Master Set-
tlement Agreement. The agreement ended litigation between certain large tobacco companies and state
attorneys general regarding the advertising, marketing and promotion of tobacco products, as well as the
costs incurred by state Medicaid programs to treat smoking-related illnesses. The revenues received by the
fund generally are used for health-related programs.
Fiscal Year 19-20 20-21 21-22 22-23 23-24 24-25 25-26
Beginning Balance $4 -$120 -- -- -- -- --
Gross Ticket Sales 5,201 5,860 $5,824 $5,942 $6,091 $6,244 $6,403
Less Field Paid Prizes & Comm. -3,525 -4,012 -3,992 -4,073 -4,176 -4,283 -4,393
Transfers, Earnings and Lapses 279 82 117 113 109 105 101
Net Revenue 1,955 1,930 1,949 1,982 2,024 2,066 2,111
Funds Available 1,959 1,810 1,949 1,982 2,024 2,066 2,111
Aging 465 474 487 501 515 530 544
Human Services 338 352 388 388 388 388 388
Revenue 1,106 693 943 953 967 981 995
Transportation 171 171 171 171 171 171 171
Total Expenditures 2,079 1,690 1,989 2,013 2,041 2,070 2,098
Ending Balance -120 120 -40 -31 -17 -4 13
Note: Figures are in dollar millions. Beginning balance omitted for FY 21-22 and thereafter.
Table A.8
Lottery Fund Financial Statement

Appendix | Page 56
For FY 2019-20, receipts ($348 million) were less than expenditures ($354 million), which decreased the
fund balance from $113 million at the beginning of the fiscal year to an estimated $106 million at the end
of the year (excludes federal funds). Tobacco Settlement Fund revenue projections for FY 2020-21 to FY
2025-26 are based on the schedule of annual payments to Pennsylvania included in the Master Settlement
Agreement.
As permitted by Act 43 of 2017, the Commonwealth Financing Authority issued thirty-year bonds with a
principal amount of $1.5 billion backed by proceeds from the Master Settlement Agreement. Annual prin-
cipal and interest payments totaling $115 million began in FY 2019-20. Funds to make the principal and
interest payments will be transferred to the Commonwealth Financing Authority. Act 23 of 2020 mandates
a transfer of cigarette tax revenues into the Tobacco Settlement Fund in the amount of the required debt
service for FY 2020-21. As a result, the fund is held harmless in the current fiscal year. The forecast assumes
that General Fund revenues will continue to be transferred into the fund to cover the annual debt service
payments.
The expenditure forecast reflects the following assumptions:
The Department of Health expenditures are based on the FY 2020-21 percentage allocations of
receipts for the Tobacco Use, Prevention and Cessation and the Health Research line items. These
allocations are used for all years of the forecast.
Fiscal Year 19-20 20-21 21-22 22-23 23-24 24-25 25-26
Beginning Balance1 $113 $106 $18 -- -- -- --
Gross Settlements 346 326 326 $326 $326 $326 $326
Transfer to Tobacco Revenue Bond Debt Service -115 -115 -115 -115 -115 -115 -115
Transfer from Cigarette Tax 115 115 115 115 115 115 115
Interest and Other 2 2 0 0 0 0 0
Total Revenues 348 328 326 326 326 326 326
Funds Available 461 434 344 326 326 326 326
Community & Economic Development2 3 3 3 3 3 3 3
Health2 61 114 59 59 59 59 59
Human Services2 291 299 264 264 264 264 264
Total Expenditures 355 416 326 326 326 326 326
Ending Balance 106 18 18 -- -- -- --
2.FY 19-20 expenditures are presented on a cash basis. FY 20-21 expenditures may reflect prior year
spending authority in addition to current year appropriations.
Table A.9
Tobacco Settlement Fund Financial Statement
Note: Millions of dollars. Excludes federal funds.
1 Beginning balance omitted for FY 22-23 and thereafter.
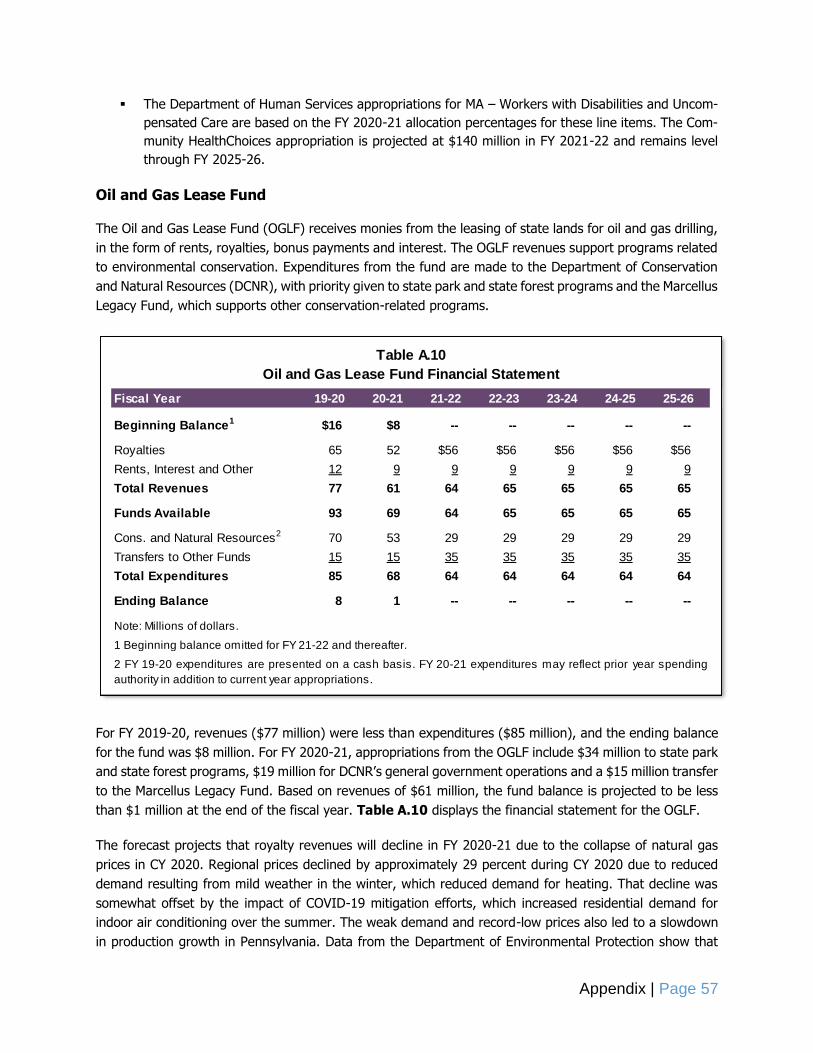
Appendix | Page 57
The Department of Human Services appropriations for MA – Workers with Disabilities and Uncom-
pensated Care are based on the FY 2020-21 allocation percentages for these line items. The Com-
munity HealthChoices appropriation is projected at $140 million in FY 2021-22 and remains level
through FY 2025-26.
Oil and Gas Lease Fund
The Oil and Gas Lease Fund (OGLF) receives monies from the leasing of state lands for oil and gas drilling,
in the form of rents, royalties, bonus payments and interest. The OGLF revenues support programs related
to environmental conservation. Expenditures from the fund are made to the Department of Conservation
and Natural Resources (DCNR), with priority given to state park and state forest programs and the Marcellus
Legacy Fund, which supports other conservation-related programs.
For FY 2019-20, revenues ($77 million) were less than expenditures ($85 million), and the ending balance
for the fund was $8 million. For FY 2020-21, appropriations from the OGLF include $34 million to state park
and state forest programs, $19 million for DCNR’s general government operations and a $15 million transfer
to the Marcellus Legacy Fund. Based on revenues of $61 million, the fund balance is projected to be less
than $1 million at the end of the fiscal year. Table A.10 displays the financial statement for the OGLF.
The forecast projects that royalty revenues will decline in FY 2020-21 due to the collapse of natural gas
prices in CY 2020. Regional prices declined by approximately 29 percent during CY 2020 due to reduced
demand resulting from mild weather in the winter, which reduced demand for heating. That decline was
somewhat offset by the impact of COVID-19 mitigation efforts, which increased residential demand for
indoor air conditioning over the summer. The weak demand and record-low prices also led to a slowdown
in production growth in Pennsylvania. Data from the Department of Environmental Protection show that
Fiscal Year 19-20 20-21 21-22 22-23 23-24 24-25 25-26
Beginning Balance1 $16 $8 -- -- -- -- --
Royalties 65 52 $56 $56 $56 $56 $56
Rents, Interest and Other 12 9 9 9 9 9 9
Total Revenues 77 61 64 65 65 65 65
Funds Available 93 69 64 65 65 65 65
Cons. and Natural Resources2 70 53 29 29 29 29 29
Transfers to Other Funds 15 15 35 35 35 35 35
Total Expenditures 85 68 64 64 64 64 64
Ending Balance 8 1 -- -- -- -- --
Table A.10
Oil and Gas Lease Fund Financial Statement
Note: Millions of dollars.
1 Beginning balance omitted for FY 21-22 and thereafter.
2 FY 19-20 expenditures are presented on a cash basis. FY 20-21 expenditures may reflect prior year spending
authority in addition to current year appropriations.

Appendix | Page 58
statewide production through November 2020 grew by just 3.4 percent from the prior year, a significant
deceleration from annual growth rates of 14.1 percent in CY 2018 and 12.1 percent in CY 2019.
There are several factors that could lead to price recovery in the out-years. For early CY 2021, there should
be more demand for residential electricity due to increased telecommuting during the winter months. Nat-
ural gas accounts for 41 percent of electricity generation nationwide, the largest share among all generation
sources. The slowdown in CY 2020 production growth could also contribute to price recovery at the begin-
ning of the forecast period. Regional prices are projected to grow by 77 percent in CY 2021. Prices are then
forecast to stabilize in the rest of the forecast period, settling at a level similar to CY 2019. Pennsylvania
production is projected to increase at a rate of 3.9 percent per annum during the forecast period.13 Recent
data show that production on state lands has not increased with statewide production. Therefore, the OGLF
royalty revenues are largely dependent on natural gas prices. The revenue projection uses a combination
of data provided by DCNR, the Department of Environmental Protection and Bentek Energy. Royalties are
forecasted using expected trends in price and production through the forecast horizon, with adjustments
to reflect actual prices received from sales of the gas extracted from state lands. Rentals and bonus pay-
ments are projected to remain flat.
The forecast reflects the following assumptions:
Expenditures from the fund represent statutory provisions for (1) an appropriation of up to $50
million annually for DCNR and (2) a $35 million transfer to the Marcellus Legacy Fund for distribu-
tion to the Environmental Stewardship Fund ($20 million for FY 2017-18 and thereafter) and the
Hazardous Sites Cleanup Fund ($15 million for FY 2017-18 and thereafter). This transfer was re-
duced to $15 million for FY 2019-20 and FY 2020-21, but the forecast assumes that it returns to
$35 million in the out-years.
Under current law, at least $85 million of available funds are needed each fiscal year to meet the
statutory obligations of the OGLF. The current revenue forecast projects that the fund can support
$29 million in annual appropriations for DCNR operations and the $35 million transfer to the Mar-
cellus Legacy Fund.
13 Price and production projections are from Bentek Energy.
