abp annual report 05-06 body final · pdf fileannual amount of water injected ... supply...
TRANSCRIPT


Member Agencies: Orange County Water District
Water Replenishment District of Southern California
Long Beach Water Department
Golden State Water Company
Los Angeles County Flood Control District
Author: Matt Frary Los Angeles County Department of Public Works Submitted by: Matt Frary, Secretary Joint Management Committee

TABLE OF CONTENTS Page Introduction ............................................................................................... 1 Summary................................................................................................... 1 Design and Construction........................................................................... 3 Injection Operations .................................................................................. 5 Extraction Operations ............................................................................... 8 Maintenance ............................................................................................. 8 Hydrologic Effects ................................................................................... 11 Chlorides................................................................................................. 19 Financing and Costs ............................................................................... 27 Hydroelectric Revenues.......................................................................... 31 FIGURES 1. Monthly Amount of Water Injected ................................................. 7 2. Annual Amount of Water Injected ................................................... 7 3. Injection and Extraction Well Operating Status ..............................10 Groundwater Elevation Graphs 4a. Recent Zone West of San Gabriel River ...................................... 14 4b. Recent Zone East of San Gabriel River ........................................ 14 5a. C-Zone West of San Gabriel River ............................................... 15 5b. C-Zone East of San Gabriel River ................................................. 15 6a. B-Zone West of San Gabriel River ............................................... 16 6b. B-Zone East of San Gabriel River ................................................. 16 7a. A-Zone West of San Gabriel River ............................................... 17 7b. A-Zone East of San Gabriel River ................................................. 17 8a. I-Zone West of San Gabriel River ................................................. 18 8b. I-Zone East of San Gabriel River................................................... 18 Chloride Concentration Graphs 9a. Recent Zone West of San Gabriel River 22 9b. Recent Zone East of San Gabriel River 22 10a. C-Zone West of San Gabriel River 23 10b. C-Zone East of San Gabriel River 23 11a. B-Zone West of San Gabriel River 24 11b. B-Zone East of San Gabriel River 24 12a. A-Zone West of San Gabriel River 25 12b. A-Zone East of San Gabriel River 25 13a. I-Zone West of San Gabriel River 26 13b. I-Zone East of San Gabriel River 26 TABLES 1. Injection Operations......................................................................... 6 2. Groundwater Elevation Summary.................................................. 13 3. Chloride Concentration Summary ................................................. 21 4. Quantity of Water Injected and Costs............................................ 27 5. Distribution of Services and Supplies Costs for Injection 28 6. Costs of Services and Supplies for Injection ................................. 29 7. Costs of Services and Supplies for Extraction............................... 30

APPENDIX Recent Aquifer Groundwater ................................................................ A-1 C-Zone Groundwater ............................................................................ A-2 B-Zone Groundwater ............................................................................ A-3 A-Zone Groundwater ............................................................................ A-4 I-Zone Groundwater.............................................................................. A-5 Recent Aquifer Chlorides ...................................................................... A-6 C-Zone Chlorides.................................................................................. A-7 B-Zone Chlorides .................................................................................. A-8 A-Zone Chlorides .................................................................................. A-9 I-Zone Chlorides ................................................................................. A-10 Chloride Section Along Barrier............................................................ A-11 Chloride Data Used for R Zone Contours & Cross-Section ................ A-12 Chloride Data Used for C Zone Contours & Cross-Section ................ A-13 Chloride Data Used for B Zone Contours & Cross-Section ................ A-14 Chloride Data Used for A Zone Contours & Cross-Section ................ A-15 Chloride Data Used for I Zone Contours & Cross-Section.................. A-17 Alamitos Well Location Map A-19

1
INTRODUCTION
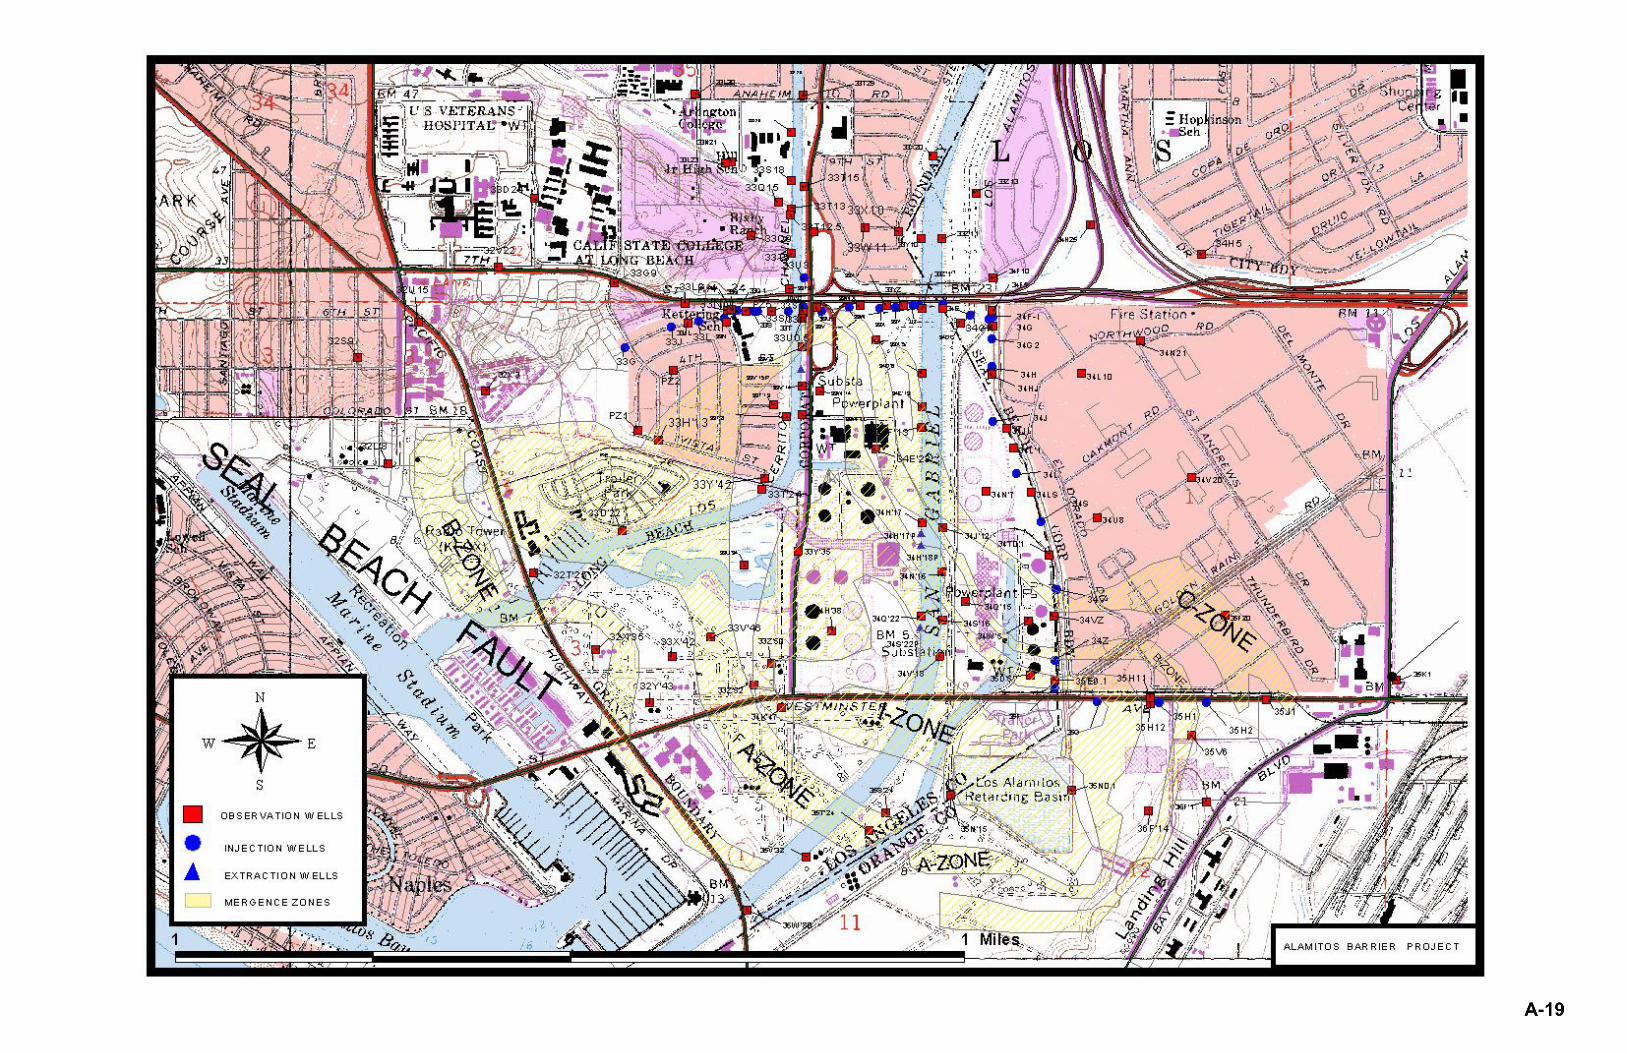
The Alamitos Barrier Project was designed and constructed to protect the groundwater
supplies of the Central Basin of the County of Los Angeles and the southwest portion of
the Coastal Plain area in Orange County from the intrusion of seawater through the
Alamitos Gap area. The project facilities are located near the Los Angeles-Orange
County line about two miles inland from the mouth of the San Gabriel River. The
original facilities included injection wells to form a freshwater pressure ridge and
extraction wells to form a salt water trough. The freshwater ridge that was intended to
block the landward gradient of intruding seawater has proven to be historically effective.
However, the salt water trough that was intended to reverse the landward gradient of
intruding seawater has proven to be historically ineffective. As a result, the extraction
wells are currently not in operation. A map showing all injection and observation wells
is shown on page A-19.
The County of Los Angeles Department of Public Works (Public Works) operates and
maintains the project and its physical facilities under the direction and approval of the
Joint Management Committee (JMC), acting on behalf of the Los Angeles County Flood
Control District (LACFCD) and the Orange County Water District (OCWD).
This report summarizes design and construction issues, operation and maintenance
activities, hydrologic effects, groundwater chloride concentrations, and project costs for
Fiscal Year (FY) 2005-06 (i.e., July 1, 2005 through June 30, 2006).
SUMMARY
During this reporting period, a total of 3,457.8 acre-feet of water were injected at an
average rate of 4.8 cubic feet per second and a total cost of $1,602,015. The OCWD
purchased 826.7 acre-feet at a cost of $381,900. The Water Replenishment District of
Southern California purchased 2,631.1 acre-feet at a cost of $1,220,115.

2
The cost of services and supplies for injection, excluding the costs of water, was
$464.30/acre-foot this year and significantly greater than the $181.21/acre-foot it was
last year (FY04-05). The higher cost in FY05-06 is the result of managing multiple
repair and improvement projects (PRV Replacement and Cathodic Protection) during
the year, the latest cycle of observation well cleanouts, a greater number of injection
well redevelopments, new costs related to the reclaim water program, and various fixed
costs despite reduced injections. The only one of these four factors that will continue to
regularly impact the cost of services and supplies for injection is the reclaim water
program costs. The project management costs will vary from year to year depending on
the need to repair or improve the barrier facilities. The observation well cleanout costs
and injection well redevelopment costs will not be incurred each fiscal year because
they are based on cyclical activities.
The barrier as a whole has continued to control the intrusion of seawater during this
reporting period (FY 2005-06). As expected, the groundwater levels near the barrier
were typically higher than the surrounding areas. Average groundwater levels have
increased in the deeper aquifers (the A, I, and Main zones) and slightly decreased in the
shallower aquifers (the R, C, and B Zones). Chloride concentrations at the majority of
the wells along the barrier alignment indicate freshwater conditions. However, several
areas continue to record high chloride concentrations and are discussed in detail
later on.

3
DESIGN AND CONSTRUCTION
Barrier Water Supply Facilities Improvements Project
This project involves bonding the pipe joints and installing sacrificial anodes along the
water supply pipeline. It was originally anticipated that construction of this cathodic
protection system (known as the Barrier Water Supply Facilities Improvements project)
would begin in FY 2005-06. However, the project was postponed for budgetary reasons
and final design plans and specifications were not completed. As a result, design plans
and specifications were further modified throughout the fiscal year to identify specific
joint locations and up-to-date utilities. We expect the contract for this project to be
awarded near the end of FY 2006-07 and that construction will begin near the beginning
of FY 2007-08.
ABP Replacement of Valves at Pressure Reducing Station
The pressure reduction vault renovation project includes replacement of the aging
pressure regulating valves and ball valves and removal of the hydroelectric generation
plant. As scheduled, this project (advertised as the Alamitos Barrier Project and
Dominguez Gap Barrier Project Replacement of Valves at
Pressure Reducing Stations, and Miscellaneous Improvements) began construction in
FY 2005-06. The construction was not completed within the same fiscal year, but
should be finalized within FY 2006-07.
ABP Telemetry System Phase 1
Phase 1 of the ABP Telemetry System includes the installation of the conduits, pull
boxes, new observation well vaults, instrument housing, and antenna poles. Design
plans and specifications for this project were completed and the project was advertised
and awarded near the end of FY 2005-06. Construction should begin and end in
FY 2006-07.

4
ABP Telemetry System Phase 2
Phase 2 of the ABP Telemetry System includes the installation of the communications
cables, the instrumentation, and the software to monitor the well sites remotely. Design
plans and specifications were not yet completed during this reporting period, but it is
anticipated that design documents will be finalized and the project advertised and
awarded near the end of FY 2006-07. Construction is expected to begin at the
beginning of FY 2007-08.

5
INJECTION OPERATIONS The injection of reclaimed water into the ABP began in October 2005 and contributed
34.0 percent (1175.5 acre-feet) of the total injection volume during this reporting period.
The maximum monthly injection of 422.3 acre-feet (217.7 acre-feet imported and
204.6 acre-feet reclaimed) occurred in March 2006. The minimum monthly injection of
0.0 acre-feet occurred in May while the barrier was shutdown to inspect the inside of the
supply pipeline for the cathodic protection project. The injection volumes and costs
from July through June of both FY 2004-05 and FY 2005-06 are shown in Table 1. As
expected, Table 1 shows a decrease in total injection amount from FY 2004-05 to
FY 2005-06. This decrease was expected for two reasons. First, the barrier was
nonoperational or only partially operational for the last four months of FY 2005-06.
Additionally, during the latest reporting period, 26 well casings were redeveloped
compared to only 13 casings redeveloped during the previous reporting period.
Below is a summary of events regarding the barrier shutdown at the end of FY 2005-06.
Further dates and details will be appropriately provided in future reports.
• April 14, 2006: Public Works shuts down PRV as requested. Shutdown is due
to maintenance on the Metropolitan Water District’s South Coast Feeder, which
will stop the water supply to LB-07A upstream of the PRV. Long Beach Water
Department (LBWD) and Water Replenishment District (WRD) are allowed
to continue delivery of reclaimed water to the barrier.
• April 24, 2006: LBWD shuts down the reclaim plant to allow Public Works
to drain the supply pipeline and maximize the shutdown by performing video
inspection for the cathodic protection project.
• June 22, 2006: Public Works completes video inspection and restoration.
• June 26, 2006: Public Works begins to recharge the barrier.
• June 27 & 28, 2006: Public Works identifies a leak near the blow off vault at
Station 2+65.00 along the west leg, and LBWD and WRD identify a leak within
the reclaim plant. West leg is isolated to allow delivery to the rest of the barrier,
but entire barrier is shutdown to accommodate repairs at the reclaim plant.

OC
WD
11,
915.
357
2.1
-70.
10.
025
4.6
N/A
1,91
5.3
826.
7-5
6.8
WR
D2
3,15
0.8
1,71
0.2
-45.
70.
092
0.9
N/A
3,15
0.8
2,63
1.1
-16.
5TO
TAL
5,06
6.1
2,28
2.3
-54.
90.
01,
175.
5N
/A5,
066.
13,
457.
8-3
1.7
6
JULY
- D
EC
$423
.00
$448
.00
5.9
N/A
$480
.21
N/A
JAN
$423
.00
$458
.00
8.3
N/A
$492
.98
N/A
FEB
- JU
N$4
48.0
0$4
58.0
02.
2N
/A$4
92.9
8N
/A
OC
WD
1$8
25,7
74$2
57,6
13-6
8.8
$0$1
24,2
87N
/A$8
25,7
74$3
81,9
00-5
3.8
WR
D2
$1,3
56,3
83$7
70,6
46-4
3.2
$0$4
49,4
70N
/A$1
,356
,383
$1,2
20,1
15-1
0.0
TOTA
L$2
,182
,157
$1,0
28,2
58-5
2.9
$0$5
73,7
57N
/A$2
,182
,157
$1,6
02,0
15-2
6.6
OC
WD
12.
60.
8-6
9.6
0.0
0.4
N/A
2.6
1.1
-56.
8W
RD
24.
42.
4-4
6.3
0.0
1.3
N/A
4.4
3.6
-16.
5TO
TAL
7.0
3.2
-55.
00.
01.
6N
/A7.
04.
8-3
1.7
1 Ora
nge
Cou
nty
Wat
er D
istri
ct2 W
ater
Rep
leni
shm
ent D
istri
ct
Impo
rted
Wat
er In
ject
ions
Rec
laim
ed W
ater
Inje
ctio
nsTo
tal I
njec
tions
TAB
LE 1
. IN
JEC
TIO
N O
PER
ATI
ON
S
Per
cent
C
hang
e Fr
om
Pre
viou
s Y
ear
FY04
- 05
FY05
- 06
FY04
- 05
FY05
- 06
Per
cent
C
hang
e Fr
om
Pre
viou
s Y
ear
FY04
- 05
AV
ER
AG
E IN
JEC
TIO
N R
ATE
IN C
FS
Per
cent
C
hang
e Fr
om
Pre
viou
s Y
ear
VO
LUM
E O
F W
ATE
R IN
JEC
TED
IN A
CR
E-F
EE
T
UN
IT C
OS
T O
F W
ATE
R P
ER
AC
RE
-FE
ET
CO
ST
OF
WA
TER
PU
RC
HA
SE
D
FY05
- 06

7
Figure 1 presents the monthly amounts of water injected during FY 2005-06.
Figure 2 illustrates the annual amounts of water injected since 1980.
FIGURE 1 - MONTHLY AMOUNT OF WATER INJECTED
050
100150200250300350400450
Jul
Aug
Sep
t
Oct
Nov
Dec Ja
n
Feb
Mar
Apr
May Jun
FY 2005 - 2006
Ac-
Ft o
f Wat
er
.
Purchased by WRD Purchased by OCWD
FIGURE 2 - ANNUAL AMOUNT OF WATER INJECTED
0
1000
2000
3000
4000
5000
6000
7000
8000
80-8
181
-82
82-8
383
-84
84-8
585
-86
86-8
787
-88
88-8
989
-90
90-9
191
-92
92-9
393
-94
94-9
595
-96
96-9
797
-98
98-9
999
-00
00-0
101
-02
02-0
303
-04
04-0
505
-06
Fiscal Year
Ac-
Ft o
f Wat
er
.
Purchased by WRD Purchased by OCWD
8
EXTRACTION OPERATIONS
There were no extraction activities during FY 2005-06. As recommended by the JMC
Committee, these wells were taken out of operation in FY 2002-03. This decision was
based on results of the one year extraction well efficiency study, which demonstrated
that the chloride levels in the area decreased when the extraction wells were turned off.
The extraction wells will continue to receive minimal maintenance so that they can be
turned back on if deemed necessary in the future. Since there has been no extraction
activity for three consecutive fiscal years, the traditional summary tables are not
necessary for this 2005-06 Annual Report.
MAINTENANCE The purpose of observation well cleanouts is to remove accumulated sediment at the
bottom of the well screens to facilitate better chloride sampling of the wells. This year,
91 Alamitos Barrier observation well casings were selected for cleanouts based on the
presence of sediment blocking their perforations. Of these, 48 were cleaned out during
FY 2005-06, and the remaining casing cleanouts should be completed during
FY 2006-07. At the completion of the cycle, the success of each cleanout will be
analyzed in order to recommend new wells as necessary. The analysis and
recommendations will be discussed in future reports.
The purpose of injection well redevelopments is to remove accumulated sediment and
chemical buildup from the well casings to enable each well to operate at its maximum
injection capacity. During FY 2005-06, the County of Los Angeles Flood Control District
completed the redevelopment of the following 25 injection well casings1: 34F(A) (twice),
34F(I), 34G2(I), 34H(A), 34H(I), 34S(A), 34S(B,C), 34S(I), 33Q1(C,B), 34G(I), 34Z(I),
35F(A), 35G(I), 35H2(A,I), 33G(A,I), 33L(A,I), 33Z2(A,I), 33Z(C,B,A,I), 34J(A,I),
33N(A,I), 33Q(A,I), 33S1(C,B), 34L(C,B,A,I), 35H1(A), and 35H1(I).
1 The capital letters in parenthesis represent the aquifer(s) receiving injections from that well casing. For example, (A) = A Zone aquifer, (A,I) = A and I Zone aquifers, and so forth.

9
Figure 3 depicts the operating status of each injection and extraction well during
FY 2005-06. As indicated, most periods of nonoperation were due to either repairs or
redevelopments. Transition time before and after such repairs and redevelopments will
continue to be reduced where possible. Additionally, those wells waiting for repairs will
receive immediate attention once the barrier resumes operations.

FIGURE 3 - ABP INJECTION AND EXTRACTION WELL STATUS - FY05-06
Well No. JUL AUG SEP OCT NOV DEC JAN FEB MAR APR MAY JUN33G (A,I) R R D O O O O O O O O O O33J (A,I) M M M M M M M M M M X X X X X X X X X X X X X X X X X X X X O O O O O O O O O O33L (A,I) X X X X X X X X X X X X X X X X X X X X H H H H H H R R O O O O O O O O O O33N (A,I) O O O O O O O O O O33Q (A,I) O O O O O O O O O O33Q1 (C,B) R R D D D D O O O O O O O O O O33S (A,I) O O O O O O O O O O33S1 (C,B) S S S S S S S S S S S S S S S S S S S S S N N N N N N N N N N N N N N N N N O O O O O O O O O O33T (A,I) S S S S N N N N N N N N N N N N O O O O O O O O O O33U (A,I) O O O O O O O O O O33U3 (C,B) O O O O O O O O O O33V (A,I) O O O O O O O O O O33W (C,B,A,I) O O O O O O O O O O33X (C,B,A,I) O O O O O O O O O O33Y (C,B,A,I) D O O O O O O O O O O33Z (C,B,A,I) R R R R D D D D D D O O O O O O O O O O33Z2 (A) R R R D D O O O O O O O O O O33Z2 (I) R R R D D O O O O O O O O O O34D (C,B,A,I) D D O O O O O O O O O O34E (C,B) O O O O O O O O O O34E (I) O O O O O O O O O O34F (A) R R R O O O O O O O O O O O O O O34F (A,I) R R R O O O O O O O O O O O O O O34G (I) R R D D M M M M O O O O O O O O O O34G2 (C,B) R R D D O O O O O O O O O O34G2 (A,I) R R D D O O O O O O O O O O34H (A) R R M M M M M M M M M M O O O O O O O O O O34H (I) R R M M M M M M M M M O O O O O O O O O O34J (A) M M R R D D O O O O O O O O O O34J (I) M M R R D D O O O O O O O O O O34L (C,B,A,I) O O O O O O O O O O O O34S (A) X X X X X X X R R X X X X X X X X X X X X X X X X X X X X X X X X X X X X X O O O O O O O O O O34S (I) X X X X X X X X X R R X X X X X X X X X X X X X X X X X X X X X X X X X X X O O O O O O O O O O34S (C,B) X X X X X X X X X X R R X X X X X X X X X X X X X X X X X X X X X X X X X X O O O O O O O O O O34V (A) O O O O O O O O O O34V (I) O O O O O O O O O O34V (C,B) O O O O O O O O O O34Z (I) R R O O O O O O O O O O35F (I) R R O O O O O O O O O O35G (A,I) R R R D D D D D D D D D D D D D O O O O O O O O O O35H1 (A) S R R O O O O O O O O O O35H1 (I) S O O O O O O O O O O35H2 (A) R R D D D D D D D D D D D D D D D D D D D D O O O O O O O O O O
* 33V'15P N N N N N N N N N N N N N N N N N N N N N N N N N N N N N N N N N N N N N N N N N N N N N N N N* 34H'17P N N N N N N N N N N N N N N N N N N N N N N N N N N N N N N N N N N N N N N N N N N N N N N N N* 34H'18P N N N N N N N N N N N N N N N N N N N N N N N N N N N N N N N N N N N N N N N N N N N N N N N N* 34S'22P N N N N N N N N N N N N N N N N N N N N N N N N N N N N N N N N N N N N N N N N N N N N N N N N
*Extraction Well- Well in Operation H - Header Repair R - Redevelopment W - Water Quality Sampling
C - Casing Repair M - Misc. Repair S - Surface Leakage X - Waiting for Repair
D - Disassembled N - Not Needed T - Tremie Repair
G - Grouted O - Other Circumstances U - Under Construction
10
2005 2006

11
HYDROLOGIC EFFECTS
Groundwater Elevations
Table 2 summarizes average groundwater elevations taken during the spring months of
the last 13 years. The comparison of groundwater levels taken during spring 2005 and
2006 presented in the last columns of Table 2 shows that average groundwater levels
have increased in the deeper aquifers (the A, I, and Main zones) and slightly decreased
in the shallower aquifers (the R, C, and B Zones). It is especially significant to note this
improvement since all other recent years have shown minimal, if any, increases in
groundwater levels in the A and I Zones.
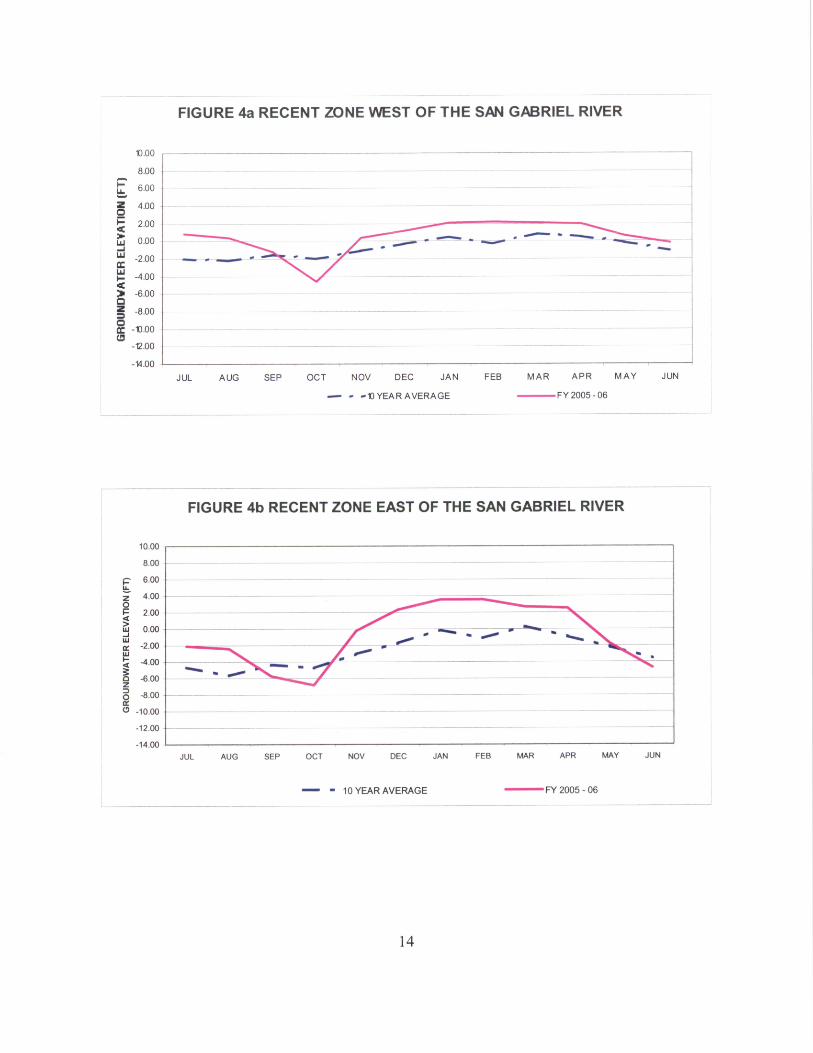
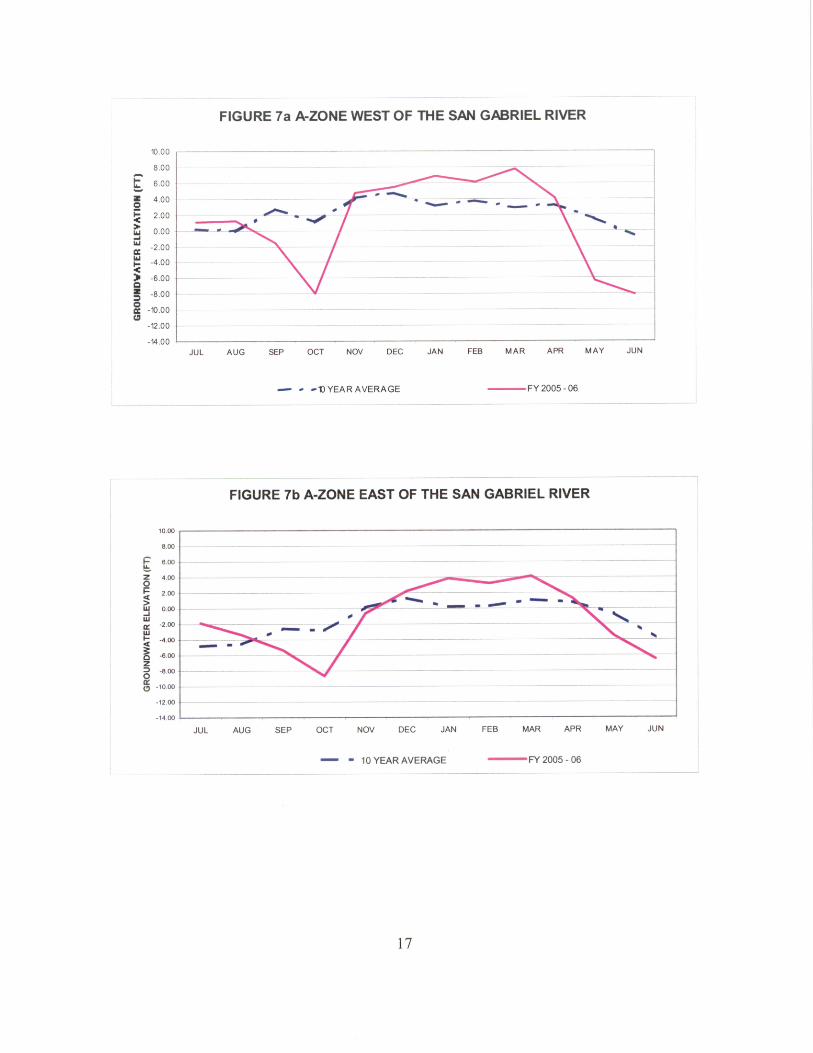
Figures 4 through 8 show the average monthly groundwater elevation against the
10-year average groundwater elevation in the vicinity of the barrier alignment in the
R, C, B, A, and I Zones, respectively. The data includes wells within the barrier
alignment and landward for approximately 2,000 feet from the barrier. Two graphs were
created for each aquifer to account for changes in groundwater elevation trends along
the barrier alignment: wells west of the San Gabriel River and wells east of the
San Gabriel River.
In each figure, monthly average groundwater elevations during the FY 2005-06 are
compared with the averages of the previous 10 years (Fiscal Years 1994-95 to
2004-05). As shown, groundwater levels have typically been at or above historical
values on both the west and east side of the San Gabriel River. It is noted that
significantly low groundwater levels observed in all graphs during the month of
October 2005 are attributable to the shutdown during the last week of September 2005
for the construction of the reclaimed water tie-in to the supply line. Similarly, the
downward trends that begin in April 2006 of each graph are attributable to the shutdown
that occurred on April 24, 2006, and lasted throughout the remainder of the fiscal year.
12
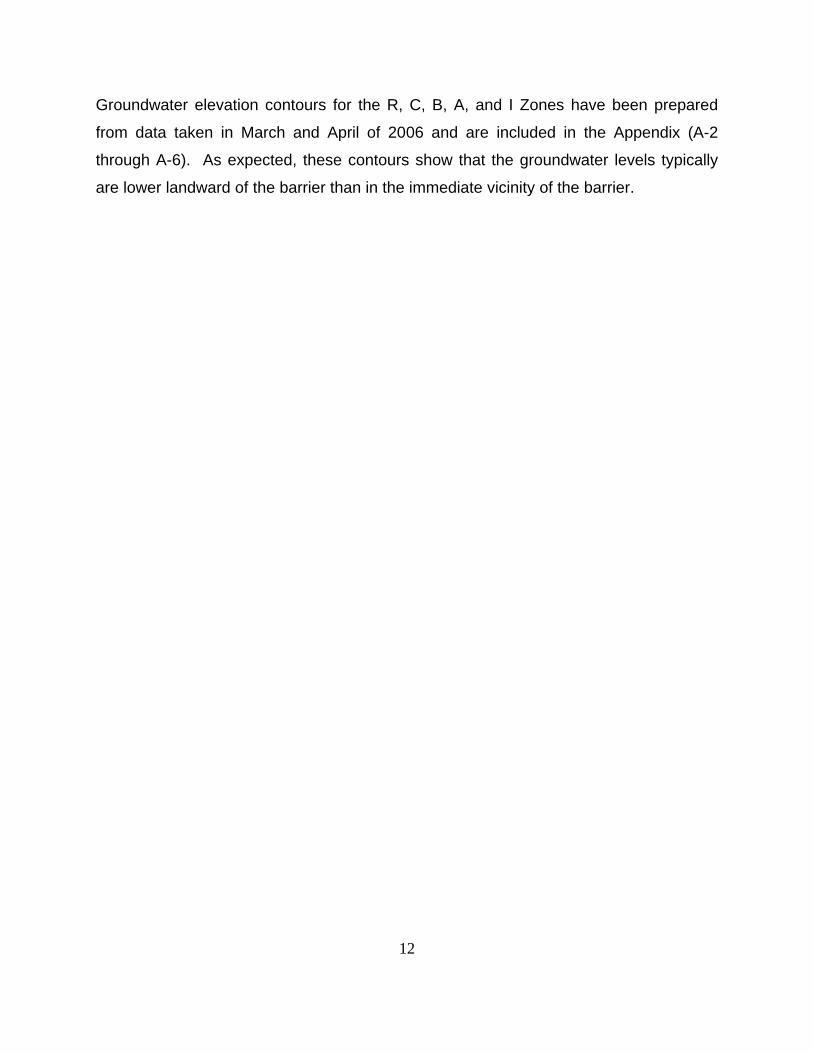
Groundwater elevation contours for the R, C, B, A, and I Zones have been prepared
from data taken in March and April of 2006 and are included in the Appendix (A-2
through A-6). As expected, these contours show that the groundwater levels typically
are lower landward of the barrier than in the immediate vicinity of the barrier.

TAB
LE 2
. G
RO
UN
DW
ATE
R E
LEVA
TIO
N S
UM
MA
RY
FOR
PR
EVIO
US
YEA
RS
Sprin
gSp
ring
Sprin
gSp
ring
Sprin
gSp
ring
Sprin
gSp
ring
Sprin
gSp
ring
Sprin
gSp
ring
Sprin
g19
9419
9519
9619
9719
9819
9920
0020
0120
0220
0320
0420
0520
06M
axim
um2.
52.
64.
55.
84.
35.
05.
95.
01.
0-0
.94.
24.
99.
3M
inim
um-5
.9-4
.7-3
.0-5
.1-5
.40.
0-1
.6-2
.2-3
.0-7
.6-8
.82.
6-1
.7A
vera
ge-1
.4-1
.3-0
.6-0
.30.
41.
91.
40.
4-0
.9-1
.8-0
.43.
62.
7M
axim
um4.
810
.19.
411
.111
.111
.14.
16.
710
.92.
19.
98.
32.
3M
inim
um0.
51.
42.
41.
61.
72.
72.
52.
00.
5-0
.43.
71.
8-0
.2A
vera
ge2.
65.
85.
86.
95.
57.
97.
85.
07.
01.
17.
34.
20.
9M
axim
um2.
04.
80.
8-0
.43.
28.
03.
86.
07.
80.
44.
17.
09.
3M
inim
um-2
.2-2
.6-2
.2-2
.0-2
.92.
4-0
.9-1
.1-2
.3-6
.43.
12.
61.
0A
vera
ge-0
.60.
3-0
.9-1
.11.
54.
40.
61.
11.
1-4
.23.
54.
83.
4M
axim
um-2
.1-0
.7-2
.04.
16.
99.
3-3
.2-3
.0-2
.4-7
.72.
44.
13.
3M
inim
um-5
.4-5
.4-6
.2-2
.5-2
.3-2
.3-1
0.2
-8.0
-7.5
-13.
2-1
.52.
12.
2A
vera
ge-3
.9-3
.9-4
.40.
62.
92.
3-6
.6-5
.0-5
.1-1
1.8
0.2
3.2
2.6
Max
imum
2.5
6.4
6.2
11.1
11.1
8.8
5.4
3.9
6.0
2.6
2.5
7.5
10.8
Min
imum
-8.5
-8.1
-4.5
-3.3
-1.9
-0.3
-2.5
-2.7
3.1
-6.6
-11.
01.
4-3
.3A
vera
ge-2
.7-0
.32.
74.
14.
26.
03.
11.
83.
5-3
.1-3
.94.
04.
6M
axim
um2.
56.
46.
26.
08.
26.
24.
02.
84.
33.
92.
56.
711
.1M
inim
um-2
.7-3
.0-7
.2-8
.7-5
.0-1
.0-8
.3-6
.7-6
.6-1
2.9
-13.
0-4
.3-1
.4A
vera
ge0.
73.
7-1
.4-2
.34.
21.
9-3
.0-2
.2-3
.5-7
.3-6
.31.
96.
0M
axim
um2.
75.
42.
65.
76.
9*
-6.9
-2.5
-5.6
-7.4
1.6
-1.0
11.7
Min
imum
-32.
6-2
9.7
-33.
4-3
0.9
-33.
0*
-30.
7-3
5.2
-39.
6-6
0.6
-34.
9-3
9.7
-16.
6A
vera
ge-1
6.9
-18.
3-1
4.8
-17.
9-1
7.1
*-1
9.8
-19.
6-2
3.9
-34.
9-1
7.8
-23.
1-7
.4
* NO
DA
TA
DA
TA F
OR
MA
IN Z
ON
E, S
PRIN
G 2
005
TAK
EN O
CT
2005
DA
TA F
OR
MA
IN Z
ON
E, S
PRIN
G 2
003
TAK
EN J
ULY
200
3
Inte
rnod
al W
ells
Eas
t of
Des
crip
tion
Inte
rnod
al W
ells
Wes
t of
San
Gab
riel R
iver
Inje
ctio
n O
pera
tions
Inte
rnod
al W
ells
Inte
rnod
al W
ells
Nor
th o
f Wes
tmin
ster
Ave
ex
cept
in th
e vi
cini
ty o
f the
e
xtra
ctio
n w
ells
San
Gab
riel R
iver
Eas
t of
Los
Ala
mito
s C
hann
el (l
andw
ard)
Gro
undw
ater
Ele
vatio
ns (f
t)
13
I
MA
IN
Zone
s
R
C &
B
A
Mai
nU
naffe
cted
by


19
CHLORIDES
Table 3 summarizes and compares the chloride concentrations by Zone and Location
for FY 2004-05 and FY 2005-06. The majority of the chloride concentrations, both
internodal and inland, have decreased from last fiscal year to this fiscal year.
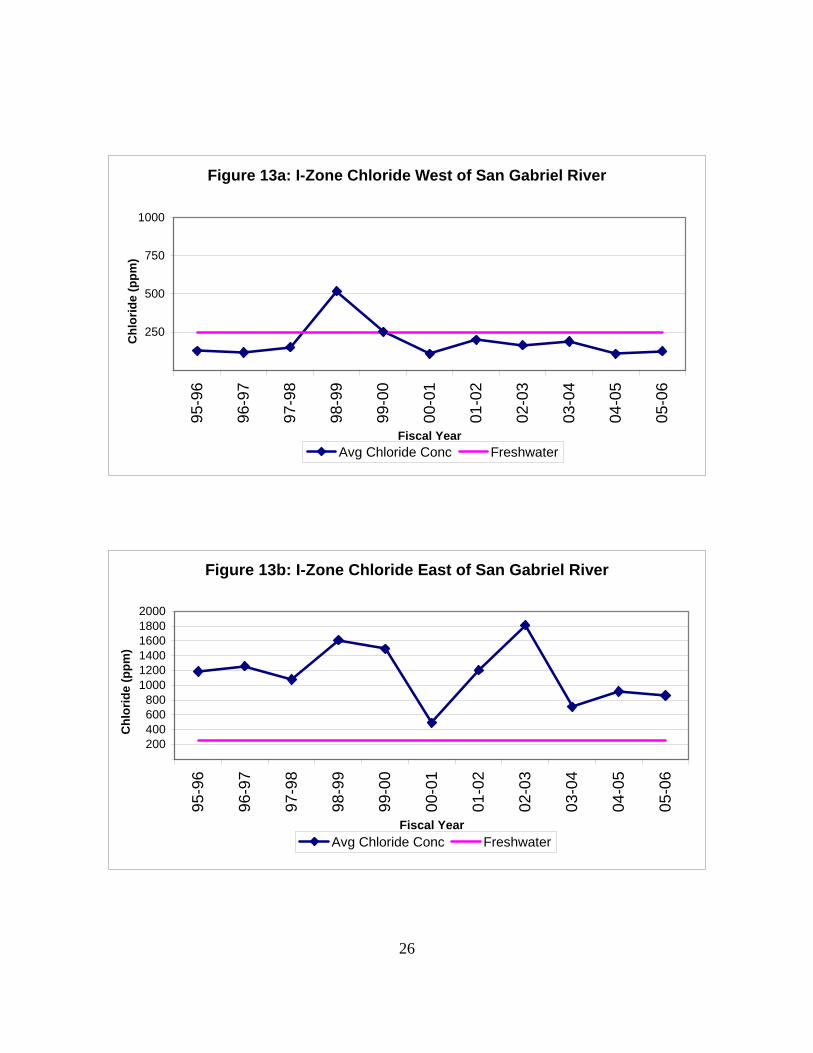
Figures 9 through 13 show the historical amount of seawater intrusion (based on
average annual chloride concentrations) in the individual aquifer zones. The data
includes wells within the barrier alignment and landward for approximately 2,000 feet
from the barrier. Two sets of graphs were created for each aquifer to account for
changes in chloride concentration trends in the areas west and east of the San Gabriel
River, respectively.
In each figure, the average chloride concentration for the last 11 fiscal years is shown
with respect to the freshwater condition (250 mg/L). As shown, chloride concentrations
in both regions of the R Zone and in the easterly region of the I Zone remain
significantly high. All other zones remain at or near 250 mg/L and typically demonstrate
a downward trend over the last few years.
Chloride contour maps for the R, C, B, A, and I Zones have been prepared as
presented in the Appendix (Figures A-6, A-7, A-8, A-9, and A-10, respectively). The
chloride contour maps for this reporting period are based on the highest chloride ion
concentration (mg/L) measured at each observation well. Chloride data were gathered
within the immediate vicinity of the barrier and do not represent basin-wide conditions
for the groundwater basin protected by the barrier. Wells with chloride concentrations of
250 mg/L or less are considered fresh. The majority of chloride measurements reported
this period were taken in June 2006. However, a few older data points as far back as
the previous two fiscal years were included where necessary and applicable. The
incorporation of these points allowed for a more accurate and more complete

20
representation of the conditions around the barrier. A list of all data points used for
these contours is included in the Appendix (A-12 through A-18).
Intrusion of seawater across the barrier continues to be controlled along most of the
alignment and the overall performance of the barrier has improved since the previous
reporting period (FY 2004-05). However, several areas continue to record high chloride
concentrations. For all zones (especially the I Zone), the southeastern end of the
barrier continues to be subject to seawater intrusion. In the shallower aquifers (the C
and B Zones), there are simply no injection wells in this southeastern region. However,
in the deeper aquifers (the A and I Zones), one possible cause may be the physical limit
of our injection rates due to the very thin aquitards in this region. Additional areas of
high chloride concentrations are as follows:
• R Zone – North of barrier along Los Cerritos Channel and along the barrier
around the San Gabriel River.
• C Zone – Northwest area of the barrier.
• A Zone – Northwest area of the barrier.
• I Zone – East leg of the barrier around well 34LS.
Three possible causes of high chloride concentrations northwest of the barrier (e.g.
Zones R, C, and A) include the transportation of seawater inland by the Los Cerritos
Channel, insufficient protection on that end of the barrier, and remaining seawater from
previous intrusions. High chlorides around 34LS (e.g. Zone I) could have arisen from
the prolonged nonoperation of injection well 34S.

21
TABLE 3. CHLORIDE CONCENTRATION SUMMARY
Zones Description June 2005 (mg/L)
June 2006 (mg/L) % Change
Maximum 15000 17000 13.3 Minimum 78 62 -20.5 R
North of Westminster
Ave Average 2543 2371 -6.8 Maximum 170 138 -18.8 Minimum 52 66 26.9 Internodal Wells Average 97 86 -11.3
Maximum 4550 1800 -60.4 Minimum 80 76 -5.0
C
Inland Wells Average 546 331 -39.4
Maximum 510 495 -2.9 Minimum 74 44 -40.5 Internodal Wells Average 146 160 9.6
Maximum 2200 2300 4.5 Minimum 80 74 -7.5
B
Inland Wells Average 388 418 7.7
Maximum 5500 4750 -13.6 Minimum 42 38 -9.5 Internodal Wells Average 272 241 -11.4
Maximum 280 210 -25.0 Minimum 24 42 75.0
A
Inland Wells Average 102 97 -4.9
Maximum 4900 7250 48.0 Minimum 22 38 72.7 Internodal Wells Average 285 463 62.5
Maximum 3950 410 -89.6 Minimum 54 26 -51.9
I
Inland Wells Average 643 130 -79.8

22
Figure 9a: R-Zone Chloride West of San Gabriel River
500
1000
1500
2000
2500
3000
95-9
6
96-9
7
97-9
8
98-9
9
99-0
0
00-0
1
01-0
2
02-0
3
03-0
4
04-0
5
05-0
6
Fiscal Year
Chl
orid
e (p
pm)
.
Avg Chloride Conc Freshwater
Figure 9b: R-Zone Chloride East of San Gabriel River
1000
2000
3000
4000
5000
6000
7000
95-9
6
96-9
7
97-9
8
98-9
9
99-0
0
00-0
1
01-0
2
02-0
3
03-0
4
04-0
5
05-0
6
Fiscal Year
Chl
orid
e (p
pm)
.
Avg Chloride Conc Freshwater

23
Figure 10a: C-Zone Chloride West of San Gabriel River
500
1000
1500
2000
2500
3000
95-9
6
96-9
7
97-9
8
98-9
9
99-0
0
00-0
1
01-0
2
02-0
3
03-0
4
04-0
5
05-0
6
Fiscal Year
Chl
orid
e (p
pm)
.
Avg Chloride Conc Freshwater
Figure 10b: C-Zone Chloride East of San Gabriel River
250
500
750
1000
95-9
6
96-9
7
97-9
8
98-9
9
99-0
0
00-0
1
01-0
2
02-0
3
03-0
4
04-0
5
05-0
6
Fiscal Year
Chl
orid
e (p
pm)
.
Avg Chloride Conc Freshwater

24
Figure 11a: B-Zone Chloride West of San Gabriel River
200400600800
100012001400160018002000
95-9
6
96-9
7
97-9
8
98-9
9
99-0
0
00-0
1
01-0
2
02-0
3
03-0
4
04-0
5
05-0
6
Fiscal Year
Chl
orid
e (p
pm)
.
Avg Chloride Conc Freshwater
Figure 11b: B-Zone Chloride East of San Gabriel River
200400600800
100012001400160018002000
95-9
6
96-9
7
97-9
8
98-9
9
99-0
0
00-0
1
01-0
2
02-0
3
03-0
4
04-0
5
05-0
6
Fiscal Year
Chl
orid
e (p
pm)
.
Avg Chloride Conc Freshwater

25
Figure 12a: A-Zone Chloride West of San Gabriel River
250
500
750
100095
-96
96-9
7
97-9
8
98-9
9
99-0
0
00-0
1
01-0
2
02-0
3
03-0
4
04-0
5
05-0
6
Fiscal Year
Chl
orid
e (p
pm)
.
Avg Chloride Conc Freshwater
Figure 12b: A-Zone Chloride East of San Gabriel River
250
500
750
1000
95-9
6
96-9
7
97-9
8
98-9
9
99-0
0
00-0
1
01-0
2
02-0
3
03-0
4
04-0
5
05-0
6
Fiscal Year
Chl
orid
e (p
pm)
.
Avg Chloride Conc Freshwater
26
Figure 13a: I-Zone Chloride West of San Gabriel River
250
500
750
100095
-96
96-9
7
97-9
8
98-9
9
99-0
0
00-0
1
01-0
2
02-0
3
03-0
4
04-0
5
05-0
6
Fiscal Year
Chl
orid
e (p
pm)
.
Avg Chloride Conc Freshwater
Figure 13b: I-Zone Chloride East of San Gabriel River
200400600800
100012001400160018002000
95-9
6
96-9
7
97-9
8
98-9
9
99-0
0
00-0
1
01-0
2
02-0
3
03-0
4
04-0
5
05-0
6
Fiscal Year
Chl
orid
e (p
pm)
.
Avg Chloride Conc Freshwater

27
FINANCING AND COSTS
This section of the report is divided into three parts: Water Costs, Services and Supplies
Costs (operation and maintenance), and Fixed Assets Costs (capital outlay). Under the
terms of the Cooperative Agreement, fixed assets are divided into facilities paid for by
the County of Los Angeles Flood Control District, facilities paid for by the Orange
County Water District, and joint facilities paid for by both agencies.
WATER COSTS During the 2005-06 fiscal year, 3,458 acre-feet of water were injected at a total cost
of $1,602,015. The monthly water rates from July 2005 to June 2006 varied periodically
as shown in Table 1. The monthly quantity of water injected and the total water costs
paid by the respective agencies are shown below in Table 4.
TABLE 4. QUANTITY OF WATER INJECTED AND COSTS
AMT BY WATER AMT BY ORANGE
REPLENISHMENT COUNTY WATER TOTAL AMT DISTRICT DISTRICT (AF)
MONTH
(AF) (AF) Jul-05 292.5 114.2 406.7 Aug-05 262.7 132.4 395.1 Sep-05 191.4 67.7 259.1 Oct-05 272.0 58.7 330.7 Nov-05 336.4 78.3 414.7 Dec-05 261.2 85.6 346.8 Jan-06 215.3 77.8 293.1 Feb-06 246.3 80.2 326.5 Mar-06 328.4 93.9 422.3
Apr-06 204.5 30.3 234.8 May-06 0.0 0.0 0.0 Jun-06 20.4 7.6 28.0
TOTAL INJECTED (AF) 2631.1 826.7 3457.8 TOTAL COST ($)
[From Tbl. 1] $1,220,115 $381,900 $1,602,015

28
SERVICES AND SUPPLIES COSTS A total of $1,608,313 was expended on services and supplies during the 2005-06 fiscal
year (not including liability insurance and water costs). Of this total, $2,857 was
charged to extraction well maintenance. Pursuant to the Cooperative Agreement, the
Orange County Water District pays a percentage of the services and supplies costs for
injection operations proportional to the percentage of the total amount of injection water
paid for by the District. The distribution of 2005-06 services and supplies costs for
injections are summarized in Table 5:
TABLE 5. DISTRIBUTION OF SERVICES AND SUPPLIES COSTS FOR
INJECTION AND EXTRACTION ACTIVITIES
ITEM LOS ANGELES COUNTY
ORANGE COUNTY TOTAL
Operation and Maintenance of Injection
Facilities (including Observation Wells)
$1,038,376 $335,586 $1,373,962
Operation and Maintenance of Extraction
Facilities $2,857 $0 $2,857
Special Programs $231,494 $0 $231,494 SUBTOTAL $1,272,727 $335,586 $1,608,313
Liability Insurance $15,171 $15,171 $30,342 TOTAL $1,287,898 $350,757 $1,638,655
The yearly costs of the services and supplies for injection operations, excluding water
costs, are shown on the following page in Table 6.

29
TABLE 6. COSTS OF SERVICES AND SUPPLIES FOR INJECTION
Fiscal Year Volume of Water Injected (Ac-Ft) Total Cost Cost Per Ac-Ft
Injected
1965-66 4,076.3 $171,888 $42.17 1966-67 3,647.1 $159,711 $43.79 1967-68 4,530.9 $210,115 $46.37 1968-69 5,530.9 $160,983 $29.11 1969-70 4,605.9 $131,929 $28.64 1970-71 4,185.5 $136,937 $32.72 1971-72 4,820.6 $138,043 $28.64 1972-73 4,999.6 $105,883 $21.18 1973-74 6,893.9 $181,518 $26.33 1974-75 5,926.6 $201,183 $33.95 1975-76 4,744.5 $213,504 $45.00 1976-77 5,233.1 $279,440 $53.40 1977-78 5,017.5 $225,982 $45.04 1978-79 5,070.8 $233,358 $46.02 1979-80 4,842.3 $252,359 $52.12 1980-81 4,107.3 $319,641 $77.82 1981-82 4,858.9 $436,558 $89.85 1982-83 5,197.7 $403,241 $77.58 1983-84 4,024.0 $489,302 $121.60 1984-85 4,724.4 $457,116 $96.76 1985-86 4,609.9 $427,278 $92.69 1986-87 6,958.3 $433,325 $62.27 1987-88 6,537.8 $441,706 $67.56 1988-89 5,599.3 $723,965 $129.30 1989-90 5,755.8 $515,964 $89.64 1990-91 6,167.7 $464,584 $75.33 1991-92 5,757.5 $865,016 $150.24 1992-93 5,240.8 $692,864 $132.21 1993-94 4,144.8 $584,975 $141.13 1994-95 3,495.7 $651,845 $186.47 1995-96 5,269.0 $509,377 $96.67 1996-97 5,739.4 $408,064 $71.10 1997-98 5,335.8 $923,342 $173.05 1998-99 5,330.4 $795,044 $149.15 1999-00 6,077.9 $589,168 $96.94 2000-01 5,398.8 $961,649 $178.12 2001-02 6,061.7 $713,299 $117.67 2002-03 5,012.3 $1,555,921 $310.42 2003-04 5,879.7 $730,652 $124.27 2004-05 5,066.1 $918,020 $181.21 2005-06 3,457.8 $1,605,456 $464.30

30
The costs of the services and supplies for extraction operations for past years, including
electrical costs, are shown in Table 7.
TABLE 7. COSTS OF SERVICES AND SUPPLIES FOR EXTRACTION
Fiscal Year Volume of Water
Extracted (Ac-Ft) Total Cost Cost Per Ac-Ft Extracted
1965-66 2,429.3 $33,654 $13.85 1966-67 2,215.4 $48,594 $21.93 1967-68 1,748.6 $57,451 $32.86 1968-69 1,832.8 $50,658 $27.64 1969-70 1,615.7 $39,862 $24.67 1970-71 1,420.5 $32,963 $23.21 1971-72 1,407.3 $23,719 $16.85 1972-73 1,078.6 $14,189 $13.16 1973-74 843.9 $36,209 $42.91 1974-75 133.5 $93,303 $698.90 1975-76 1,134.5 $84,837 $74.78 1976-77 1,283.4 $85,199 $66.39 1977-78 1,363.9 $84,029 $61.61 1978-79 1,326.6 $53,744 $40.51 1979-80 1,215.7 $34,737 $28.57 1980-81 722.6 $79,540 $110.07 1981-82 686.6 $97,808 $142.45 1982-83 962.3 $90,630 $94.18 1983-84 1,466.6 $64,734 $44.14 1984-85 1,621.3 $105,058 $64.80 1985-86 1,640.3 $92,586 $56.44 1986-87 1,700.7 $84,447 $49.65 1987-88 1,513.9 $71,700 $47.36 1988-89 1,522.4 $99,315 $65.24 1989-90 1,544.8 $66,717 $43.19 1990-91 1,278.0 $172,230 $134.77 1991-92 1,378.4 $151,520 $109.92 1992-93 1,136.1 $99,099 $87.23 1993-94 992.0 $169,621 $170.99 1994-95 940.7 $148,122 $157.46 1995-96 998.4 $130,901 $131.11 1996-97 1,200.9 $51,077 $42.53 1997-98 883.5 $64,774 $73.32 1998-99 775.6 $52,043 $67.10 1999-00 679.9 $41,320 $60.77 2000-01 404.8 $49,769 $122.95 2001-02 495.0 $53,153 $107.38 2002-03 262.7 $63,165 $240.45 2003-04 0.0 $6,068 N/A 2004-05 0.0 $3,043 N/A 2005-06 0.0 $2,857 N/A

31
HYDROELECTRIC REVENUES
No hydroelectric power was generated at the water supply pressure regulation station
during the 2005-06 fiscal year.
The hydroelectric plant has long been out of service and is currently being
decommissioned as part of the pressure regulation vault renovation project.

33T 2933L 30
33S 52
33W'1433T'13
33V' 8
33V'14
33Y'35
33W'17
34H'38
33T'24
33V'46
33H'13
33W 54
33Z' 133WX
33Y 10
34F 5
33X 20
34N' 7
34W' 5
35D' 5
34E'13
34L' 1
34Q'22
34V'18
34N'16
34E'23
34H'17
35H 11
Alamitos Barrier Project R Zone Groundwater Elevation (ft) Contours - March/April 2006
Observation Well Locations
Injection Well Locations
Barrier Alignment
Recent Zone Boundary
Recent Zone Mergence
R z
one
GW
.srf
A-1

33S 1833S 18
33STPZ5 33YZ
34L 10
33X 10
34D' 6
33XY 34F 534DG
34JL
34LS
34L' 1
34F'13
34U 8
35F 20
Alamitos Barrier ProjectC Zone Groundwater Elevation (ft) Contours - March/April 2006
Observation Well Locations
Injection Well Locations
Barrier Alignment
Recent Zone Boundary
Recent Zone Mergence
C z
one
GW
.srf
A-2

33H 57
33Q 15
33ST33NQ33JL
PZ5
33T 3
33Q 9
33YZ
34D' 6
33XY 34F 5
33Z 13
33X 20
34DG
34T0.1
34JL
34LS
34U 8
Alamitos Barrier Project B Zone Groundwater Elevation (ft) Contours - March/April 2006
Observation Well Locations
Injection Well Locations
Barrier Alignment
Recent Zone Boundary
Recent Zone Mergence
B zo
ne G
W.s
rf
A-3

Observation Well Locations
Injection Well Locations
Barrier Alignment
Recent Zone Boundary
Recent Zone Mergence
Alamitos Barrier Project A Zone Groundwater Elevation (ft) Contours - March/April 2006
A z
one
GW
.srf
A-4
33G 9
32U 15
32V 22
33T 29
33S 4333S 52
33L 3
33S 18
33Q 15
33UV33ST33NQ
33S 20
33JL
33V' 8
33L 23
33T 15
33H'13
33X 54
33Y 42
33YZ33WX
34L 10
33X 10
34D' 6
33XY 34F 5
34HJ
33Z' 1
33X 20
34DG
34T0.1
34N' 7
34W' 5
34JL
34LS
34VZ
35E0.1
34F'13
36F' 1
34N 21
34U 8
35F 20
35H 1235H 11 35J135K1

Alamitos Barrier ProjectI Zone Groundwater Elevation (ft) Contours - March/April 2006
Observation Well Locations
Injection Well Locations
Barrier Alignment
Recent Zone Boundary
Recent Zone Mergence
I zon
e G
W.s
rf
A-5
33G 9
32U 15
32V 22
33S 40
33UV33ST33NQ
33S 20
33N 21
33JL
33V' 8
33H'13
33X 54
34DG
33YZ33WX
34L 10
33X 10
34D' 6
33XY 34F 5
34GH
34HJ
33X 20
34T0.1
34N' 7
34W' 5
35D' 5
34JL
34E'13
34LS
34VZ
35E0.1
34Q'15
34N 21
34U 8
35F 20
35H 11 35J1
35K1

Alamitos Barrier Project R Zone Chloride Concentration (mg/L) Contours - June 2006*
Observation Well Locations
Injection Well Locations
Barrier Alignment
Recent Zone Boundary
Recent Zone Mergence
10000 mg/L Chloride Contour
250 mg/L Chloride Contour
500 mg/L Chloride Contour
1000 mg/L Chloride Contour
5000 mg/L Chloride Contour
R z
one
CL.
srf
A-6
* The data points used to create these contours are listed in Appendix A-12.

Alamitos Barrier ProjectC Zone Chloride Concentration (mg/L) Contours - June 2006*
C z
one
CL.
srf
A-7
250 mg/L Chloride Contour
500 mg/L Chloride Contour
1000 mg/L Chloride Contour
5000 mg/L Chloride Contour
* The data points used to create these contours are listed in Appendix A-13.* The data points labeled 'DP' are Dummy Points assumed to be 250 mg/L.
Observation Well Locations
Injection Well Locations
Barrier Alignment
Recent Zone Boundary
Recent Zone Mergence

Alamitos Barrier Project B Zone Chloride Concentration (mg/L) Contours - June 2006*
250 mg/L Chloride Contour
500 mg/L Chloride Contour
1000 mg/L Chloride Contour
5000 mg/L Chloride Contour
B zo
ne C
L.sr
f
A-8
* The data points used to create these contours are listed in Appendix A-14.
Observation Well Locations
Injection Well Locations
Barrier Alignment
Recent Zone Boundary
Recent Zone Mergence

Alamitos Barrier Project A Zone Chloride Concentration (mg/L) Contours - June 2006*
A z
one
CL.
srf
A-9
250 mg/L Chloride Contour
500 mg/L Chloride Contour
1000 mg/L Chloride Contour
5000 mg/L Chloride Contour
Observation Well Locations
Injection Well Locations
Barrier Alignment
Recent Zone Boundary
Recent Zone Mergence
* The data points used to create these contours are listed in Appendix A-15 & A-16.

Alamitos Barrier ProjectI Zone Chloride Concentration (mg/L) Contours - June 2006*
I zon
e C
L.sr
f
A-10
250 mg/L Chloride Contour
500 mg/L Chloride Contour
1000 mg/L Chloride Contour
5000 mg/L Chloride Contour
Observation Well Locations
Injection Well Locations
Barrier Alignment
Recent Zone Boundary
Recent Zone Mergence
* The data points used to create these contours are listed in Appendix A-17 & A-18.


ALA
MIT
OS
BA
RR
IER
PR
OJE
CT
REC
ENT-
ZON
E C
HLO
RID
E C
ON
CEN
TRA
TIO
NS
Chl
orid
e D
ata
Use
d fo
r Con
tour
s an
d C
ross
-Sec
tion
For C
onto
urs
ELEV
1 (f
t)C
HL
1 (m
g/L)
ELEV
2 (f
t)C
HL
2 (m
g/L)
ELEV
3 (f
t)C
HL
3 (m
g/L)
MA
X C
HLO
RID
E32
Y'4
3 4
93W
W20
0606
264.
10R
-43
1825
1825
33H
'13
493
YY
2006
0613
9.20
(R,A
)-1
865
0-3
866
0-5
814
2514
2533
L 30
491
G20
0602
1410
.00
R-5
023
0023
0033
S 18
492
AH20
0401
0710
.80
R-6
712
200
1220
033
ST 4
92B
K20
0602
0914
.90
(C,B
)/R-2
512
012
033
S 5
2 4
91J
2006
0222
12.5
0R
-54
1300
1300
33T
29 4
91D
2006
0613
10.7
0R
-56
4600
4600
33T'
13 4
92A
U20
0606
1310
.00
R-4
170
0-5
112
7512
7533
T'24
493
SS
2006
0221
8.00
R-2
911
600
1160
033
V' 8
492
BY
2006
0619
10.0
0(R
,A)
-24
8200
-54
3550
8200
33V
'14
492
JJ20
0606
199.
60R
-71
5200
5200
33V
'46
493
UU
2006
0223
5.40
R-6
166
0066
0033
W 5
4 5
01C
2006
0608
13.5
0R
-33
82-5
314
214
233
W'1
4 4
92A
T20
0606
1515
.70
R-4
677
5-6
640
0040
0033
W'1
7 4
93P
P20
0606
199.
30R
-41
2900
-51
3500
3500
33W
X 5
02A
Z20
0602
0710
.00
R-4
580
8033
X 2
0 5
02L
2006
0216
23.4
0R
-62
6262
33Y
10
502
BA
2006
0612
23.0
0R
-58
760
-87
4350
4350
33Y
'35
493
AB
2006
0615
12.5
0R
-36
1990
019
900
33Z'
1 5
02A
U20
0605
2320
.90
R-4
611
00-5
610
5011
0034
D0.
1 5
02A
X20
0605
3121
.00
R-5
717
000
1700
034
E'1
3 5
03A
U20
0606
2021
.00
R-1
925
50-5
756
0056
0034
E'2
3 5
03X
2006
0612
10.1
0R
-43
4100
4100
34F
5 5
02B
T20
0605
029.
10R
-136
175
-146
180
-156
285
285
34H
'17
503
Y20
0606
2119
.60
R-4
640
0040
0034
H'3
8 4
93Q
Q20
0606
159.
40R
-33
500
500
34J'
12 5
03U
2006
0621
19.8
0R
-28
2500
-36
7350
7350
34L'
1 5
03P
2006
0221
10.1
0R
-62
5550
5550
34N
' 7 5
03A
E20
0606
217.
00R
-51
240
-61
335
-71
2700
2700
34Q
'22
503
T20
0602
1618
.30
R-4
210
750
-57
1245
012
450
34V
'18
503
V20
0606
2118
.30
R-4
881
5081
5034
W' 5
503
AH
2006
0622
13.6
0R
-51
535
535
35D
' 5 5
03A
L20
0606
2213
.20
R-5
717
5017
5035
H 1
1 5
14F
2006
0215
7.00
R-4
290
-65
505
505
35N
0.1
504
M20
0606
147.
30R
-38
480
-68
3150
3150
35N
'15
504
P20
0606
147.
40R
-33
780
-58
1130
011
300
35S'
24 5
04K
2004
0127
7.30
R-5
511
650
1165
035
T'24
504
A20
0606
207.
90(R
,M)
-67
1450
0-1
3415
800
-201
1930
019
300
italic
ized
wel
ls a
re o
ld v
alue
s, b
ut in
clud
ed b
ecau
se th
ey're
reas
onab
ly re
cent
and
thei
r his
toric
al v
alue
s ar
e co
nsis
tent
ly in
this
rang
e
For C
ross
-Sec
tion
(Inte
rnod
al W
ells
in B
old)
REF
PT
EL.
PRO
JFC
DD
ATE
AQ
UIF
ER
A-1
2

ALA
MIT
OS
BA
RR
IER
PR
OJE
CT
C-Z
ON
E C
HLO
RID
E C
ON
CEN
TRA
TIO
NS
Chl
orid
e D
ata
Use
d fo
r Con
tour
s an
d C
ross
-Sec
tion
For C
onto
urs
ELEV
1 (f
t)C
HL
1 (m
g/L)
ELEV
2 (f
t)C
HL
2 (m
g/L)
ELEV
3 (f
t)C
HL
3 (m
g/L)
MA
X C
HLO
RID
E33
S 1
8 4
92A
G20
0606
0710
.60
C-2
2523
5023
5033
ST 4
92B
K20
0602
0914
.90
(C,B
)-2
512
012
0D
P25
033
T 13
492
AC
2006
0214
11.4
0C
-199
1800
1800
33U
11
492
AL
2006
0523
13.3
0C
-186
580
580
DP
250
33W
11
502
R20
0602
138.
90C
-183
85-2
1698
9833
X 1
0 5
02B
B20
0606
1210
.00
C-1
9084
-215
8484
33XY
502
BL
2006
0515
10.0
0C
-195
74-2
1078
7833
YZ 5
02A
B20
0602
0910
.60
C-1
9572
-210
7272
34D
' 6 5
02B
F20
0606
2020
.30
C-1
2511
600
1160
0D
P25
034
DG
502
X20
0605
118.
00C
-190
66-2
0566
66D
P25
034
F 5
502
BU
2006
0502
9.30
C-1
9176
-201
78-2
1178
7834
F 10
502
AP
2006
0517
8.80
C-2
1176
76D
P25
0D
P25
034
F'13
503
R20
0602
1621
.00
C-7
925
0025
0034
JL 5
03A
R20
0602
217.
20C
-161
138
138
34L'
1 5
03N
2006
0221
10.3
0C
-162
6060
34L
10 5
02A
K20
0606
145.
60C
-169
8686
DP
250
34LS
503
BF
2006
0503
7.00
C-1
3310
0-1
5178
-163
8410
034
T0.1
503
AB
2006
0503
6.10
B C
-134
285
610
34U
8 5
13D
2006
0215
5.40
C-1
5011
6-1
6511
011
635
F 20
513
L20
0602
156.
50C
-70
190
-78
410
-85
610
610
PZ5
492
CH
2006
0607
16.3
0(C
,B)
-25
4242
DP
= D
umm
y po
int w
ith a
n as
sum
ed c
hlor
ide
conc
entra
tion
of 2
50 m
g/L
AQ
UIF
ERFo
r Cro
ss-S
ectio
n (In
tern
odal
Wel
ls in
Bol
d)PR
OJ
FCD
DA
TER
EF P
T EL
.
A-1
3

ALA
MIT
OS
BA
RR
IER
PR
OJE
CT
B-Z
ON
E C
HLO
RID
E C
ON
CEN
TRA
TIO
NS
Chl
orid
e D
ata
Use
d fo
r Con
tour
s an
d C
ross
-Sec
tion
For C
onto
urs
ELEV
1 (f
t)C
HL
1 (m
g/L)
ELEV
2 (f
t)C
HL
2 (m
g/L)
ELEV
3 (f
t)C
HL
3 (m
g/L)
MA
X C
HLO
RID
E33
JL 4
92B
Q20
0602
0916
.00
B3
-713
513
533
NQ
492
BN
2006
0510
18.4
0B
-4-1
544
4433
Q 9
492
CM
2006
0608
35.0
0B
-85
82-9
584
-105
140
140
33Q
15
492
AN
2006
0214
10.0
0B
-268
400
400
33ST
492
BK
2006
0209
14.9
0(C
,B)
-25
120
120
33T
3 4
92C
L20
0606
0610
.00
B-4
040
-57
42-7
546
4633
T 9
492
YY
2006
0530
11.2
0B
-168
100
100
33U
11
492
AK20
0506
0712
.60
B-2
6517
017
033
U'0
.5 4
92BZ
2003
0313
10.0
0B
-58
212
212
33W
11
502
S20
0602
138.
90B
-241
164
-271
210
210
33X
10
502
BC
2006
0612
10.0
0B
-275
8888
33XY
502
BM
2006
0515
10.0
0B
-245
6060
33YZ
502
AC
2006
0209
10.6
0B
-214
70-2
6470
7034
D' 6
502
BG
2006
0620
20.3
0B
-180
125
-200
9012
534
DG
502
Y20
0605
118.
00B
-232
50-2
5750
5034
F 5
502
BS
2006
0503
9.30
B-2
3174
-271
7676
34F
10 5
02A
Q20
0605
178.
80B
-271
8282
34JL
503
AQ
2006
0221
7.20
B-1
9649
5-2
1146
049
534
L 10
502
AL
2006
0614
5.60
B-2
2488
-249
8888
34LS
503
BE
2006
0503
7.00
B-1
8878
7834
T0.1
503
AC
2006
0503
6.10
A B
-174
630
-207
410
630
34U
8 5
13E
2006
0215
5.40
B-2
2523
0023
0035
F 20
513
K20
0602
156.
50B
-115
340
340
35J1
514
M20
0412
277.
42A
B
-135
2000
-150
1030
-155
555
2000
35K
1 5
23A
2004
1227
7.96
A
B-1
3513
4-1
5015
5-1
6517
017
0PZ
5 4
92C
H20
0606
0716
.30
(C,B
)-2
542
42
italic
ized
wel
ls a
re o
ld v
alue
s, b
ut in
clud
ed b
ecau
se th
ey're
reas
onab
ly re
cent
and
thei
r his
toric
al v
alue
s ar
e co
nsis
tent
ly in
this
rang
e
AQ
UIF
ERFo
r Cro
ss-S
ectio
n (In
tern
odal
Wel
ls in
Bol
d)PR
OJ
FCD
DA
TER
EF P
T EL
.
A-1
4

ALA
MIT
OS
BA
RR
IER
PR
OJE
CT
A-Z
ON
E C
HLO
RID
E C
ON
CEN
TRA
TIO
NS
Chl
orid
e D
ata
Use
d fo
r Con
tour
s an
d C
ross
-Sec
tion
For C
onto
urs
ELEV
1 (f
t)C
HL
1 (m
g/L)
ELEV
2 (f
t)C
HL
2 (m
g/L)
ELEV
3 (f
t)C
HL
3 (m
g/L)
MA
X C
HLO
RID
E32
U 1
5 4
82M
2006
0213
51.0
0A
-17
240
240
33G
9 4
82F
2006
0605
57.2
0A
57-2
312
212
233
H'1
3 4
93Y
Y20
0606
139.
20(R
,A)
-18
650
-38
660
-58
1425
1425
33JL
492
BW
2006
0209
16.0
0(A
,I)-4
184
-79
80-1
1684
8433
L 3
492
2006
0606
25.2
0A
-60
7474
33L
23 4
92R
R20
0602
149.
40A
-344
3800
3800
33N
Q 4
92B
P20
0605
1018
.40
(A,I)
-49
64-9
346
-137
3864
33Q
15
492
AM
2006
0214
10.9
0A
-340
500
500
33S
18
492
AE
2006
0607
11.1
0A
-351
200
200
33S
20
492
BR
2006
0607
8.90
A-3
1788
-336
76-3
5592
9233
S 4
3 4
91E
2006
0608
13.0
0A
-333
142
-344
136
142
33S
52
491
H20
0602
2212
.50
A-2
8445
0-3
0940
045
033
ST 4
92B
L20
0602
0914
.90
A-6
558
-86
64-1
0056
6433
T 9
492
TT20
0605
3010
.50
A-2
6296
9633
T 15
492
SS
2006
0612
11.2
0A
-334
108
108
33T
29 4
91C
2006
0613
12.2
0A
-350
3636
33U
11
492
AJ
2006
1220
13.6
0A
-348
138
138
33U
' 3 4
92W
W20
0606
1510
.90
A-8
931
031
033
UV
492
BH
2006
0510
10.8
0A
-106
48-1
3146
-155
4448
33V
' 8 4
92B
Y20
0606
1910
.00
(R,A
)-2
482
00-5
435
5082
0033
W 1
1 5
02T
2006
0213
8.90
A-3
2170
-349
72-3
7682
8233
WX
502
AF
2006
0207
10.4
0A
-258
64-2
8112
2-3
0311
212
233
X 1
0 5
02B
D20
0606
1910
.00
A-3
2014
8-3
4012
0-3
6015
015
033
X 2
0 5
02J
2006
0216
23.2
0A
-359
180
180
33XY
502
BN
2006
0515
10.0
0A
-279
44-2
9646
-314
4646
33Y
42
501
A20
0606
0824
.90
A-3
4220
020
033
YZ 5
02A
D20
0602
0710
.60
A-2
9672
-318
7474
33Z'
1 5
02G
2006
0525
20.0
0A
-320
155
155
33Z
11 5
02V
2006
0517
23.1
0A
-321
72-3
5170
7234
D' 6
502
BH
2006
0620
20.3
0A
-270
495
-303
260
-335
590
590
34D
G 5
02Z
2006
0511
8.00
A-2
9213
0-3
2715
515
534
F 5
502
BR
2006
0502
9.50
A-2
9742
-322
80-3
4784
8434
F 10
502
AR
2006
0517
8.80
A-3
1166
-326
7878
AQ
UIF
ERFo
r Cro
ss-S
ectio
n (In
tern
odal
Wel
ls in
Bol
d)PR
OJ
FCD
DA
TER
EF P
T EL
.
A-1
5

ALA
MIT
OS
BA
RR
IER
PR
OJE
CT
A-Z
ON
E C
HLO
RID
E C
ON
CEN
TRA
TIO
NS
Chl
orid
e D
ata
Use
d fo
r Con
tour
s an
d C
ross
-Sec
tion
Con
tinue
d…Fo
r Con
tour
sEL
EV 1
(ft)
CH
L 1
(mg/
L)EL
EV 2
(ft)
CH
L 2
(mg/
L)EL
EV 3
(ft)
CH
L 3
(mg/
L)M
AX
CH
LOR
IDE
34F'
13 5
03Q
2006
0216
21.2
0A
-177
250
250
34H
25
502
AH
2006
0223
8.20
A-2
9711
2-3
1211
4-3
3210
811
434
H5
512
E20
0412
277.
21A
-305
82-3
2082
-335
9696
34H
J 5
02B
X20
0602
229.
40A
-301
66-3
2162
-331
6666
34JL
503
AP
2006
0221
7.20
A-2
6384
-288
76-3
0878
8434
L 10
502
AM
2006
0614
5.60
A-3
1078
-330
78-3
5472
7834
LS 5
03B
D20
0605
037.
00A
-238
72-2
8372
7234
N 2
1 5
12B
2006
0614
6.80
A-3
2890
-354
9696
34N
' 7 5
03A
F20
0606
217.
00A
-106
175
-144
150
-181
380
380
34T0
.1 5
03A
C20
0605
036.
10A
-239
450
450
34U
8 5
13F
2006
0227
5.40
A-2
8010
4-3
1012
612
634
V 2
0 5
13B
2006
0525
6.30
A-2
3496
-265
88-2
9290
9634
VZ 5
03B
H20
0602
276.
20A
-146
72-1
5676
7634
W' 5
503
AJ
2006
0621
13.6
0A
-81
160
-101
88-1
1911
516
035
E0.1
503
BK
2006
0222
6.50
A-7
411
011
035
F 20
513
J20
0602
156.
50A
7-1
5821
021
035
H 1
1 5
14G
2006
0215
7.00
A-1
2365
065
035
H 1
2 5
14D
2006
0531
6.50
A-1
3710
610
635
J1 5
14L
2004
1227
7.42
I A
-200
75-2
1561
0-2
3518
0016
035
K1
523
B20
0412
277.
96I
A-2
0534
-220
240
-235
515
110
36F'
1 5
05D
2006
0620
35.6
5A
-103
380
380
italic
ized
wel
ls a
re o
ld v
alue
s, b
ut in
clud
ed b
ecau
se th
ey're
reas
onab
ly re
cent
and
thei
r his
toric
al v
alue
s ar
e co
nsis
tent
ly in
this
rang
e
AQ
UIF
ERFo
r Cro
ss-S
ectio
n (In
tern
odal
Wel
ls in
Bol
d)PR
OJ
FCD
DA
TER
EF P
T EL
.
A-1
6

ALA
MIT
OS
BA
RR
IER
PR
OJE
CT
I-ZO
NE
CH
LOR
IDE
CO
NC
ENTR
ATI
ON
SC
hlor
ide
Dat
a U
sed
for C
onto
urs
and
Cro
ss-S
ectio
n
For C
onto
urs
ELEV
1 (f
t)C
HL
1 (m
g/L)
ELEV
2 (f
t)C
HL
2 (m
g/L)
ELEV
3 (f
t)C
HL
3 (m
g/L)
MA
X C
HLO
RID
E32
U 1
5 4
82L
2006
0213
51.0
0I
-74
100
100
32V
22
482
N20
0606
0573
.70
I-4
613
213
233
G 9
482
G20
0606
0657
.20
I-3
444
-68
60-7
880
8033
H'1
3 4
93X
X20
0606
139.
20I
-89
240
240
33JL
492
BW
2006
0209
16.0
0(A
,I)-4
184
-79
80-1
1684
8433
N 2
1 4
92B
V20
0606
079.
00I
-457
66-4
7166
6633
NQ
492
BP
2006
0510
18.4
0(A
,I)-4
964
-93
46-1
3738
6433
S 4
0 4
91F
2006
0222
11.8
0I
-470
400
400
33ST
492
BM
2006
0209
14.9
0I
-130
132
-148
120
-165
120
132
33T
9 4
92XX
2005
0607
10.5
0I
-373
112
112
33T'
24 4
93R
R20
0602
218.
10I
-60
1770
0-7
517
700
33U
' 3 4
92Q
Q20
0606
159.
80I
-147
300
300
33U
V 4
92B
J20
0605
1010
.80
I-2
0944
-228
42-2
4642
4433
V' 8
492
BX
2006
0619
10.0
0I
-109
1700
-139
2100
2100
33W
11
502
U20
0602
138.
90I
-423
70-4
4680
-468
6880
33W
X 5
02A
G20
0602
0710
.40
I-3
7484
-391
72-4
0870
8433
X 1
0 5
02B
E20
0606
2210
.00
I-4
2023
0-4
4031
5-4
6015
431
533
X 2
0 5
02H
2006
0216
23.1
0I
-465
220
220
33XY
502
BP
2006
0515
10.0
0I
-404
62-4
2074
-436
6474
33Y
'35
493
ZZ20
0606
1512
.50
I-6
720
300
2030
033
YZ 5
02A
E20
0602
0710
.60
I-4
0272
-435
7474
33Z
11 5
02W
2006
0517
23.1
0I
-417
94-4
3790
-457
114
114
34D
' 6 5
02B
I20
0606
2020
.30
I-4
0028
0-4
1023
0-4
2021
5021
5034
DG
502
AA
2006
0511
8.00
I-4
0245
5-4
3259
059
034
E'1
3 5
03A
T20
0606
2021
.00
I-2
8923
50-3
0927
5027
5034
F 5
502
BQ
2006
0502
9.20
I-4
1158
-426
60-4
4164
6434
F 10
502
AS
2006
0517
8.80
I-4
1674
-446
7676
34G
H 5
02B
V20
0605
238.
30I
-412
42-4
2742
-442
4444
34H
25
502
AJ
2006
0223
8.30
I-4
0740
5-4
2741
0-4
4541
034
H5
512
D20
0412
277.
21I
-415
280
-430
172
-450
148
280
italic
ized
wel
ls a
re o
ld v
alue
s, b
ut in
clud
ed b
ecau
se th
ey're
reas
onab
ly re
cent
and
thei
r his
toric
al v
alue
s ar
e co
nsis
tent
ly in
this
rang
e
AQ
UIF
ERFo
r Cro
ss-S
ectio
n (In
tern
odal
Wel
ls in
Bol
d)PR
OJ
FCD
DA
TER
EF P
T EL
.
A-1
7

ALA
MIT
OS
BA
RR
IER
PR
OJE
CT
I-ZO
NE
CH
LOR
IDE
CO
NC
ENTR
ATI
ON
SC
hlor
ide
Dat
a U
sed
for C
onto
urs
and
Cro
ss-S
ectio
nC
ontin
ued…
For C
onto
urs
ELEV
1 (f
t)C
HL
1 (m
g/L)
ELEV
2 (f
t)C
HL
2 (m
g/L)
ELEV
3 (f
t)C
HL
3 (m
g/L)
MA
X C
HLO
RID
E34
HJ
502
BW
2006
0222
9.50
I-4
0770
-417
68-4
2710
010
034
JL 5
03A
N20
0602
217.
20I
-383
76-4
0272
7634
L 10
502
AN
2006
0614
5.60
I-4
0468
-439
7070
34LS
503
BC
2006
0503
6.80
I-3
3841
0-3
6872
5072
5034
N 2
1 5
12C
2006
0614
6.80
I-4
2310
2-4
5394
102
34N
' 7 5
03A
G20
0606
217.
00I
-221
165
-254
285
-286
285
34Q
'15
503
H20
0606
218.
30I
-108
1720
017
200
34T0
.1 5
03A
D20
0605
036.
10I
-289
165
-312
104
-334
122
165
34U
8 5
13G
2006
0215
5.40
I-3
6011
6-3
7514
014
034
V 2
0 5
13C
2006
0525
6.30
I-3
8626
2634
VZ 5
03B
G20
0602
276.
20I
-214
74-2
2476
7634
W' 5
503
AK
2006
0622
13.6
0I
-156
4900
4900
35D
' 5 5
03A
M20
0606
2213
.20
I-8
941
5041
5035
E0.1
503
BJ
2006
0222
6.50
I-1
1453
5053
5035
F 20
513
H20
0602
156.
50I
-235
170
-245
-255
170
35H
11
514
G20
0602
157.
00A
I-1
4647
5047
5035
H 1
1 5
14H
2006
0215
7.00
I-2
0314
9014
9035
J1 5
14L
2004
1227
7.42
I-2
1561
0-2
3518
0018
0035
N0.
1 5
04N
2006
0614
7.30
I-7
683
0083
00
italic
ized
wel
ls a
re o
ld v
alue
s, b
ut in
clud
ed b
ecau
se th
ey're
reas
onab
ly re
cent
and
thei
r his
toric
al v
alue
s ar
e co
nsis
tent
ly in
this
rang
e
AQ
UIF
ERFo
r Cro
ss-S
ectio
n (In
tern
odal
Wel
ls in
Bol
d)PR
OJ
FCD
DA
TER
EF P
T EL
.
A-1
8