absrc 2019 ljubljana
TRANSCRIPT

ABSRC 2019 LJUBLJANA CONFERENCE PROCEEDINGS
Advances in Business-Related
Scientific Research Conference
ABSRC 2019 LJUBLJANA Ljubljana, Slovenia, November 14, 2019
Editor: prof. dr. Ajda Fošner

2
CIP - Kataložni zapis o publikaciji Narodna in univerzitetna knjižnica, Ljubljana 001.891:658(082) ADVANCES in Business-Related Scientific Research Conference (2019 ; Ljubljana) Abstracts ; Papers [Elektronski vir] / Advances in Business-Related Scientific Research Conference - ABSRC 2019, Ljubljana, Slovenia, November 14, 2019 ; editor Ajda Fošner ; [organized by GEA College - Faculty of Entrepreneurship]. - Ljubljana : Gea College - Faculty of Entrepreneurship, 2019 ISBN 978-961-6347-66-2 1. Dodat. nasl. 2. Fošner, Ajda COBISS.SI-ID 302542848
Copyrights: Name, form, design, reproduction –
GEA College – Faculty of Entrepreneurship;
Contents of individual papers – paper authors
Editor: Ajda Fošner
Issued and published by: GEA College – Faculty of
Entrepreneurship, Dunajska 156, SI-1000 Ljubljana,
Slovenia
Year: 2019
(November 2019)
Number of issued USBs: 20
ABSRC is an important international gathering of business and business-related sciences scholars and educators. ABSRC 2019 – organized by GEA COLLEGE – Faculty of Entrepreneurship. Publisher: GEA COLLEGE – Faculty of Entrepreneurship, Dunajska 156, SI-1000 Ljubljana, Slovenia. All submissions were reviewed. Selection for inclusion in the conference program was based upon quality, originality, and relevance, in the judgment of the review process. Contents of papers published as received from the authors. The authors retain their rights to publish their papers elsewhere. All rights reserved. Conference Chair Ajda Fošner Conference Scientific Review Committee (in alphabetical order) Suavi Ahipasaoglu, Okan University, Istanbul, Turkey Nikša Alfirević, Faculty of Economics, University of Split, Croatia Boštjan Antončič, University of Ljubljana, Ljubljana, Slovenia Heri Bezic, University of Rijeka, Rijeka, Croatia Ionel Bostan, University “Stefan cel Mare” of Suceava, Suceava, Romania Kresimir Buntak, University North, Koprivnica, Croatia Patrycja Chodnicka, University of Warsaw, Warsaw, Poland Alex F. DeNoble, San Diego State University, San Diego, California, U.S.A. Ajda Fošner, GEA College, Ljubljana, Slovenia Ana Globocnik Zunac, University North, Koprivnica, Croatia Klodiana Gorica, University of Tirana, Albania Dietmar Grichnik, University of St. Gallen, St. Gallen, Switzerland Katherine Gundolf, GSCM – Montpellier Business School, Montpellier, France Robert D. Hisrich, Thunderbird School of Global Management, Phoenix, Arizona, U.S.A. Mitja Jeraj, GEA College, Ljubljana, Slovenia Nicholas S. Jewczyn, Ashford University, San Diego, California, U. S. A. Ronald C. Johnson, American Public University, Charles Town, West Virginia, U.S.A.

3
Renata Karkowska, University of Warsaw, Warsaw, Poland Claudine Kearney, University College Dublin, Dublin, Ireland Imen Khanchel, University of Manouba, Tunisia Alzbeta Kiralova, College of Business, Prague, Czech Republic Ekaterina Kostina, Novosibirsk State Pedagogical University, Novosibirsk, Russia Abey Kuruvilla, University of Wisconsin Parkside, Kenosha, Wisconsin, U.S.A. Marina Letonja, GEA College, Ljubljana, Slovenia Leonard H. Lynn, Case Western Reserve University, Cleveland, Ohio, U.S.A. Marjana Merkač Skok, GEA College, Ljubljana, Slovenia Stephen O. Migiro, Graduate School of Business Leadership, Midrand, South Africa Celina M. Olszak, University of Economics, Katowice, Poland Mirjana Pejić Bach, Faculty of Economics and Business, University of Zagreb, Croatia Cezar Scarlat, University Politehnica of Bucharest, Bucharest, Romania Seval Selіmoglu, Anadolu University, Eskisehir, Turkey Gangaram Singh, San Diego State University, San Diego, California, U.S.A. Seweryn Spalek, Silesian University of Technology, Gliwice, Poland Stanislav Stofko, University of Zilina, Zilina, Slovakia Dindayal Swain, International Management Institute, Bhubaneswar, India Igor Todorovic, University of Banja Luka, Banja Luka, Bosnia and Herzegovina Jaka Vadnjal, GEA College, Ljubljana, Slovenia Conference Research Abstracts List ABSRC 2019 LJUBLJANA ABSTRACTS / PAPERS AND AUTHORS
ABSTRACTS / PAPERS
Henryk Julian Seeger
SOCIAL RESPONSIBILITY: CORPORATE ACTIVITIES
ENCOURAGING VOLUNTARY MICRO-DONATIONS BY
CUSTOMERS IN EUROPEAN COUNTRIES
Michel Reimon FOUR FUNDAMENTAL STRATEGIES TO INFLUENCE
AGENTS IN INTERACTIONS
Saša Zupan Korže ROBOTICS IN HOSPITALITY
Andrej Pompe DESIGNING THE PERCEPTION OF THE CITY BRAND
WITH QUALITATIVE URBANISTIC ELEMENTS
Ana Globočnik Žunac, Jasna Tukač, Vlatka Kordoš
SUITABILITY OF NEUROLINGUISTIC PROGRAMMING
METHODS IN BUSINESS COMMUNICATION
Iztok Sila, Jani Toroš WHY STUDENTS CHOOSE AN INSTITUTION TO STUDY?
Krešimir Buntak, Matija Kovačić, Ivana Martinčević
KNOWLEDGE MANAGEMENT IN DIGITAL ERA
Tomaž Poznič DIGITAL TRANSFORMATION IN SLOVENIAN ECONOMY

4
KEYNOTE SPEAKER
Ph. D. Mario Spremić
Full Professor,University of Zagreb, Croatia E-mail address: [email protected] Mario Spremić is a Full Professor at the Department of
Informatics, Faculty of Economics & Business, University of
Zagreb, Croatia and guest lecturer or visiting professor at
some international institutions (Imperial College London, Faculty of
Economics, University of Ljubljana). He received a B.Sc. in Mathematical
Sciences (in 1996.), M.Sc. in IT Management (in 1999.) and Ph.D. (in 2002)
in Business, all from the University of Zagreb. He joined Faculty of
Economics & Business (FEB Zagreb) in 2000, with the previous corporate
experience as a computer programmer, project manager and executive
manager. Mario has taken additional education from MIT Sloan School of
Management and EFMD Executive Academy. He has participated in many
corporate-based projects. Mario has a broad experience in international
accreditations of higher education institutions, leading institutional
processes towards achieving EPAS, EQUIS and AACSB accreditations. He is
acting as an EPAS accreditation reviewer worldwide and NAKVIS
accreditation reviewer in Slovenia. His main research interest areas are
digital transformation, digital economy, ICT governance, cyber security and
information system audit and is a frequent speaker at various corporate and
international events.
Challenges of digital transformation: case studies and research results
The lecture will explain the most important trends in digital economy and
discuss game-changing and digital or die scenarios imposed by use of digital
technologies in different industries. Many companies use different types of
digital technologies, like basic digital technologies (mobile technologies,
social networks and communication platforms, cloud computing, sensors and
IoT, big data), but also emerging digital technologies such as drones,

5
robotics, augmented and virtual reality (AR and VR), face and speech
recognition, deep learning algorithms, cognitive technologies (AI), addictive
manufacturing (3D printing), wearable technologies, holograms, etc.
Companies of all types and sizes, no matter of industries they compete in,
should consider how to use all these digital technologies in order to innovate
business model, conduct thorough digital transformation and respond to
prevailing game-changing and digital or die scenarios. Several case studies
of successful digital transformation will be explained and results of novel
research in the area will be presented.
Key Words
Digital technologies; digital transformation; business model innovation;
research: case studies.

6
KEYNOTE SPEAKER
Ph.D. Predrag Brlek
Senior Lecturer, University of North, Croatia E-mail address: [email protected] Predrag Brlek was born in Varazdin and live in Zagreb,
Croatia. He accomplished Doctoral Study at University of
Zagreb, Faculty of Transport and Traffic Sciences in the
field of Technology of traffic and transport and his
doctoral thesis was ‘Method of sanation of dangerous spots on roads with the
use of geo-referenced video’. He took part at many conferences and has a
more than forty technical and scientific publications in the field of traffic
security, traffic planning and sustainable mobility which qualified him for
obtaining a title a scientific associate in scientific area of technical sciences.
His working experience started at Institute of Transportation and
Communications Zagreb where he passed all phases from an expert associate
through the leader of studies and projects to the director. In seventeen years
he participated as a leader or author-contributor in more than a hundred
traffic projects or studies. He worked at Polytechnic Nikola Tesla in Gospic
as senior lecturer in Department for Road Traffic and he is visiting lecturer
at Faculty of Transport and Traffic Sciences, University of Zagreb. In the
past two years he works as assistant professor at University North at
Department of Logistics and Sustainable Mobility and is head of Logistics and
mobility section. He is the University North's leader of two Interreg projects
in the field of sustainable- and electro-mobility, „Low-Carb“ and „E-MOB“
as well as the swiss-croatian cooperation project „Take a Brake!“ in the field
of traffic security.
Economic aspects of sustainable mobility systems of the future
With the great development of traffic, especially personal road traffic,
humanity faced major problems in affecting the environment and human
health. Noise, vibration, pollution air and water are the most negative

7
consequences of traffic to the environment and indicate that existing
transport systems are not sustainable. For this reason, traffic development
must be in line with the principles of sustainable development, where,
besides the new technical solutions within the intelligent transport systems
(ITS), new business principles and new life principles are included. The
paper presents the role of ITS, especially corporate (C-ITS) in sustainable
mobility and its socio-economic impact.
Key Words
Transport system; sustainable mobility systems.

8
SOCIAL RESPONSIBILITY: CORPORATE ACTIVITIES ENCOURAGING VOLUNTARY MICRO-DONATIONS BY
CUSTOMERS IN EUROPEAN COUNTRIES
Henryk Julian Seeger, student
Politehnica University of Bucharest Romania
Abstract
This study attends to the question of how corporate activities and social
responsibilities of an organization can cater to society through micro-
donations by customers and how customers can be satisfied with donating
and making a change in society. At first, this paper reviews the concepts of
CSR and corporate citizenship and then delves deeper into understanding
what is ethically and economically required by corporates to encourage the
customers to donate to contribute to society. The study indicated that it
must be examined how micro-donations affect different target groups. The
proposition is that customers who have never donated in the past due to
their financial situation rich or poor, young or old, would have the
opportunity during shopping to make a micro-donation and feel good about
contributing towards the society.
Key Words
Individual Social Responsibility; social corporate activities; micro-
donations.

9
1. INTRODUCTION
The balance of ecological, social and economic interests is a prerequisite
and is also named as “Trible Bottom Line” with the three p's: planet, people,
and profit. Here it is important to note that the resources of nature are not
unlimited, all three p's are considered by companies and taken seriously and
only together enable a sustainable future. Sustainability is the foundation of
all actions and basis for the implementation of Corporate Social
Responsibility (CSR). The differentiation to CSR, however, is that
sustainability is a basic idea, without concrete instructions and reviewing
authority.
The company is active as a “good citizen” actively for social concerns and
does this e.g. through donations, foundations, or through simple sponsoring.
It recognizes its role in society, accepts it and engages in the associated
responsibility for the community. A frequent resource invested is also the
workforce, which contributes to employee involvement, technical know-
how, and organizational competence to social enterprises through corporate
volunteering.
Looking at the donation market there is always seen only the one perspective
and the one goal: It is all about the money and the simple goal is to maximize
the final amount donated. But looking at the second side of this market
besides the final collected sums, the industry that is living from doing this
as well as the beneficiary in the end, there are millions of people who donate
the money. These people are unofficially seen as “cash-cows”, with the goal
to get as much money from them as possible. These people donate money
to do good, but also indirectly to feel good themselves. This detail though is
underrated because the entire donation market is existing to make the
beneficiary happy. So far it is not the main goal to make the donator feel
better as well.
2. LITERATURE REVIEW
2. LITERATURE REVIEW
2.1 Social Responsibility & Corporate Citizenship
Social responsibility is the voluntary contribution of the economy to
sustainable development, which complies with existing legal requirements
and promotes and implements additional voluntary goals. The European

10
Commission, in its Green Paper, defines the term as follows: “... an
approach that provides enterprises with a basis for voluntarily integrating
social and environmental concerns into their business activities and
interactions with stakeholders.” Here CSR is not understood as a substitute
for legal regulations, but instead, it is the voluntary entrepreneurial
commitment to act responsibly and sustainably, along the entire value chain
of a company. It must be anchored in the core business, and its own
corporate culture and management practice must be adapted accordingly.
The core goal of CSR measures should be less marketing and more purpose-
oriented charity. In practice, this is certainly difficult to keep apart and goes
in the case of success mostly hand in hand. CSR is the voluntary commitment
in the normal course of business. Corporate Citizenship (CC), on the other
hand, describes the social commitment of a company outside its actual area
of activity. Corporate citizenship concerns everything that goes beyond the
daily as well as normal business activity in the sense of a common good-
oriented commitment.
In consideration and analysis of the existing Corporate Social Responsibility
and Corporate Citizenship instruments and activities, three things
particularly stand out: on the one hand there is no highly developed donation
activity regarding micro-donations and on the other hand there are no
donation activities in which commerce and customers interact with one
another. In addition, the entire donation market seems to be made for
people with above the average amounts of money. In order to become more
practical, we want to take a closer look at the terms used by companies,
but also customers, and how these terms are differentiated. A concept that
stands above everything is sustainability. On the one hand, it aims to secure
the basic needs of all people and future generations, on the other hand, it
requires preserving the lasting viability of our planet, including all
ecosystems.
2.2 Ethics vs. Economy
MAX WEBER describes “economics” as follows: “Economically oriented
actions are those that are intended to foresee and satisfy a need for desired
products or services. The economy should represent a peaceful exercise of
power which is purposefully and rationally planned and is oriented at those
economically oriented actions.”
Two aspects are concealed in this definition of “economics “. On the one
hand is economics a fulfillment of desires for products and services, on the
other hand, it is also something “peaceful”, which means it is not forceful

11
or violent (WEBER’s Intention) but should be executed ethically and morally
correct. This would mean that the economy and ethics must be compatible.
In the following, the question of the relationship between ethics and
economy will be discussed further. Is ethics truly compatible with the
modern economy? Before trying to answer this question, it is necessary to
address the initial problem. “Business ethics, rightly conceived, is just good
business.”
This basic belief, prevalently found in the American literature, suggests,
that a company is more successful the more ethical its actions. Such point
of view doesn’t take into consideration however the problematic
relationship between ethics on one side and economy on the other. It carries
the potential risk to reduce the complex relation between morality and
profitability to a harmonious convergence. Such convergence doesn’t exist
in the real world of economics. It is desirable but cannot be presumed.
HOMANN sees within the complex connection between morality and
profitability four areas of action, which he has brought together in the
matrix shown in Figure 2.2A. Therefore, cases II and IV suggest the ideal
case, whereas the cases I and III show differentiated aspects of ethics and
profitability. The latter two also depict a dilemma situation.
Figure 2.2A: Four-quadrant scheme
Field III prefers the economic efficiency while field I favor the moral one.
HOMANN illustrates a weakness regarding the observation period. It can be
assumed that this model can only be a depiction of a very short time frame.
In this case, it seems possible to combine economic and moral efficiency.
That’s why the HOMANN approach was extended by HANSEN. Like the

12
scenario technique, the two-dimensional HOMANN model becomes a three-
dimensional one, which additionally considers “short term” and “long term”
aspect.
SCHMIDT points out: “The fact that a company confirms its values and makes
them transparent means self-commitment. The moment when values are
communicated, actions and decisions based on those values become
enforceable.” It turns out that there is a connection between the value of a
company and the company values which puts success in relation to the value
of a company, its reputation (appreciation of a human being or an
organization), its social, economic, ecological responsibility and its
fundamental values. The image in Figure 2.2B depicts this relation.
Figure 2.2B: Corporate ethics model: reciprocal influences
Based on the connection shown above it can be summarized that long-term
success is a result and a prerequisite for the realization of the
entrepreneurial fundamental values and objectives. Therefore, it is fair to
assume that ethics and economy are compatible with one another.
2.3 The term “economic citizen” and the corporation as a “good citizen”
The term “economic citizen” should be defined first. Further, it should be
theoretically considered when a company can be defined as a “state citizen”
or “good citizen” and which implications are associated with it. Then it will
be discussed, what it means for a company – also, an organization – to act
as a “good citizen” considering the distinctions made prior. A private
corporation is seen as an organization within an economic system.

13
The enterprise as such is defined as a complex, open system, that maintains
various and complex relations with its environment. This means that the
transfer systems can impact the enterprise system, and vice versa can the
actions of an enterprise impact the transfer systems. PETER ULRICH takes a
definition of an “economic citizen” a step further. In his opinion, the term
“economic citizen” describes a citizen as an economic subject and at the
same time as a moral individual who doesn’t separate his economic actions
from his civic responsibilities but rather integrates those two into one
another.”
The general social function of organizations lies in finding solutions for social
issues by reducing the complexity and coordination the human actions to
reach the objective. Different approaches can be found in the literature,
that describes the organization on the one hand as a structural medium,
which exerts the “intermediary function” between the individual and the
society and on the other hand allow the organization a partial autonomy and
independence, that goes beyond the sum of actions of singular organizations
or individuals. Based on the last statement it is possible to make individual
and organizational actions comparable. In GESER, five distinguishing
features are found:
1. The ability to standardized and complex actions,
2. Objective specificity,
3. Objective stability,
4. Transparency of the internal structure,
5. Diversification of the action fields.
GESER assumes that an organization is more self-reliant through higher
internal transparency and the objective specificity (individual as well as a
citizen) and can participate in various interactions simultaneously. This
ability provides the organizations with an opportunity to impact the norm
structure in a society. Additionally, the combined professional knowledge
along with the higher productivity provides organizations a chance to use
the existing resources to achieve its own formulated objectives and remain
compliant with the social standards without creating an additional rules
structure. The internal organizational processes can be better controlled
this way.
Organizations achieve a higher level of assurance compared to individuals
based on internal structure transparency and business processes. GESER
concludes in this context that organizations are to be “perfect actors” and
therefore the idealistic action approach can be used to analyze the actions
of organizations considering rational behavior. A conceivable social

14
consequence could be, that on one side organizations create social order, in
which every individual would have to look for his own living space, and on
the other side, they would be confronted with high normative behavioral
expectations. “In the intensification on the casual liability, it is expressed,
that organizations are increasingly used as attribution addressees for
especially prerequisite and rigorous normative behavioral expectations and
they are expected to continuously improve their actions.”
COLEMAN, who, contrary to GESER, defines organizations as corporate actors
that are connected through the sole purpose of resource pooling, points out,
that a complex internal structure makes it merely impossible to track the
responsibility for any action to a single individual. He also states that in his
opinion no moral appeal can be directed at a corporation compared to an
individual. The actions of an organization can, therefore, be only impacted
by sanctions. Based on the increased specialization of tasks knowledge and
information differences within departments also increase and could possibly
result in an uprising principal-agent problem.
The theoretical considerations presented here can also be found in the daily
practice of enterprises, for example when they are held accountable for
their faulty actions in front of consumers, NGOs or media. It is particularly
relevant if the cause can be traced to a specific department, yet it bears
consequences for the enterprise. Those facts can have the following
meaning: if the company is viewed as an independent actor that is fulfilling
its private economic function, then it can be also viewed as an independent
citizen, who belongs to a civic community. It can be assumed that a company
must face higher expectations from the society regarding its normative
behavior due to its higher degree of rationalization if it is attempting to
integrate into society.”
In this context, it is fair to pose the question of how far the “normative”
behavior goes beyond the self-imposed commitment. It seems obvious that
the “norm compliant” civic behavior is more based on virtues and not on
prohibitions. The extent to which a company can be obligated to comply
with the normative behaviors required from the society depends for once on
the norms confirmed in the location (region) and on the already established
norms and standards. WOOD/LOGSDON assume that it is a question of the
company definition – whether from the “multi-domestic” or a globally
integrated perspective. On the other side, state that an organizational
definition of a corporation is impacted by its departments. The market
prevailing in the corporate sector determines, in the opinion of the authors,

15
the position of the parent company and its subsidiaries and affects the
organizational structure (globally, nationally or internationally).
2.4 Micro-Donations by Customers
The current donation market took a development towards a few people
donating a relatively significant amount. This is certainly since older people
have more financial resources and are willing to donate a part of it. This
setting, however, excludes large parts of the population. Because who would
like to donate for example 3 EUR/RON if the other donors distinguish
themselves through their large donations. Donations respectively doing
something good with the money is elitist and a priori excludes particular
social classes from participating due to the design of the market to possibly
maximize every individual donation. The larger the donation, the better.
This conception, however, is controversial, because the objective should
rather be to make the market accessible to as many people as possible by
giving them an opportunity for social engagement. Firstly, it is important so
that more people could generate larger sums and secondly, it can be
assumed, then a donation of any amount creates a positive feeling for the
donor.
Analyzing the social sector and especially the donation market, it shows that
the donating market is more money-driven and more capitalistic than most
of the corporate companies.
3. RESEARCH METHODOLOGY
In order to understand the significance of the smallest amounts for citizens,
a survey in oral form was conducted with 300 citizens in Germany and
Romania. The survey in Berlin, Germany, took place from January 15th to
the 18th of 2018, the one in Bucharest, Romania, from January 19th to the
21st of 2018.
During the survey, the participants were presented with a laminated copy
of possible answers to every question, so they could easily and quickly
identify an appropriate answer for them. Those were particularly helpful in
questions of age, income and donation behavior to guarantee the
authenticity of questions as well as to protect the participants from the
public pressure. The survey contained 16 closed-ended questions, which
started off with 4 questions about socio-demographic background and
continued with 12 assessment questions about their views on pocket change

16
and the opportunity to do good with it. To simplify possible answers only
closed-ended questions were used.
4. RESULTS & DISCUSSION
The previously introduced survey results of 300 people from Germany and
Romania present various conclusions regarding human behavior and attitude
towards small pocket change amounts. At the same time, they clearly show
enormous potential. Differences between genders, age groups, income
levels and origin of the participants were identified.
4.1 Donating money to do something good for a non-profit organization AND
Donation of 5 Cents/Bani knowing 1 million other citizens would each donate
5 Cents/Bani fora good cause.
As previously shown, most people who have never donated in the past,
could, however, imagine doing so alongside one Million other people
donating an amount of 5 Cents/Bani for a charitable cause. This
demonstrates, that most people are missing access to donation possibilities.
Demonstrating them a very simple way to donate a small amount convinces
the people who have never donated before or would not have done it
anyway. This very easy approach to the donation market is very important
since it is extremely crucial to be able to reach the first-time donors and
this group would eventually repeat their donation again. Finally, there is
always the first time for everything and this very simple opportunity to
donate, which is also as such, opens a donation market to the previous non-
donors in a very easy way.
All age groups are represented here with a similar donation willingness,
whereas it is especially apparent that the young respondents have no
donation experience but are willing to participate in a collective one. The
lack of wealth or income or the insufficient access to the donation market,
possibly also due to the lack of knowledge, are likely the main reasons why
these age groups have not donated in the past. Illustrating of simple
possibilities to take the first step is accepted with appreciation. This also
shows the same strong representation by the respondents based on their
income level. The “lower class” is the leader of not having donation
experience and being willing to participate in a collective donation of 5
Cents/Bani.
In summary, it can be said that especially young and poor interviewees have
not donated before, but in the majority would participate in a collective

17
donation action of 5 Cents/Bani. This is much different comparing them to
the older and wealthier participants and is a clear statement to how those
target groups can be motivated to make their first-time donation.
4.2 Bending down to pick up 1 Cent/Bani on the street AND Donation of 5
Cents/Bani knowing 1 million other citizens would each donate 5 Cents/Bani
fora good cause.
As we have already demonstrated, most people are not willing to bend down
on the street to pick up small coins. The worth of the coins seems apparently
very insignificant. The timely and physical effort of bending exceeds the
benefits. Those respondents, who would not bend down to pick up coins on
the street, would however in their majority donate 5 Cents/Bani. This shows
that the “worth” of the coins is not recognized while lying on the ground,
but as soon as those coins are “assigned” a task, their worth increases, and
their benefits are appreciated. Especially the older participants would not
bend down, are however willing to donate such small amounts. This result
is possibly caused by the fact that older people do not necessarily like
bending down to pick up something. Reviewing the allocation based on the
age groups, it can be stated that a significant majority that would not bend
down to pick up the coins would consider donating in collective action.
Within the income groups, it is apparent that the “middle class” says
significantly often that they would not pick up the money from the street
but are willing to donate alongside others a small amount of 5 Cents/Bani.
The “lower class”, on the other side, is showing the lowest numbers here,
however if we look at it more precisely, we will notice, that the “lower
class” shows the most frequency of bending down to pick up the coins and
would also be willing to collectively donate 5 Cents/Bani. We generally
identified a very high willingness to participate in a collective donation of 5
Cents/Bani. This is particularly apparent within the group of respondents
who have never really paid attention to the small change lying on the street.
4.3 Something good can be done with a 5 Cents/Bani donation AND Donation
of 5 Cents/Bani knowing 1 million other citizens would each donate 5
Cents/Bani fora good cause.
As previously extensively shown, there is no strong appreciation for small
coin amounts. Not everyone would bend down to pick the money lying on
the ground and the willingness to donate the smallest amounts is not widely
spread. 5 Cents/Bani seem to the respondents to be too small of an amount

18
to have any significant relevance to be donated. The “worth” of the money
is not worth the effort.
This consideration changes completely as soon as the small amount gets a
different or rather a new meaning. Because once those 5 Cents/Bani are not
an individual donation to a charitable cause but are rather donated
collectively alongside with one Million other people, this smallest donation
receives a larger meaning for the respondents and ultimately for the society.
Almost seven out of ten participants state that would not donate 5
Cents/Bani, would, however, participate in a donation of the same amount
once it is done by one Million other people. This expansion of consciousness
is decisive for the participants to support the donation. It is not instrumental
what happens with the donation afterward. It is rather defining to be a part
of something big – even if we are talking about a share of only 5 Cents/Bani.
With older age and increasing income the willingness to donate also
increases. This can be explained by the fact that older and wealthier people
would rather donate than younger and poorer ones.
Regarding the age: it is possible that there is a different understanding of a
collective effort once you are older. Additionally, we must state that
especially younger respondents demonstrate the smallest support with 60%
when presented with the question combination. Looking at it more precisely,
it becomes apparent that twice as many participants below 24 years of age
are willing to donate 5 Cents/Bani than the older ones and support the idea
to donate that amount with one Million other people. Regarding the income,
we can see a similar relation as previously shown for the age groups.
It also must be mentioned that a very small group of people is willing to
donate 5 Cents/Bani as an individual donation and would not do that once it
becomes an act of one Million others. This might be because those people
are not necessarily interested to do something with many other people.
Those respondents feel more comfortable to socially engage apart from peer
pressure. This group is however rather small with only 3%. Also, the group
of those, who would neither donate 5 Cents/Bani alone nor in a large group,
is represented with 14%. This group seems somewhat insensitive to this kind
of donations and will not be further regarded in our research as well as the
previously described group.
This expertise is crucial for the whole donation market. A single donor should
never feel alone. He must always perceive himself as a part of a big
movement. A single donor must feel that his donation regardless of its

19
amount is a part of something significant and without him an the important
puzzle would be missing.
4.4 Donating money to do something good for a non-profit organization AND
Feeling good after the small donation.
Most surveyed people stated with 41% to have never donated in the past,
but who would feel good about making a collective donation? This supports
the statement that initially as an insignificant considered donation can result
in positive emotions and the amount of the donation is less important than
the fact of donating as such. The potential first-time donors are sensitive to
the “donation experience”, whereas the amount of the donation is not
necessarily important. This means by implication that non-donors can be
turned into first-time donors by few Cents donations. How and whether
those actions would be repeated, will be analyzed and answered at a later
stage of this research. It is rather meant to say that a barrier has been
overcome and the first donation action was taken.
A smaller part of the respondents with 33% has never donated before and
would also not experience positive emotions by doing so. Those people are
not the target audience of this research and we will not be focusing on this
group any further. This can also be applied to 11% of those, who have
donation experience but who also do not have a positive feeling by making
small donations. Almost 15% of the respondents have donated in the past
and would also experience positive emotions making micro-donations. Here,
it must be assumed that any donation amount causes a feeling of happiness
and therefore makes the donation amount insignificant. First and foremost,
the donation activity as such is important.
Looking at the answers based on the age group allocation, it is apparent that
especially young participants, almost half of them to be precise, have never
donated previously, but would experience positive emotions donating 5
Cents/Bani. That 48,6 % represent the largest group compared to 34% of the
25-54-year old’s and 40% of the 55+ group. This shows that the group of “up
to 24” is sensitive to the micro-donations and while performing a small
donation get the feeling of doing something good. It is to assume that
especially young people have limited donation experience and could become
a part of the donor society for the first time through the opportunity of
starting off with the smallest donation. As previously demonstrated, it is
very helpful to illustrate not the individual donation of a small Cents/Bani
amount but rather a collective donation action. It is important in any case,
that previous non-donors experience a positive feeling after such action

20
which they will have by donating only a few Cents/Bani. Young potential
donors have not had many opportunities in their young lives yet, possibly
also due to financial reasons, to donate money. The results show however
that it is not so much the financial background that turns a potential donor
into an actual one. It is rather deceptive that a donation is first seen as such
once it reaches a specific amount. We were able to demonstrate that a small
donation can also result in positive emotions. This feeling can be the basis
for the initial donation not to be the last one and would rather initiate a
long-term donation activity.
This theory becomes even more apparent once reviewing the allocation
based on the income groups:
• 54,3% of the “lower class” has never donated in the past and would
experience positive feeling by making micro-donations.
• Within the other income groups, this opinion is represented by 32,8% of
the “middle class” and 36,2% of the “upper class”.
This clearly shows that poorer people without previous donation experience
would have a positive feeling by donating 5 Cents/Bani.
Summarizing, it can be recognized that especially young and poor people
without donation experience in the past would have a good feeling by
making micro-donations. Both groups would be introduced to donor activity
through micro-donations and become part of donor society with very little
money, positive emotions included.
4.5 Donating money to do something good for a non-profit organization AND
Donating a small amount again after donating once.
Reviewing this combination of questions, it is apparent that more than half
of all participants have never donated before, would however consider
repeating their first-time micro-donation. Here, the focus should remain on
the combination of two questions. However, it must be stated that more
than every fifth participant has already donated in the past and would also
consider making another micro-donation. Looking at different age groups, it
becomes obvious that especially young interviewees with 58,9% have never
donated in the past but would consider repeating a micro-donation.
In the age group “25 to 54” and “55+” this statement is represented by only
51,5% and 52,2% accordingly. This shift is even more distinctive while
analyzing the division based on the income classification. 60% of the “lower
class” has never donated, would however repeat their micro-donation. As

21
previously demonstrated, young and poor participants without previous
donation experience are more likely willing to repeat their initial micro-
donation. It is to be assumed that the previous barriers such as a feeling of
not having enough to donate are also, meaningful here as well. However, by
showing the participants a possibility to make a small donation alongside
other people and being able to do good with little money promotes the
simplicity of such actions which could be easily repeated.
Here, it must be emphasized that not only the small amount of the micro-
donation but also the simplicity of the donation process plays a crucial role
in the decision. For a small donation of that amount, people would rather
not occupy themselves with the concrete use of the funds. This however also
implies why people often decide not to donate because they do not have the
exact knowledge of how and where they can donate their money.
4.6 Donating money to do something good for a non-profit organization AND
After shopping, donating the remaining amount in cents after rounding-off,
directly to charitable projects.
Considering this combination of questions, it can be noticed that
• 41,7% of participants have never donated in the past but would be
willing to donate their “rest Cents” directly at the checkout register.
Analyzing different age and income groups it is apparent that this
benchmark number is somewhat identical in all groups with roughly 40%.
• Additionally, a further 15% of all donors are willing to donate coins
directly after shopping. This results in an overall willingness to donate
at overall more than 50%.
It is also remarkable, by looking more precisely at different age groups, that
a large group of participants of 42,1% has neither donated in the past nor is
willing to donate their “rest Cents”. This is consistent, possibly in a more
extreme way once we look at the answers of the different income classes.
Although, on average 42% of the respondents have not made donations in
the past but would be willing to donate their “rest Cents” for a good cause
directly at the cash register, the over-proportionally high number of 46,7%
of the “lower class” state to have never donated and not to be willing to
donate their “rest Cents”. In the other income classes, this statement is
supported by 25,5% in the “middle class” and 22,4% in the “upper class”.
This proves that especially young and poor participants represent a target
group which is very critical, rather reserved towards donations and often has
not to have proper access to the donation market. Within the other groups,
27% stated not to have the intention of donating their rest change.

22
5. CONCLUSION
This research has proven that corporations can be socially responsible by
initiating micro-donations on the part of the customers. This would benefit
the corporate, the customers, and society. Some of the key takeaways for
corporations from the research on micro-donations are given below.
The customers, especially young and poor people:
• are highly interested in contributing through microdonations.
• are very difficult to reach, and the entry barriers must be kept as low as
possible to gain their willingness to donate.
• mostly have limited financial resources, are however quite inclined to
donate a small part of it.
Regarding donation of Cents or Bani (minor amount in donation or micro-
donation), the study shows that:
• it is quick, simple and requires neither a long-term preparation nor
difficult post-processing.
• even if at a first glance single Cents or Bani seem quite insignificant,
many individual donations add up to notable sums.
• the “worth” of a coin of decimal value is independent of the number
engraved on it but gains its relevance rather based on what every
individual gets for the coin in return.
• it gives the potential donors of micro-donation the opportunity to
participate in such donation.
Social changes can be motivated when:
• people come together and make small donations.
• every stakeholder involved is rewarded with a positive feeling of having
done something good by donating just a couple of coins.
• people who have done something good and have experienced
appreciation and a positive feeling, are most likely to do it again.
REFERENCES
Ajzen, I. (1985). From intentions to actions: A theory of planned behavior.
In Action control (pp. 11-39). Springer, Berlin, Heidelberg.
Cohen, J. B., Fishbein, M., & Ahtola, O. T. (1972). The nature and uses of
expectancy-value models in consumer attitude research. Journal of
Marketing Research, 9(4), 456-460.

23
Davis, F. D. (1985). A technology acceptance model for empirically testing
new end-user information systems: Theory and results (Doctoral
dissertation, Massachusetts Institute of Technology).
Eisenberg, N. (2000). Emotion, regulation, and moral development. Annual
review of psychology, 51(1), 665-697.
Fishbein, M., & Ajzen, I. (1975). Belief, attitude, intention and behavior: An
introduction to theory and research. Reading, MA: Addison-Wesley.
Godin, G., Conner, M., & Sheeran, P. (2005). Bridging the intention–
behaviour gap: The role of moral norm. British journal of social psychology,
44(4), 497-512.
Kirchgässner, G. (1992). Towards a theory of low-cost decisions. European
Journal of Political Economy, 8(2), 305–320. doi:10.1016/0176-
2680(92)90028-f
Kliemt, H. (1986). The veil of insignificance. European Journal of Political
Economy, 2(3), 333–344. doi:10.1016/0176-2680(86)90024-8
Königstorfer, J. (2008). Akzeptanz von technologischen Innovationen:
Nutzungsentscheidungen von Konsumenten dargestellt am Beispiel von
mobilen Internetdiensten. Springer-Verlag.
Luce, R. D., & Raiffa, H. (2012). Games and decisions: Introduction and
critical survey. New York: Courier Corporation.
Madden, T. J., Ellen, P. S., & Ajzen, I. (1992). A comparison of the theory
of planned behavior and the theory of reasoned action. Personality and
social psychology Bulletin, 18(1), 3-9.
Prochaska, J. O., & Velicer, W. F. (1997). The transtheoretical model of
health behavior change. American journal of health promotion, 12(1), 38-
48.
Rosenberg, M. J. (1956). Cognitive structure and attitudinal affect. The
Journal of abnormal and social psychology, 53(3), 367.
Schreiber, G. B., Schlumpf, K. S., Glynn, S. A., Wright, D. J., Tu, Y., King,
M. R., ... & Guiltinan, A. M. (2006). Convenience, the bane of our
existence, and other barriers to donating. Transfusion, 46(4), 545-553.
Sheeran, P. (2002). Intention—behavior relations: a conceptual and
empirical review. European review of social psychology, 12(1), 1-36.
Sheeran, P., & Webb, T. L. (2016). The intention–behavior gap. Social and
personality psychology compass, 10(9), 503-518.
Sheppard, B. H., Hartwick, J., & Warshaw, P. R. (1988). The theory of
reasoned action: A meta-analysis of past research with recommendations
for modifications and future research. Journal of consumer research,
15(3), 325-343.
Towler, G., & Shepherd, R. (1992). Application of Fishbein and Ajzen's
expectancy-value model to understanding fat intake. Appetite, 18(1), 15-
27.

24
Venkatesh, V., & Davis, F. D. (2000). A theoretical extension of the
technology acceptance model: Four longitudinal field studies. Management
science, 46(2), 186-204.

25
FOUR FUNDAMENTAL STRATEGIES TO INFLUENCE AGENTS IN INTERACTIONS
Michel Reimon, MBA
University of Salzburg, SMBS Austria
Abstract
Most current management literature uses a methodologically individualist
approach to investigate influence of principals on agents like compensation,
punishment, feedback and many others. But how do all these strategies
relate?
Using critical realist grounded theory method a simple and pragmatic
scheme reducing them to four fundamental strategies in a framework of
dynamic game theory was developed.
To influence the agent, a principal can either
a) Change his payoffs and make another path more attractive
b) Invoke their relationship and indicate changed payoffs in the long run
c) Apply force: In modern societies this strategy executed under the rule of
law is defining the limits of most games.
d) Alter the knowledge about the game. This is, what every email, excel
sheet, surveillance camera and big data application tries to achieve and
what every privacy setting tries to avoid.
Digitalization is raising the importance of this fourth strategy rapidly.
Key Words
Game theory; institutions; information economics; incentives.

26
ROBOTICS IN HOSPITALITY
Saša Zupan Korže
Vanadis Ltd Slovenia
Abstract
The purpose of the paper is to present the use of robots in hotels and in restaurants. Data from secondary sources (scientific and professional articles, relevant web publications and videos) were collected in extent desktop research conducted in September 2019. Results of the content analysis of documents are presented in a descriptive way. They reveal several ways that robots can be used in hospitality subsector of tourism and point out some of the most known examples of hotels and restaurants that already use robots. The paper ends with the discussion on issues related to use of robotics in hospitality sector which is characterized by traditionally service sector with close personal interaction between hosts and guests.
Key Words
Tourism 4.0; innovation; technology; robots; hospitality.

27
DESIGNING THE PERCEPTION OF THE CITY BRAND WITH QUALITATIVE URBANISTIC ELEMENTS
Andrej Pompe, PhD
GEA College – Faculty of Entrepreneurship
Slovenia andrej.Pompe@gea-college-si
Abstract
Modern cities evolve rapidly and compete intensely to project an attractive
visual image and then link it to cultural and economic activities. Qualitative
urbanism elements define the quality of living in a city and directly affect
human perception of space. They have an important role in the process of
designing the image and the perception of the city and its brand. They
produce feelings and generate attitudes. They strongly influence on the
image and the perception of a city and its brand. Feelings of comfort come
from a total perception of our environment and are the result of a synthesis
of objective and subjective feelings. The purpose of this paper was to
evaluate some important indicators of qualitative urban elements and
evaluate them according to city residents’ and city visitors’ responses in
Slovenia: context, accessibility, diversity, readability, flexibility and visual
suitability. Results represent their recognition of indicators that have the
strongest impact on designing the city and building perception of its brand:
values, living conditions and environmental balance.
Key Words
City; perception; urbanism; city brand; qualitative urbanistic elements
(QUE); context; accessibility; diversity; readability; flexibility and visual
suitability.

28
INTRODUCTION
Designing an image of a city is a process of composing several compatible
and incompatible elements, each of them importantly influencing the
perception of a city. As David Lynch (1960: 1) explains in his introduction in
book Image of the City: “At every instant in a city, there is more than the
eye can see, more than the ear can hear, a setting or a view that is waiting
to be explored. Nothing is experienced by itself, but always in relation to its
surroundings, the sequences of events leading up to it, the memory of
experiences”, city is a space that creates impressions and perception.
Urbanism, the art of designing and organizing city space with its spatial
solutions, has, besides architecture and nature itself, strong impact on city
perception and co-create the so-called genius loci.
Cities began to compete and therefore they began to create city brands. By
using city branding, they want to build a better image and create a desired
perception of the city by different stakeholders, especially residents and
visitors. The role of urbanism is significant in the process of giving the city
its unique form, shape, and character (Urban design, no date). This is where
the spatial design is adding value to the city identity and creates perception
of the city and its brand.
Quantitative and qualitative elements define urbanism. Qualitative
elements/determinants define the quality of living in a city. Several
indicators define the qualitative urbanism elements but they do not have an
equal impact on them.
THEORY
Urbanism and perception of a city
S. Reiter and A. De Herde (2005: 1001) explains: “In an increasingly urbanized society, the urban environment’s quality becomes one of the main targets of a sustainable development. Šmid Hribar et al. define, that »The urban cultural landscape as a living space offers goods at various levels and for various groups of people« (2018: 97), what includes also the majority of city society: residents and visitors (Šmid Hribar et al., 2015).
A city is a complex and multifaceted entity, and so people seek to reduce this complexity to an image that allows them to understand and relate to the city (Castillo-Villar, 2016: 265).

29
Sensory urbanism and perception of a city
People's sensorial experiences and understandings of their local environments are a result of sensory urbanism (Adams, et al., 2008). Sensory urbanism deals with qualitative urbanistic elements – factors, which creates human comfort in relation to public spaces and places and take a large part in the definition of a life quality offered to all citizens and city visitors. Urban public spaces need to be both, comfortable and attractive. The human perception system utilizes filters to analyze a space. It perceives only a few elements and just some of them are memorized. Individuals feel an immediate attraction or repulsion when discovering a place. Therefore, it is important to know most relevant of them (Reiter & De Herde, 2003).
City brand as an emotional representative of the city
Brand has no physical existence. It is a creation of the human mind as a set of feelings, experiences and perceived values. Perceived values (benefits) may range from functional to psychological associations (Maurya, 2012). In connection with city brand, Castillo-Villar (2016: 256) point out: “The direct and indirect experiences that people have with their urban environment produce a set of representations and perceptions of the city. Therefore, there is a physical city and also a symbolic city built in the mind of every person”. The symbolic city is the city brand that is associated with the city name and logo (Vanolo, 2008).
Urban icons
Elements of a physical city that are remarkable are urban icons, often
defined as landmarks. Urban icons are elements of the urban space:
buildings, monuments, natural elements, mobilization elements, parks and
recreational areas. They are one of the main tools of city branding to
promote a unique and distinctive image of the city (Castillo-Villar, 2016).
Urban icons are important elements in the city branding strategies,
especially in the transformation of the image of the city (Muratovski, 2012;
Bouchon, 2014; Evans, 2015).
Urbanism’s impact on perception of the city and its brand
Public spaces are crucial when discussed life quality offered to all citizens.
They create sensory effects that affects human perception of urban
environment where individual and collective values are built (Reiter & De
Herde, 2003). Feelings of comfort come from a total perception of our
environment and are the result of a synthesis of objective and subjective
feelings.

30
Modern cities evolve rapidly and compete intensely to project an attractive visual image and then link it to cultural and economic activities. Rehan (2014: 223) says: “Urban branding integrates social, cultural, economic, and environmental themes into the city“.
The theory, explaining that recall of a particular brand, enhanced by clear
and meaningful associations related to the particular brand name (Maurya,
2012). This facts concern also city brands and associations with them are
strongly influenced by cities’ physical evidences provided by urbanistic and
architectural solutions. The more they are unique and the more they are
contributing to the soul of the city (genius loci) better and stronger are the
associations to the city brand.
Urban (city) branding
Urban branding is the process defined by unique physical features of the city, giving the urban space its essence. It is more than just the promotion of a positive image of the city, but it is the endeavor to change it into an urban experience (Rehan, 2014). The urban (city) branding aims mainly to: (1) communicate city image to the rest of the world as a whole (media-generated image), (2) achieve competitive advantages regionally and internationally, and (3) strengthen the image and reputation of the city and its city identity (Helmy, 2008). City branding communicates main things that should people know about certain place (Unsworth, 2008).
Qualitative aspect of urbanism
Perception and affinity of local residents are critical factors when
developing a strong and competitive city brand (Braun et al., 2013; Hudak,
2015, Castillo-Villar, 2016); thus, it is necessary to understand their
relationship with urban solutions in designing urban space and place. Hence,
the ultimate objective of this research is to inspire urban planner and
designers for shaping and designing urban space in the way that is consistent
with residents and visitors’ rational and emotional values that they expect
from the city.
The qualitative aspect of urbanism deals with the question of how a person
perceives, perceives, and understands the complexity of space (Gosling &
Mailand, 1984, cited in Nikšič, 2003: 62). According to Kaliopa Dimitrovska
Andrews (2011: 43), the qualitative urban elements are context,
accessibility, diversity, readability, flexibility and visual suitability. This
definition is the basis of the survey.

31
Qualitative urban elements (QUE)
Context in urban planning means the influence of historical development,
the existing image of the city and its impact on space perception. Context
guides the design strategy and creates associations related to the town and
the city brand what has fateful impact on the perception of the city and its
brand. Accessibility, which in urbanism means access to urban physical
structures (to facilities and services in them, to open spaces and activities
in them), and products of the city. Diversity helps to create unique points
of contact for the city, their instant recall and the ability to remember which
significantly co-creates the city brand. Readability of the urban space
means the degree of recognition of the city and orientation in it. It depends
on the physical forms and design of the city; those, based on the principles
of diversity, accessibility and context, stand out. Flexibility illustrates the
extent to which open urban structures meet the needs of residents, visitors
and other stakeholders of the city. Visual suitability allows users to be
aware of what is available for them within the city space, and the visible
branding of the city makes them to perceive the city. Urbanism affects the
creation of a visible interest, which increases the positive and desired
perception of the city and its brand.
METHODS
The purpose of this paper is to research and evaluate important indicators
of qualitative urban elements that have the impact on process of designing
a city and building its perception. We evaluate their importance according
to residents’ and city visitors’ responses. The results represent their
recognition of indicators that have the strongest and the weakest impact on
perception of the city and its brand: values, living conditions and
environmental balance. We used a limited number of indicators, as the
research is a test research to indicate deeper and more focused researches
in the future.
Methodology - Conceptual Model
The research focus on the study of qualitative urban elements and their
important indicators, relevant for the residents and visitors of a city. We
research the following QUE: context, accessibility, diversity, readability,
flexibility, visibility and diversity. The research is qualitative. We measure
the variables by using an ordinal scale. The survey carried out electronically
in the territory of Slovenia, with a focus on major Slovenian cities and their

32
surroundings. We obtain one-hundred and ninety-seven complete surveys
(out of 271).
Within qualitative urbanistic elements, we designed indicators (claims) on
basis of the residents and visitors expectations regarding life in the city.
Their expectations, desires, experiences, observations and opinions are one
of the essential foundations of profiling the personality of the city and thus
the city brand. In order to determine relevant resident and visitors’
indicators, we selected a set of claims for each qualitative urban element
(criterion). The questionnaires based on a five-point scale of responses and
expressed their agreement or disagreement with the claims.
FINDINGS
Results of the research
Context
We were mainly interested in what the respondents think of the past-
presence-future coexistence, the coexistence with nature, the conformity
of urban components in relation to the inhabitants, and the impact of
urbanism on the character of the parts of the city.
Of all the claims within the context element, the claim "the heritage of the
past gives the city an impactful character" proved to be the most important,
as 60% of all respondents fully agree with it and 35% agree with it.
The claim: “architecturally harmonious buildings express respect for the
city aesthetic outfit” also stand out as an important indicator, as 72% of
respondents agree with it (totally agree and agree).
The respondents unite in more than a half (60% answered) that abandoned
urban areas are not time shift, as they do not contribute in building the
desire image of the city. A fifth of the respondents see in abandoned urban
areas a mark of a certain time and does think they represent a negative
element of the city.
It is interesting to note that the responses to the claim "outstanding
architectural solutions make the city attractive" and "modern spatial
solutions and old architecture do not go together" are more or less in line.
Interesting is the attitude to the claim "a city that blends with nature is life
friendly" (to blend with nature means that it does not degrade the natural
resources) for 51% of respondents agree with it.
33
Accessibility
The respondents clearly confirm that modern trends are important in the
field of the functionality of the city and of concern for health. They agree
that it is not only sensible to implement them, but also need an upgrade. As
much as 81% of them agree or very much agree with the statement "a modern
city should make possible mobility without a car", and even 82% confirm
claim "if I access city-services on foot, I do something for my health".
The claim that the "modern city should allow for mobility without a car"
(81% of the concurrence) can be reasonably linked to the fact that "public
transport is the key to accessing important city points" (only 6% of
disagreements with this claim). A modest agreement (only 14% of the
concurrence) with the clam "everywhere in the city must exist possibilities
for parking", confirms that these claims are important.
Eighty-four per cent of respondents agree with claim "if I access city-services
on foot, I do something for my health", and only 5% oppose it. Sixty per cent
of respondents also agree with the statement "I want to make the most
urgent purchases on foot".
About the safety in parks (“it is safer if the parks have safety fence”), the
respondents have a different opinion, as less than half of them agree, that
the parks should remain unsettled, a quarter of them waver in deciding
whether this is important or not, and a good quarter considers them to
increase park safety, if they were fenced. By fencing the park, access to this
public area are limited.
Diversity
As many as 87% of respondents agree or completely agree with the claim:
"unique spatial solutions (parks, bridges, underpasses ...) are exciting".
Nearly eighty per cent confirm the claim "the spatial design of city districts
is a source of different perceptions and inspirations".
The fact that the city actually affects the mood and mental state of the
inhabitants and visitors confirms the high percentage of concurrence with
the claim "a city without noticeable features is a city without soul" (72% of
concurrence and complete agreement) and 57% of cases of affirmation for
the claim "a modern city is socially diverse".
That diversity is important confirm response to claims: "an outstanding
(unusual) building gives a mark to the part of the city in which it is located"
(79% of the concurrence or complete agreement) and "the urban incursion

34
roads should have their own specific appearance" (63% of concurrence and
complete agreement). Besides, they also prove that urbanism designs the
city identity and thus the perception of the city brand. Its unique
architectural solution defines an unusual building and stands out amongst
others what often attracts attention.
Readability
Of all the claims relating to the readability of the city, the most important
for respondents is "I memorize areas of the city in connection to typical
buildings, markets, parks, monuments, bridges ..." This directly confirms
the strong influence of typical spatial solutions on the orientation in the
city. The level of agreement is extreme high (91%).
Sixty-one per cent of respondents agreed or completely agreed with the
statement "I feel safe in the city, if I know exactly where at any time".
Respondents agreed in 56% with the claim "originally designed roundabouts
are memorable city points", in 46% of cases with the assertion "without
ecclesiastical bell-tower and memorable buildings, orientation would be
difficult", and in 39% of cases with the claim "the colours of the facades are
a great help in orientation".
Flexibility - adaptability
Claims that relate to the security and humanity offered by the city
regulation were the most outstanding on flexibility. These claims are
"pedestrians provide safe access to shops, restaurants, cafes, museums ..."
(92% of concurrence); "the city without slopes for the disabled is inhumane
and obsolete" (88% of concurrence) and "enlightened parks allow me safe
relaxation even in the evenings" (79% of concurrence).
Arguments related to the future of cycling in cities and the freedom that
this kind of movement permits also encountered a very positive response.
At least two-thirds of respondents agreed with: "the cycling city is the city
of the future" (69%), and "large squares and broad roads impart a sense of
freedom" (66%). The respondents also claim that underground garages
should replace parking lots in urban areas. From this we can conclude that
the city with fewer cars would look more beautiful, more spacious and safer,
which is confirmed by 71% of the assertions with the statement "the parking
lots have to be replaced with underground garages".

35
On average, those who live in the city or in the outskirts are more likely to
agree with all the flexibility claims, but the rural inhabitants do not lag
behind them. This is evident from the comparison of the answers to the
claim "the city without slopes for the disabled is inhumane and outdated",
with which the city's residents agree about 90% and the rural population in
just over 80%.
Visual suitability
The respondents strongly agreed (91%) that "outdoor advertising should not
cover the city panoramas" and that "poorly maintained buildings pollute the
image of the city (92% of concurrence or complete agreement).
The respondents agree or completely agree with the claim "not built-up
spaces create a bright and airy place" in 80% cases.
The importance of visual suitability is also demonstrated by the claim
"colour-balanced buildings create an aesthetic place" (68% agree), while the
statement "the purpose of the building should be recognized by its facade"
has not proved to be important at all. Half of respondents (42%) agree with
the claim "glazed front door gives the impression of openness", but a fifth
does not.
Interestingly, only 4% of respondents agree with the statement "the concrete
jungle is again in trend" while 88% disagrees with it, which reflects the need
for a city to be harmonic with nature, airy and transparent, diversified and
visibly suitable.
Diversity
The convincing respondents' agreement with the claim "urban environment
is a source of thousands of inspirations" indirectly reflects the importance
of the city diversity.
The respondents rejected the claim "flowers on the windows belong to the
countryside" (72% disagree with it), thus emphasizing one of the
opportunities that the inhabitants of the city can co-create and co-design
urban environment.
Extremely strong agreement (in both cases, 96%) was given to the claim
"street furniture (benches, bins, lamps ... co-create the image of the city",
and "diverse city centre invites people to visit streets, squares,

36
embankments and parks". Almost equally strong (91%) are agrees with the
statement "discovering new urban details is always inspiring".
A very positive attitude is also reflected to the claims that "markets and
parks come alive with the help of interesting events" (85%), "horticulturally
arranged crossings and roundabouts are aesthetic" (82%) and "many
different social places in the city allow for a good socializing" (72%). In the
claim that "markets and parks come alive with the help of interesting
events", women are more convinced (90%) than men (80%).
Discussion
The results of the research shows the most important QUE indicators and set
out those that have the strongest influence on the perception of city. They
researched claims significantly influence orientation in the city, the
attractiveness of life, the performance of services, the possibility of
spending spare time, the relaxed everyday living and the mobility in the city.
They need to be in the spirit of the time and have to take into account
trends. A meaningful mark in the perception of the city creates unique,
fashionable and solutions in harmony with the preserved cultural heritage.
Urbanism solutions creates recognizable landmarks of the city regarding it
as a whole and/or as its parts, realizes its internal and external goals and
co-shapes the city as a brand. Urbanism with its solutions has many
possibilities to raise the perceptual level of the city, its brand and increase
its reputation among the inhabitants and visitors.
Synthesis of the obtained results of the survey implies concrete directions
for the urbanists. The most important findings are:
• Within the qualitative urbanistic element Context, the town's heritage is
one of the key elements for the inhabitants and visitors. Most (80%) of the
respondents see in the degraded city areas opportunity to arrange or
rearrange them. Heritage and modern spirit are supposed to intertwine in
cities, which gives freedom to urbanistic and architectural creativity.
• Within the element Accessibility, there are two exposed claims, one
requires mobility without a car and the other, enable as many pedestrian
movements as possible. They both conform to the modern and distinctive
developmental trends of cities and reflect the advanced mentality of the
inhabitants and visitors of the city. Linking pedestrian access to city services
and shopping with health, also perfectly matches the trend that every
individual wants to take care of their health, and that active movement (in

37
our case walking on foot) allows this. Respondents expect a higher degree
of safety in enclosed parks.
• Diversity is important for respondents and the fact that modern spatial
solutions can also be warm and diversified (life-friendly) for different social
types of residents and visitors, confirms the correct orientation of those
urban planners who want to provide modern and advanced solutions in
addition to functional solutions, which generate warmth, positive
atmosphere and good mood. Most claims about the diversity of the city
confirm the importance of: (a) urbanistic and architectural heritage, (b)
attractive and outstanding modern buildings, and (c) typically arranged
urban slopes. They significantly co-creates the character of the city.
• The city's Readability has proven to be one of the most important QUE,
regardless of whether it is typical of buildings, bells, roundabouts, bridges,
markets, parks ... The feeling, that the residents and visitors of the city
always know where they are momentarily located, gives them a feeling
security.
• Respondents are most closely linking Flexibility to security and eco-
friendly mobility. Among other things, flexibility implies the future of city
cycling and freedom, driven by easy and quick movement around the city by
bicycle. It is also important that the parking lots move from urban areas into
underground garages, which besides enabling more safety of cities provides
friendly environment, cleaner air and releases more city space.
• Visible suitability is one of the most subjective urbanistic criteria.
Nevertheless, it is necessary to highlight some of its elements that reflect
the opinion of respondents on how these elements affect the city
attractiveness, character and functionality. Outstanding issues:
maintenance of buildings, outdoor advertising and un-built spaces. In the
latter, they see an opportunity for the city's maximum airiness. For the
younger generation, the criterion of visible suitability is not as important as
for the elderly, but it is important for everyone that the urban solutions are
in harmony with nature what creates an airy, transparent and diverse city.
• The respondents' answers to the element Diversity explain how important
it is for spatial planners to realize that every urbanistic move is not only a
functional solution to certain spatial problems, but a step closer to the
aesthetic and socially friendly city, which with its diversity, eliminates
boredom, invites enjoying life in its places and inspires in thousands of ways.

38
Conclusion
Urbanism influences the creation of various aspects of interest. Its final
solutions and creations influence the perception of the city (Pompe and
Temeljotov Salaj, 2014). An analysis of the results of the survey explains
which qualitative elements of urban planning have a significant impact on
the perception of the city and thus on the perception of the city brand. The
importance of individual indicators within individual qualitative urbanistic
elements vary. Inside them, the opinions of the respondents unequivocally
showed what gives the greatest contribution to the quality of the city from
the urbanism point of view. The key exposed properties derive from
important aspects of influencing the urban environment on the quality of
life in the city: car-free mobility, non-poisoned air, characteristic spatial
and architectural solutions (landmarks), carefree orientation, advertising
harmonious with spatial solutions and socialization opportunities. The
observable weight of the research also gives rational and emotional values,
derived from the answers. They emanates from the emotional perception of
the city, and since most human decisions derive from emotions, it is
important for urban planners to take, in addition to functional solutions,
into account the psychological impact on the inhabitants and visitors of the
city.
Recommendation
The most exposed, desired and today most sought-after rational and
emotional values are mobility, memory, equality, image, furnishings,
socializing health, inspiration, security, motivation, freedom, beauty and
aesthetics. The exposed values provide an insight for urban planners and
designers, so they can structure and shape their solutions aligned primarily
with the researched users' expectations and a vision of the development of
the city.
Inter-sector cooperation is a wide source for further researches in the field
of urbanistic planning and designing as well as for marketing and branding a
city.
REFERENCES
Armistead, C. & Mapes, J. (1993). The impact of supply chain integration on
operating performance. Logistics Information Management, 6(4), 9-14.

39
Babbie, E. (2013). The Practice of Social Research. 13th ed. International
Edition.CA: Wadsworth, USA.
Chang, H.H., Tsai, Y.C. & Hsu, C.H. (2013). E-procurement & Supply Chain
Performance. International Journal of Management, 18(1), 34-51.
Chirchir, E.K., Ngeno, V. & Chapkwony, J. (2015). Relationship between e-
procurement adoption & supply chain management practices in tea firms.
International Journal of Managerial Studies & Research, 3(2), 25-36.
Collins, J. & Hussey, R. (2003). Business Research: A Practical Guide for
Undergraduate and Post Graduate Students. New York, NY: Macmillan.
Cousins, P.D. & Menguc, B. (2006). The implications of socialization and
integration in supply chain management. Journal of Operations
Management, 24, 604-620.
Eadie, R., Miller, P., Perera, S., Heaney, G. & Barton, G. (2012). E-readiness
of construction contract forms & e-tendering software. International
Journal of Procurement Management, 5(1), 1-26.
Eei, K.S., Hussain, W. & Mustaffa, N. (2012). Survey on benefits & barriers
of e-procurement: Malaysian SMEs perspective. International Journal on
Advanced Science Engineering Information Technology, 12(6), 14-19.
George, B., Williams, A. & Henthorne, T. (2011). E-procurement in the
hospitality industry: an exploratory study. International Journal of
Procurement Management, 3(2), 231-244.
Gunasekaran, A. & Ngai, E.W.T. (2008). Adoption of e-procurement in Hong
Kong: an empirical research. International Journal of Production
Economics, 113, 159-175.
Gunasekaran, A., Mcgaughey, R.E., Ngai, E.W.T. & Rai, B.K. (2009). E-
procurement adoption in the South Coast SMEs. International Journal of
Production Economics, 122, 161-175.
Karjalainen, K. & Kemppainen, K. (2008). The involvement of small-&-
medium sized enterprises in public procurement: impact of resource
perceptions electronic systems & enterprise size. Journal of Purchasing &
Supply Management, 19(4), 238-246.
Liu, Q., Sun, S.X., Wang, H. & Zhao, J. (2011). A multi agent-based system
for e-procurement exception management. Knowledge Based Systems, 24,
49-57.
Maiga, A.S. (2016). Assessing the Impact of Supply Chain Integration on Firm
Competitive Capability. International Journal of Operations Research and
Information Systems, 7(1): 1-2. Jan-Mar.
Mccue, C. & Roma, A. (2012). E-procurement: myth or reality? Journal for
Public Procurement, 5(1), 54-72.
Mettler, T. & Rohner P. (2009). E-procurement in hospital pharmacies: An
explanatory multi-case study from Switzerland. Journal of Theoretical and
Applied Electronic Commerce Research, 4 (1), 23-38.

40
Moon, M.J. (2005). "E-procurement management in state governments:
Diffusion of e-procurement practices and its determinants", Journal of
Public Procurement, 5(1), 54-72.
Ombat, K.O. (2015). The relationship between procurement systems and
performance of procurement function in commercial banks in Kenya.
International Journal of Economics, Commerce and Management, 3(12),
697-723.
Panayiotou, N.A., Gayialis, S.P. & Tatsiopoulos, I.P. (2004). An e-
procurement system for governmental purchasing. International Journal of
Production Economics, 90, 79-102.
Presutti, W. D. (2003). Supply Management and E-Procurement: Creating
Value Added in the Supply Chain. Industrial Marketing Management, 32 (3),
219–226.
Ronchi, S., Brun, A., Golini, R. & Fan, X. (2010). What is the value of an IT
e-procurement system? Journal of Purchasing & Supply Management, 16,
131-140.
Salkind, T. (2012). E-procurement management in state governments:
Diffusion of e-procurement practices and its determinants. Journal of
Production Economics, 89, 339-351.
Shafeek, S. (2009). Enhancing the Strategy for Developing Small Growth
Potential Firms in the Eastern Cape. Journal of African Research in Business
Management, 4(4), 27-56.
Sigal, M. (2006). E-procurement diffusion on the supply chain of food service
operators: An explanatory study in Greece. Information Technology &
Tourism, 8(2),79-90.
Smart, A.F. (2010). E-procurement and Its Impact on Supply Management -
Evidence from Industrial Case Studies. International Journal of Logistics:
Research and Applications, 13(6), 423-440.
Smuts, H. (2008). Determinants of supplier-retailer collaboration: evidence
from an international study. International Journal of Operations and
Production Management, 26(1), 24-49.
Tai, Y.M. (2011). Exploring the performance impact of web based direct
procurement systems. International Journal of Production Research,
48(18), 5397-5414.
Tatsis, V., Mena, C., Van Wassenhove, L. & Whicker, L. (2006). E-
procurement in the Greek food & drink industry - drivers & impediments.
Journal of Purchasing and Supply Management, 12(2), 63-74.
Vanderstoep, S.W. & Johnston, D.D. (2009). Research methods for everyday
life: blending qualitative and quantitative approaches. San Francisco:
Jossey-Bass.
Welman, C., Kruger, F. & Mitchel, B. 2005. Research methodology. Cape
Town. Oxford.

41
SUITABILITY OF NEUROLINGUISTIC PROGRAMMING METHODS IN BUSINESS COMMUNICATION
Ana Globočnik Žunac,
Ph.D. University North,
Croatia [email protected]
Jasna Tukač,MSc University North,
Croatia [email protected]
Vlatka Kordoš, MSc University North,
Croatia [email protected]
Abstract
Neurolinguistic programming (NLP) is a methodology used in a business
environment with the goal to improve the potential of employees. NLP is
focused on achieving quality communication, removing barriers, building
confidence and creating better interpersonal relationships. Researching NLP
theory has resulted in finding a large number of methods that facilitate
communication in a business environment, in order to avoid conflicting
stressful situations and achieve greater business results. The paper presents
scientific study of respondents in the Republic of Croatia on their attitudes
towards the acceptability of the methods of neurolinguistic programming in
business, which has a goal to ensure more efficient communication and
better results in the business environment. An online questionnaire was
constructed for the purpose of the research. There were 150 respondents
that are all employed in Republic of Croatia. The hypothesis that says:
‘Respondents in Croatia find NLP method acceptable for use in business
environment’ has been confirmed by the given results. However, the results
show that the respondent’s acceptance of the methods does not depend on
their extroverted or introverted personality, nor on the familiarity with the
NLP topic.
Key Words
Neurolinguistic programming; communication methods; efficient
communication; business communication.

42
INTRODUCTION
The communication system consists of various aspects (exchange and
processing of information, transmission of a message, contact with business
partners and the like) without which an organization could not function
(Jurković, 2012). One of the priorities of a business man is to get empowered
to communicate in order to achieve business success. Business
communication has in the past been relied to the knowledge, specially of
NLP, the method of successful business (Vodopija, 2006). Neurolinguistic
programming (acronym NLP) is a communication model that aims to identify
and use patterns in the thinking process as a means of improving the quality
and effectiveness of communication. It is focused on achieving goals,
creating better interpersonal relationships, removing barriers, building
selfconfidence and acting more effectively. It is used in various fields of
occupation (business, education, law, medicine and psychotherapy) to
identify human patterns and to influence change in responses to stimuli.
Neurolinguistic programming can be used in sales, customer service,
negotiation, conflict resolution, presentations, teamwork, as well as
motivating others (Parvizi, 2015). NLP methods are used to influence work
efficiency, success in conflict resolution and communication productivity.
They serve to improve negotiation and sales skills. In the United States, NLP
is a widespread methodology, with remarkable results in achieving better
communication and better interpersonal relationships. Research into the
theory of neurolinguistic programming finds a large number of methods that
facilitate communication in the business environment, all with the aim of
avoiding conflicting stressful situations and achieving better business
results. NLP methods are effectively used in various areas of human activity,
including team communication, client communication (sales, marketing,
public relations), mediation, and facilitating and enhancing communication
in conflict resolution at work.
NEUROLINGUISTIC PROGRAMMING IN BUSINESS COMMUNICATION
NLP is a practical discipline that encompasses a range of models, techniques
and skills to think and act effectively. It studies how people achieve success
in a wide variety of areas (the modeling process) and teaches people these
patterns. The patterns, skills and techniques thus obtained are increasingly
used in education, counseling and business in the pursuit of accelerated
learning, personal development and more successful communication
(O'Connor and Seymour, 2009). NLP has gained immense popularity over the
last 25 years. Trainings were conducted at companies such as Hewlett-
Packar, IBM, McDonald's, NASA, the United States Army, the U.S. Olympic
Team, and numerous public school systems (Singer and Lalich, 1996

43
according to Witkowski, 2011). NLP methods are used to influence work
efficiency, success in conflict resolution, and communication productivity.
In business communication, it is commonly used for negotiation purposes.
Recognizing the collaborative representation system of the people we work
with, can be very valuable in achieving positive results when discussing some
decisions, building teams or even selling (Dilts and Dilts, 1983). One of the
key applications of NLP methods in organizational settings is to effectively
set goals and strategies for maximizing results (McDermott and Jago, 2007).
NLP methods
One of the methods of NLP is the Dickens form, based on the work of Tony
Robbins. It was named because it models Ebenezer Scrooge's experience in
the Charles Dickens novel Christmas Story from 1843. The form aims to take
control over life, changing limiting beliefs (Ellerton, 2013). Bandler (2012)
calls this method a belief modification method or a pattern of belief
replacement. It helps to change one's beliefs and gain more faith in oneself.
Anchoring is a process in which a particular stimulus connects to a specific
physiological or emotional state. The stimulus of associating with the desired
state is called the anchor. Anchoring was created as a result of research by
Russian physiologist Pavlov, a pioneer of behaviorism. Anchoring happens
unknowingly, but it can also be developed intentionally (consciously). An
anchor can be anything that causes an automatic reaction or causes an
emotional state, for example, the sound of a familiar melody can elicit a
smile on your face or trigger some strong negative feeling (Mladenović and
Vrsaljko, 2009). NLP defines an anchor as a process that connects a sensory
stimulus to a particular state of mind (Vodopija, 2006). This method can be
used to change internal states, stabilize states, move elements of one
experience into another, and change behavior. Using one's own states is one
of the most effective ways of changing own behavior, as well as the behavior
of others (Mladenovic and Vrsaljko, 2009). John Grinder and Richard Bandler
developed the technique of visual-kinesthetic (V-K) dissociation in 1976. It
is a method that addresses trauma and helps people cope with the stressful
and painful experiences that have the consequences of limiting them in
reaching their goals. The goal is to disconnect from feelings and create the
experience of being outside your own body. This ability can help a person to
distance psychologically from stressful, painful, or traumatic experiences
and become able to respond differently in similar situations. This technique
can help people who have problems with presenting, running a meeting,
communicating with a team (Mladenovic and Vrsaljko, 2009). Walt Disney's
strategy is another NLP tool developed by Robert Dilts. It was named after
American producer Walt Disney. It is a dream development strategy that

44
enables them to come true. It is based on taking on three different roles
involved in the process of turning creative ideas into reality - the dreamer,
the realist and the critic. Dilts found that if they take on these roles in turn,
people develop their ideas and plans faster and more effectively. Although
this method is primarily used in business, it allows for the introduction of
creativity into the work of the team (MacDermott and Jago, 2007). Taking a
different observation position can be a very easy way of predicting other
people's potential reactions and deciding what to say or do. Iti s useful for
meetings. The essence of this method is to get into all three observation
positions (I, the other, the observer) in order to gather as much information
from as many points of view as possible (Terry and Churches, 2011). Molden
and Hutchinson (2008) call this metoda a positioning technique for
perception, and Mladenovic and Vrsaljko (2009) a technique for changing
perceptual positions.
METHODOLOGY
The aim of the research was to determine the attitudes of employees in the
Republic of Croatia on the suitability of NLP methods in business
communication and to analyze, according to the results obtained, whether
the attitude of the respondents to the NLP is correlated to their personality
(extrovert/introvert). Accordingly, the hypotheses were stated: '
Respondents in Croatia find NLP method acceptable for use in business
environment.'; 'Extroverted respondents are more inclined to accept NLP
methods.' and 'Attitude towards the suitability of these methods depend on
whether the respondents had previous information about NLP.'.
The survey involved 150 persons employed in the Republic of Croatia, 77
women (51.3%) and 73 men (48.7%). There are 111 (74%) of respondents that
have completed higher education and 39 (26%) secondary education. There
are 72% of respondents working in the public sector and 28% in the private
sector. Most respondents, 100 (66.7%), see themselves as extroverted
persons, while 50 (33.3%) feel that they are more introverted.
RESULTS
The respondents expressed their views and opinions by selecting one
possible answer to the closed-ended questions. Most respondents are not
familiar with NLP, 65 of them (43.3%) have never heard of NLP, 40 (26.7%)
have heard, but do not know exactly what it is about, 42 (28%) knows a little,
and three (2%) are already using NLP, even though they did not attend NLP
training. Of all 150 respondents, none attended NLP training and none of
them were NLP trainers.

45
Graph 1. Familiarity with NLP
Source: own survey
Asked about possibility of using NLP methods with the aim of achieving more
effective communication and better business results, the majority of
respondents, 74 (49.3%), think that any help was welcome, 56 (37.3%) did
not know enough about these methods to 14 of them (9.3%) were not sure if
they would use NLP methods for more effective communication and better
business results, while four (2.7%) would by no means use NLP methods. Only
two (1.3%) are already using NLP methods.
Graph 2. Usage of NLP methods
Source: own survey
One of the first methods of NLP explained in the survey is the Dickens form
used to take control of life by altering the limiting beliefs that affect us.
Asked if they thought this method would be acceptable for use, 86
respondents (57.3%) said they could use it, 45 respondents (30%) already
used it but did not know it was NLP, while 19 (12.7%) felt that this method
would not help them. There are 87.3% of respondents that have a positive
attitude towards this method or they think that they could use it or already
use it, and only 12.7% think that it would not help them, that is, that this
method is not acceptable for use.
I've never heard of it
I've heard of NLP, but I don't know what…
I've heard of NLP and I know something…
yes, I use NLP even though I didn't…
yes, I've attended NLP classes and I use it
yes, I'm an NLP trainer
0 10 20 30 40 50 60 70
65
40
42
3
0
0
I wouldn't
I'm not sure
I don't know enough about these methods…
yes, any help is welcome
I already use them
0 10 20 30 40 50 60 70 80
4
14
56
74
2

46
Graph 3. The Dickens pattern - acceptability of use
Source: own survey
Asked about acceptability of Walt Disney's method used in business to bring
creativity to the team and involves taking on three different roles involved
in the process of turning creative ideas into reality - dreamer, realist and
critic, most respondents, 83 of them (55 , 3%) think it could be applied, 45
(30%) is not sure and think it might be applicable, 13 (8.7%) say they already
apply it, and nine (6%) think it could not be applied. Most respondents, 64%
of them, have a positive attitude towards the acceptability of this method
in business communication, 30% are not sure that they can apply it, and only
6% have a negative attitude, ie they think that it could not be applied.
Graph 4. The Walt Disney Strategy - acceptability in business
Source: own survey
After being acquainted with the five methods of NLP, the respondents rated
their views on their applicability in business communication using a five
degree Likert scale, with a value of 1 indicating complete disagreement and
a value of 5 fully agreeing with the statement. Respondents gave a mean
score of 3.7 (agreement) for Dickens form, V-K dissociation, and occupation
of various observational positions, and 3.5 for anchoring and Walt Disney
strategy. A total score of 3.62 indicates that respondents considered all five
NLP methods to be acceptable.
no, I don't think it would help
yes, I'm already using this method, but I…
yes, I think I could use it
0 10 20 30 40 50 60 70 80 90
19
45
86
no, I don't think it can be applied
maybe, I'm not sure
yes, it can be applied
yes, it's already being applied
0 10 20 30 40 50 60 70 80 90
9
45
83
13

47
Graph 5. Respondent's view on applicability of NLP methods
Source: own survey
In order to gain insight into the respondents' interest in improving business
communication using NLP methods, they were asked about accepting free
provided training. Most respondents, 122 (81.3%) would certainly accept
education, 18 (12%) are not interested, 6 (4%) do not think they need to
invest in their communication skills, three (2%) do not believe that these
methods are useful, and one respondent (0.7%) has already attended such
training.
Graph 6. Acceptance of free NLP education
Source: own survey
Table 1 shows the relationship between respondents' self-esteem
(extrovert/introvert) and their response to the acceptability of using the
Dickens form in business. Most respondents, introverts and extroverts,
consider this method acceptable for use.
0
50
The Dickenspattern
V-Kdissociation
Anchoring The WaltDisney
Strategy
Perceptualpositions
9 9 913
910 712 9 6
3640 43 46 45
5863 63
5155
3731
2331
35
I completely disagree I disagree indifferent I agree I completely agree
no, I'm not interested
no, I think I don't need to invest in my…
no, I don't think these methods are useful
no, I already attended this type of…
yes, I would definitely accept
0 20 40 60 80 100 120 140
18
6
3
1
122

48
Table 1. Attitude on acceptability of the Dickens pattern in business
Source: own survey
The relationship between respondents' self-esteem and answers to the
question about the acceptability of Walt Disney's strategy in business is
shown in Table 2. Most respondents from both groups considered that this
method could be applied in their business.
Table 2. Attitude on acceptability of the Walt Disney strategy in business
Do you think this method could be applied to your business?
SELF-ASSESSMENT
OF RESPONDENTS
yes, it
can be
applied
yes, it's
already
being applied
maybe,
I'm not
sure
no, I don't
think it can be
applied
∑
introvert 27 5 13 5 50
extrovert 56 8 32 4 100
∑ 83 13 45 9 150
Source: own survey
The results in table 3 indicate that, whether introverted or extroverted,
respondents agree that all five NLP methods could be applied in business.
Do you think this method would be something you could use?
SELF-ASSESSMENT
OF RESPONDENTS
yes, I think I
could use it
yes, I'm already
using this method,
but I didn't know it
was NLP
no, I don't
think it
would help
∑
introvert 29 15 6 50
extrovert 57 30 13 100
∑ 86 45 19 150

49
Table 3. Respondent's view on acceptability of NLP methods
statement
the DICKENS pattern
V-K DISsociation
anchoring
the W. DISNEY strategy
Perceptual positions
∑
intr
overt
I completely agree 12 11 9 10 10 52
I agree 26 23 25 17 17 108
indifferent 10 13 12 16 20 71
I disagree 0 2 2 3 1 8
I completely disagree
2 1 2 4 2 11
extr
overt
I completely agree 25 20 14 21 25 105
I agree 32 40 38 34 38 182
indifferent 26 27 31 30 25 139
I disagree 10 5 10 6 5 36
I completely disagree
7 8 7 9 7 38
Source: own survey
Table 4 shows the relationship between respondents' self-assessment and
answers to the question about the acceptability of NLP education. The
majority of respondents from both groups would accept free NLP training,
while only a few found these methods to be of no use and did not need to
invest in their communication skills. There are 10% of extroverted and 6.25%
of introverted respondents showing that they are not interested in
education.
Table 4. Acceptance of free NLP education
If your employer ensured free NLP education, would you accept it?
SELF-
ASSESSMENT
OF
RESPONDENTS
yes, I
would
definitely
accept
no, I
don’t
think
these
methods
are
useful
no, I’m not
interested
no, I think I
don’t need
to invest in
my
communicat
ion skills
no, I
already
attended
this type
of
educatio
n
∑
introvert 38 1 8 3 0 50
extrovert 84 2 10 3 1 100
∑ 122 3 18 6 1 150
Source: own survey

50
The existence of a correlation between the two variables was checked by
chi-square test using the frequencies of occurrence of a single response in
relation to the extroverted/introverted subjects. Table 5 shows the values
of the calculated chi-square tests based on the data presented in Tables 1
(Dickens Form), 2 (Walt Disney Strategy) and 3 (NLP Education). Given that
the results of the chi-square test show that all χ2 are smaller than the
readings, the conclusion is that respondents who consider themselves
extroverted do not differ statistically significantly from those who consider
themselves to be more introverted in their propensity to adopt NLP methods.
Table 5. Connection analysis of extroversion or introversion of the respondents and their answers regarding the applicability of NLP methods
FREQUENCY OF ANSWERS the dickens pattern (Table 1.)
THe w. disney strategy (Table 2.)
acceptance of nlp education (Table 3.)
CHI-SQUARE: 0,032 2,578 2,512 DEGREES OF FREEDOM (df): 2 3 4 SIGNIFICANCE LEVEL p: 0,984 0,461 0,643 LIMIT VALUE: 0,05 2,37 3,36
STATUS: Ok.
At least 20% of expected frequencies are less than 5.
At least one expected frequency is less than 1.
Yates correction: - 1,361 1,423 Yates p: - 0,715 0,840 HYPOTHESIS: 0,031 < 0,05 1,361 < 2,37 1,423 < 3,36
Source: own survey
The relationship between respondents' familiarity with NLP and responses
regarding the acceptability of using NLP methods to achieve more effective
communication and better business results is shown in Table 6. The most
respondents, 71.4% of them who are already familiar with NLP believe that
any help is welcome, while 24% think they cannot answer the question
because they do not know enough about these methods. Most of those who
have heard about NLP but do not know exactly what it is about cannot
answer the question about the acceptability of using methods because they
do not know enough about these methods. Of those who have never heard
of NLP, there are 43.1% who think that all help is welcome and 41.5% cannot
respond because they do not know enough about these methods.

51
Table 6. Respondent's view on applicability of NLP methods
Would you use NLP methods if you knew they’d help you in achieving
a more efficient communication and better business results?
Familiarity with
NLP
yes, any
help is
welcome
I
wouldn
't
I don't know
enough about
these methods to
answer
I'm
not
sure
I
already
use
them
∑
I’ve heard of NLP
and I know
something about it
30 1 10 1 - 42
I’ve heard of NLP,
but I don’t know
what it’s about
15 1 19 5 - 40
yes, I use NLP even
thought I didn’t
attend NLP classes
1 - - - 2 3
I’ve never heard of
it 28 2 27 8 - 65
∑ 74 4 56 14 2 150
Source: own survey
Table 7 shows the relationship between the respondents' familiarity with the
NLP and the answers regarding the acceptability of using Dickens Form in
business. The majority of respondents, 57.3% from all categories of NLP
familiarity respondents, believe that any assistance is welcome, while 30%
already use this method without knowing that it is NLP. Only 12.7% think
that this method would not help them.
Table 7. Attitude on admissibility of the Dickens pattern in business
Do you think this method would be something you could use?
Familiarity with NLP yes, I think I
could use it
yes, I'm already using
this method, but I
didn't know it was NLP
no, I don't
think it
would help
∑
I’ve heard of NLP and
I know something
about it
22 17 3 42

52
I’ve heard of NLP, but
I don’t know what it’s
about
25 10 5 40
yes, I use NLP even
thought I didn’t
attend NLP classes
3 - - 3
I’ve never heard of it 36 18 11 65
∑ 86 45 19 150
Source: own survey
The relationship between NLP respondents' familiarity with the answer to
the question about the acceptability of Walt Disney's strategy in business is
shown in Table 8. Most respondents from all observed groups believe that
this method could be applied in their business.
Table 8. Attitude on admissibility of the Walt Disney strategy in business
Do you think this method could be applied to your business?
Familiarity with
NLP
yes, it can
be applied
yes, it's
already
being
applied
maybe,
I'm not
sure
no, I don't think
it can be
applied
∑
I’ve heard of NLP
and I know
something about it
23 6 11 2 42
I’ve heard of NLP,
but I don’t know
what it’s about
24 2 11 3 40
yes, I use NLP even
thought I didn’t
attend NLP classes
1 2 - - 3
I’ve never heard of
it 35 3 23 4 65
∑ 83 13 45 9 150
Source: own survey
The results of the applicability of individual NLP methods in a five-degree
Likert scale with respect to familiarity of respondents with NLP are shown
in Table 9. The results indicate that, whether or not they are familiar with

53
NLP- The respondents agree that all five NLP methods could be applied in
their business.
Table 9. Respondent's view on applicability of NLP methods
Source: own survey
Table 10 shows the relationship between NLP respondents' familiarity and
answers to the question about the eligibility of NLP education. The majority
of respondents, 81.3% of them, from all observed groups would accept free
NLP education, while few think that these methods are not useful or do not
need to invest in their communication skills or are not interested in
education.
STATEMENT
the DICKENS pattern
V-K DISsociation
anchoring
the W. DISNEY strategy
Perceptual positions
∑
I’ve heard
of
NLP
and
I
know
som
eth
ing
about
it
I completely agree 16 12 8 11 12 59
I agree 13 19 20 15 17 84
indifferent 8 8 10 11 9 46
I disagree 3 1 1 1 2 8
I completely disagree
2 2 3 4 2 13
I’ve heard
of
NLP,
but
I
don’t
know
what
it’s
about
se r
adi I completely agree 6 7 4 8 8 33
I agree 22 16 19 12 17 86
indifferent 7 12 13 12 12 56
I disagree 3 3 2 5 1 14 I completely disagree
2 2 2 3 2 11
yes,
I u
se N
LP
even
thought
I did
n’t
att
end
NLP
cla
sses
I completely agree 1 1 1 1 1 5
I agree 1 1 1 1 1 5
indifferent 0 0 0 0 0 0
I disagree 0 0 0 0 0 0
I completely disagree
1 1 1 1 1 5
I’ve
never
heard
of
it
I completely agree 14 11 10 11 14 60
I agree 22 27 23 23 20 115
indifferent 21 20 20 23 24 108
I disagree 4 3 9 3 3 22 I completely disagree
4 4 3 5 4 20

54
Table 10. Acceptance of free NLP education
If your employer ensured free NLP education, would you accept it?
Familiarity with
NLP
yes, I
would
definitely
accept
no, I
don’t
think
these
methods
are
useful
no, I’m
not
interest
ed
no, I think I
don’t need
to invest in
my
communicati
on skills
no, I
already
attended
this type
of
educatio
n
∑
I’ve heard of NLP
and I know
something about it
37 1 3 1 - 42
I’ve heard of NLP,
but I don’t know
what it’s about
32 - 7 - 1 40
yes, I use NLP even
thought I didn’t
attend NLP classes
3 - - - - 3
I’ve never heard of
it 50 2 8 5 - 65
∑ 122 3 18 6 1 150
Source: own survey
The check of the existence of the correlation between the two variables was
performed by chi-square test using the frequencies of occurrence of a single
response in relation to the familiarity of the subjects with NLP.
Table 11. Connection analysis of the respondent’s familiarity with NLP and their view on applicability of NLP methods
FREQUENCY OF ANSWERS the dickens pattern (Table 7.)
The w. disney strategy (Table 8.)
acceptance of nlp education (Table 10.)
CHI-SQUARE: 6,569 17,729 10,956 DEGREES OF FREEDOM (df): 6 9 12 SIGNIFICANCE LEVEL p: 0.363 0,039 0,533 LIMIT VALUE: 5,35 14,68 21,03
STATUS: At least one expected frequency is less than 1. Yates correction: 3,526 9,421 20,189 Yates p: 0,741 0,399 0,064
HYPOTHESIS: 3,526 < 5,35 9,421 < 14,68 20,189 < 21,03
Source: own survey

55
The values of the calculated chi-square tests are shown in Table 11 based
on the data in Table 7 (Dickens form), 8 (Walt Disney strategy) and 10 (NLP
education eligibility). Given that the results of the chi-square test show that
all χ2 are less than read, the conclusion is that respondents who are more
familiar with NLP do not differ statistically significantly from respondents
who know nothing about NLP in their propensity to accept NLP method.
DISCUSSION
The majority of respondents, 70% of them, are unfamiliar with NLP, and as
many as 43.3% have never heard of it. Almost half of the respondents were
open to the possibility of using NLP methods in order to achieve more
effective communication and better business results, 49.3% thought that any
help was welcome, while the rest were undecisive or negative. Respondents
also showed a strong interest in accepting NLP education with the aim of
improving business communications, 81.3% of them would accept free
education organized by the employer. In terms of NLP methods and their
acceptability in business communication, 87.3% of respondents have positive
attitude towards Dickenson's form while 64% show the same for Walt Disney's
strategy. Analyzing the results of the research on the acceptability of NLP
methods in business communication, it can be concluded that the hypothesis
Respondents in Croatia find NLP method acceptable for use in business
environment, can be accpeted. Regarding the extroverted/introverted
attitude of the respondents and the respondents' attitude on the
acceptability of NLP methods in business, the research results indicate that
there is no statistically significant correlation between these two variables
and rejects the assumption that the respondents who are more extroverted
are more inclined to accept NLP methods. The results of the study of the
relationship between NLP respondents 'familiarity and the attitude of the
respondents on the acceptability of NLP methods in business indicate that
there is no statistically significant correlation between these two variables,
therefore the assumption that NLP method eligibility depends on NLP
respondents' familiarity is rejected.
CONCLUSION
The results of this research indicate that employees in the Republic of
Croatia are ready to invest in their communication skills in order to achieve
more effective communication and better results in the business

56
environment. Although few are familiar with the theory of neurolinguistic
programming, they are open to embracing this methods and applying them
to change limiting beliefs, deal with traumas that prevent them from
achieving goals, bring creativity to the team, and increase business meeting
productivity. Judging by the results obtained, attitude of respondents
towards adopting these methods is not affected by their knowledge of
neurolinguistic programming and its methods, nor by their personality. By
investigating the quality of communication, removing obstacles, building
self-confidence and creating better interpersonal relationships, respondents
showed that they were ready to accept NLP education provided by the
employer. Despite the fact that NLP has existed for over 50 years, neither
the efficacy nor the validity of the theory has been clearly demonstrated by
convincing research. Research has mainly been conducted in therapeutic
settings, with only a few studies on the efficacy of NLP methods in
commercial settings. Although there are criticisms, the well-known positive
aspects and results of UFO research show that the topic is worth further
study and education in this regard.
REFERENCES
Bandler, R. (2012). NLP: ostvarite život kakav želite. Zagreb: V.B.Z.
Dilts, R. B., Dilts, M. P. (1983) Applications of neuro-linguistic programming
to business communication. California: Meta Publications Inc.
Ellerton, R. R. W. (2013). NLP Techniques Anyone Can Use. Kanada: Renewal
Technologies Inc.
Jurković, Z. (2012). Važnost komunikacije u funkcioniranju
organizacije. Ekonomski vjesnik [online], XXV(2), str. 387-399. Dostupno
na: https://hrcak.srce.hr/94882 [7.1.2019.]
MacDermott, I., Jago, W. (2007). NLP učitelj: cjelovit vodič za osobnu
dobrobit i profesionalni uspjeh. Zagreb: Alineja, M.E.P. Consult
Mladenović, D., Vrsaljko, J. (2009). NLP - uvod u osobi rast i razvoj. Zagreb:
Kigen d.o.o.
Molden, D., Hutchinson, P. (2008). Svemogući NLP: što o NLP-u znaju i kažu
najuspješniji ljudi i kako se njime služe. Zagreb: Veble commerce.
O'Connor, J., Seymour, J. (2009). NLP – uvod u neurolingvističko
programiranje: psihološke vještine razumijevanja i utjecanja na ljude.
Zagreb: TELEdisk d.o.o.
Parvizi, B. (2015). How to use communication & NLP: Manipulating and
leading the human mind trough different NLP techniques. Hague: C&I
consultants.

57
Terry, R., Churches, R. (2011). Zbirka metoda neurolingvističkog
programiranja (NLP-a): Inovativne aktivnosti i strategije za nastavnike,
voditelje tečajeva i škola. Buševec: Ostvaranje d.o.o.
Vodopija, Š., (2006). Opća i poslovna komunikacija. Priručnik i savjetnik za
uspješnu komunikaciju. Rijeka: Naklada Žagar.
Witkowski, T. (2010). Thirty-Five Years of Research on Neuro-Linguistic
Programming. NLP Research Data Base. State of the Art of Pseudoscientific
Decoration? Polish Psychological Bulletin [online], vol. 41(2), str. 58-66.
Dostupno na: https://doi.org/10.2478/v10059-010-0008-0 [26.2.2019.]

58
WHY STUDENTS CHOOSE AN INSTITUTION TO STUDY?
Iztok Sila, MBA
GEA College – Faculty of Entrepreneurship
Slovenia [email protected]
Jani Toroš, PhD GEA College – Faculty of
Entrepreneurship Slovenia
Abstract
For students (and in many cases their parents) location of the institution
where they would obtain their academic knowledge is extremely important.
After they have already decided what to study. Public universities and
especially IHEIs1 need students to survive, therefore institutions must be
aware of factors that affect students’ decision.
In our study MaxDiff (best-worst scaling) was used as an approach for
obtaining preference/importance scores for main attributes, that affect
student’s decision.
We discovered that students expect lecturers with proven experience in real
economy and practical knowledge. In the pedagogical process, students
await practical examples to be used frequently.
We compared results for three institutions2 and found out that differences
between results (analyzing 10 most important characteristics) are not
significant, nevertheless “Lecturers are experienced practitioners« was the
most important characteristic for students of all selected institutions.
Key Words
MaxDiff approach; quality of the program; student’s preferences; score;
students' choice.
1 IHEI - independent higher education institutions 2 GEA College, Doba and VŠPV

59
1. INTRODUCTION
For secondary school graduates and sometimes for their families, one of the most important decisions is what to study. And where.
Universities, higher education institutions, being public or private, are facing competition that is stronger, different, more complex and far more diverse than ever before. Students can study in places all over the world, sometimes even without being physically present in the classroom or even at campus.
There were two objectives of this paper: to define and categorize the most important decision factors in the process of choosing the right IHEI and comparison of the most decisive factors at three different institutions.
Our aim was to look for specific attributes that are important for students studying at business-oriented institutions in Slovenia.
Since the big bribery scandal arose in some famous colleges all over the USA in March 2019, where well known, mostly rich people were involved – to help their children to enter the selected university -, we have also addressed this topic.
2. THEORY
The Bologna Declaration was signed in 1989. Ministers, responsible for higher education from 29 European countries used the Sorbonne Conference and Declaration from 1988 as a founding brick of radical changes in European higher education. In recent years, the number of countries participating in these processes, has risen to 48 (European Commission, 2018).
Generations of students is entering universities are smaller, number of institutions, programs and possibilities is growing. You can choose to study in your geographical area, study in other part of your own country, you can study at the school in another country or even different continent. Institutions can be local or international. And finally, in these days you can also decide for distance learning, usually provided by on-line technologies – these types of studies allow you to be at home (or at work) and do all the activities, including teamwork and exams, on-line.
Situation in organizing tertiary educational processes in Slovenia is quite the same3. There are several public universities and privately owned and managed institutions that are all trying to attract as many enrolled students as possible.
3 Official data on students in Slovenian public universities and schools with concession show decreasing trend in number of students since 2011 (Statistika in analize s področja visokega šolstva)

60
AT the end of May 2019, there were 106 institutions listed in a List of high education institutions and programs (Evidenca visokošolskih institucij in programov) and 1051 programs that a student can choose from! Competition on a 2 million market is thus extremely intense. This is one of the reasons why all the Slovenian institutions are also looking for international students, not just Slovenian.
Potential students and their parents do a lot of research on what schools offer. If institutions want to be found, appearance on the first page in Google search is a must, and providing “educational content about … classes, references from other parents, and ways to communicate and engage with the admissions office” is necessary (Corrado, 2017). Schools are having less control over the information spread among (potential) students, but they have to understand how students use, find and share information. We must be constantly active on all (digital) platforms (Burdett 2013).
It is the same like in other industries - universities must understand what students and their parents need and expect. All the communication activities performed should be able to help students (and parents) to decide for the “right” study (Maringe, 2006), calling attention to factors that influence the decision to choose to study in an institution (DesJardins et al. 1999).
If a school has a clear picture of how and why students choose to enroll in a particular institution, it is easier for them to find the right attributes that would position them as the choice (Hemsley-Brown & Oplatka, 2006)4.
In general, students are quite satisfied with the quality of teaching in Europe – with the highest level of satisfaction being recorded in Finland, Georgia and the Czech Republic with over 70%. The lowest satisfaction recorded in this survey is in Romania (39%). Slovenia is ranked 13th, with 66% satisfied students (European Commission, 2018)
2.1 The 2019 college admission bribery scandal
But sometimes unwanted events happen, just like an excess that arose as “The 2019 college admission bribery scandal”. More than 50 people were involved in “a widespread college admission bribery scandal. The racketeering conspiracy case included the parents of applicants, ACT and SAT administrators, a test proctor and coaches” at different universities5.
4 High quality teaching is the most important factor for students based on a research among 62.366 international student studying at 65 universities in 12 EU countries conducted by Hobsons. Affordable tuition fee options and good ranking were high on the list as well. The possibility of meeting like-minded people was fourth factor, followed by a high graduate employment rate. Ability of meeting the entry requirements and good reputation were also mentioned often (International Student Survey 2017). 5 The list of universities included in this scandal is impressive: Georgetown University, Northwestern University, Stanford University, UCLA, University of San Diego, University of

61
33 parents were charged. (Kates, 2019) Surprisingly (or not?), children were usually not aware what their parents were up to.
There were different ways how college admission process was sabotaged: exam administrators were bribed to facilitate cheating on entrance exams, coaches and administrators of elite universities were bribed to nominate unqualified applicants as capable athletes. Even charitable organizations were used to process laundered bribery payments. (Smith, 2019). Payments went up to 50.000 and even 100.000 USD. (Trevino, 2019).
Unfortunately, everything that has been revealed in March 2019 was not an individual case. W. R. Singer, a college counselor (also an author of self-help books for college admission) organized and sold unfair college admission services to 761 wealthy families’ children and boosted their chances of getting into different institutions. Organizing a complex fraud was quite complicated and connected with high costs – some of the parents even spent up to 6,5 million USD for their children to be able to be at the school of their choice! (Korn, Levitz and Ailwort, 2019; Winter and Burke, 2019) What an investment!
How could you avoid scandals like these? If universities would enroll more students, they would not have been evolved into gatekeepers for some of the industries in USA, especially law and finance, where it is absolutely important where you have studied (Kingkade, 2019). In Canada, for instance, employers rarely discriminate between job candidates. Canadian students often study locally since it is not that important which university the received their diploma from and even “donations don’t get you into the University of Toronto, and certainly, backdoor routes like sports and so on are not very important” (Marginson, S. in Kingkade, 2019).
3. METHODS
To introduce the topic of this paper, some desk research had to be carried out.
Our approach to conducting the main survey had several steps – the first step was the qualitative analysis of students’ needs, reasons for their decision. In the class we identified several clusters of characteristics important for students and later we organized them in logical groups.
Then the quantitative approach followed, in classes again. Students attending the studies were asked to describe and rank the characteristics / factors that were important at the time when they were deciding.
Southern California, University of Texas at Austin, Wake Forest University and Yale University. Tennis, sailing, men's and women's soccer, basketball, water-polo, volleyball coaches and staff members, responsible for exams were usually involved.

62
And at the end, the Maximum Difference Scaling method was chosen, using a set of 20 facts.
MaxDiff (best-worst scaling) is an approach for obtaining preference/importance scores for multiple items, based on the method of paired comparisons as a very old (at least to the early 1900s) and well-established approach for eliciting tradeoffs among paired items. It is a technique invented by Jordan Louviere in 1987. We could use this method for brand preferences, product features, advertising claims and other marketing research. With the MaxDiff method, respondents are shown a set of the carefully prepared items in the study and are asked to indicate the best and the worst items or most and least important.
Two hundred and ten students from five Slovenian IHEIs participated in the study.
This approach enabled us to develop a model of selecting an institution, considering designated factors / attributes that make up the reason to choose one school over another. Using the MaxDiff method we measured which attributes had a significant impact on their choice. Student-related benefits in a form of questions, where students prioritized a list of performance attributes of schools, were asked.
3.1 Desk Research
Several papers, different sources, seminars and materials from conferences, dedicated mainly to quality (assurance) in education had to be analyzed in order to have a clearer picture on the subject. The bribery scandal that escalated in March the USA drew our attention as well.
3.2 Qualitative Research
We used focus groups of students, as a preliminary research. Two focus groups were organized during classes at Gea College and at VŠPV. Results in both focus groups were practically identical and coincided with the arguments defined based on the selection of characteristics of the records of students from the first institution. So, we finalized a list of properties that we used in the next step.
More than 400 different attributes were collected, including the conditions of enrollment, the tuition fee rates and the method of payment, the environment and the location of the school, the schedule of lectures, and the reputation of the institution.
One student sent us her description of reasons why she had decided for Gea College: sister’s recommendation, her wish to become an entrepreneur, impression that she got at the informative day and the information that 90% of graduates from Gea College get a job very soon.
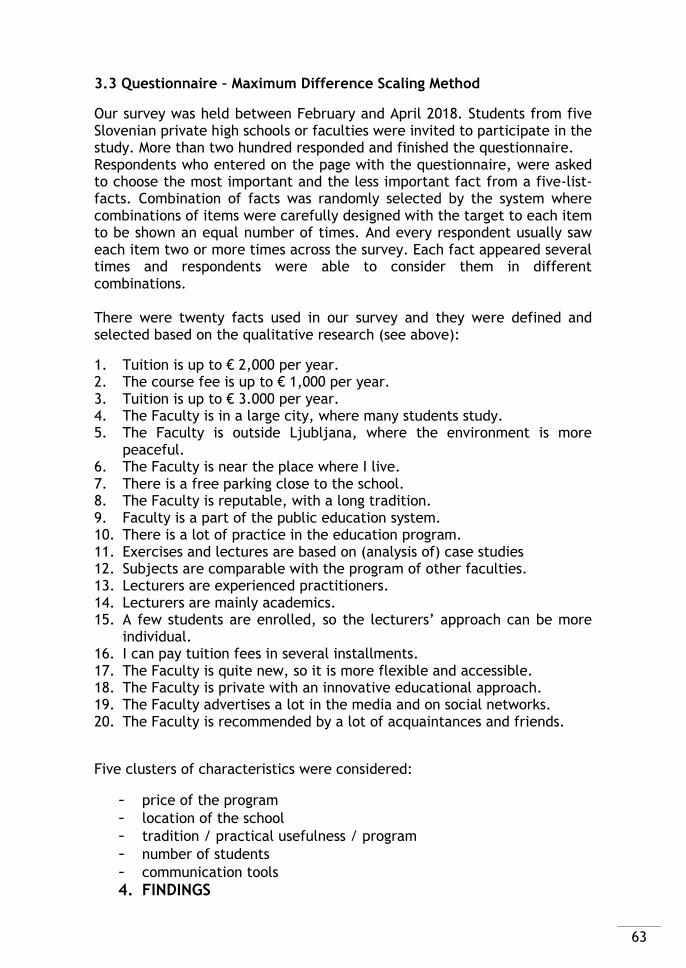
63
3.3 Questionnaire – Maximum Difference Scaling Method
Our survey was held between February and April 2018. Students from five Slovenian private high schools or faculties were invited to participate in the study. More than two hundred responded and finished the questionnaire. Respondents who entered on the page with the questionnaire, were asked to choose the most important and the less important fact from a five-list-facts. Combination of facts was randomly selected by the system where combinations of items were carefully designed with the target to each item to be shown an equal number of times. And every respondent usually saw each item two or more times across the survey. Each fact appeared several times and respondents were able to consider them in different combinations. There were twenty facts used in our survey and they were defined and selected based on the qualitative research (see above):
1. Tuition is up to € 2,000 per year. 2. The course fee is up to € 1,000 per year. 3. Tuition is up to € 3.000 per year. 4. The Faculty is in a large city, where many students study. 5. The Faculty is outside Ljubljana, where the environment is more
peaceful. 6. The Faculty is near the place where I live. 7. There is a free parking close to the school. 8. The Faculty is reputable, with a long tradition. 9. Faculty is a part of the public education system. 10. There is a lot of practice in the education program. 11. Exercises and lectures are based on (analysis of) case studies 12. Subjects are comparable with the program of other faculties. 13. Lecturers are experienced practitioners. 14. Lecturers are mainly academics. 15. A few students are enrolled, so the lecturers’ approach can be more
individual. 16. I can pay tuition fees in several installments. 17. The Faculty is quite new, so it is more flexible and accessible. 18. The Faculty is private with an innovative educational approach. 19. The Faculty advertises a lot in the media and on social networks. 20. The Faculty is recommended by a lot of acquaintances and friends.
Five clusters of characteristics were considered:
- price of the program
- location of the school
- tradition / practical usefulness / program
- number of students
- communication tools
4. FINDINGS

64
For summarizing respondents' preferences, we used Counting analysis, the quick summary method called "counts”. It simply looks at how many times an item was available within sets and counts how many times it was chosen either best or worst. The percent of times an item was chosen as best or worst (when it was available) is termed the "count proportion."
Table 1: MaxDiff Counts Analysis
MaxDiff Counts Analysis
MaxDiff Exercise x
Sets Included All
Respondents Included Completes
Total Number of Respondents 210
Total Number of Sets 1680
Label Item Number
Times Shown - Best
Times Selected Best
Best Count Proportion
Times Shown - Worst
Times Selected Worst
Worst Count Proportion
Tuition is up to € 2,000 per year.
1 428 41 0,096 428 63 0,147
The course fee is up to € 1,000 per year.
2 416 66 0,159 416 60 0,144
Tuition is up to € 3.000 per year.
3 417 30 0,072 417 59 0,141
The Faculty is in a large city, where many students study.
4 420 7 0,017 420 244 0,581
The Faculty is outside Ljubljana, where the environment is more peaceful.
5 420 2 0,005 420 245 0,583
The Faculty is near the place where I live.
6 416 42 0,101 416 172 0,413
There is a free parking close to the school.
7 418 34 0,081 418 149 0,356
The Faculty is reputable, with a long tradition.
8 421 126 0,299 421 17 0,040
Faculty is a part of the public education system.
9 418 32 0,077 418 117 0,280
There is a lot of practice in the education program.
10 415 160 0,386 415 11 0,027
Exercises and lectures are based on (analysis of) case studies
11 417 188 0,451 417 14 0,034
Subjects are comparable with the program of other faculties.
12 414 100 0,242 414 50 0,121
Lecturers are experienced practitioners.
13 431 242 0,561 431 11 0,026
Lecturers are mainly academics.
14 432 59 0,137 432 65 0,150
A few students are enrolled, so the lecturers’ approach can be more individual.
15 412 100 0,243 412 45 0,109
I can pay tuition fees in several installments.
16 425 134 0,315 425 30 0,071
The Faculty is quite new, so it is more flexible and accessible.
17 432 66 0,153 432 88 0,204

65
The Faculty is private with an innovative educational approach.
18 418 169 0,404 418 21 0,050
The Faculty advertises a lot in the media and on social networks.
19 411 17 0,041 411 169 0,411
The Faculty is recommended by a lot of acquaintances and friends.
20 419 65 0,155 419 50 0,119
The report shows results for 210 respondents and 1680 sets (each respondent received 8 choice sets; 210 x 8 = 1680). Each respondent had to choose 8 best and 8 worst items in all 8 questions. Not all questionnaire versions were used but we see from the "Number of Times Shown" column that each item was shown almost the same number of times (411 to 432 times).
In the column "Times Selected Best", we can see how many times each item was selected best (across all sets and respondents). Dividing the "Times Selected Best" by the "Number of Times Shown" results in the "Best Count Proportion." The higher the proportion, the more impact this item has on reenlistment.
The Counts method of analysis is very intuitive, but a good way to get quick proportions of (top-line).
5. DISCUSSION
We divided results into four groups according to importance: items with high importance, secondary, low and items with no importance for choosing a school to study.
Items that have score from 0 to 2 were tagged as not important (no importance), items between 2 to 4 as less important (low importance), above 4 to 8 as more important (secondary importance) and above 8 as very important (high importance).
Table 2a: High Importance Items
Item Average score
1 Lecturers are experienced practitioners 12,05
2 Exercises and lectures are based on (analysis of) case studies 10,92
3 There is a lot of practice in the education program 10,63
4 The Faculty is private with an innovative educational approach 9,73
5 The Faculty is reputable, with a long tradition 8,31
As we can see, the characteristics of schools related to practical skills, lecturers with practical experience, use of case studies and private faculty with an innovative approach are the most important factors influencing the decision at which school the students enrolled. The only characteristic not

66
related to other claims in this group is the Faculty is reputable with the tradition. This latter characteristic is not necessarily related to other values that are more typical for the recent period of development of schools, especially smaller private faculties.
Table 2b: Secondary Importance Items
Item Average score
1 I can pay tuition fees in several installments 7,98
2 A few students are enrolled, so the lecturers’ approach can be more individual
6,17
3 Subjects are comparable with the program of other faculties. 6,13
4 The Faculty is recommended by a lot of acquaintances and friends 4,33
5 The course fee is up to € 1,000 per year 4,21
In the second group properties that are not as homogeneous can be found. Cheaper tuitions, the option of paying in several installments, recommendations from friends and acquaintances and subjects comparable with other faculties, are factors that can be attributed greater importance.
Table 2c: Low Importance Items
Item Average score
1 The Faculty is quite new, so it is more flexible and accessible 3,46
2 Lecturers are mainly academics 3,24
3 Tuition is up to € 2,000 per year 3,16
4 Tuition is up to € 3.000 per year 2,79
5 The Faculty is near the place where I live 2,27
Tuition fees, the proximity of the place of residence, and that lecturers with an academic approach are considered to be less important factors.
Table 2d: No Importance Items
Item Average score
1 There is a free parking close to the school 1,82
2 Faculty is a part of the public education system 1,63
3 The Faculty advertises a lot in the media and on social networks 0,59

67
4 The Faculty is in a large city, where many students study 0,34
5 The Faculty is outside Ljubljana, where the environment is more peaceful
0,23
The possibility of a free parking place, the school being in the city or is out of town in a quiet place, and that a school advertises in the media were considered to be completely irrelevant factors that do not affect the students’ decision on enrollment.
Students who already decided for their program – what to study - were participants in this survey therefore the program itself (usually the most important decision factor) was not taken into consideration.
Students mostly studied management or business-oriented studies.
Table 3: Comparison between selected IMEIs
GEA College Doba Faculty VŠPV
Lecturers are experienced practitioners.
Lecturers are experienced practitioners.
Lecturers are experienced practitioners.
Exercises and lectures are based on (analysis of) case studies
The Faculty is private with an innovative educational approach.
There is a lot of practice in the education program.
The Faculty is private with an innovative educational approach.
There is a lot of practice in the education program.
Exercises and lectures are based on (analysis of) case studies
There is a lot of practice in the education program.
I can pay tuition fees in several installments.
The Faculty is private with an innovative educational approach.
The Faculty is reputable, with a long tradition.
Exercises and lectures are based on (analysis of) case studies
Subjects are comparable with the program of other faculties.
The Faculty is reputable, with a long tradition.
To compare results of students coming from the three selected institutions, we decided to analyze results for Gea College and VŠPV from Ljubljana and Doba from Maribor. Five most important factors for decision were taken into consideration.
As we can see, “Lecturers are experienced practitioners” is the most important factor for students from all three institutions. Being private with an innovative approach was the second most important factor for Doba, third for Gea College and 4th for VŠPV, “practical program” was 2nd for VŠPV, 3rd for Doba and 4th for Gea College. Using case studies was the second factor for Gea College’s students, 5th for Doba and 3rd for VŠPV. “Reputation and tradition” was a factor relatively decisive for students of Gea College – 5th

68
factor, less important for Doba – 6th, where VŠPV’s students also didn’t include it among 5 most important factor (in fact, it was only 9th). Lecturers who are coming from industry are strong asset for all three institutions. And students often decide to study there just because of lecturers who are known to be experienced practitioners. Case studies are often used as a lecturing method at Gea College so that students can link theory and practice in real situations. All three institutions are privately owned, additionally, Doba Faculty is specialized for on-line studies that are also performed in Gea College. Program is especially considered to be practical at VŠPV, where other factors at Doba and Gea College are more important.
6. CONCLUSION AND IMPLICATIONS
Our goal was to detect the most important factors that affect the decision where to study - which school to choose and to find differences between selected institutions. We used several methods, both qualitative and quantitative: desk research, discussion in classes, focus groups, questionnaire in classes and CATI survey (MaxDiff Scaling Method) that was held between February and April 2018. 210 students participated in this survey.
We found out that in Slovenia, students prefer lecturers that are practitioners with some experience and lecturers who are able to teach with the help of practical cases. Tradition and reputation of an institution is important, as well as the opportunity to pay tuition fees in several installments. Smaller number of students that enables a more personal approach is also expected.
Number of international students across Europe is increasing and for them scholarships, high quality teaching6 and good ranking are important things. (International Student Survey 2017).
Location of the IMEI, on other hand, is not an important characteristic when students in Slovenia are deciding.
Comparison in results for the three selected institutions didn’t present significant differences – practical classes are the most important factor. Nevertheless, we are confident that GEA College, Doba and VŠPV could benefit from redefining their competitive advantages, explain them very clearly and be able to enroll more students.
6 Indicators of high-quality teaching are as follows: highly qualified staff, high graduate employment rate, up-to-date technology and online learning options, work placement organized by the university and high volume of face-to-face teaching hours.

69
Our research has some limitations. A relatively small sample, only one iteration of the survey, students from five privately owned and managed Slovenian IMEIs only, without students from public universities. In the future, it would be interesting to find out the results from Erasmus students and survey could be carried out at institutions in other countries as well.
REFERENCES
Corrado, T. (2017): How Your Private School Can Get More Applicants With
Inbound Marketing, Blog.hubspot.com, retrieved from
https://blog.hubspot.com/marketing/how-your-private-school-can-
increase-applicants-with-inbound-marketing, 15.7.2018
DesJardins, S. L., Dundar, H., Hendel, D. D. (1999): Modeling the College
Application Decision Process in a Land-Grant University, Economics of
Education Review, Vol. 18, pp. 117-132
European Commission/EACEA/Eurydice (2018): The European Higher
Education Area in 2018: Bologna Process Implementation Report.
Luxembourg: Publications Office of the European Union
Evidenca visokošolskih zavodov in študijskih programov, retrieved from
http://www.mizs.gov.si/delovna_podrocja/direktorat_za_visoko_solstvo/
sektor_za_visoko_solstvo/evs_evidenca_visokosolskih_zavodov_in_studijs
ki_programov/, 15. 9. 2019
Hemsley-Brown, J., Oplatka I. (2006): Universities in a competitive global
marketplace: A systematic review of the literature on higher education
marketing, International Journal of Public Sector Management, Vol. 19
Issue 4, pp. 216-338 DOI: 10.1108/09513550610669176
International Student Survey 2017. Welcoming the World. An international
future for European higher education. Hobsons
Kates, Graham (March 12, 2019). "Lori Loughlin and Felicity Huffman among
dozens charged in college bribery scheme". CBS News. [Accessed 28 Aug.
2019].
Kingkade, Tyler (April 26, 2019). "This Is Why Canadian Universities Don't
Have College Admissions Scandals". HuffPost. Verizon Media. [Accessed 28
Aug. 2019].
Korn, Melissa; Levitz, Jennifer; Ailworth, Erin (March 13, 2019). "Federal
Prosecutors Charge Dozens in College Admissions Cheating Scheme". The
Wall Street Journal. ISSN 0099-9660. [Accessed 28 Aug. 2019].
Maringe, F. (2006): University and course choice: Implications for
positioning, recruitment and marketing, International Journal of
Educational Management, Vol. 20, Issue 6, pp. 466-479 DOI
10.1108/09513540610683711

70
Peruta, A., Shields, A. B. (2018) Marketing your university on social media:
a content analysis of Facebook post types and formats, Journal of
Marketing for Higher Education, DOI: 10.1080/08841241.2018.1442896
Smith, Laura, Special Agent FBI (March 12, 2019). "College admissions
bribery scheme affidavit" (PDF). The Washington Post. [Accessed 28 Aug.
2019].
Statistika in analize s področja visokega šolstva, retrieved from
http://www.mizs.gov.si/si/delovna_podrocja/direktorat_za_visoko_solst
vo/sektor_za_visoko_solstvo/statistika_in_analize_s_podrocja_visokega_s
olstva/, 13.7.2018
Trevino, Robert (March 12, 2019). "Michael Center, University of Texas men's
tennis coach implicated in admissions scheme, placed on administrative
leave". The Daily Texan. [Accessed 28 Aug. 2019].
Winter, Tom and Burke, M. (March 13, 2019). "College cheating ringleader
says he helped more than 750 families with admissions scheme". NBC.
[Accessed 28 Aug. 2019].

71
KNOWLEDGE MANAGEMENT IN DIGITAL ERA
Krešimir Buntak, PhD
University North, Croatia
Matija Kovačić,MSc University North,
Croatia [email protected]
Ivana Martinčević University North,
Croatia [email protected]
Abstract
Changes in the organizational environment as outcome have a need for organizational changes. With the development of industry 4.0 there is a need for digital transformation which is focused on digitizing business as well as in the automation of activities. In order to adapt the organization to the new conditions in an environment it is necessary to develop organizational knowledge. Once created, knowledge should be managed and must be disseminated to all organizational levels. With automatization of organization system, there is need for applying artificial intelligence that will manage implemented automated systems, but will also manage created base of knowledge. Furthermore, for the knowledge management organization may employ different models, but with the change in the organizational environments, there is a need for developing new models that will enable knowledge mining, management and dissemination of knowledge in the digital age.
Key Words
Industry 4.0; digital era; knowledge menagement; organizational
enviroment.

72
INTRODUCTION
Changes in organizational environments’ have an impact on today’s business paradigms. There is the emergence of a new type of economy that is based on digital technology. Digitalization and digital technology lead to changes of ways of communication in organizations and also have an impact on business processes. Described forces drive a need for digital transformation of the organization which implies implementation of cyber physical systems, internet of things technology and the whole line of new innovations. Furthermore, described changes and need for digital transformation, today’s organizations forces to develop new knowledge that will enable organizational adaptation to new requirements from environments. Organizational learning process means exchange of knowledge whit organizational environments and adjustment of current knowledge to organizational needs (Zbuchea & Vudu, 2018). Once acquired, knowledge must be managed in order to create and add value to product, service and organizational processes at all. Organizational knowledge is managed by processes that are focused on creation, dissemination and used of created knowledge. However, use of knowledge depends of competence of organization and competence of organizational employees at all (Sharma K, 2005). Digital transformation can be one of foundations for organizations to create competitive advantage in the market. Through the use of innovations of information-communication technologies, sharing and creating of organizational knowledge is made more effective and efficient. The organization has the possibility to create a knowledge base within which can accumulate and store created knowledge bud also can analyze that knowledge for different purposes. However, to the organizations are recommended for creation of a knowledge management system that will not be based only on the gathering and documentation of knowledge, but also on creating the relationship between the knowledge and its use for the purpose of creating value. In addition, the need to manage organizational knowledge is not only a consequence of changes in organizational environments, but also results of need for much better adaptation to future changes. REVIEW OF LITERATURE Knowledge management is a discipline which is still in development, especially when come to the digital environment. Today’s scientific papers that are talking about knowledge management are focused on benefits that an organization has from focusing to collecting, manage and dissemination of knowledge. Ghosh (2003) in his paper talking about the importance of libraries which are some kind of knowledge bases in physical form. In his research Ghosh refers to the importance of customization to the new environmental conditions whit implementation of new technologies (Ghosh,

73
2003). Gavrilova, Alsufyev I Kokoulina (2017) in their research are talking about the important of organizational support that organizational have formed an informational technology (IT) in all processes that are related to knowledge management. Except importance of IT, Gavrilova, Alsufyev I Kokoulina concluded that every organization must ensure that strategic management is committed to defining goals and strategies that are related to collecting of knowledge. Furthermore, there are identificated oversized focus of some organization to IT although the organization has small maturity level of existing organizational knowledge (Gavrilova, Alsufyev, & Kokoulina, 2017). Digital transformation, on today's organizations sets a request and challenges that are related to safety of organizational knowledge. Ilvonen, Thalmann, Manhart, Sillaber (2018) emphasize that ensuring safety of organizational knowledge is one of the biggest challenges with whom organizations are facing today. They emphasize the need for developing models of securing organizational knowledge and security-related threats that are coming from organizational environments. Because this fact, it is necessary for organizations to include experts from different areas to development of the security model (Ilvonen, Thalmann, Manhart, & Sillaber, 2018). With the gathering of large amounts of data, there are challenges related to defining the ways in which collected data will be managed. Given this need, Grigorov, Georgiev, Petrov, Varbanov, Stefanov (2009) explore various possibilities that are different information systems offering and recommend that information systems should have three levels of access, public, limited private and shared access (Grigorov, Georgiev, Petrov, Varbanov, & Stefanov, 2008). Given the fact that organizational knowledge stems from organizational changes and adapt to the environment, Mizintseva and Gerbina (2018) talk about the need to create organizational knowledge so that the organization can develop and holistically approach to digital transformation of business (Mizintseva & Gerbina, 2018). On the other hand, Schwarzmüller, Bros, Duman, Welpe (2018) write about a number of changes affecting the organization, resulting in the need to digitization and digital business transformation. Changes in the environment are resulting in need of different kind of competence that are required for the employees that work in organization and wich is related whit creativity in the process of problem resolution (Schwarzmüller, Bruce, Duman, & Welpe, 2018). One of technology that enables collecting and generating organization knowledge is big data. Big data is base of information that organization are generated and collecting in processes. Whit mining techniques, organization can identify knowledge from big data and used it for diffrent puporses. MODELS OF KNOWLEDGE MANEGMENT IN ORGANIZATIONS Need for development of new model for knowledge management arises from requirement for increasing organization efficient and effective. Organizational management is in constant search for new models whit help of whom will be possible to use existing organizational knowledge for

74
organizational growth and development. Parallel whit raising organizational needs for models for managing knowledge, a number of models are developed which are focused on different things (Hacienda & Sarinah, 2009). Furthermore, models for organizational knowledge management allows dissemination of existing knowledge to all organizational levels. In turbulent conditions of organizational environment, it is imperative to adopt the model for knowledge management because knowledge is one of the factor that is correlated with ability of the organization to survive those turbulences (Mohajan H., 2017). Which model will organization choose depends on organization needs and existing of strategy for knowledge management (Hoagie & Kingston, 2003). Nonaka, I Takeuchi (1995) in their paper in which is described research made in Japan in 1995 identified that in the organization are existing two types of knowledge, explicit and implicit. They conclude that organization's success depends on mechanical processing of collected explicit knowledge. Futhermore, they described that process of creating organizational knowledge is determined whit four factors: socialization, externalization, combination and internalization. These are factors that affect transforming implicit knowledge in explicit through dialogue and communication, linking new knowledge with existing one, learning whit doing things and working in teams (Tavakoli & Gandomani, 2016). Implicit knowledge is intuitive knowledge of employees, and it is neither defined nor documented, while explicit knowledge is clearly documented and easily accessible to everyone in the organization. Takeuchi emphasizes that regardless of the source from which knowledge is gathered it is the basis for the development of innovation (Takeuchi, 2006). There are some similarities between models that are presented from Boisot (1987) and Nonaka and Takeuchi (1995). Boisot in his paper speaks of a codified and unqualified knowledge that is consistent with the explicit and implicit knowledge represented by Nonaka and Takeuchi. Both models assume the expansion of knowledge through the all levels of the organization (Haslinda & Sarinah, 2009). Although the transfer of knowledge in organization is a complex process that assumes that knowledge differs depending on the employee's career stage and can be divided into individual, group, organizational and interorganisational relationships that relate to the knowledge of partners, suppliers, competitors and other (Haslinda & Sarinah, 2009). So, the level of knowledge depends on career development, and such knowledge as can be clearly articulated and tacit. In existing literature many authors do not clearly define the concepts of storage, transformation and transfer, which are clearly defined in the model that is represented by Hedlund (1994). Furthermore, the same model describes three fundamental concepts, articulation and internalization of knowledge, expansion and appropriation of knowledge, or assimilation and dissemination of acquired knowledge. Assimilation of knowledge refers to the collection and adoption of knowledge from the environment, which can be a two-way process, and is linked to career development. Dissemination refers to the expansion of

75
knowledge outside the organization, while the processes of articulation, dialogue, reflection and internalization occur between articulate and tacit knowledge at different career stages (Hedlund, 1994). It is important to say how tacit and articulated knowledge are considered like intellectual capital in organizations. A model that is represented by Skandia consider model that is developed for measuring level of existing intellectual capital in organizations. Focus of model is on the establishment equality between buyers, suppliers and innovations. Therefore, this model is depending on these components; structural, human and buyer. In model is described how the market value of an organization depends on the level of intellectual capital in an organization which is determinate by organizational employees. Structural capital is determinate by capital of buyers and organizational capital is the determinate whit capital of inventions and processes (Hacienda & Sarinah, 2009). Organizational focus on intellectual capital allows organizational development and growth as well as growth of organizations market value which depends on goodwill. In other words, investments in the development of organizational intellectual capital determinate faster growth of organizational market value (Edvinsson, 1997). Demerst model of knowledge management point that organizational knowledge is made in organizations, and once made, knowledge is embodied in the organization. Scientific paradigms determinate creating of organizational knowledge parallel whit impact of paradigm of society. Creating knowledge is an interactive process which is constantly embodied in the organization and through an organization is disseminated. Result of creating management knowledge is seen through the emancipation of employees, which determines many of the benefits for organization (Haslinda & Sarinah, 2009). On the other hand, Frids model of knowledge management is talking about the maturity of knowledge level and may bring down to five levels; chaotic state, the state in which an organization recognizes organizational knowledge, the degree in which the organization is focused on knowledge, the degree in which the organization is guided by the knowledge and the last degree in which the knowledge is in the organization center (Caganova, Szilva, & Bawa, 2015). Stankosky and Baldanza (2001) identified a number of factors that are classified as factors that enable organizational knowledge and they are: learning, leadership, organizational structure and culture and technology. However, the authors emphasize that knowledge creation is not only influenced by such factors, but also whit disciplines such as strategic planning, finance, psychology, economics, engineering, etc. (Haslinda & Sarinah, 2009). Descriptive models are just some of the models that enable organizations to manage the created knowledge. However, under the influence of industry 4.0 and digital transformation, existing organizational knowledge management models have to adapt to newly defined requirements.
76
KNOWLEDGE IN DIGITAL ERA In order to ensure the growth and development of the organization as well as its sustainability, it recommends to organization to create and implement some of models for knowledge management. Different knowledge management models focus on different aspects, and the type of model the organization will implement depends on the type and characteristics of the organization (Mohajan H., 2017). Particular attention should be paid to the strategic knowledge management that can provide the possibility of adapting the organization to new requirements in a turbulent environment. One of the challenges facing today's organizations, driven by changes in the environment, is needed for developing new knowledge that is based on IT and which todays entrepreneurs and owners of organizations must have (Sousa & Rocha, 2019). The importance of the existence of an information system within an organization that will enable communication of acquired knowledge and data protection in an implemented information system is constantly emphasized because of the fact that organizational knowledge can be a competitive advantage (Kushwaha, Tripathi, Chauhan, & Saxena, 2017). Industry 4.0 and its related innovations determinate development of new systems that enable organizations to efficiently manage their knowledge as well as possible to collect new knowledge. Development of technological innovations in organizational knowledge management faces challenges that are associated with the ability to identify data from different locations within the organization, the ability to collect data of the machine performance, as well as on the activities that employees perform on machines, optimize data collection and initial processing of collected data (Rot & Sobinska, 2018). Digitalization and technological innovations become an essential component of today's organizations, and directly affect the management processes in the organization. Newly created technological innovations enable organizations to achieve much greater flexibility in decision making than organizations that have not been digitized (Kaivo-oja, Virtanen, Jalonen, & Stenvall, 2015). It is evident that there is not enough scientific and professional research that could contribute to the identification of the impact that digital business transformation has on managing and generating knowledge in the organization. Futhermore, networking in the organization and the use of sensors is enabling the collection of a large number of data from which is possible to identify and create organizational knowledge (Zhou, Alexandre-Bailly, & Piramuthu, 2016). Growing need for a transformation of traditional knowledge-based economy to an innovation-based economy is identified (Meško, Suklan, & Roblek, 2017). However, it is important to emphasize that innovation-based economy cannot be acquired without organizational knowledge which is possible to collect and improve it whit digital technologies. Digital technologies enable management of created knowledge bases, extraction of knowledge from databases, dissemination of

77
knowledge as well as analysis of acquired knowledge (Zbuchea & Vudu, 2018). In addition, digital technologies and more accurately networking in the organization enable better communication and transfer of acquired knowledge. Research has shown that the creation of communication networks in the organization can be a significant cost, but can, in the long run, lead to significantly higher profits (Vladova, Ullrich, Bahrs, & Bender, 2018). Organizational knowledge and artificial intelligence Digital transformation implies the implementation of expert systems as well as automated systems that are based on artificial intelligence. Artificial Intelligence in the last few years is mentioned as one of the ways in which tacit organizational knowledge can be identified and transformed into clearly defined knowledge. However, the issue of artificial intelligence in organizations is not strictly related to its use only within expert systems, but also in automated activities. As such, artificial intelligence can not now contemplate the context of certain activities delegated to it that can result in a possibility of harming the organizational environment (Sanzogni, Guzman, & Busch, 2017). The question is whether artificial intelligence can really replace the intelligence and knowledge of people and also there is a question that is related to the risk to people if artificial intelligence begins to carry out activities that people have done so far. In practice, artificial intelligence is beginning to be applied in the healthcare where is serving in expert systems that assist medical personnel in making decisions (Furmankiewicz, Sołtysik-Piorunkiewicz, & Ziuziański, 2014). Furthermore, there is not yet a sufficiently well designed artificial intelligence system that could communicate with people. However, existing knowledge management systems implemented some form of artificial intelligence that allows a variety of functions, such as mining knowledge (Tsui, Garner, & Staab, 2000). Implementing of artificial intelligence into organizational knowledge management systems is imperative because of the functions that knowledge management systems have and must do, often requiring complex activities (Birzniece, 2011). Birzniece (2011) On the other hand, linking the knowledge base to artificial intelligence allows easier programming such systems and setting up algorithms to perform activities almost without the intervention of organizational employees. In other words, updating operating instructions makes it easier to define automated system settings that will upgrade existing activities performing. The application of such systems will be emphasized with regard to the development and focus on the development of the cognitive computing that integrates a number of functions within it, such as learning automated systems, motion recognition, speech recognition etc.

78
Knowledge mining and big data By implementing technological innovations like sensors in organizations, the organization collects a large amount of data that is stored in the database. For collected data there is a need for analysis so data can be used for making decisions (Ruzgas, Jakubėlienė, & Buivytė, 2016). From the database, it is possible to extract and identify organizational knowledge using mining techniques. In this context, knowledge identification techniques are divided into a data classification, which means grouping data in individual groups from which it will be possible to identify knowledge, create a cluster of data, then classify data in the same group, and finally create a conditional formatting to identify whether there is a link or correlation between individual data (Silwattananusarn & Tuamsuk, 2012). In addition to this, there are a number of different ways to identify knowledge from big data, which primarily depend on the type of data being processed (Fayyad, Piatetsky-Shapiro, & Smyth, 1996). Generally speaking, big data and data mining techniques can be useful when it comes to using identified data for quality improvement, production planning, process improvement, etc. (Cheng, Chen, Sun, Zhang, & Tao, 2018). However, data mining should not only be seen from the aspect of generating knowledge from big data, but also from gathering existing knowledge hidden in organizations, due to insufficiently well-articulated communication between employees, that is, insufficient commitment of management to documenting and gathering knowledge. CONCLUSION Digital transformation of organizations becomes imperative due to changes and innovations that arises from development industry 4.0. Along with that and by increasing the complexity of organizational environment, organizations are forced to adapt to new conditions. By adjusting to the new requirements, organizations acquire new knowledge based on which they can develop a competitive advantage on the market or differentiate themselves from the competition. It is evident that there is a deficit of research that would cover a digital area of organizational knowledge management. Furthermore, the organization's knowledge that is acquired must be managed. Existing organizational knowledge management models have to adapt to new conditions. Organizations need to define new models that will gather organizational knowledge, given the fact that digital transformation enables organizations to apply new technologies for dissemination of organizational knowledge across all organizational levels as well as automated systems that are often based on artificial intelligence. Organizational growth and development is based on organizational knowledge that needs to be adapted to new conditions. It should also be noted that the knowledge profile of organizational staff changes due to the

79
fact that the activities carried out in organizations often automate, which means the need to develop the competencies of organizational staff that will enable them to manage such systems. Organizations are encouraged to create a knowledge base as well as disseminate knowledge generated according to the needs at different organizational levels to enable the foundation of a competitive advantage and improve organizational performance.
REFERENCES
Birzniece, I. (2011). Artificial intelligence in knowledge management: Overview and trends. Scientific Journal of Riga Technical University. Computer Sciences, 5-11.
Caganova, D., Szilva, I., & Bawa, M. (2015). Application of Frid’s knowledge management model to an industrial enterprise. Applied Mechanics and Materials, 16-23.
Cheng, Y., Chen, K., S. H., Z. Y., & Tao, F. (2018). Data and knowledge mining with big data towards smart production. Journal of Industrial Information Integration, 1-13.
Edvinsson, L. (1997). Developing intellectual capital at Skandia. Long range planning, 366-373.
Fayyad, U., Piatetsky-Shapiro, G., & Smyth, P. (1996). From data mining to knowledge discovery in databases. AI magazine, 37-54.
Furmankiewicz, M., Sołtysik-Piorunkiewicz, A., & Ziuziański, P. (2014). Artificial intelligence systems for knowledge management in e-health: the study of intelligent software agents. Latest Trends on Systems: The Proceedings of 18th International Conference on Systems, 551-556.
Gavrilova, T., Alsufyev, A., & Kokoulina, L. (2017). Knowledge Management Trends in the Digital Economy Age. . International Conference on Digital Transformation and Global Society, 464-473.
Ghosh, M. (2003). Knowledge management in the digital age: challenges and opportunities in India.
Grigorov, A., Georgiev, A., Petrov, M., Varbanov, S., & Stefanov, K. (2008). Building a knowledge repository for life-long competence development. TENCompetence Workshop.
Haggie, K., & Kingston, J. (2003). Choosing your knowledge management strategy. Journal of Knowledge Management Practice, 1-20.
Haslinda, A., & Sarinah, A. (2009). A review of knowledge management models. Journal of international social research, 187-198.
Hedlund, G. (1994). A Model of Knowledge Management and the N-Form Corporation. Strategic Management Journal, 73-90.
Ilvonen, I., Thalmann, S., Manhart, M., & Sillaber, C. (2018). Reconciling digital transformation and knowledge protection: a research agenda. Knowledge Management Research & Practice, 235-244.
Kaivo-oja, J., Virtanen, P., Jalonen, H., & Stenvall, J. (2015). The effects of the internet of things and big data to organizations and their knowledge

80
management practices. International Conference on Knowledge Management in Organizations, 495-513.
Kushwaha, P., Tripathi, R., Chauhan, S., & Saxena, R. (2017). Exploring the Role of Knowledge Sharing in Digital Era: A Conceptual Study. Digital Transformation of Business in India: Opportunities and Challenges.
Meško, M., Suklan, J., & Roblek, V. (2017). The Impact of the Internet of Things to Value Added in Knowledge‐Intensive Organizations. Knowledge Management Strategies and Applications, 169-.
Mizintseva, M., & Gerbina, T. (2018). Knowledge Management: A Tool for Implementing the Digital Economy. . Scientific and Technical Information Processing, 40-48.
Mohajan, H. (2017). The Impact of Knowledge Management Models for the Development of Organizations. Journal of Environmental Treatment Techniques, 12-33.
Mohajan, H. (2017). The Impact of Knowledge Management Models for the Development of Organizations. Journal of Environmental Treatment Techniques , 12-33.
Rot, A., & Sobinska, M. (2018). The Potential of the Internet of Things in Knowledge Management System. Position Papers of the 2018 Federated Conference on Computer Science and Information Systems, 63–68.
Ruzgas, T., Jakubėlienė, K., & Buivytė, A. (2016). Big Data Mining and Knowledge Discovery. Journal of Communications Technology, Electronics and Computer Science, 5-9.
Sanzogni, L., Guzman, G., & Busch, P. (2017). Artificial intelligence and knowledge management: questioning the tacit dimension. Prometheus, 37-56.
Schwarzmüller, T., Brosi, P., Duman, D., & Welpe, I. (2018). How does the digital transformation affect organizations? Key themes of change in work design and leadership. mrev management revue,, 114-138.
Sharma K, A. (2005). Knowledge management in the digital. Digital information resources and network on India, 163-169.
Silwattananusarn, T., & Tuamsuk, K. (2012). Data mining and its applications for knowledge management: a literature review from 2007 to 2012. International Journal of Data Mining & Knowledge Management Process, 13-24.
Sousa, M., & Rocha, Á. (2019). Strategic Knowledge Management in the Digital Age. Journal of Business Research, 223–226.
Takeuchi, H. (2006). The new dynamism of the knowledge-creating company. Knowledge Economy, 1-10.
Tavakoli, Z., & Gandomani, T. (2016). Adaptation of Nanoka’s and Takeuchi’s knowledge management model to Scrum roles. International Journal of Software Engineering and Technology, 16-19.
Tsui, E., Garner, B., & Staab, S. (2000). The role of artificial intelligence in knowledge management. Knowledge based systems, 235-239.
Vladova, G., Ullrich, A., Bahrs, J., & Bender, B. (2018). Digitalisation and enterprise knowledge (net) working. Strategica, 696-704.
Zbuchea, A., & Vudu, C.-M. (2018). Knowledge Management in the Digital Era. Strategica, 696-704.

81
Zhou, W., Alexandre-Bailly, F., & Piramuthu, S. (2016). Dynamic
organizational learning with IoT and retail social network data. Hawaii
International Conference on System Sciences, 3822-3828.

82
DIGITAL TRANSFORMATION IN SLOVENIAN ECONOMY
Tomaž Poznič, MSc GEA College – Faculty of
Entrepreneurship Slovenia
Abstract
In today's business environment, companies are facing new challenges that
force them to constantly and quickly adapt. New technologies, customer
demands and expectations, fierce competition and new business challenges
are changing business practice. Changing habits of consumers who are
massively using mobile, smart devices and social networks are forcing
companies to change their products, business practices and business models.
Companies are adapting to the trends of digitalization not only through
customer satisfaction, but also through the optimization, robotization and
automation of their business processes. Data analytics and artificial
intelligence are helping the companies to understand business environment
better. The digital transformation of the society and of the economy is the
fact that community must embrace and adapt. In the paper we are going to
present the results and analyses of the survey conducted between Slovenian
companies that shows the trends of digital transformation in Slovenia and
CEE region.
Key Words
Digital transformation; digitalization; digital trends; ICT; digital trends.

83
DIGITAL TRANSFORMATION
Human Digital disruption is rapidly changing the world in which we are living and working today. The driver of changing world is not a human anymore, but it is the technology. New technology creates new markets which creates new customers and new competitors. Those customers and competitors are building a new expectations which are building new business models. It is clear, that this pace of speed is not going to slow down, but it will only be faster (KPMG International Cooperative, 2017). Organizations must provide superior experience for the customers, consumers, employees and to citizens. But that is not enough. They have to provide and deliver the service faster, high quality and reliable. The opportunity and the risk of survival is here. Only the organizations which understand the requirements of the market will be able to change fast and successful. Digital transformation is enabled and driven by technology, but only the change of technology is not enough. Digital transformation is not only about technology but when company is in the process of transforming, there are changes in the organization and in the business operating model. The way how people are working is changing. Change reflects in the front, in the middle and in the back office. Understanding people behaviour, collecting and analysing data of customers, predicting trends and personalization is often key success factor and need to not gain competitive advantage but survive on the market.
DIGITALIZATION IN EU Technology drives changes in economy. When we say technology, we are talking about social media, mobile services, cloud technologies, internet of things, cybersecurity, robotics and automated machinery, big data and data analytics, 3D printing and artificial intelligence. Implementing those technologies in to the business environment and transform digital, each company should think about eight digital dimensions. Those dimensions are: digital technologies, digital strategy, digital skills, digital economy, digital investments, digital adoption, digital transformation and finally impact. Based on Digital transformation scoreboard prepared by European Commission, most of companies in EU see digital transformation as opportunity. Many companies which started digital transformation are lacking clear targets, effective monitoring and KPIs. But on the other side 8% companies which invested in digitalization observe operation cost decrease and 46% observes increase of turnover (Laurent Probst, Virginie Lefebvre, Christian Martinez-Diaz, 2018). Digital transformation is not only task of economy, but also the task of state. Governments should build digital averseness in the state and among citizens.

84
Based on EU research Slovenia is slightly above EU average in the digital transformation.
DIGITAL TRANSFORMATION IN SLOVENIA Based on a survey conducted among Slovenian companies, current trends in digitalization in Slovenia are shown. The survey clearly shows which areas of digitalization are crucial for businesses and how businesses perceive digitalization. Changes in the strategic orientation of companies in the field of digitization are also visible. Review of companies surveyed As shown in Figure 1, 75 companies answered the survey questions in 2018 and 99 companies in 2019. Companies come from different industries. The largest number of responses came from manufacturing companies in 2018, while in 2019 the service sector was the most represented.
Figure 1: Companies surveyed by sectors
The manufacturing sector is represented by 24% of enterprises, the services sector with 48% of enterprises and the public sector with 16% of enterprises in the year 2018, while in 2019, the representation of manufacturing companies is 25%, of service companies is 42% and of public administration is 17%. There is a greater representation of companies active in the healthcare field too. Since the response to the 2019 survey is greater than in 2018 what indicates that companies are becoming more aware and engaged in digitization trends.
1%11%
8%
17%3%
24%
17%
9% 3%7%
4%
11%
10%
16%0%
20%
10%
24% 4%1%
Car industry
Other
Finance
Public sector
Agriculture
Production sector
Information technology
Service
Telco
Health
2018; n=75
2019;n=99

85
Figure 2: Size of companies
The survey was answered by large and medium-sized enterprises as can be seen in Figure 2. From this we can conclude that the survey was mainly done by companies that are actively engaged in the field of digitalization, with digitalization know how and with employees who are familiar with current trends in digitalization.
Figure 3: Proportion of companies with digital strategy
Figure 3 shows that companies are actively and comprehensively confronting trends in digitalization and in digital transformation. More than 50% of companies have a digital strategy in place. However, over 80% of businesses are actively engaged in digital transformation (Figure 4). The lower proportion of companies in 2019 compared to 2018 that are adopting digital transformation can be attributed to the fact that a larger number of smaller companies participated in the 2019 survey. Smaller companies, even if they are running digitalization, often they are not formally managing digital transformation projects.
Figure 4: Proportion of companies running digital transformation
44%
17%22%
17%
33%
22%
34%
11%
0%
10%
20%
30%
40%
50%
More than 500 200 - 500 50 - 200 Less than 50
2018
2019
52% 53%
48% 47%
40%
45%
50%
55%
2018 2019
Yes
Ne
89%81%
11%19%
0%
50%
100%
2018 2019
Yes
Ne

86
Scope of digital transformation projects and investing in digital transformation
Figure 5: Number of completed digital transformation projects
From the point of view of realized digital transformation projects, it can be concluded that companies are completing projects from previous years, so that the number of realized projects is increasing (Figure 5) from year 2018 to 2019. Companies were completed between 1 and 3 projects in 2018, while they completed between 4 and 10 projects in 2019. The trend will continue in the coming years as most companies (Figure 6) are planing to start on average two to three digitization projects over the next period (Figure 7). Investment is gradually increasing as almost half of businesses expect to see an increase in investment in digitization projects in the future (Figure 8).
Figure 6: Planning of new digitalization projects
Figure 7: Number of planed new digitalization projects
14%
48%24% 14%8%
36%46%
10%0%
20%
40%
60%
0 1-3 4-10 More than 10
2018
2019
91%
9%
90%
10%
0%
20%
40%
60%
80%
100%
Yes No
2018
2019
7% 9%
53%
11%20%
10% 10%
43%
15%23%
0%
20%
40%
60%
0 1 2-3 4-5 > 5
2018
2019

87
Figure 8: Investments in to digital projects
Digital transformation success
Figure 9: Success of digitalization projects
The success of digital transformation can be measured in terms of successful realization of projects. That means the project is realized in accordance with the content, deadlines and costs. More than half of the surveyed companies estimate that they have been successful in implementing digital projects (Figure 9). On the other hand, it turns out that as many as 60% of businesses do not measure the effects of digitization (Figure 10). Which, of course, means that they are unable to assess whether investments in digitization projects have been commercially efficient and beneficial or not.
Figure 10: How many companies have measured success of digitalization
Among companies that measured the effects of implemented projects, two thirds (Figure 11) perceive positive effects on increasing employee productivity. This shows that companies are investing in the optimization and digitization of internal processes. Employees engagement changes from
37%59%
4%43% 54%
3%0%
20%
40%
60%
80%
Investment increase Same level of investment
Investment decrease
2018
2019
5%53%
36% 4% 1%15%52%
30% 0% 3%0%
20%
40%
60%
Very successful
Successful Average Less successful
Not successful
2018
2019
40%
60%
Yes
No

88
routine low value added work into activities which brings greater benefits and higher financial impact to the company.
Figure 11: Employee productivity increase because of digitalization
On the revenue side, positive trends have been observed among companies that measure transformation efficiency. Two-thirds of companies were unable to estimate the impact of the digital transformation on revenue in 2018. Understanding of digitalization on revenue increased in 2019, when only one-third companies were unable to estimate the financial impact (Figure 12). As many as one-third of businesses reported that the digital transformation increased in revenue of more than 10% compared to not implementing digitalization. The survey shows that the effects of digital projects that have taken place over the past years are beginning to show. Companies are becoming more aware of these effects.
Figure 12: Digital transformation revenue increase
A key motivation for digital transformation
When we are looking at the key motivations for digital transformation, we can conclude that companies are forcing two objective factors into transformation. The first objective is internal work optimization. It does not necessarily mean lowering costs, but above all process optimization, automation and robotization of business processes. Technology enables businesses to completely overhaul their business processes. To the same extent as enhancing employee productivity, companies uses the technology capabilities to retain or retrieve customers through different and better user experience. They are increasingly aware that they can only achieve this with a satisfied customer whose experience is excellent. Only such customer will remain loyal. However, in hand to hand with the rapid changes in technology, new players on the market, fierce competition, innovative
1% 13% 8% 17% 8% 52%2% 19% 7% 21% 14% 36%0%
50%
100%
0-5 % 6-10 % 11-15% 16-25 % > 25 % Not measured
2018
11% 7% 5% 5% 5%
67%
2%19% 7% 21% 14%
36%
0%
100%
0-2 % 3-5 % 6-10 % 11-15 % > 15 % Not measured
2018 2019

89
companies they are being forced to adapt quickly and find new business and technological solutions. New and fast-changing business models are getting more and more important factor in digital transformation. Many companies are aware of this. Technology as such drives modern business and companies are building new business models by using technology solutions (Figure 13). It is very important to carefully observe a competition, follow technology trends, technology capability and act fast. Employees know how, understanding the technology and business in the same time is crucial for doing the right things in the right time. Decisions makers have to decide smart between many available technical solutions on the market. Not each and every technology would fits for every organization.
When setting guidelines for building a digital strategy, companies receive information from various sources. The survey says (Figure 14) that knowledge of technologies and the knowhow of employees is an important factor for setting goals in digital content. They also obtain frequent information through external consultants who are familiar with trends on the market, with technology and industry trends. Only when they understand the client needs, technology capabilities, completion and industry trends, they can make smart decision regarding digital transformation.
Figure 13: Goals as result of digital transformation
Figure 14: Influential elements on the implementation of digital transformation
13%47%
21%47%
16%19%
26%34%33%
29%37%
34%37%
23%27%
34%38%
0%
36%14%
28%6%
25%31%
26%11%
34%
4%0%
0%4%
9%4%
7%6%
0%
0%0%
5%2%
2%2%
0%2%
0%
18%2%
12%4%
25%17%
7%9%
33%
0% 10% 20% 30% 40% 50% 60% 70% 80% 90% 100%
Revenue increase
Increase customer engagement
New market segments
Lower operating costs
Other (more user‐friendly public…
Very important Important Neutral
Less important Not important Not relevant
27%21%
11%20%
33%
45%34%
23%54%
0%
18%30%
38%20%
67%
6%13%
17%2%
0%
4%2%
11%4%0%
0% 20% 40% 60% 80% 100%
TechnologyExploring customer expectations
Business analysis by external expertsEducating employees about…
Other (external consulting, company…
Very important Important Average Less important Not important

90
Impact on business and technical areas with digitization
Digital transformation is changing business processes, employee work, business models and customer relationships (Figure 15) mostly. This is in line with the goals that companies set when starting digitalization. Digitization has a significant impact on technology (Figure 16). Business process changes, a different way of working, a different user experience and finally a changed business model are realized through technologies. Key changes results mainly in the changed business systems (as ERP, Core systems and other business software). Implementation of the new technology is resulting in a changed way of working of employees, transparency of business processes, introducing and changing mobile technologies. All the changes are influencing in the user experience, where internal work force should optimize the way of operational work. On the other hand customers shall receive superb customer experience. Digitalization is closely connected to investing in information security. Driver for investing in information / cyber security is on the one hand the legislation (for example GDPR) and on the other hand increasing cyber threats, which can cause significant damage to the company in the worst case.
Figure 15: Business segments of the business that are being transformed by
digital transformation
100%98%
88%77%
54%67%
88%88%
61%
2%12%
23%46%
33%12%12%
39%
0% 20% 40% 60% 80% 100%
Process digitization
Transparency of operations
Customer engagement in business
The transition from physical to…
Digital globalization
Yes
Ne

91
Figure 16: Technical areas which are influenced by digitalization
The organizational aspect of digital transformation Decision makers play a key role in introducing new technologies and new processes. The survey (Figure 17) shows that in the companies a key role in the decision-making process play the CEO (Chief Executive Officer) or the CIO (Chief Information Officer) / CTO (Chief Technology Officer). The Chief Digital Officer (CDO), a function that businesses have implemented in recent years to support digitization, has no direct decision-making role in digital transformation projects.
Figure 17: Leading decision makers on digital transformation in business
Key success factors for digital transformation Key success factors for digital transformation (Figure 18) are, above all, management support, available resources and a changed corporate culture. In addition to these factors, knowledge of digital strategy and good collaboration between departments are also important.
33%
23%
27%
47%
17%
16%
11%
50%
39%
27%
35%
45%
37%
32%
32%
0%
18%
31%
29%
6%
21%
14%
32%
50%
8%
13%
8%
0%
15%
16%
11%
0%
2%
6%
2%
2%
10%
22%
14%
0%
0% 20% 40% 60% 80% 100%
Security
Identity Management
Mobility
Business applications
Computer cloud
Internet (IoT)
Partner ecosystem
Other (existing technology tax)
Very important Important Average Less important Not important
5%
41% 41%
5% 1% 2% 5%2%
33%
56%
0% 2% 0%8%
0%
10%
20%
30%
40%
50%
60%
CDO (chief digital officer)
CEO CIO/CTO CMO CXO (chief experience
officer)
CINO (chief
innovation officer)
Drugo
2018 2019

92
Figure 18: Key success factors for implementation of digital strategy
Since one of the key success factor in the digitalization is the changing culture of the company, there is important that employees are aware of digitalization and they accept changes and consequences because of it. This is also evident in Figure 19, which shows that support for digitalization in companies is high, which means that employees understand digital transformation.
Figure 19: Internal support to digitalization
Businesses estimate that the biggest risk of digitalization process can be poor performance of the company. Investments in digitization might be reduced or discontinued in that case. Businesses would be forced to focus primarily on day-to-day operations. The lack of relevant skills in the company can be a big problem. In that case the company would face an inadequate staffing or the departure of key personnel with knowhow of the modern technologies and processes. The risk is also in a change of management, because new management may discontinue digitalization and change the priorities.
52%
47%
45%
31%
31%
30%
15%
13%
24%
31%
35%
47%
49%
30%
49%
35%
18%
16%
16%
18%
16%
28%
21%
32%
0%
4%
2%
0%
2%
4%
11%
9%
6%2%2%4%2%
8%4%
11%
0% 20% 40% 60% 80% 100%
Management support
Providing resources (people,…
Changing company culture
Collaboration between departments
Understanding digital strategy
Understanding customer needs
Risk management
Lack of data
Very important Important Average Less important Not important
55%40%
5%
64%
33% 3%0%
20%
40%
60%
80%
Employees supporting digitalization
Employees neutral Employees not supporting
digitalization
2018
2019

93
Figure 20: What would jeopardize digital transformation
Overall assessment of digital transformation
As shown on Figure 21, companies are evaluating the success of digital transformation as expected and planned. Only few companies consider digitization to be more successful than expected. 23% of the companies are not satisfied with the results of digitalization. This can be attributed that companies has too high expectations or they are unable to eliminate the risks that arise in digital transformation.
Figure 21: General results of digitalization
CONCLUSION Digital is the way of living. Information is highest value asset. Understanding how to use information and technology in todays “digital” world might be challenge for companies. It is not a question to digitalize or not anymore. It became obligatory. It is a matter of survival. Companies which has highest understanding of digitalization will adopt faster and they will have higher opportunity to survive in the new economy. As we see from the survey, digital transformation is the process, which touches all aspects of the company. It starts with changing the culture, employee awareness, organizational set up and continues with changing and
27%20%
15% 15% 15% 5% 3%15%
34%
7% 5% 10% 7%22%
0%5%
10%15%20%25%30%35%40%
2018 2019
3%
75%
23%
0%
50%
100%
Better than expected As expected Worse than expected

94
optimizing internal processes. At the end, customer is moved to the front and companies trying to provide the customer perfect service. We can conclude, that most of the Slovenian economy is in the process of digital transformation. Who will be the winner and who will survive or die it will be seen in the following years.
REFERENCES
Laurent Probst, Virginie Lefebvre, Christian Martinez-Diaz (Eds.) (2018). EU businesses go digital: Opportunities, outcomes and uptake. Publications Office of the European Union.
KPMG International Cooperative (2017). Destination (un)known. Key steps to guide your digital transformation journey. https://home.kpmg/content/dam/kpmg/uk/pdf/2017/09/digital_transformation_guide_2017.pdf