abstract - quotient adhd system · follow-up studies are needed to determine the time to optimal...
TRANSCRIPT

Utility of Objective Measures of Activity and Analysis of Attention State in the Assessment of Therapeutic Response to Medications in Patients with ADHD: Community Care PerspectiveHenry Hasson, MD.
Albert Einstein College of Medicine of Yeshiva University, Brooklyn, NY
Objective: The NIMH Multimodal Treatment of ADHD Study (MTA) of 579 children with ADHD showed routine community care rendered only about 25% of these patients symptom free. This study is to determine the utility of objective measures of hyperactivity, impulsivity and inattention in a community care setting to achieve optimal therapeutic response to ADHD medications rapidly.
Methods: Patients age 6 to 12 years old were evaluated by a board certified child neurologist. Patients with an established diagnosis of ADHD and new patients suspected of having ADHD were tested using the Quotient® ADHD System, a 15-minute computer-based test that combines 6 measures of micro-motion with 13 results from an attention task. Patients meeting the DSM-IV criteria for ADHD were treated and re-assessed in 1-2 weeks.
Results: Thirty-five children with at least 2 Quotient ADHD Tests were included in this series, including 8 children who were on medication for Test #1. 16 (45.7%) achieved normalized motion and attention metrics at the time of the second assessment; 6 (17.1%) achieved normalized motion control, but excessive inattention remained; 4 (11.4%) achieved normalized attention, but excessive hyperactivity remained; and 9 (25.7%) had excessive hyperactivity and inattention. 5 of the 15 patients with normalized motion and attention scores at the time of the second test, were previously treated, but not well controlled at baseline.
Conclusions: It is feasible and practical to implement an objective measurement of hyperactivity and analysis of shifts in attention state using the Quotient ADHD Test in a community care setting. Follow-up studies are needed to determine the time to optimal medication management compared to rating scales, and the impact on compliance, adherence and patient satisfaction.
ADHD Assessment Protocol• History, physical exam, clinical interview of patient, parent interview• Objective, quantitative assessment with the Quotient System
Abstract
Poster Presentation October 27-29, 2011 Savannah, Georgia (CS-29)
Methods
Older Adolescent/Adult Test:3 targets, 1 non-target, 20 min.
Child Test: 1 target, 1 non-target15 min. age 6-12, 20 min. ages 13-14Quotient System: Kiosk
Motion Tracking System
Quotient System: Portable
Reflector
Motion Tracking System

Motion Analysis Attention Analysis Attention State Analysis Scaled Scores & Global Score
The Quotient® ADHD Test Report
Results
Patients were classified into sub-groups according to the Scaled Scores for each test in order to compare baseline results with subsequent results. A Scaled Score >5 was defined as dyscontrol and <5 was defined as normalized. Examples:Test 1:
■ Medicated (N=8): 4 children had motion and attention dyscontrol, 1 had motion dyscontrol but normal attention, 3 were normalized. ■ Not Medicated: 20 children had attention and motion dyscontrol, 4 had motion dyscontrol only, 2 had attention dyscontrol only, 1 was
normalized.Test #2 was 13.1 days (on average) after test 1.
■ Medicated (N=8): 3 children had motion and attention dyscontrol, 5 were normalized. ■ Not Medicated: For the 20 children had attention and motion dyscontrol, 6 had motion and attention dyscontrol, 4 had motion
dyscontrol only, 5 had attention deficit only and 5 were normalized. 4 had motion dyscontrol only, 2 had attention dyscontrol only, 1 was normalized.
Total Boys Girls
Number 35 24 11
Mean Age at Test 1 9.1 9.2 8.9
Range 6.0-12.8 6.2-12.8 6.0-12.6
Baseline Category
Avg. time between
tests Medicated
Motion & Attention Dyscontrol
Motion Dyscontrol
Only
Attention Dyscontrol
Only
Motion & Attention in
ref. range
Test 1 8 20 4 2 1
Motion and Attention 4 20
Motion Only 1 4
Attention Only 0 2
Normalized 3 1
Test 2 13.1 days 8 20 4 2 1
Motion and Attention 3 6 0 0 0
Motion Only 0 4 1 0 0
Attention Only 0 5 3 0 0
Normalized 5 5 0 2 1
Test 3 28.8 days 2 13 0 0 0
Motion and Attention 0 4 0 0 0
Motion Only 0 1 0 0 0
Attention Only 0 1 0 0 0
Normalized 2 7 0 0 0
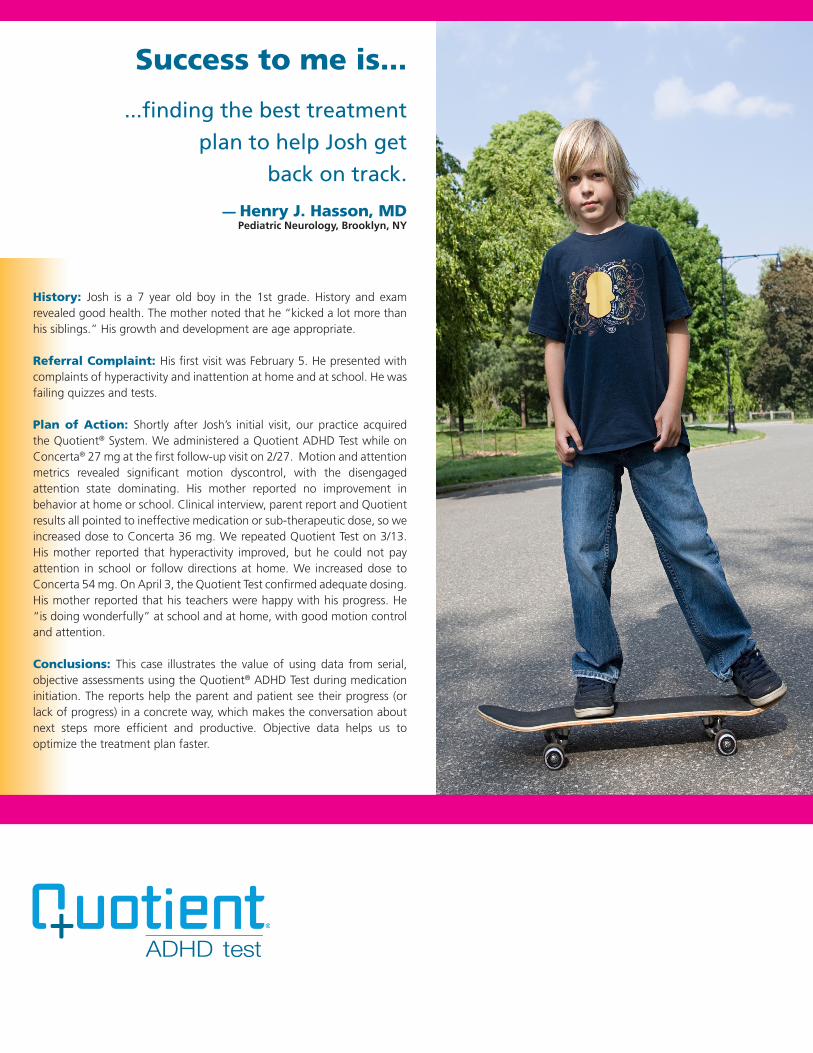
Success to me is...
...finding the best treatment
plan to help Josh get
back on track.
— Henry J. Hasson, MDPediatric Neurology, Brooklyn, NY
History: Josh is a 7 year old boy in the 1st grade. History and exam revealed good health. The mother noted that he “kicked a lot more than his siblings.” His growth and development are age appropriate.
Referral Complaint: His first visit was February 5. He presented with complaints of hyperactivity and inattention at home and at school. He was failing quizzes and tests.
Plan of Action: Shortly after Josh’s initial visit, our practice acquired the Quotient® System. We administered a Quotient ADHD Test while on Concerta® 27 mg at the first follow-up visit on 2/27. Motion and attention metrics revealed significant motion dyscontrol, with the disengaged attention state dominating. His mother reported no improvement in behavior at home or school. Clinical interview, parent report and Quotient results all pointed to ineffective medication or sub-therapeutic dose, so we increased dose to Concerta 36 mg. We repeated Quotient Test on 3/13. His mother reported that hyperactivity improved, but he could not pay attention in school or follow directions at home. We increased dose to Concerta 54 mg. On April 3, the Quotient Test confirmed adequate dosing. His mother reported that his teachers were happy with his progress. He “is doing wonderfully” at school and at home, with good motion control and attention.
Conclusions: This case illustrates the value of using data from serial, objective assessments using the Quotient® ADHD Test during medication initiation. The reports help the parent and patient see their progress (or lack of progress) in a concrete way, which makes the conversation about next steps more efficient and productive. Objective data helps us to optimize the treatment plan faster.

Test #1 Test #2 Test #3
Ref. Range Results %ile Results %ile Results %ile
Accuracy 61.8-90.2% 58.4% 11t 60.9% 15t 87.1% 76
Omission errors 1.3-18.3% 43.1% 2t 36.5% 3t 3.0% 61
Commission errors
15.6-58.2% 40.0% 43 41.7% 40 22.7% 70
Latency 436-634 ms 692 ms 94 459 ms 20 525 ms 45
Variability 131-238 ms 447 ms 1t 340 ms 2t 157 ms 63
COV 25-48 65 4t 74 2t 30 57
Attention Analysis
Motion Analysis
Test #1 Test #2 Test #3
Ref. Range Results %ile Results %ile Results %ile
Immobility Duration
49-152 ms 94 ms 60 131 ms 78 269 ms 95
Movements 1965-5767 3353 53 2333 74 1324 91
Displacement 2.5-10.7 m 6.12 m 45 3.52 m 67 1.81 m 91
Area 51-354 cm2 246 cm2 28 118 cm2 52 81 cm2 67
Spatial Complexity
1.041-1.130 1.052 32 1.093 72 1.129 83
Temporal Scaling
0.563-1.244 0.687 60 0.614 80 0.420 94
Two of six motion results at baseline were less than the 35th percentile, which may be clinically significant. Results improved in Test #2 with all metrics above the 50th percentile. Results improved further in Test #3.
Josh, Age 7
Incorrect responses
Correct responses
2+ sec2 sec
1 sec
Attention State Analysis for 30 Second Segments
2+ sec2 sec
1 sec
Test #1 Test #2 Test #3
Ref. Range Results %ile Results %ile Results %ile
# Shifts 10 - 18 15 48 13 70 13 70
Attentive 0.0 - 60.0% 0.0% 1t 0.0% 1t 43.3% 70
Impulsive 13.3-63.3% 13.3% 90 16.7% 84 46.7% 39
Distracted 0.0 - 23.3% 26.7% 14t 23.3% 17 6.7% 56
Disengaged
Random 0.0 - 43.3% 26.7% 30 33.3% 22 3.3% 75
Minimal 0.0 - 6.7% 33.3% 2t 26.7% 2t 0.0% 99
Contrary 0.0 - 3.3% 0.0% 99 0.0% 99 0.0% 99
Metrics were within the reference range. Graphics reveal that performance deteriorated.
Test #1: Accuracy, omission errors, variability and COV were <16th percentile at Test #1. The latency score (692 ms) was just outside the reference range and slow for his age group. These results suggest that the medication is at a sub-therapeutic dose. Test #2: With the exception of commission errors and latency, the attention metrics are still more than 1 standard deviation from the mean.Test #3: All metrics are well within the reference range.
The first two tests, there were 2 parameters <16th percentile and 2 between the 17th and 35th percentile. He had good performance in Test #3.
5 minutes 10 minutes 15 minutes
Head Motion
5 minutes 10 minutes 15 minutes
5 minutes 10 minutes 15 minutes
ATTENTIVE
IMPULSIVE
DISTRACTED
DISENGAGED
SUMMARY
Many omission and commission errors throughout the test, with more omission errors at end of the test. Slow and variable responses.
Attention State Summary
Distracted and disengaged attention states dominate the test. What else might cause this?
Test #1, 2/27Concerta® 27 mg, 2 hours post-dose

Res
po
nse
Res
ult
sM
oti
on
Res
ult
sA
tten
tio
n S
tate
Res
ult
s
Test #2, 3/13Concerta® 36 mg, 2 hours post-dose
Motion Scaled Score improved, but is above the mean for subjects without ADHD (4.0).
Test #3 4/3Concerta® 54 mg, 5 hours post-dose
Attention State Analysis for 30 Second Segments Attention State Analysis for 30 Second Segments
Correct responses
Motion control is good for a 7 year old (high percentile scores, tight motion pattern throughout.)
2+ sec2 sec
1 sec
2+ sec2 sec
1 sec
2+ sec2 sec
1 sec
2+ sec2 sec
1 sec
Head Motion Head Motion
5 minutes 10 minutes 15 minutes 5 minutes 10 minutes 15 minutes
5 minutes 10 minutes 15 minutes 5 minutes 10 minutes 15 minutes
5 minutes 10 minutes 15 minutes 5 minutes 10 minutes 15 minutes
ATTENTIVE
IMPULSIVE
DISTRACTED
DISENGAGED
SUMMARY
ATTENTIVE
IMPULSIVE
DISTRACTED
DISENGAGED
SUMMARY
Many omission errors at the beginning and end of the test. Slow/variable correct responses.
Omission errors reduced. Many commission errors. Improved accuracy from 3-12 minutes.
Distracted and disengaged attention states dominate the test. Medication is sub-therapeutic.
Much better on-task behavior (43.3%, 70th %ile). Room for improvement.
Correct responses
Incorrect responses Incorrect responses

© Copyright 2011 F8060 (2011/12/26)Quotient is a registered trademark of BioBehavioral Diagnostics Company. Concerta is a registered trademark of McNeil Pharmaceuticals.
Quotient® ADHD Composite Scores
System Index Key
Unlikely Possible Probable Likely
Scaled Scores Key
0.00-2.50 2.51-5.00 5.01-7.50 7.51-10.00
mean mean non-ADHD=4 ADHD=7
Test #1 Test #2 Test #3
Test Date 2/27/2011 3/13/2011 4/3/2011
Age 6.89 6.93 6.99
MedicationConcerta®
27 mgConcerta®
36 mgConcerta®
54 mg
System Index Likely Likely Unlikely
Scaled Scores
Motion 7.67 5.26 3.58
Attention 9.88 9.75 4.77
Global 8.78 7.50 4.18
877.246.2397 www.BioBDx.com
1- AAP ADHD Clinical Practice Guideline. Pediatrics, 2011 128(5). 2- AACAP Practice Parameter. J. Am. Acad. Child Adoles. Psychiatry, 2007 46(7). 3- Data on file. 4- Teicher, J of Child and Adol. Psychopharmacology, 2003 13(1).
Case SummaryFebruary 5: This boy was a new patient.
■ Presented with complaints of hyperactivity and inattention at home and at school. He was failing quizzes and tests. ■ Started Concerta 27 mg
February 27: ■ The first Quotient ADHD Test was administered 3 weeks later while on medication. ■ Motion and attention metrics revealed significant motion dyscontrol, with Disengaged attention state dominating. Mother
reported no improvement in behavior at home or school. ■ Clinical interview, parent report and Quotient results pointed to ineffective or sub-therapeutic medication. ■ Increased dose to Concerta 36 mg.
March 13: ■ Repeated Quotient Test. ■ Mother reported that hyperactivity improved, but he still cannot pay attention in school or follow directions at home. ■ Increased dose to Concerta 54 mg.
April 3: ■ Quotient Test confirmed adequate dosing. ■ Mother reported that his teachers were happy with his progress. He “is doing wonderfully” at school and at home, with
good motion control and attention.

We re-started Focalin XR 15 mg and repeated the Quotient assessment on March 14. He had excellent motion control, but still some inattention at school. Inattention was worse at the end of the day, which suggested that the medication may be wearing off too early. We switched to Concerta 54 mg to cover late afternoon.
At Scott’s back-to-school visit on October 2, the Quotient Test confirmed adequate dosing. He returned to school in September taking his medication. Although I was unaware of it at the time, because he had a new teacher, the parents decided to try a “no medication experiment.” The teacher immediately saw a difference in behavior and called the parents to report the problems.
Conclusions: This case illustrates the value of using data from serial, objective assessments using the Quotient® ADHD Test to inform medical management of the patient and help to achieve better clinical efficacy. We can confirm suspicions of medication wearing off and adjust by adding a dose later in the day or by changing to a longer acting medication, as we decided for Scott.
Success to me is...
...finding medication
to help Scott
focus
after school.
— Henry J. Hasson, MDPediatric Neurology, Brooklyn, NY
History: Scott is a 12 year old boy in the 7th grade. He has been a patient since July 2010 when I made a diagnosis of ADHD.
Referral Complaint: Scott was doing fairly well on 15 mg Focalin® XR, but his mother noticed that he became distracted late in the afternoon and had trouble finishing homework.
Plan of Action: We asked Scott to refrain from taking his medication on the day of his next visit so we could do a baseline Quotient® ADHD Test. A baseline test on a new patient gives us quantitative severity measures in each symptom domain and serves as a benchmark to guide decision-making about patient management. The baseline test is also valuable for established patients to determine if deficits are severe enough to continue medication. Scott’s baseline test showed good motion control in the first five minutes, but performance degraded progressively. The mean motion metrics were all at the low end of the reference range. There were 21 attention shifts. Distraction and disengagement were the predominant attention states at the end of the test.

Baseline Test #2 Test #3
Ref. Range Results %ile Results %ile Results %ile
Accuracy 72.4-95.8% 79.3% 26 92.4% 66 94.9% 81
Omission errors 0.4-13.8% 15.2% 15t 5.3% 32 2.2% 48
Commission errors
7.7-45.7% 25.7% 36 9.7% 77 8.1% 81
Latency 366-532 ms 486 ms 69 517 ms 80 499 ms 76
Variability 88-183 ms 164 ms 24 122 ms 49 95 ms 70
COV 20-39 33 26 23 67 19 86
Attention Analysis
Motion Analysis
Baseline Test #2 Test #3
Ref. Range Results %ile Results %ile Results %ile
Immobility Duration
98-324 ms 146 ms 43 575 ms 97 418 ms 91
Movements 906 - 3013 2649 22 525 98 718 91
Displacement 1.18-4.42 m 3.59 m 25 0.57 m 99 0.78 m 94
Area 23-118 cm2 91 cm2 34 10 cm2 98 11 cm2 96
Spatial Complexity
1.099-1.317 1.147 38 1.442 94 1.413 91
Temporal Scaling
0.355-0.801 0.726 25 0.131 97 0.265 91
Four of six motion results at baseline were less than the 35th percentile, which may be clinically significant. The age/gender matched percentile scores improved to >90th percentile in Test #2 and Test #3.
Scott, Age 12, Grade 7
2+ sec2 sec
1 sec
Attention State Analysis for 30 Second Segments
2+ sec2 sec
1 sec
Baseline Test #2 Test #3
Ref. Range Results %ile Results %ile Results %ile
# Shifts 5 - 18 21 7t 16 34 3 92
Attentive 10.0-90.0% 26.7% 28 66.7% 61 90.0% 83
Impulsive 6.7 - 53.3% 40.0% 35 16.7% 69 10.0% 79
Distracted 0.0 - 15.0% 20.0% 11t 16.7% 16t 6.7% 56
Disengaged
Random 0.0 - 20.0% 6.7% 34 0.0% 99 0.0% 99
Minimal 0.0 - 3.3% 6.7% 12t 0.0% 99 0.0% 99
Contrary 0.0 - 0.0% 0.0% 99 0.0% 99 0.0% 99
Metrics were at the low end of the reference range. Area increased over time.
Test #1: Omission errors were <16th percentile at Test #1. Test #2: Attention metrics improved, but the graphic reveals that the number of omission errors increased at in the last 5 minutes of the test.Test #3: All metrics are within the reference range.
In Test #1, there were many attention state shifts (21, 7th percentile) and the percentage of time in the Attentive state was low (26.7%, 28th percentile. Metrics improved in Test #2 and was excellent in Test #3.
5 minutes 10 minutes 15 minutes
Head Motion
5 minutes 10 minutes 15 minutes
5 minutes 10 minutes 15 minutes
Appropriately attentive responses in the first 5 minutes, with some commission errors. Latency and omission errors increase at end.
Attention State Summary
The Impulsive state results from many commission errors. The patient was Distracted/Disengaged for most of the last 5 minutes.
Test #1, 3/6No medication
Incorrect responses
Correct responses
ATTENTIVE
IMPULSIVE
DISTRACTED
DISENGAGED
SUMMARY

Res
po
nse
Res
ult
sM
oti
on
Res
ult
sA
tten
tio
n S
tate
Res
ult
s
Test #2, 3/14Focalin® XR 15 mg, 4 hrs post-dose
Excellent motion control.
Test #3, 10/2Concerta® 54 mg, 1.5 hrs post-dose
Attention State Analysis for 30 Second Segments Attention State Analysis for 30 Second Segments
Correct responses
Excellent motion control.
2+ sec2 sec
1 sec
2+ sec2 sec
1 sec
2+ sec2 sec
1 sec
2+ sec2 sec
1 sec
Head Motion Head Motion
5 minutes 10 minutes 15 minutes 5 minutes 10 minutes 15 minutes
5 minutes 10 minutes 15 minutes 5 minutes 10 minutes 15 minutes
5 minutes 10 minutes 15 minutes 5 minutes 10 minutes 15 minutes
Improved attentive behavior, with omission errors at the low end of the reference range for age/gender.
Very good attentive behavior.
16 ttention state shifts is a pattern consistent with ADHD. Distracted state is at the 16th %ile for a 12 year-old boy.
Very good Attentive behavior.
Correct responses
Incorrect responses Incorrect responses
ATTENTIVE
IMPULSIVE
DISTRACTED
DISENGAGED
SUMMARY
ATTENTIVE
IMPULSIVE
DISTRACTED
DISENGAGED
SUMMARY

© Copyright 2012 F8074 (2012/04/05)
Quotient is a registered trademark of BioBehavioral Diagnostics Company. Focalin is a registered trademark of Novartis Pharmaceuticals. Concerta is a registered trademark of McNeil Pharmaceuticals.
Quotient® ADHD Composite Scores
System Index Key
Unlikely Possible Probable Likely
Scaled Scores Key
0.00-2.50 2.51-5.00 5.01-7.50 7.51-10.00
mean mean non-ADHD=4 ADHD=7
Test #1 Test #2 Test #3
Test Date 3/6/2011 3/14/2011 10/2/2011
Age 12.84 12.91 12.97
Medication NoneFocalin® XR
15 mgConcerta®
54 mg
System Index Likely Unlikely Unlikely
Scaled Scores
Motion 5.51 2.03 2.30
Attention 8.20 6.10 3.74
Global 6.85 4.07 3.02
877.246.2397 www.BioBDx.com
Case SummaryThis boy has been in the practice since July. He was stable on Focalin XR 15 mg. Teacher and parent reports were positive.
March 6: ■ A baseline Quotient ADHD test was administered without medication. ■ Mother wanted to confirm that medication was still needed. ■ The motion pattern showed good control in the first five minutes with progressive degradation.
The mean motion metrics were all at the low end of the reference range. ■ There were 21 attention shifts. Distraction and Disengagement were the predominant attention
states at the end of the test. ■ We re-started Focalin XR 15 mg.
March 14: Repeated Quotient Test. ■ Excellent motion control, but still some inattention at school. ■ Inattention was worse at the end of the day, which indicated that the medication may be
wearing off early. ■ Switched medication to Concerta 54 mg to cover late afternoon.
October 2: Quotient Test confirmed adequate dosing. ■ The boy returned to school taking his medication. Because he had a new teacher, the parents
decided to try a “no medication experiment.” The teacher immediately saw a difference in behavior and called the parents to report the problems.
Conclusions ■ Objective testing reduced time to medication optimization from approximately 3-6 months to 4-8 weeks ■ Baseline testing off medication quantifies the severity of deficit and makes the conversation with the parent
and patient more efficient and productive. ■ Reassessments at 1-2 week intervals during medication initiation helps to guide treatment decisions and can
help to achieve optimal dosing faster. ■ Repeat tests inform decisions when considering changing medication or adjusting dose. ■ Back-to-school assessments confirm that medication is still needed to control symptoms.