acceptance threshold: a bidimensional research method for
TRANSCRIPT

Hindawi Publishing CorporationInternational Journal of Digital Multimedia BroadcastingVolume 2008, Article ID 712380, 20 pagesdoi:10.1155/2008/712380
Research ArticleAcceptance Threshold: A Bidimensional Research Method forUser-Oriented Quality Evaluation Studies
S. Jumisko-Pyykko,1 V. K. Malamal Vadakital,2 and M. M. Hannuksela2
1 Tampere University of Technology, Human-Centered Technology, P.O. Box 553, 33101 Tampere, Finland2 Nokia Research Center, P.O. Box 1000, 33721 Tampere, Finland
Correspondence should be addressed to S. Jumisko-Pyykko, [email protected]
Received 5 March 2008; Accepted 17 July 2008
Recommended by Harald Kosch
Subjective quality evaluation is widely used to optimize system performance as a part of end-products. It is often desirable toknow whether a certain system performance is acceptable, that is, whether the system reaches the minimum level to satisfyuser expectations and needs. The goal of this paper is to examine research methods for assessing overall acceptance of qualityin subjective quality evaluation methods. We conducted three experiments to develop our methodology and test its validityunder heterogeneous stimuli in the context of mobile television. The first experiment examined the possibilities of using asimplified continuous assessment method for assessing overall acceptability. The second experiment explored the boundarybetween acceptable and unacceptable quality when the stimuli had clearly detectable differences. The third experiment comparedthe perceived quality impacts of small differences between the stimuli close to the threshold of acceptability. On the basis of ourresults, we recommend using a bidimensional retrospective measure combining acceptance and satisfaction in consumer-/user-oriented quality evaluation experiments.
Copyright © 2008 S. Jumisko-Pyykko et al. This is an open access article distributed under the Creative Commons AttributionLicense, which permits unrestricted use, distribution, and reproduction in any medium, provided the original work is properlycited.
1. INTRODUCTION
Consumer acceptance is a critical factor in the adoption ofnew mobile multimedia products and services. Acceptanceis defined as the minimum level of user requirementsthat fulfills user expectations and needs as a part of userexperience [1, 2]. User experience as a broad concept refersto a consequence of user’s internal state, characteristics ofdesigned system, and the context within interaction occurs[3]. Modern mobile services are collective results of severalproduct elements and combine the effort of several players ina field from content owners, producers, and service providersto platform developers [4]. In the product developmentprocess, the quality of critical components is adjusted oroptimized separately from the end-product or prior to thecompletion of the end-product. For example, in streamedmobile multimedia, the quality of network connection mayrepresent one of these elements. To ensure that qualitiesof components developed in isolation are not barriers tothe adoption of end-products, their acceptability should bestudied in their optimization process.
In the development of signal or system quality as prod-uct components, subjective quality evaluation experimentsare conducted. Subjective quality evaluation, also calledperceptual, affective, or experienced quality evaluation, oreven more broadly referred to as sensorial studies, is basedon human judgments of various aspects of experiencedmaterial based on perceptual processes [5–7]. For theconsumer-oriented critical product component assessment,an overall quality evaluation approach is appropriate. It issuitable for the evaluation of multimodal and heterogeneousstimuli [5, 7], and also assumes that human knowledge,expectations, emotions, and attitudes are integrated intoquality perception [5, 7]. The overall evaluation approachhas been applied in subjective quality evaluations of mobiletelevision to study different codecs, audio-video compressionparameters such as frame rates, bitrates, and screen sizes [8–10].
Subjective overall quality is mainly measured as anaffective degree-of-liking, whereas only little attention hasbeen paid to acceptance of quality. Subjective quality isusually measured as one-dimensional satisfaction based on

2 International Journal of Digital Multimedia Broadcasting
the methodological recommendations of the InternationalTelecommunication Union [11]. Recently, the Quality ofPerception (QoP) model has been proposed to combine twodimensions, namely, satisfaction and cognitive informationassimilation, into one measure of subjective quality [12, 13].However, these methods have not paid any attention toacceptance of quality. There are only few studies in whichmeasures of acceptance have been reported [14]. However,no extensive theoretical background has been presented.Furthermore, these methods are applicable only when thequality is close to the acceptance threshold, and are notdiscriminative above or below the acceptance threshold, thatis, the methods cannot be applied for the comparison ofgood qualities. These approaches necessitate changing thedata-collection method for the duration of quality evolution.In sum, there is a clear need to develop an overall qualityevaluation method of acceptance to ensure fulfillment of userminimum quality requirements in quality optimization andto provide comparability between studies independently oflevels of quality under continuous technical development.
The aim of this paper is to develop research methodsfor assessing overall acceptance of quality. We present aliterature review of acceptability and research methods asa basis for development in Sections 2 and 3. We conductthree experiments to develop and test validity under het-erogeneous stimuli in the context of mobile television. Thefirst experiment examines the possibilities of using a sim-plified continuous assessment method for assessing overallacceptability. The second experiment explores the perceivedboundary between acceptable and unacceptable quality infour error rates having clearly detectable differences betweenstimuli. The third experiment compares the impacts offour different error control methods on perceived qualityclose to the threshold of acceptability with small differencesbetween the stimuli. Finally, we present a discussion on allthe experiments, provide recommendations for use of themethods, and conclude the study in Section 7.
2. MULTIMEDIA QUALITY
Multimedia quality is a combination of produced and per-ceived quality. Produced quality describes the technicalfactors of multimedia which can be categorized into threedifferent abstraction levels, called network, media, andcontent [15, 16]. Perceived quality represents user’s orconsumer’s side of multimedia quality, which is characterizedby active perceptual processes, including low-level sensorialand high-level cognitive processes. A typical problem inmultimedia quality studies is to optimize quality factorsproduced under strict technical constraints or resources withas little negative perceptual effects as possible.
2.1. Produced quality
Huge amounts of data, limited bandwidth, vulnerabletransmission channel, and constraints of receiving devicesset specific requirements for multimedia produced quality.Network-level quality factors describe data communicationover a network and are often characterized by loss, delay,
jitter, and bandwidth [15, 17, 18]. Network-level qualityfactors are discussed in greater detail in the subsequentparagraphs as they have a central role in this paper. Media-level issues include media coding for transport over thenetwork and rendering on receiving terminals [15]. Recentstudies on media-level quality factors have addressed thecompression capability of codecs [19, 20], temporal factorsin terms of video frame rates [13, 19], spatial resolution[9, 10], bitrates, spatial factors (e.g., monophonic or stereo-phonic sound), and temporal parameters of audio, such assampling rate [20]. Increasing interest has been expressedin the topic of audio-video factors, like skew betweenaudio and video streams [21] and shared resources betweenthe streams, like bitrates [8, 9, 19, 20], and audiovisualtransmission error control methods [22, 23]. The contentlevel quality factors concern the communication of infor-mation from content production to viewers [15]. The topicsstudied include impacts of content manipulations [24],content comparisons (e.g., [8, 10, 13]), and text size [25].High level of optimization, especially in the network andmedia levels, can cause noticeable degradation in perceivedquality.
Network-level quality factors relate closely to imperfec-tions of transmission channels. In fact, erroneous transmis-sion of data may occasionally occur in any transmissionchannel. The causes of errors depend on the transmissionchannel and its characteristics. For example, in many wired-line networks, the main causes of errors are queue overflowsat network nodes, while in a wireless network, the main causeof data corruption is due to the physical characteristics of theradio channel. Furthermore, the statistical characteristics oferrors may also vary. They may be either isolated individualerrors, burst errors, or a combination of both. Therefore, anymethods to resolve errors in a transmission channel musttake into consideration the cause of error as well as the natureof error that corrupts the data.
In wireless channels, the radio channel properties, suchas interference from other cochannel signals, multipathpropagation due to signal reflection from different natural,and man-made structures in the vicinity of the receivers,together with fading are the major causes of errors. If thereceiver is a mobile terminal, errors may also occur due tothe Doppler effect caused by the speed of the receiver. Theseerrors typically occur as bursts rather than isolated individualerrors [26, 27]. The nature, frequency, and duration of errorsmay vary regardless of the cause of errors.
Broadcast services typically fix transmission errors withforward error correction (FEC) coding, such as Reed-Solomon FEC codes [28]. FEC repair symbols are appendedto the actual data such that when errors are encountered,the combination of the data and the FEC repair symbolscan be used to obtain the correct data. The correctioncapability of FEC codes is limited, however, and oncethe number of transmission errors exceeds the correctioncapability of the FEC code, typically no lost data can berecovered. Consequently, the use of FEC codes causes anabrupt threshold between produced quality free of network-level errors and severely impaired quality due to transmissionerrors.
S. Jumisko-Pyykko et al. 3
Maximumperceived
Minimumaccepted
Preferencesatisfaction
Producedquality
High(error free)
Low(extremely erroneous)
Perceived quality
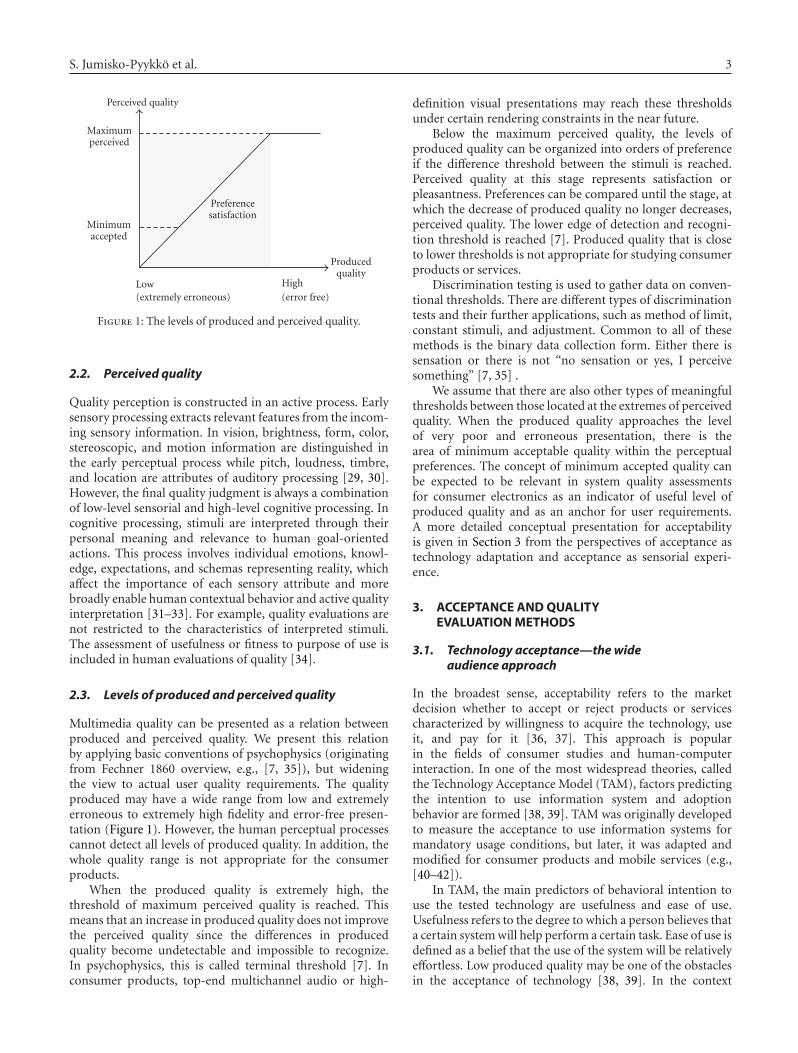
Figure 1: The levels of produced and perceived quality.
2.2. Perceived quality
Quality perception is constructed in an active process. Earlysensory processing extracts relevant features from the incom-ing sensory information. In vision, brightness, form, color,stereoscopic, and motion information are distinguished inthe early perceptual process while pitch, loudness, timbre,and location are attributes of auditory processing [29, 30].However, the final quality judgment is always a combinationof low-level sensorial and high-level cognitive processing. Incognitive processing, stimuli are interpreted through theirpersonal meaning and relevance to human goal-orientedactions. This process involves individual emotions, knowl-edge, expectations, and schemas representing reality, whichaffect the importance of each sensory attribute and morebroadly enable human contextual behavior and active qualityinterpretation [31–33]. For example, quality evaluations arenot restricted to the characteristics of interpreted stimuli.The assessment of usefulness or fitness to purpose of use isincluded in human evaluations of quality [34].
2.3. Levels of produced and perceived quality
Multimedia quality can be presented as a relation betweenproduced and perceived quality. We present this relationby applying basic conventions of psychophysics (originatingfrom Fechner 1860 overview, e.g., [7, 35]), but wideningthe view to actual user quality requirements. The qualityproduced may have a wide range from low and extremelyerroneous to extremely high fidelity and error-free presen-tation (Figure 1). However, the human perceptual processescannot detect all levels of produced quality. In addition, thewhole quality range is not appropriate for the consumerproducts.
When the produced quality is extremely high, thethreshold of maximum perceived quality is reached. Thismeans that an increase in produced quality does not improvethe perceived quality since the differences in producedquality become undetectable and impossible to recognize.In psychophysics, this is called terminal threshold [7]. Inconsumer products, top-end multichannel audio or high-
definition visual presentations may reach these thresholdsunder certain rendering constraints in the near future.
Below the maximum perceived quality, the levels ofproduced quality can be organized into orders of preferenceif the difference threshold between the stimuli is reached.Perceived quality at this stage represents satisfaction orpleasantness. Preferences can be compared until the stage, atwhich the decrease of produced quality no longer decreases,perceived quality. The lower edge of detection and recogni-tion threshold is reached [7]. Produced quality that is closeto lower thresholds is not appropriate for studying consumerproducts or services.
Discrimination testing is used to gather data on conven-tional thresholds. There are different types of discriminationtests and their further applications, such as method of limit,constant stimuli, and adjustment. Common to all of thesemethods is the binary data collection form. Either there issensation or there is not “no sensation or yes, I perceivesomething” [7, 35] .
We assume that there are also other types of meaningfulthresholds between those located at the extremes of perceivedquality. When the produced quality approaches the levelof very poor and erroneous presentation, there is thearea of minimum acceptable quality within the perceptualpreferences. The concept of minimum accepted quality canbe expected to be relevant in system quality assessmentsfor consumer electronics as an indicator of useful level ofproduced quality and as an anchor for user requirements.A more detailed conceptual presentation for acceptabilityis given in Section 3 from the perspectives of acceptance astechnology adaptation and acceptance as sensorial experi-ence.
3. ACCEPTANCE AND QUALITYEVALUATION METHODS
3.1. Technology acceptance—the wideaudience approach
In the broadest sense, acceptability refers to the marketdecision whether to accept or reject products or servicescharacterized by willingness to acquire the technology, useit, and pay for it [36, 37]. This approach is popularin the fields of consumer studies and human-computerinteraction. In one of the most widespread theories, calledthe Technology Acceptance Model (TAM), factors predictingthe intention to use information system and adoptionbehavior are formed [38, 39]. TAM was originally developedto measure the acceptance to use information systems formandatory usage conditions, but later, it was adapted andmodified for consumer products and mobile services (e.g.,[40–42]).
In TAM, the main predictors of behavioral intention touse the tested technology are usefulness and ease of use.Usefulness refers to the degree to which a person believes thata certain system will help perform a certain task. Ease of use isdefined as a belief that the use of the system will be relativelyeffortless. Low produced quality may be one of the obstaclesin the acceptance of technology [38, 39]. In the context
4 International Journal of Digital Multimedia Broadcasting
of mobile multimedia, failures of produced quality factors,such as screen size and capacity, interface characteristicsof mobile devices, wireless network coverage, as well ascapabilities and efficiency of data transform [40, 42–44],may have indirect effects on usage intentions or behaviorby affecting perceived usefulness and ease of use [38, 39].From the broad viewpoint of acceptability, subjective qualityevaluation experiments on certain techniques should ensurethat perceptually minimum accepted quality level is reachedfor the developed information systems or services to be anenabler of wide audience technology adaptation.
3.2. Quality evaluation methods
Subjective quality evaluation experiments are conductedfor signal or system development purposes. Informationabout these studies is used in the optimization of a system,like network or media parameters, or in the developmentof objective metrics. In the literature perceptual, hedonic,or experienced quality evaluation are typically used assynonyms for these measures depending on the differentemphases [5–7]. These studies are conducted in a controlledenvironment to ensure a high-level of control over thetested variables and repeatability of measures. For consumer-oriented quality evaluation, overall quality judgments areused. Evaluations of excellence of stimuli are based onhuman perceptual processes. As the evaluations are based onhuman perception of the excellence of stimuli, knowledge,expectations, emotions, and attitudes are integrated into thefinal quality perception of stimuli [5, 7]. The overall qualityevaluation can be used to evaluate heterogeneous stimulimaterial (e.g., multimedia) because it is not restricted to theassessment of a certain quality attribute, such as brightness,but rather based on a holistic view of quality [5].
There are three main approaches to evaluate subjectiveperceived overall quality which can be applied in themeasures of relatively low produced multimedia quality.A summary of the essential properties of the methodsis given in Table 1. The International TelecommunicationUnion Recommendation [11] provides a reliable researchmethod called Absolute Category Rating (ACR), whichis applicable for performance or system evaluations witha wide quality range [11]. In ACR, also known as thesingle-stimulus method, test sequences are presented oneat a time and rated independently and retrospectively. Theshort stimuli materials and mean opinion score (MOS)using labeled scales to set the evaluations into order ofpreference in ACR. One of the ultimate aims of methoddevelopment has been to create a very reliable subjectivemethod providing comparable data for the constructionof objective or instrumental multimedia quality evaluationmetrics [11]. It is maybe not surprising that the method isespecially widespread in engineering.
Quality of Perception (QoP) is a user-oriented conceptand evaluation method combining different aspects of sub-jective quality introduced by Ghinea and Thomas [12, 13].QoP is a sum of information assimilation and satisfactionformulated from dimensions of enjoyment and subjective,but content-independent objective quality (e.g., sharpness).
Information assimilation is measured with questions onaudio, video, or text in different content and in the analysisright answers are transformed into the ratio of right answersper number of questions. Both satisfaction factors areassessed on a scale 0–5. Final QoP is the sum of informationassimilation and satisfaction that sets the stimuli into orderof preference. Both ARC and QoP result in subjectiveevaluations in the form of a preference order and can beapplied in studies on low produced quality, but they are notrestricted to it. However, these methods do not indicate anythreshold of acceptance among these preferences.
McCarthy et al. [14] tackle the problem of quality accept-ability on the basis of the classic Fechner psychophysicalmethod of limit. The threshold of acceptance is achievedby gradually decreasing or increasing the intensity of thestimulus in discrete steps every 30 seconds. At the beginningof the test sequence, participants are asked if the qualityis acceptable or unacceptable. While watching, participantsevaluate quality continuously. They report the point ofacceptable quality when quality of stimuli is increasing orthe point of unacceptable quality when quality is decreasing.In the analysis, binary acceptance ratings are transformedinto a ratio calculating the proportion of time during each30-second period that quality was rated as acceptable. Theresults are expressed as acceptance percentage of time. Thismethod is powerful when studying variables around thethreshold but not those clearly below or above it [7].
The duration of stimuli differs between the three overallquality evaluation methods. The ACR recommends to useshort stimuli (10 seconds). This approach pays attentionto the constraints of the human working memory, whichis about 20 seconds in duration and has limited capacityfor units [45, 46], also, it assumes that it is possible toremember all impairments of a stimulus when assessingquality. In contrast, QoP and the method of limit use longer-lasting stimuli materials. They focus more on user and aimto maximize the ecological validity of the viewing task inthe experiments and therefore stress less about an ability toremember each of the imperfections the stimulus had [12–14]. It is also worth mentioning that the use of short-stimulimaterial might be constrained by the measured phenomena,for example, they might fit for measuring compression, butnot for transmission quality factors.
In contrast to the overall quality evaluation methodspresented, there has been interest in studying instantaneouschanges of real-time variation in quality. Originally, themethod was developed to go beyond the limitations of theworking memory and to enable the use of long material,even up to the duration of a full television program, fortesting of time-varying image quality [49–51]. In continuousassessment, participants express their quality evaluationmoving the slider on a graphical 5-point labeled MOSscale while watching the content. It has been used to assessthe excellence of video and audiovisual quality [50–52].Similarly to ACR and QoP, the acceptance threshold is hardto locate on this scale. Later, continuous monitoring has beenreported to be too demanding evaluation task, especially formultimedia quality evaluation [52]. It may also impact onthe natural strategy of human information processing [53].

S. Jumisko-Pyykko et al. 5
Table 1: Overview to overall quality evaluation methods.
Method ACR QoP Method of limit
Presentation Single stimulus, Independently Single stimulus, IndependentlyContinuous, graduallydecreasing or increasing theintensity of the stimulus
Duration of stimuli ≤10 s App. 30 s 210 s, quality changes every 30 s
Scales 5/9/11-point scales, MOSSatisfaction (0–5) EnjoymentObjective quality Informationassimilation: ratio of right answers
Binary acceptable/unacceptable
AppliedAudio-video bitrates, codecs,resolution, packet loss[8, 19, 20, 22, 23, 47]
Framerate, delay, jitter, devices,[12, 13, 17]
Framerate, quantization,audio-video bitrate, resolution,text quality, [9, 10, 14, 25, 48]
3.3. Acceptance evaluation
In most consumer-oriented quality evaluation or sensorialstudies, acceptance represented refers to affective measure-ments and represents degree of liking. These measuresare used to gather the subjective responses of potentialcustomers or users to a product, product idea, or specificproduct characteristics [35]. Typically, acceptance is mea-sured on an ordinal scale of overall preference of productor specific preference for a certain sensory attribute [35].For example, in the context of video or audiovisual qualitystudies, Apteker et al. [54] and Wijesekera et al. [55] bothused ordinal acceptance scales to study framerates whereasSteinmetz [56] studied acceptance of media synchronizationon a nominal scale (acceptable, dislike, and annoying). Whenmeasuring acceptance as a degree of liking, it lacks of thesame detail of threshold of acceptance as quality preferencesderived from ACR methods. In contrast to the preferenceapproach, there are only few studies by McCarthy et al. [14]and later Knoche et al. [9, 10, 25, 48] in which acceptance hasbeen seen as a binary phenomenon representing the natureof conventional thresholds (Table 1). Apart from these fewstudies, acceptability has not typically been measured in thequality assessment of mobile multimedia.
Recent studies have assessed preferences of low producedqualities to optimize the quality of service parameters formobile devices and networks. Most of the studies comparecompression parameters, like low framerates, bitrates oraudio-video bitrate share, modern codecs, small displaysize, and their interactions [8, 10, 19, 20, 57]. Impacts oftransmission errors on perceived quality is less reported[58]or the studies focus on one media at a time [59, 60].Independently of the source of impairments in producedquality, some of these studies compare extremely poorqualities [8, 9, 20] and, therefore, their feasibility can bequestioned as follows. How relevant are comparisons ofpoorness of quality when evaluations are clearly targetedat consumer services? Where is the threshold of minimumaccepted level in these preference evaluations?
This leads to the connections between acceptability andpreference. As Jumisko-Pyykko [8] has concluded earlier that“to improve the connections between the quality preferences orpleasances to the real usage, the anchor of binary acceptabilityis necessary to. . .set parallel to quality preferences.” This is
important in quality evaluation studies comparing severalparameters, media, and their interaction at the same time.Further, it becomes even more significant when studyingthe novel optimization problems derived from technologytotally lacking previous knowledge about perceptual impactsof parameters. “This (acceptability) would show the usefulquality levels. . .and target the focus in this field to themeaningful and necessary parameter comparisons” [8]. In thelong term, the goal is to ensure that the produced quality isset in a way that constitutes no obstacle to the wide audienceacceptance of a product or service.
For the sake of clarity, we call degree-of-liking or ordinalmeasured preference of quality satisfaction in this paper.Acceptance of quality refers to the binary measure to locatethe threshold of minimum acceptable quality that fulfills userquality expectations and needs for a certain application orsystem.
4. EXPERIMENT 1
The first experiment had two goals. Firstly, the aim was todevelop a new subjective quality evaluation method. Ourmain focus was on an assessment method for the overallevaluation of acceptance and satisfaction. We also wantedto develop a simplified continuous assessment method forinstantaneous quality evaluations which would avoid thepreviously reported problems of conventional methods beingtoo demanding [52, 53]. Secondly, we wanted to study theimpact of simplified continuous assessment on retrospectiveevaluations between two samples.
4.1. Research method—test set-up
4.1.1. Participants
Two samples, each with 15 participants (equally stratified byage between 18–45 years and gender) conducted a study ina controlled laboratory environment. The samples containedmostly (80%) naıve or untrained participants. They had noprevious experience of quality evaluation experiments, theywere not experts in technical implementation, and they werenot studying, working, or, otherwise, engaged in informationtechnology or multimedia processing [11, 61]. In addition,they did not belong to any group of innovators and earlyadopters regarding their attitudes to technology [62].

6 International Journal of Digital Multimedia Broadcasting
Presentation:
Length(s):
Tasks:
A: Simplified continuous assessment- “Press the button when quality is unacceptable”
B: Overall quality- Satisfaction: 0–10- Acceptability (yes/no)
A A A A
B B B B
60 60 60 605 5 5 5
Figure 2: Experimental setup: simplified continuous assessmentand retrospective ratings of quality and acceptance.
4.1.2. Test procedure
The test procedure was divided into pre-test, test, and post-test sessions. In the pre-test session, vision and hearing testswith demographic data collection took a place. All par-ticipants had normal or corrected-to-normal visual acuity(20/40) as well as normal color vision and hearing. In thecombined training and anchoring, participants were shownthe extremes of the sample qualities as examples of thequality scale and they became familiar with the contents andthe evaluation task.
In the test, the test group evaluated quality withsimplified continuous assessment parallel to retrospectiveratings (Figure 2: Tasks A + B). The control group usedonly retrospective ratings (Figure 2: Task B). The samplematerial was shown using the Absolute Category Ratingmethod where clips are viewed one by one and ratedindependently [11]. During the clip presentation, the testgroup used a simplified continuous assessment method inwhich instantaneous unacceptable quality was indicated bypressing a button on a game controller while viewing thecontent. After each clip, participants marked retrospectivelythe overall quality satisfaction score of a clip on an answersheet using a discrete, unlabeled scale from 0 to 10 and theacceptance of quality (yes/no choice). 9 and 11-point scalesare recommended over narrower scales because they com-promise the end-avoidance-effect and problems of labeledscales [7]. The widely used labeled MOS scale was not usedbecause it has been criticized for having unequal distancesbetween the labels [49] and the meaning of these labelsare not the same between cultures [63, 64]. Acceptancewas measured on a binary scale imitating the measures ofthresholds [7, 35].
The instructions for the quality evaluation tasks wereas follows. For gathering the quality satisfaction score, theparticipants were asked to assess the overall quality ofthe presented clip. The measure of acceptance of qualitywas instructed by asking whether the participants wouldaccept the overall quality presented if they were watch-ing mobile television. No other evaluation criteria weregiven.
Visual:amount of detail
Visual:amountof motion
Cartoons“The Simpsons”
Music videoGwen Stefanie:“what are you waiting for”
Newsevening news
Sportice-hockey
Hig
hM
oder
ate
Moderate High
Audio:
Speech
Music with vocals
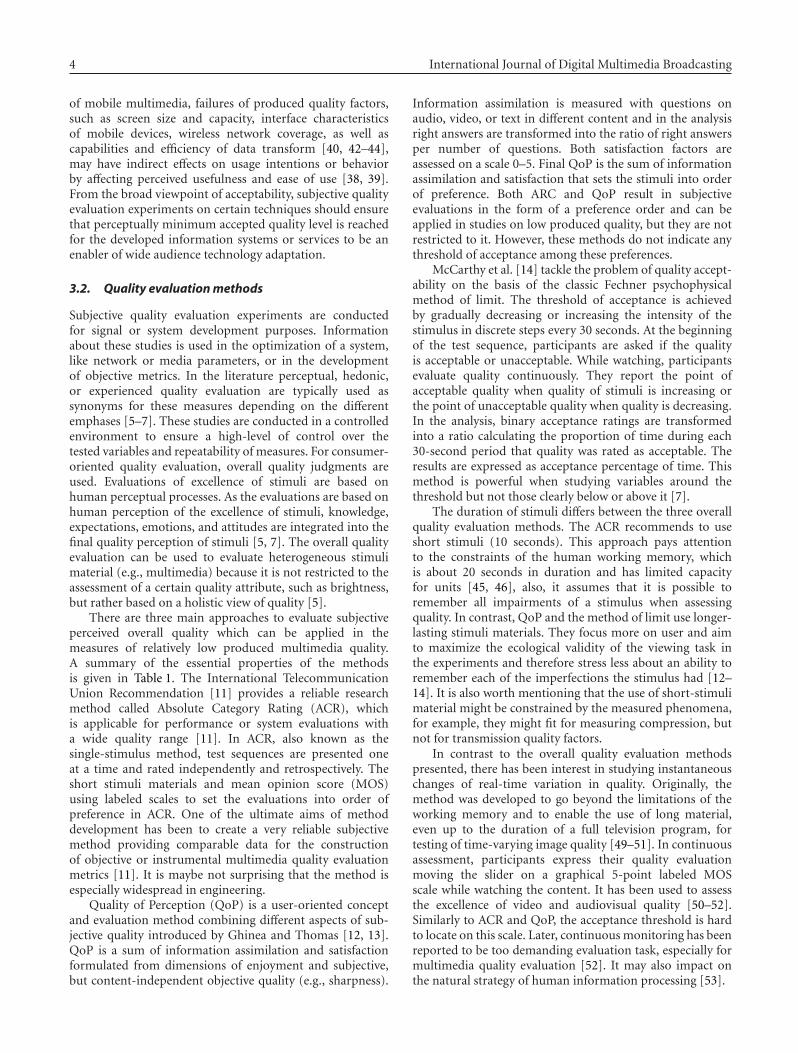
Figure 3: Genre of stimuli, contents, and their audiovisual charac-teristics.
The post-test session gathered qualitative data on experi-ences of erroneous streams. One test session lasted for about1.5 hours.
4.1.3. Selection of test material
Four types of content, news, sport, music video, andanimation were selected for test clips according to theirpotential for mobile television [48, 65, 66], popularity, andaudiovisual characteristics (Figure 3). Each clip contained ameaningful segment of a TV program without cutting thestart or end of a sentence, some textual information, severalshots with different distances and angles to be representativeof mobile television content.
The length of stimuli was approximately 60 seconds(61–63 seconds). The chosen duration enabled at leastone impairment to appear with the lowest error rate.The use of shorter stimuli is recommended due to thelimitations of human-working memory [45, 46], but withthe chosen impairment rate, shorter stimuli would have beenmeaningless.
4.1.4. Network-level characteristics of mobile television
The target application for which the test was setup wasmobile television. One of the most prominent standardsfor mobile television is the Digital Video Broadcasting-Handheld (DVB-H) standard [67], the characteristics ofwhich are briefly reviewed in this section. DVB-H usesInternet Protocol (IP) packet encapsulation for datacasting.These IP packets are further encapsulated into User Data-gram Protocol (UDP) packets, Real-Time Protocol (RTP)packets, and lastly Multi-Protocol Encapsulation (MPE)sections before being segmented into 188 byte (inclusive of4 byte header) transport stream (TS) packets. DVB-H usestime-slicing for reducing power usage in receivers. The error

S. Jumisko-Pyykko et al. 7
Table 2: Number of errors, mean durations, and standard deviation (in seconds) of burst errors for error patterns in different error rates.
Error rate Error rate 1.7% Error rate 6.9%
Content N Mean(SD) N Mean(SD)
CartoonAudio 0–3 0.33(0.28) 3–6 0.37(0.20)
Video 1 1.57(0.51) 3-4 1.06(0.54)
Music videoAudio 0–3 0.27(0.38) 3–7 0.70(0.17)
Video 1 1.65(0.38) 2-3 1.21(0.43)
NewsAudio 2 0.33(0.29) 2–6 0.38(0.20)
Video 1 1.94(0.45) 2–4 1.08(0.35)
SportAudio 0–3 0.34(0.28) 4–6 0.34(0.21)
Video 1-2 1.10(0.34) 2–4 1.06(0.44)
Error rate Error rate 13.8% Error rate 20.7%
CartoonAudio 11–14 0.32(0.19) 9–22 0.30(0.15)
Video 7-8 1.61(0.97) 13–15 1.31(0.75)
Music videoAudio 11–14 0.31(0.19) 9–22 0.31(0.19)
Video 7–9 1.27(0.74) 12–15 1.27(0.75)
NewsAudio 11–14 0.32(0.19) 9–22 0.30(0.15)
Video 7–9 1.41(1.00) 11–13 1.40(0.99)
SportAudio 12–15 0.30(0.18) 13–22 0.30(0.14)
Video 7-8 1.61(0.81) 11–14 1.50(0.90)
correction system of DVB-H, known as MPE-FEC, is basedon Reed-Solomon FEC codes computed over the IP packetsof a time-sliced burst of data [68].
4.1.5. Production of test materials—transmissionerror simulations
The test setup simulated DVB-H reception. The goal of theerror simulations was to produce four detectable differenttransmission error rates with varying number, length, andlocation of errors. To achieve this goal, 6 pilot experimentswere conducted to make a final decision about the finalerror rates. The simulation of the DVB-H channel was donewith a Gilbert-Elliot model that was trained according to afield trial carried out in an urban setting with an operableDVB-H system. Four rates (1.7%, 6.9%, 13.8%, 20.7%) forerroneous time-sliced bursts after FEC decoding (knownas MPE-FEC frame error ratio, MFER) were chosen forthe simulations. It is noted that these residual error ratesdo not represent typical DVB-H reception but rather areexamples of extremely harsh radio conditions. Such severeradio conditions were selected for the test to discover thethreshold between acceptable and unacceptable quality.
The selected test materials were encoded using recom-mended codecs for IP datacasting over DVB-H [67]. Visualcontent was encoded using a baseline H.264/AVC encoderwith the quarter common interchange format (QCIF), abitrate of 128 kbps, and a frame rate of 12.5 frame per second[8, 19, 67, 69]. For audio encoding, Advanced Audio Coding(AAC) was used with a bitrate of 32 kbps and sampling rateof 16 kHz as monoaural. An Instantaneous Decoder Refresh(IDR) frame was inserted per time-sliced transmission burstto minimize tune-in delay to new receivers tuning in to thechannel and to provide better error resilience under DVB-
H channel error conditions. The protocol stack of DVB-Hwas applied conventionally. The length of transmission burstinterval was set at approximately 1.5 seconds, and a code rateof 3/4 was used for MPE-FEC [70].
At the receiver, simple error concealment procedureswere used. When a picture of video was lost, all subsequentpictures were replaced by the last correctly received picture inpresentation order until the arrival of the next IDR picture.Thus, errors in video produced discontinuous motion.Similarly, the lost audio frames were replaced by silence,resulting in gaps during playback. The error characteristicsare presented in Table 2.
4.1.6. Presentation of test materials
The experiments were conducted in a controlled laboratoryenvironment [71]. The stimuli materials were viewed on aNokia 6630 handset with a Nokia player. During the viewing,the device was enclosed in a stand and adjusted to eye levelwith a viewing distance of 44 cm [8]. For audio playback,headphones were used and the level of audio loudness wasadjusted to 75 dBA.
A game controller (Logitech Dual Action gamepad) wasused to instantaneously mark unacceptability in the sim-plified continuous evaluation. A logging program was runon a laptop (Fujitsu Simens Lifebook Pentium 3, Windows2000) to collect the user input. The logging program run onPython 2.3.5 and used PyGame 1.6 module for accessing thegame controller button events. When the button of the gamecontroller was pressed, the program saved the number ofseconds elapsing from the reference time at the beginning ofthe presentation. All clips were played three times in randomorder and the positions of the transmission errors varied ineach repetition.

8 International Journal of Digital Multimedia Broadcasting
4.1.7. Method of analysis
Acceptance
To compare the acceptance ratings between the samples, weused Chi-square test, which is applicable to measure thedifferences of categorical data in independent measures [72].
Satisfaction
To compare the differences in satisfaction ratings betweenthe samples, we used the Mann-Whitney U test as anonparametric method (Kolmogorov-Smirnow: P < .05).The Mann-Whitney U test to measure differences betweenordinal measured two independent samples [72]. A signifi-cance level of P < .05 was adopted in this study.
4.2. Results
We examined the effect of simplified continuous assessmenton retrospective overall quality evaluation of acceptanceand satisfaction. We compared the retrospective evaluationsbetween the test group and the control group.
Acceptance
When the effects in all combined evaluations of acceptancewere compared, the effect was not significant (χ2 = .803,df = 1, P > .05, nor was there any significant effect inthe comparison samples in different error ratios (P > .05).Moreover, in the comparisons between the samples in eachcontent and error ratio, there was no significant effect ofcontinuous assessment on evaluation of acceptance in 15/16cases (P > .05). The only exception appeared in the sport clipwith error ratio 20.7 (χ2 = 4.05, df = 1, P < .05).
Satisfaction
There was no significant difference in the retrospectiveoverall quality assessment of satisfaction. There was nosignificant effect in the comparison of all given evaluations(U = 246999 P > .05, (P = .12), nanoseconds), nor was theeffect significant in the comparison of all error ratios (P >.05) or in the comparisons of each content in each error ratiobetween the two research methods (P > .05).
4.3. Discussion
The results showed that the simplified continuous assess-ment method did not affect the evaluations of retrospectiveacceptance and satisfaction between the studied samples.Earlier continuous assessment methods have been criticizedfor requiring a high level of involvement on the partof the evaluator and for possibly changing the way ofinformation processing while evaluating quality [52, 53]. Itis known that the difficulty, similarity, and practicing oftasks are the basic factors affecting performance of dualtasks [73]. Our study indicates that the simplified continuousassessment task developed is easy enough to be used parallel
to retrospective evaluations without negative impact. Ourresults are also supported by Reiter and Jumisko-Pyykko[74]. They concluded that while viewing the content, simpleparallel tasks like pressing the button or catching the object,did not impact on the requirements of quality in audiovisualapplications. Based on these results, we will use simplifiedcontinuous assessment in parallel with other methods toevaluate overall quality in different transmission simulations.
5. EXPERIMENT 2
To apply the developed overall quality evaluation methods,we used them to measure the impact of transmissionerrors. As in experiment 1, we assumed a mobile televisionusage scenario using the DVB-H standard. The goal of theexperiment was to study the effect of four clearly detectablydifferent residual transmission error rates on perceivedquality. We aimed to locate the threshold between acceptableand unacceptable quality, examine the quality satisfaction,and also express acceptance percentage of time. In addition,we examined the relations between the results of these threedifferent methods to evaluate their reliability.
5.1. Research method—test setup
5.1.1. Participants
30 participants, recruited according to the same criteria andmeeting the same sensory requirements as in experiment 1,participated in the experiment.
5.1.2. Test procedure
The test procedure was identical to the test sample procedurein experiment 1 (Figure 2: Tasks A + B). The simplifiedcontinuous assessment was used parallel to retrospectiveratings of acceptance and satisfaction.
Test materials, Test material production—transmissionerror simulations, and material presentation were identicalto those in the experiment 1.
5.1.3. Method of analysis
Acceptance
McNemar’s test was applied for the nominal retrospectiveacceptance evaluations to test the differences between twocategories in the related data [72].
Satisfaction
Satisfaction data were analyzed using Friedman’s test andWilcoxon matched-pair signed-ranks test because the pre-sumption of parametric methods (normality) was notmet (Kolmogorov-Smirnow P < .05) [72]. Friedman’s testis applicable to measure differences between several andWilcoxon’s test between two related and ordinal datasets[72].

S. Jumisko-Pyykko et al. 9
Acceptance percentage of time
To formulate the data of simplified continuous assessment inthe form of overall Acceptance percentage of time, nominaldata was converted to a scale variable using the conversionintroduced by McCarthy et al. [14].
(1− (unacceptable pressings/length of the clip))∗ 100(1)
After the conversion, each of the stimuli was given ascore showing the percentage of acceptable quality of stimulipresentation. Friedman and Wilcoxon’s tests were then usedin the actual analysis.
Relations between different measures
To analyze the connections between the different overallquality evaluation measures, Spearman’s correlation as anonparametric method for ordinal data was used and theChi-square test of independence evaluated independencebetween distributions of two variables measured on acategorical scale [72].
5.2. Results
5.2.1. Acceptance
The results of acceptance measurements showed that errorrates 1.7% and 6.9% of uncorrectable time-slices were expe-rienced as giving acceptable subjective quality, while errorrates of 13.8% and 20.7% were perceived as unacceptable.The differences between the error ratios were significant (Allcomparisons P < .001; Animation: 13.8% versus 20.7% P <.05) except the difference between the error rates 13.8% and20.7% in the news, music video, and sport clips evaluations(Figure 4 P > .05, nanoseconds).
5.2.2. Satisfaction
In terms of satisfaction, the order of preference in allcombined evaluations of error ratios was 1.7%, 6.9%, 13.8%,20.7%. Error rates had a significant effect on quality scores(FR = 437.6, df = 3, P < .001) and the differences between theerror rates were significant (P < .001).
The preferred order of satisfaction was the same inthe content-by-content examination but there were somevariations in the pairwise comparisons of the highest errorrates (Figure 5). Error rates had significant effect on allsatisfaction evaluations in all contents (Animation: FR =183.3, df = 3, P < .001, Music video: FR = 145.2, df = 3,P < .001, News: FR = 183.4, df = 3, P < .001, Sport: FR =203.6, df = 3, P < .001). The evaluations differed significantlybetween all error rates in animation (P < .001), sport (P< .001), and music video content presentations (between13.8% and 20.7% P < .01; all others P < .001). In thepresentation of news content, the differences were significant(P < .001) excluding the ratios 13.8% and 20.7% (P > .05,nanoseconds).
0
50
100
Perc
ent
0
50
100
Perc
ent
1.7 13.8 1.7 13.86.9 20.7 6.9 20.7
Error ratio (%)
Animation Music video
News Sport
AcceptanceUnacceptableAcceptable
Figure 4: Acceptance of different error rates for all contents.
0
2
4
6
8
10
Mea
nsa
tisf
acti
onsc
ore
1.7 6.9 13.8 20.7
Error ratio (%)
Contents
Animation
Music videoNewsSport
Figure 5: Mean satisfaction scores for all contents. Error bars show95% CI of mean.
5.2.3. Acceptance percentage of time
Three outliers were removed from the data because theyeither expressed unacceptable quality very rarely during thepresentation or they expressed it infinitely. Similar personalvariation has also been expressed in the use of conventionalcontinuous assessment [51].
The acceptance results based on a combination of contin-uous assessment were similar to the results of retrospectiveratings.

10 International Journal of Digital Multimedia Broadcasting
0
20
40
60
80
100
Acc
epta
nce
(%)
ofti
me
1.7 6.9 13.8 20.7
Error ratio (%)
ContentsAnimation
Music videoNewsSport
Figure 6: Acceptance percentage of time for all contents. Error barsshow 95% CI of mean.
The lowest error rate 1.7% gave acceptable viewing expe-rience for approximately 95% of the time whereas the highesterror rate gave the acceptable experience only approximately75% of the time (Figure 6). The acceptance evaluations weresignificantly affected by the error rates (FR = 774.4, df = 3,P < .001) and the evaluations differed significantly betweenall tested error rates (P < .001). The effects of different errorrates were similar to the combined evaluations in content-by-content examination. In the animation (FR = 210.9, df= 3, P < .001), music video (FR = 190.5, df = 3, P < .001),and news (FR = 176.5, df = 3, P < .001) content evaluationsdiffered significantly between all error rates (P < .001). Inthe sport content evaluation (FR = 208.1, df = 3, P < .001),the differences between the evaluations varied significantlybetween error rates (P < .001; and 13.8% and 20.9% P < .01).
5.2.4. Relations between the overall qualityevaluation methods
All quality evaluations based on three different evaluationmethods were related to each other. Retrospective acceptancewas discriminative on a scale of satisfaction, but not onthe acceptance based on simplified continuous assessment.Related or correlated measures indicate that results measuredon one scale can be used to interpret the results inanother scale. Discrimination between the scales, such asthe independence of the acceptable and unacceptable ratingsfrom the satisfaction scales, can be examined in a furtheranalysis for locating the threshold of acceptability. Theidea resembles the classical Thurstonian scaling, aiming toconstruct nonoverlapping concepts with equal intervals onthe attitude scale (e.g., [7]) .
Acceptable quality was expressed between scores of 5.5and 8.5 (Mean = 7.0, SD = 1.5; Figure 7) and unacceptable
0
2
4
6
8
10
Mea
nsa
tisf
acti
onsc
ore
5.8
2
3.9
8.5
5.5
7
Acceptance
AcceptableUnacceptable
(a)
50
60
70
80
90
100
Acc
epta
nce
(%)
ofti
me
92.1
70.4
81.3
98.2
83.1
90.7
Acceptance
AcceptableUnacceptable
(b)
Figure 7: Relations on the scale between retrospective acceptanceand satisfaction; and retrospective acceptance and acceptance basedon continuous assessment. Bars show mean and standard deviation.
quality was located between scores of 2.0–5.8 (Mean =3.9, SD = 1.9). The distribution between acceptable andunacceptable ratings on the satisfaction scale differed signifi-cantly (χ2(10) = 683.2, P < .001). In relation to evaluationsbased on continuous assessment, acceptable quality waslocated between 83% and 98% (M = 90.7% of time SD= 7.6; Figure 7) of total acceptances of time, overlappingwith unacceptable quality evaluations (M = 81.3% of timeSD = 10.8). The distributions between acceptable andunacceptable ratings on a scale of acceptance % of timelikewise differed significantly (χ2(36) = 319.1, P < .001). Theretrospectively rated satisfaction and acceptance based oncontinuous assessment were positively and linearly related(Spearman: r = .725, P < .001). In practice, the acceptancethreshold is located in the range of 5.5–5.8 on the satisfactionscale in this experiment. It is not justifiable to draw a similarconclusion for the measures of acceptance percentage oftime because the threshold is located between 83.1 and 92.1and the confidence intervals of unacceptable and acceptablepercentage of time overlap to a great extent.
5.3. Discussion
The perceived preference order in all measured scales forerror rates was 1.7%, 6.9%, 13.8%, and 20.7%, respectively,indicating clearly detectable differences between stimuli.Acceptance ratings give a quality anchor for this preferenceorder showing that the threshold between acceptable andunacceptable quality lies between error rates of 6.9% and13.8% and this result is not dependent on content. Inpractice, acceptable quality can be reached when approxi-mately 4/60 seconds are corrupted, resulting altogether in amaximum 10 detectable errors [59, 60] in different media.

S. Jumisko-Pyykko et al. 11
In the literature, an error rate of 5% is the conventionallyused limit value of operative quality of restitution (QoR) formobile reception [68] but our result showed a slightly highertolerance of errors.
The order of preference for different error rates collectedusing different methods was similar in all contents withfew exceptions. Exceptions were found especially in thecomparisons of acceptance ratings of the highest errorrates. In these error rates, the produced quality is relativelymodest. The evaluation criterion of acceptance may bemuch tighter compared to the task of evaluating qualitysatisfaction or it may be hard to accept any such erroneouspresentations as the goal of viewing can no longer beachieved [34]. In addition, a binary acceptance scale maybe useful only in the identification of the threshold, not indetailed comparisons of preferences regarding low qualities.In summary, the assessment results were closely relatedbetween all three measures indicating good reliability, andthey had good discriminative capability when differencesbetween stimuli were distinguishable and the stimuli notextremely erroneous.
6. EXPERIMENT 3
For further estimation of the reliability and discriminativeability of the overall quality evaluation methods presented,we continued the work with heterogeneous error char-acteristics, realistic in multimedia broadcasts. The thirdexperiment aims to compare two different error rates onboth sides of acceptability by pre- or postprocessing themwith four different error control methods. This combinationwas assumed to produce detectable, but relatively smalldifferences between stimuli.
Few studies have reported comparisons of error controlmethods related to DVB-H to improve experienced quality.Hannuksela et al. [23] have compared unequal and equalerror protection methods with two different error rates.Unequal error protection (UEP) method uses priority-basedsegmentation of media streams in which audio and the mostimportant coded video pictures have the best protectionunder harsh channel transmission conditions. By contrast, allmedia data are of equal importance in the conventional equalerror protection method (EEP). The experiment comparedthese methods with error rates of 6.7% and 13.8% andconcluded that in the highest error rate UEP improvedthe subjective quality. Further, Hannuksela et al. [22] alsocompared audio redundancy coding and conventional errorprotection methods with two different error rates (6.7% and13.8%). Audio redundancy coding (ARC) aims to ensureaudio continuity in very erroneous channel conditionsand their results showed it to improve perceived quality,especially with the harshest error rate. Earlier studies haveshown that error control methods can provide some qualityimprovements depending on error rate, but no extensivestudy of different error control methods and error rates hasbeen published.
The aim of the experiment is to compare the interactionsof four different error control methods and error ratesclose to the threshold of acceptability with small differences
between the stimuli. In addition to measuring overall satis-faction of quality and acceptance percentage of time, we areinterested to ascertain if the boundary of acceptability can beaffected by error control methods. To evaluate reliability, wealso examine the relations between results of three differentmethods.
6.1. Research method—test setup
6.1.1. Participants
Our participants were 45 participants, recruited according tosame criteria as in experiments 1 and 2.
6.1.2. Test procedure
The test procedure was identical to that of experiment 2. Thetotal duration of the experiment was approximately 2 hours.
6.1.3. Selection of test material
Test materials were identical to experiment 2.
6.1.4. Material production process—transmissionerror simulations
The aim of the error simulations was to produce stimulimaterial with relatively small, but detectable differencesbetween stimuli in various forms. As a base for errorsimulations, two different error rates known to be perceivedaround a boundary between acceptable and unacceptable(experiment 2) qualities were selected and further four dif-ferent error concealment methods were applied to these. Thesimulated error rates produced a varying number, length,and location of errors, and error concealment methodscaused different audiovisual appearance form for these errors(Table 3).
Four different error resiliency methods were tested.While one of the error resiliency methods gave moreimportance to audio, another gave video error resiliencymore importance. The remaining one used channel-assistederror resiliency based on unequal error protection. Thesemethods are described in greater detail below.
The first method, called conventional transport withpicture freeze (CT-PF), did not use any kind of additionalerror resiliency measures apart from the protection providedby DVB-H MPE-FEC. The method was used as a base forcomparing other error resiliency methods tested. It assumeda compliant audiovisual decoder, albeit with no intelligence.In this method, when the decoder encountered errors in avideo stream, it stopped decoding any subsequent picturesuntil an Intra Decoder Refresh (IDR) picture arrives. IDRpictures use no other pictures as a prediction reference andtherefore provide a resynchronization point in an erroneousbit stream. During the period when the decoder stoppeddecoding, it presented the last uncorrupted decoded picture.Subjectively, when this method was used, an error wasperceived as jerky motion in visual streams. The duration ofthese jerks in visual streams depended on the IDR interval

12 International Journal of Digital Multimedia Broadcasting
Table 3: Number of errors, mean durations and standard deviation (in seconds) of burst errors for error patterns in different error rates anderror control methods.
Concealment content N Mean(SD) N Mean(SD)
CT-PF Error rate 6.9% Error rate 13.8%
CartoonAudio 7–9 0.15(0.08) 18 0.18(0.09)
Video 3 1.2(0.58) 5-6 1.5(0.71)
Music videoAudio 7–9 0.15(0.08) 18 0.17(0.09)
Video 3–5 0.92(0.55) 5 1.72(1.01)
NewsAudio 8 0.15(0.07) 18 0.17(0.09)
Video 3-4 1.53(1.13) 5–7 1.63(1.04)
SportAudio 8 0.15(0.07) 18 0.17(0.07)
Video 2–4 1.22(0.72) 6 1.29(0.07)
SAR-PF Error rate 6.9% Error rate 13.8%
CartoonAudio 2 0.11(0.06) 7–11 0.11(0.04)
Video 2-3 2.41(1.26) 4-5 1.90(1.01)
Music videoAudio 2 0.11(0.06) 7–11 0.12(0.04)
Video 2–4 2.11(1.52) 5 1.82(0.80)
NewsAudio 2 0.11(0.06) 7–11 0.11(0.03)
Video 1–3 2.28(1.53) 1–3 6.03(3.60)
SportAudio 2 0.11(0.06) 7–11 0.12(0.03)
Video 1–4 2.30(2.00) 3 3.04(1.47)
CT-EC Error rate 6.9% Error rate 13.8%
CartoonAudio 7–9 0.15(0.08) 18 0.18(0.09)
Video 7–9 0.18(0.06) 18 0.18(0.09)
Music videoAudio 7–9 0.15(0.08) 18 0.17(0.09)
Video 7–9 0.17(0.07) 15–18 0.19(0.09)
NewsAudio 7–9 0.15(0.08) 18 0.18(0.09)
Video 7–9 0.18(0.07) 17–19 0.18(0.10)
SportAudio 8 0.15(0.07) 18 0.17(0.07)
Video 7-8 0.20(0.08) 17–19 0.19(0.11)
UEP-PF Error rate 6.9% Error rate 13.8%
CartoonAudio 4-5 0.29(0.14) 11 0.34(0.19)
Video 7–12 0.43(0.65) 14-15 0.54(0.69)
Music videoAudio 3–5 0.27(0.16) 10 0.38(0.24)
Video 8–12 0.32(0.42) 11 0.72(1.21)
NewsAudio 3-4 0.32(0.18) 9–11 0.36(0.22)
Video 8–10 0.34(0.44) 13–17 0.44(0.49)
SportAudio 3 0.35(0.17) 9-10 0.39(0.22)
Video 6–12 0.34(0.47) 9–12 0.60(0.92)
and the position of the error between two IDR intervals.The audio compression scheme used in the tests encoded1024 samples of every audio channel as frames. These frameswere all independent of each other and a loss of any oneframe of the bit stream did not affect any other subsequentframes of an audio channel. When an audio frame was lost,it was replaced with a null frame perceived as silence by thelistener. Subjectively, audio frame losses were perceived asdiscontinuous audio.
The second method used audio redundancy coding toachieve better audio reception in heavy DVB-H channelerror conditions and is therefore called Synchronised AudioRedundancy coding with picture freeze (SAR-PF). WhenMPE-FEC frames were constructed with audiovisual data
as input, audio packets that constitute the next MPE-FECframe in transmission were replicated and sent in the currentMPE-FEC frame. The audio decoder expected two copies ofevery coded audio frame. However, when errors destroyed anaudio frame, the decoder looked for the second copy of thesame audio frame and if received correctly, used this copyinstead. This redundancy of audio packet coupled with theirtransmission in different time-sliced bursts greatly reducedthe probability of any audio frame being completely lost.Video error concealment was identical to what was done inthe CT-PF method described above. However, to account forthe additional bit rate overhead incurred due to redundantaudio packets, the video bit rate was dropped such that theoverall bit rate was the same as the other error resiliency

S. Jumisko-Pyykko et al. 13
0
50
100
Perc
ent
0
50
100
Perc
ent
0
50
100
Perc
ent
0
50
100
Perc
ent
6.9 13.8 6.9 13.8 6.9 13.8 6.9 13.8
Error ratio (%)
Car
toon
Mu
sic
vide
o
New
s
Spor
t
Content type
CT
-PF
SAR
-PF
CT
-EC
UE
P-P
F
Con
ceal
men
t
Acceptance score
UnacceptableAcceptable
Figure 8: Retrospective acceptance of different error rates andconcealment methods for all contents.
methods. In other words, the media-level-produced qual-ity of the coded video was poorer than in the CT-PFmethod. More details of the SAR-PF method are availablein [23].
The third error concealment method, called Conven-tional Transport with Error Concealment (CT-EC) used avery simple decoder-based visual error concealment methodfor concealing lost parts of the video sequence. Whena picture of the sequence was lost, the decoded picturebuffer (DPB) replicated the last correctly received picture (inpresentation order) and used it instead of the lost picture.The reason for this replacement was the assumption thatspatial video redundancy can be fairly high (depending onthe video sequence) and the replaced picture is a goodenough estimate of the lost picture. However, since thereplaced picture was not the exact representation of the lostpicture, motion compensation errors occured in picturesusing the replaced picture as reference, and these errorspropagated until an Intra picture and/or IDR picture arrived.For audio, the error concealment was similar to what wasused in the CT-PF method, where the last audio frames werereplaced with a silent frame.
The fourth method of error resiliency is called UnequalError Protection with Picture Freeze (UEP-PF). First, themedia datagrams covering a certain period of playback timewere assigned priorities. In the tests, two priorities wereused. Audio packets, video reference pictures (both IDRand reference predicted pictures) were assigned priority1 (the highest), and nonreference pictures were assignedpriority 2 (the lowest). The priority-assigned datagrams weregrouped together such that all datagrams in a group had thesame priority. The protection of the priorities was chosensuch that priority 1 datagrams were protected with a 3/4MPE-FEC-code-rate while the priority 2 datagrams werecompletely unprotected. These grouped and protected MPE-FEC matrices (called peer MPE-FEC matrices) were thensent back to back without any delay between these MPE-FECframes. More details on the UEP-PF method are available in[23, 75]. The first and last five seconds of presentation wereleft error-free to avoid memory effect (primacy and recency)in evaluation of long test materials [49, 53].
6.1.5. Presentation of test materials
The presentation of the test materials was similar to thatin the previous experiments. All clips were played twice inrandom order and the positions of the transmission errorsvaried in both repetitions.
6.1.6. Data-analysis methods
Selection of data-analysis methods followed the methodsdescribed for experiment 2.
6.2. Results
6.2.1. Acceptance
Between error rates
Lower error rate (6.7%) provided mostly acceptable andhigher error rate (13.8%) unacceptable quality with signif-icant difference between them in all studied concealmentmethods and contents (P < .01; Figure 8).
Between error concealments
All concealment methods were evaluated equally acceptablein error rate 6.9% (P > .05). In contrast, in error rate 13.8%,SAR-PF and UEP-PF (P > .05) were evaluated equally andmore acceptable CT-PF and CT-EC (P < .001) which were insame level as well (P > .05).
In error rate 6.7%, mostly all error concealment methodswere evaluated into same level, but there were some content-dependant variations. There were not differences betweenthe concealment methods in animation and music videopresentation (P > .05). News content, concealed with SAR-PF, was evaluated more acceptable than other methods(SAR-PF versus others P < .05; all other comparisons P> .05). In contrast, SAR-PF provided the most modestquality for sport presentation (P < .05; all other comparisons

14 International Journal of Digital Multimedia Broadcasting
P > .05), approaching the boundary between acceptable andunacceptable quality.
In error rate 13.8%, SAR-PF and UEP-PF provided moreacceptable quality than CT-PF and CT-EC. For animationand news presentation, most of the participants consideredSAR-PF and UEP-PF as equally acceptable (P > .05) andCT-PF and CT-EC as equally unacceptable (P > .05) withsignificant differences between them (SAR-PF versus CT-PC,CT-EC P < .05; UEP-PF, and CT-PF P < .01). In music,SAR-PF was significantly better than CT-EC (P < .05), whileall other methods were in same level (P > .05). For sportpresentation, SAR-PF and UEP-PF were rated as the mostacceptable (P > .05) with significant difference to othermethods (P < .05). Error rate 13.8% is in general evaluatedas unacceptable, but in the case of cartoon and news withconcealment method, SAR-PF quality can become acceptableor, with method UEP-PF, reach the boundary of acceptableand unacceptable ratings.
6.2.2. Satisfaction
Between error rates
Similar to the results for acceptance, error ratio 6.7% wasreported more satisfying than error ratio 13.8% in allcontents and error control methods (P < .001; Figure 9).
Between error concealments
Error ratios and error concealment methods affected satis-faction evaluations (FR = 982.1, df = 7, P < .001) and errorconcealment strategies had a significant effect on evaluationswithin both error rates (6.9%: FR = 17.252, df = 3, P < .01,13.8%: FR = 94.381, df = 3, P < .001).
In terms of satisfaction, CT-EC provided the lowestquality in comparison to other concealment methods (P <.05), which were equally evaluated (P > .05) for error rate6.9%. In error rate 13.8%, the most satisfying quality wasgiven by SAR-PF, followed by UEP-PF and the lowest qualityby equally rated CT-PF and CT-EC (P > .05) with significantdifferences between all (P < .01).
There were also content-dependent preferences betweenthe concealment methods in different error rates. For thelower error rate of 6.9% for animation content, all conceal-ments were evaluated at the same level (P > .05). UEP-PF andSAR-PF were evaluated equally, giving the most satisfyingquality in music video (P > .05), but only differences betweenUEP-PF and others were significant (P < .001). SAR-PF wasevaluated as the most satisfying for news content comparedto other methods (P < .01). In sports, CT-PF and UEP-PFwere found equally good (P > .05) and significantly betterthan SAR-PF (P < .05).
In error rate 13.8%, error concealments SAR-PF andUEP-PEF were among the most satisfying methods in allcontents. For animation presentation, SAR-PF and UEP-PF were evaluated equally being more satisfying (P > .05)than other methods (P < .001). In music video, SAR-PF,UEP-PF, and CT-PF (P > .05) were more satisfying thanthe concealment method called CT-EC (P < .05). The SAR-
PF and UEP-PF were equally evaluated (P > .05) in newspresentation in which SAR-PF was significantly better thanCT-PF and CT-EC (P < .01) and UEP-PF significantly betterthan CT-PF (P < .05). For sport content, SAR-PF, and UEP-PF (P > .05) were more satisfying than the others with SAR-PF significantly outperforming both CT-PF and CT-EC (P <.001).
6.2.3. Acceptance percentage of time
Between error rates
Lower error rate (6.7%) was reported to give a higheracceptance rate percentage of time compared to higher errorrate (13.8%) (P > .001; Figure 10). An exception was foundin news presentation with error rate 6.7%, methods CT-ECand UEP-PF were evaluated at the same level with error rate13.8% concealed with SAR-PF (P > 0.05, ns).
Between error concealments
Error ratios and error concealment methods affected accep-tance evaluations based on simplified continuous assessment(FR = 1335.0, df = 7, P < .001). The error concealmentstrategies also had a significant effect on within errorexamination (6.9%: FR = 48.5, df = 3, P < .001, 13.8%: FR =223.0 df = 3, P < .001). In error rate 6.9%, SAR-PF yieldedthe highest acceptance percentage of time with significantdifference (P < .01) to others being on the same level (P >.05). Similarly, SAR-PF yielded the highest acceptance % oftime in error rate 13.8% (P < .001), followed by UEP-PF andCT-PF (P > .05) and UEP-PF and CT-EC (P > .05).
There were also some content-dependent variationsbetween the concealment methods with the lower error rateof 6.9%. For presenting cartoons, the longest acceptablepresentation for cartoon content was given by SAR-PFoutperforming the others (P < .05), followed by UEP-PF(difference from others P > .05). In music video, SAR-PFand UEP-PF were evaluated at the same level (P > .05,difference from others P < .05). The concealment SAR-PFalso provided the highest quality (P < .001) for news contentwith significant difference from other methods which wereevaluated equally (P > .05). In sport content, there were nodifferences between the methods (P > .05) except the UEP-PF, which yielded the lowest quality (P < .001).
In the higher error rate (13.8%), CT-PF, SAR-PF, and CT-EC (P > .05) were more satisfying than the most modestlyassessed UEP-PF (P < .001) for cartoon content. In musicvideo, SAR-PF is the highest quality with a significantdifference from the others (P < .001), UEP-PF is the secondhighest (P < .05), and the other methods were evaluated atthe same level (P > .05). For the news, the concealment calledSAR-PF yielded the highest quality (P < .001) and all othermethods were on the same level (P > .05). As in news content,SAR-PF yielded the highest quality for sport content withsignificant difference from the others (P < .001), CT-PF andCT-PC the second highest (P > .05), and UEP-PF the mostmodest (P < .05).

S. Jumisko-Pyykko et al. 15
0
2
4
6
8
10
Mea
nsa
tisf
acti
onsc
ore
Cartoons
CT
-PF
SAR
-PF
CT
-EC
UE
P-P
F
Concealment
Error ratio (%)6.9 %13.8 %
(a)
0
2
4
6
8
10
Mea
nsa
tisf
acti
onsc
ore
Music video
CT
-PF
SAR
-PF
CT
-EC
UE
P-P
FConcealment
Error ratio (%)6.9 %13.8 %
(b)
0
2
4
6
8
10
Mea
nsa
tisf
acti
onsc
ore
News
CT
-PF
SAR
-PF
CT
-EC
UE
P-P
F
Concealment
Error ratio (%)6.9 %13.8 %
(c)
0
2
4
6
8
10
Mea
nsa
tisf
acti
onsc
ore
Sport
CT
-PF
SAR
-PF
CT
-EC
UE
P-P
F
Concealment
Error ratio (%)6.9 %13.8 %
(d)
Figure 9: Retrospective satisfaction of different error rates and concealment methods for all contents. Error bars show 95% CI of mean.
0
20
40
60
80
100
Acc
epta
nce
(%)
ofti
me
Cartoons
CT
-PF
SAR
-PF
CT
-EC
UE
P-P
F
Concealment
Error ratio (%)6.9 %13.8 %
(a)
0
20
40
60
80
100
Acc
epta
nce
(%)
ofti
me
Music video
CT
-PF
SAR
-PF
CT
-EC
UE
P-P
F
Concealment
Error ratio (%)6.9 %13.8 %
(b)
0
20
40
60
80
100
Acc
epta
nce
(%)
ofti
me
News
CT
-PF
SAR
-PF
CT
-EC
UE
P-P
F
Concealment
Error ratio (%)6.9 %13.8 %
(c)
0
20
40
60
80
100
Acc
epta
nce
(%)
ofti
me
Sport
CT
-PF
SAR
-PF
CT
-EC
UE
P-P
F
Concealment
Error ratio (%)6.9 %13.8 %
(d)
Figure 10: Acceptance percentage of time of different error rates and concealment methods for all contents. Error bars show 95% CI ofmean.
6.2.4. Relations between the overall qualityevaluation methods
As in experiment 2, the three different evaluation methodswere related to each other. Acceptable and unacceptable
quality was clearly detectable on a scale of satisfaction, butnot on a scale of acceptance percentage of time. Acceptablequality was connected to scores between 5.2 and 8.1 (Mean= 6.6, SD = 1.45; Figure 11) on a satisfaction scale andunacceptable quality to scores between scores of 2.1–5.4

16 International Journal of Digital Multimedia Broadcasting
0
2
4
6
8
10
Mea
nsa
tisf
acti
onsc
ore
5.4
2.1
3.8
8.1
5.2
6.6
Acceptance
AcceptableUnacceptable
(a)
50
60
70
80
90
100
Acc
epta
nce
(%)
ofti
me
94.3
85.4
89.8
97.5
90.3
93.9
Acceptance
AcceptableUnacceptable
(b)
Figure 11: Relations on the scale between retrospective acceptanceand satisfaction; and retrospective acceptance and acceptance basedon continuous assessment. Bars show mean and standard deviation.
(Mean = 3.8, SD = 1.67). In the examination of the relationbetween acceptance and acceptance percentage of time,acceptable quality was located between 90 and 97% (M =93.9% of time, SD = 3.6) on a scale of acceptance percentageof time with widely overlapping unacceptable quality range(M = 89.8% of time, SD = 4.4). As in the previousexperiment, both the distributions of retrospectively ratedsatisfaction and acceptance (χ2(10) = 1370.3, P < .001)and the distributions between the retrospectively ratedacceptance and acceptance based on continuous assessment(χ2(49) = 632.0, P < .001) differed. The retrospectively-ratedsatisfaction and acceptance based on continuous assessmentwere also positively and linearly related (Spearman: r =.542, P < .001). In practice, according to this experiment,the threshold between acceptable and unacceptable ratingsis between the scores 5.2 and 5.4 on the satisfaction scale.The threshold on a scale of acceptance percentage of timeis between 90.3 and 94.3 in which the overlapping ofthe confidence intervals constrains the interpretation ofresults.
6.3. Discussion
All the evaluation methods were able to detect the differencesin the level of error rates confirming the results of experiment2. Higher error rate was experienced giving poorer qualitycompared to lower error rate in all methods measured. Inthe measures of acceptance percentage of time, only oneexception appeared in which the poorest quality of lowesterror rate was evaluated equal with the highest quality ofmost erroneous error rate.
When error control methods were compared, variationswere found in the results gathered using retrospective and
continuous methods. In error rate 6.9%, the requirementsfor different error control methods varied content depen-dently. For example, in news content, SAR-PF outperformedthe other methods in all measures, whereas all methodswere equally retrospectively evaluated for cartoons. CT-PFand UEP-PF were among the methods that provided highestquality for sport content in the retrospective measures,whereas UEP-PF was the poorest method according toacceptance percentage of time measures. In high error rate,retrospective methods had excellent agreement in acceptanceand satisfaction revealing that SAR-PF and UEP-PEF wereamong the most satisfying methods in all contents. Theseerror control methods even enabled cartoons and news toreach the 50% acceptance threshold. In contrast, accordingto simplified continuous assessment, SAR-PF provided thehighest acceptance percentage of time while UEP-PF didnot produce the highest quality in any of the cases. In allof the cases measured with continuous assessment, SAR-PFwas among the methods producing the highest acceptancepercentage of time.
From the viewpoint of research methods, there aretwo main conclusions. Firstly, good agreement between theretrospective methods indicates that detailed analysis is notneeded for both of the measures. Both of the methodsare needed in data collection, but different emphasis isgiven in the analysis. As quality satisfaction is measuredusing an ordinal scale and therefore providing a chanceto use sophisticated and efficient methods of analysis [72],it should be used as a primary data source for analysis.Data on acceptance of quality may only be analyzed tolocate a certain threshold of acceptance and these thresholdscan be used as references in the interpretation of theresults of quality satisfaction. Secondly, simplified contin-uous assessment may not be a reliable method for overallquality evaluation to discriminate stimuli having smallnoticeable differences. The results of simplified continu-ous assessment differed from the results of retrospectivemeasures when the differences between the stimuli weresmall.
There are two main conclusions about the error rates anderror control methods we studied. Error rate seems to bea more important factor in perceived quality than an errorcontrol method. Further research may focus on error ratesand more detail examination of different impacting errorcharacteristics, such as duration, location, and modalitywithin these error rates. In addition, the results of thecomparisons of error rates and error control methods alsoreflected the relation between content dependency and levelof quality. In the low error rates, some dependant preferencesappeared. For example, the error control methods improvingaudio quality was emphasized in news presentation whileimprovements in visual quality were highlighted in sportcontent. By contrast, extremely erroneous quality seemsto hide the content-dependent preferences highlighting theimportance of audio quality in all contents. These results aresupported by an earlier study comparing several audio-videobitrates. These authors concluded that relations betweenoptimal audio-video bitrates are content dependent, but inlow qualities audio qualities is emphasized [8].

S. Jumisko-Pyykko et al. 17
7. DISCUSSION AND CONCLUSIONS
In this paper, we examined research methods for assessingoverall acceptance of quality in three experiments. At first,we explored the possibilities of using simplified continuousassessment in the evaluation of overall acceptance parallel toretrospective measures. Secondly, we studied the boundarybetween acceptable and unacceptable quality using clearlydetectable differences between stimuli. Finally, we studiedthe acceptance threshold with small differences betweenstimuli under heterogeneous conditions. We conducted thesestudies in the context of mobile television with varyingerror rates and error control methods with several televisionprograms in a controlled environment. Our results showedthat instantaneous and retrospective evaluation methods canbe used in parallel in quality evaluation without causingchanges to human information processing. All measureswere discriminative and correlated when clearly detectabledifferences between stimuli were studied. By contrast, whensmall differences between stimuli were examined, the resultsof retrospective measures correlated but differed from theresults based on the evaluation of instantaneous changes.In this section, we discuss the main results and makerecommendations for the use of these methods.
7.1. Bidimensional method forretrospective evaluations of overallacceptance and satisfaction
As the main result of this study, we recommend paralleluse of retrospective measures of acceptance and satisfactionin quality evaluation experiments. Acceptance, representingthe first dimension, is needed to ensure that test variablesreach the predefined thresholds depending on the goalof the study (e.g., 50%, 80%). However, the nature ofmeasuring a threshold has some constraints. Firstly, themeasure is discriminative when studying variables closeto the threshold, but is not clearly below or above it.Secondly, as acceptability is measured on a binary scale,it imposes limitations on the use of efficient methods ofanalysis which are needed in careful pairwise comparisons[7]. To go beyond these constrains and broaden the useof the method to the other quality ranges, we recommendstudying satisfaction of quality parallel to acceptability.Satisfaction, the second dimension, as a degree-of-liking ismost commonly measured on a 9- or 11-point ordinal scalewhich enables the use of efficient methods of analysis [7]. Inaddition, it allows using same data-collection method for theduration of continuous quality evolution.
Data-collection and analysis using a combination ofacceptance and satisfaction methods are summarized inFigure 12. We recommend a separate analysis for both of themeasured dimensions, but as a starting point, the relationbetween the measures needs to be considered to ensure thereliability. There are two options for extracting the desiredthreshold. Firstly, the tested parameters can be dissected fromthe frequencies of acceptance data. In the second option,the value range of the threshold between acceptable andunacceptable scores can be identified on satisfaction scale in
Satisfaction of quality(9 or 11-point scale)
Acceptance of quality(yes/no)
Identify thresholds Analyse preferences
Data-collection
Analysis
Figure 12: Data-collection and analysis for bidimensional measurecombining retrospective overall acceptance and satisfaction.
the case the measures are not strongly overlapping. Further,the located threshold can be used in the interpretation ofresults of a detailed analysis of preferences derived from thesatisfaction data.
This work focused on presenting a bidimesional researchmethod, but it did not aim to model bidimensionality inthe level of analysis. Our studies showed evidence that thelocation of acceptance threshold on satisfaction scale isrelative to the measured phenomena. To name the constantvalues for the threshold on a satisfaction scale might beimpossible and it might restrict the use of method formeasuring different quality ranges. However, our study waslimited to the evaluations of clearly detectable and smalldifferences around the threshold. Further work needs toexplore the behavior of these measures on the high or lowlevels of produced qualities for modeling the actual usage ofthe different scales. In addition, to validate the bidimensionalmethod, further studies need to apply it for studying allmultimedia abstraction layers and their interaction. Thisstudy targeted only the network and media levels while lessattention was paid to the content layer. Finally, to broadenthe presented method, there is a need to explore acceptabilityevaluations in relation to other user-oriented assessmenttasks, like examination of goals of viewing.
7.2. Overall acceptance based on evaluation ofinstantaneous changes
As a minor result, a simplified continuous assessment taskto evaluate instantaneous quality changes can be used inparallel with retrospective evaluation methods in qualityassessment. This data-collection method can offer insightsfor the annoying factors in time-varying quality [76] withoutchanging human information processing which has been theshortcoming of the previous methods [53]. When talkingabout constructing overall evaluations based on instanta-neous assessments, there are some challenges. Our resultsshowed that the overall acceptance scores of continuousassessment were relatively high all the time and were not verywell distinguishable in the terms of retrospective acceptance.Moreover, their ability to differentiate small differencesbetween stimuli was limited. All of these aspects might havebeen impacted by an additive approach for constructing theoverall evaluations we used. In this trail, further work needsto examine other possibilities for the use of instantaneously

18 International Journal of Digital Multimedia Broadcasting
recorded data to predict overall quality by weighting thecertain segments of evaluations, like peaks and ends [77].This perspective can also reveal something new from thefundamental problem of relation between parts and whole inthe human information processing. On the other hand, thisapproach does not necessarily erase the need of measuringa retrospective acceptance anchor. In the current phase,we recommend using a simplified continuous assessmentmethod for tracking the acceptability of instantaneouschanges (e.g., [76]) in parallel to retrospective methods, butnot as the only method for evaluating overall acceptance.
7.3. Conclusions
This study presented an evaluation method of acceptancerepresenting the minimum level of user requirements inwhich user expectations and needs are fulfilled. The pro-posed bidimensional evaluation method combining accep-tance and satisfaction can be extended or integrated intoany consumer- or user-oriented sensory studies to ensurethe level of minimum quality of a relevant component. Forexample, in the context of multimedia quality, it can beadded to an existing QoP model targeting the measurementof quality preference and goals of viewing [12, 13]. Themethod can also help system developers to test meaning-ful parameter combinations when testing a novel set ofparameters, parameter combinations or several modalities(e.g., audio-video parameter combinations for mobile 3Dtelevision).
However, acceptability measurement is just one of thefirst steps on the way to understanding consumer- or user-oriented experienced multimedia quality. Our long-term aimis not only to focus on acceptance evaluation as method toensure the quality of a critical system component, but also tounderstand the effect of user characteristics, system design,and the actual context of use on experienced quality.
ACKNOWLEDGMENTS
This study was funded by Radio- ja televisotekniikantutkimus Oy (RTT). RTT is a nonprofit research companyspecialized in digital television datacasting and rich mediadevelopment. Satu Jumisko-Pyykko’s work was funded bythe UCIT graduate school and this article was supportedby the HPY research foundation and Finnish CulturalFoundation. The authors wish to thank Hannu Alamaki andKati Nevalainen about their work in the project.
REFERENCES
[1] R. J. Abbott, An Integrated Approach to Software Development,John Wiley & Sons, New York, NY, USA, 1986.
[2] V. Roto, Web browsing on mobile phones—characteristics ofuser experience, Ph.D. dissertation, Helsinki University ofTechnology, Helsinki, Finland, 2006.
[3] M. Hassenzahl and N. Tractinsky, “User experience—aresearch agenda,” Behaviour & Information Technology, vol. 25,no. 2, pp. 91–97, 2006.
[4] S. J. Barnes, “The mobile commerce value chain: analysisand future developments,” International Journal of InformationManagement, vol. 22, no. 2, pp. 91–108, 2002.
[5] S. Bech and N. Zacharov, Perceptual Audio Evaluation: Theory,Method and Application, John Wiley & Sons, New York, NY,USA, 2006.
[6] P. G. Engeldrum, Psychometric Scaling: A Toolkit for ImagingSystems Development, Imcotek Press, Winchester, Mass, USA,2000.
[7] H. T. Lawless and H. Heyman, Sensory Evaluation of Food:Principles and Practices, Chapman & Hall/CRC, New York, NY,USA, 1998.
[8] S. Jumisko-Pyykko, ““I would like to see the subtitles and theface or at least hear the voice”: effects of picture ratio andaudio-video bitrate ratio on perception of quality in mobiletelevision,” Multimedia Tools and Applications, vol. 36, no. 1-2,pp. 167–184, 2008.
[9] H. Knoche, J. D. McCarthy, and M. A. Sasse, “Can small bebeautiful? Assessing image resolution requirements for mobileTV,” in Proceedings of the 13th Annual ACM InternationalConference on Multimedia (MULTIMEDIA ’05), pp. 829–838,Singapore, November 2005.
[10] H. Knoche, J. McCarthy, and M. A. Sasse, “How low can yougo? The effect of low resolutions on shot types in mobile TV,”Multimedia Tools and Applications, vol. 36, no. 1-2, pp. 145–166, 2008.
[11] ITU-T P.911 Recommendation P.911, “Subjective audiovisualquality assessment methods for multimedia application,”International Telecommunication Union - Telecommunica-tion sector, 1998.
[12] G. Ghinea and J. P. Thomas, “QoS impact on user perceptionand understanding of multimedia video clips,” in Proceedingsof the 6th ACM International Conference on Multimedia(MULTIMEDIA ’98), pp. 49–54, Bristol, UK, September 1998.
[13] S. R. Gulliver, T. Serif, and G. Ghinea, “Pervasive andstandalone computing: the perceptual effects of variable mul-timedia quality,” International Journal of Human Computer-Studies, vol. 60, no. 5-6, pp. 640–665, 2004.
[14] J. D. McCarthy, M. A. Sasse, and D. Miras, “Sharp or smooth?:comparing the effects of quantization vs. frame rate forstreamed video,” in Proceedings of the SIGCHI Conference onHuman Factors in Computing Systems (CHI ’04), pp. 535–542,Vienna, Austria, April 2004.
[15] K. Nahrstedt and R. Steinmetz, “Resource management innetworked multimedia systems,” Computer, vol. 28, no. 5, pp.52–63, 1995.
[16] G. Wikstrand, Improving user comprehension and entertain-ment in wireless streaming media: introducing cognitive qualityof service, Ph.D. thesis, Department of Computer Science,Umea University, Umea, Sweden, 2003.
[17] S. R. Gulliver and G. Ghinea, “Defining user perceptionof distributed multimedia quality,” ACM Transactions onMultimedia Computing, Communications and Applications,vol. 2, no. 4, pp. 241–257, 2006.
[18] S. Jumisko-Pyykko, M. V. Vinod Kumar, M. Liinasuo, andM. M. Hannuksela, “Acceptance of audiovisual quality inerroneous television sequences over a DVB-H channel,” inProceedings of the 2nd International Workshop in Video Process-ing and Quality Metrics for Consumer Electronics, Scottsdale,Ariz, USA, January 2006.
[19] S. Jumisko-Pyykko and J. H”akkinen, “Evaluation of subjec-tive video quality of mobile devices,” in Proceedings of the

S. Jumisko-Pyykko et al. 19
13th Annual ACM International Conference on Multimedia(MULTIMEDIA ’05), pp. 535–538, Singapore, November2005.
[20] S. Winkler and C. Faller, “Audiovisual quality evaluation oflow-bitrate video,” in Human Vision and Electronic Imaging X,vol. 5666 of Proceedings of SPIE, pp. 139–148, San Jose, Calif,USA, January 2005.
[21] H. Knoche, H. de Meer, and D. Kirsh, “Extremely economical:how key frames affect consonant perception under differentaudio-visual skews,” in Proceedings of the 16th World Congresson Ergonomics (IEA ’06), Maastricht, The Netherlands, July2006.
[22] M. M. Hannuksela, V. K. Malamal Vadakital, and S.Jumisko-Pyykko, “Synchronized audio redundancy codingfor improved error resilience in streaming over DVB-H,” inProceedings of the 3rd International Mobile Multimedia Com-munications Conference (MobiMedia ’07), Nafpaktos, Greece,August 2007.
[23] M. M. Hannuksela, V. K. Malamal Vadakital, and S. Jumisko-Pyykko, “Comparison of error protection methods for audio-video broadcast over DVB-H,” EURASIP Journal on Advancesin Signal Processing, vol. 2007, Article ID 71801, 12 pages,2007.
[24] N. Ravaja, K. Kallinen, T. Saari, and L. Keltikangas-J”arvinen,“Suboptimal exposure to facial expressions when viewingvideo messages from a small screen: effects on emotion,attention, and memory,” Journal of Experimental Psychology:Applied, vol. 10, no. 2, pp. 120–113, 2004.
[25] H. O. Knoche, J. D. McCarthy, and M. A. Sasse, “Readingthe fine print: the effect of text legibility on perceived videoquality in mobile tv,” in Proceedings of the 14th Annual ACMInternational Conference on Multimedia (MULTIMEDIA ’06),pp. 727–730, Santa Barbara, Calif, USA, October 2006.
[26] A. Kopke, A. Willig, and H. Karl, “Chaotic maps as parsimo-nious bit error models of wireless channels,” in Proceedings ofthe 22nd Annual Joint Conference of the IEEE Computer andCommunications Societies (INFOCOM ’03), vol. 1, pp. 513–523, San Francisco, Calif, USA, March-April 2003.
[27] A. Willig, M. Kubisch, C. Hoene, and A. Wolisz, “Measure-ments of a wireless link in an industrial environment using anIEEE 802.11-compliant physical layer,” IEEE Transactions onIndustrial Electronics, vol. 49, no. 6, pp. 1265–1282, 2002.
[28] I. S. Reed and G. Solomon, “Polynomial codes over certainfinite fields,” SIAM Journal of Applied Mathematics, vol. 8, no.2, pp. 300–304, 1960.
[29] K. Grill-Spector and R. Malach, “The human visual cortex,”Annual Review of Neuroscience, vol. 27, pp. 649–677, 2004.
[30] M. S. Lewicki, “Efficient coding of natural sounds,” NatureNeuroscience, vol. 5, no. 4, pp. 356–363, 2002.
[31] S. T. Fiske and S. E. Taylor, Social Cognition, McGrow-Hill,Singapore, 1991.
[32] U. Neisser, Cognition and Reality: Principles and Implicationsof Cognitive Psychology, W.H. Freeman, San Francisco, Calif,USA, 1976.
[33] K. Oatley and J. M. Jenkins, Understanding Emotions, Black-well, Oxford, UK, 2003.
[34] S. Jumisko-Pyykko, J. H”akkinen, and G. Nyman, “Expe-rienced quality factors: qualitative evaluation approach toaudiovisual quality,” in Multimedia on Mobile Devices 2007,vol. 6507 of Proceedings of SPIE, 65070M, pp. 1–12, San Jose,Calif, USA, January 2007.
[35] M. C. Meilgaard, G. V. Civille, and B. T. Carr, SensoryEvaluation Techniques, CRC Press, New York, NY, USA, 1999.
[36] R. G. Picard, “Mobile telephony and broadcasting: are theycompatible for consumers,” International Journal of MobileCommunications, vol. 3, no. 1, pp. 19–28, 2005.
[37] R. G. Picard, “Interacting forces in the development ofcommunication technologies,” European Media ManagementReview, vol. 1, no. 1, pp. 18–24, 1998.
[38] F. D. Davis, “Perceived usefulness, perceived ease of use, anduser acceptance of information technology,” MIS Quarterly,vol. 13, no. 3, pp. 319–340, 1989.
[39] V. Venkatesh, M. G. Morris, G. B. Davis, and F. D. Davis, “Useracceptance of information technology: toward a unified view,”MIS Quarterly, vol. 27, no. 3, pp. 425–478, 2003.
[40] M. Amberg, M. Hirschmeier, and J. Wehrmann, “The compassacceptance model for the analysis and evaluation of mobileservices,” International Journal of Mobile Communications, vol.2, no. 3, pp. 248–259, 2004.
[41] E. Kaasinen, User acceptance of mobile services—value, ease ofuse, trust and ease of adoption, Doctoral thesis, VTT Informa-tion Technology, Helsinki, Finland, 2005, VTT publications566.
[42] M. Pagani, “Determinants of adoption of third generationmobile multimedia services,” Journal of Interactive Marketing,vol. 18, no. 3, pp. 46–59, 2004.
[43] G. C. Bruner II and A. Kumar, “Explaining consumeracceptance of handheld Internet devices,” Journal of BusinessResearch, vol. 58, no. 5, pp. 553–558, 2005.
[44] S. Sarker and J. D. Wells, “Understanding mobile handhelddevice use and adoption,” Communications of the ACM, vol.46, no. 12, pp. 35–40, 2003.
[45] R. Aldridge, J. Davidoff, M. Ghanbari, D. Hands, and D.Pearson, “Regency effect in the subjective assessment ofdigitally-coded television pictures,” in Proceedings of the 5thInternational Conference on Image Processing and Its Applica-tions (ICIP ’95), pp. 336–339, Edinburgh, UK, July 1995.
[46] A. D. Baddley, Working Memory, Oxford University Press, NewYork, NY, USA, 1998.
[47] M. Ries, R. Puglia, T. Tebaldi, O. Nemethova, and M.Rupp, “Audiovisual quality estimation for mobile streamingservices,” in Proceedings of the 2nd International Symposium onWireless Communications Systems (ISWCS ’05), pp. 173–177,Siena, Italy, September 2005.
[48] H. Knoche and J. D. McCarthy, “Good news for mobile TV,” inProceedings of the 14th Wireless World Research Forum Meeting(WWRF14), San Diego, Calif, USA, July 2005.
[49] R. P. Aidridge, D. S. Hands, D. E. Pearson, and N. K. Lodge,“Continuous quality assessment of digitally-coded televisionpictures,” IEE Proceedings: Vision, Image and Signal Processing,vol. 145, no. 2, pp. 116–123, 1998.
[50] H. de Ridder and R. Hamberg, “Continuous assessment ofimage quality,” SMPTE Journal, vol. 106, no. 2, pp. 123–128,1997.
[51] R. Hamberg and H. de Ridder, “Time-varying image quality:modeling the relation between instantaneous and overallquality,” SMPTE Journal, vol. 108, no. 11, pp. 802–811, 1999.
[52] A. Bouch and M. A. Sasse, “Case for predictable mediaquality in networked multimedia applications,” in MultimediaComputing and Networking 2000, K. Nahrstedt and W. Feng,Eds., vol. 3969 of Proceedings of SPIE, pp. 188–195, San Jose,Calif, USA, January 2000.
[53] D. S. Hands and S. E. Avons, “Recency and duration neglectin subjective assessment of television picture quality,” AppliedCognitive Psychology, vol. 15, no. 6, pp. 639–657, 2001.

20 International Journal of Digital Multimedia Broadcasting
[54] R. T. Apteker, J. A. Fisher, V. S. Kisimov, and H. Neishlos,“Video acceptability and frame rate,” IEEE Multimedia, vol. 2,no. 3, pp. 32–40, 1995.
[55] D. Wijesekera, J. Srivastava, A. Nerode, and M. Foresti,“Experimental evaluation of loss perception in continuousmedia,” Multimedia Systems, vol. 7, no. 6, pp. 486–499, 1999.
[56] R. Steinmetz, “Human perception of jitter and media synchro-nization,” IEEE Journal on Selected Areas in Communications,vol. 14, no. 1, pp. 61–72, 1996.
[57] N. Kitawaki, Y. Arayama, and T. Yamada, “Multimedia opinionmodel based on media interaction of audiovisual commu-nications,” in Proceedings of the 4th International Conferenceon Measurement of Speech and Audio Quality in Networks(MESAQIN ’05), pp. 5–10, Prague, Czech Republic, June 2005.
[58] A. Watson and M. A. Sasse, “The good, the bad, and the muf-fled: the impact of different degradations on Internet speech,”in Proceedings of the 8th ACM International Conference onMultimedia (MULTIMEDIA ’00), pp. 269–276, Los Angeles,Calif, USA, October-November 2000.
[59] R. Pastrana, J. Gicquel, C. Colomes, and H. Cherifi, “SporadicSignal Loss Impact on Auditory Quality Perception,” 2004,http://wireless.feld.cvut.cz/mesaqin2004/contributions.html.
[60] R. R. Pastrana-Vidal, J. C. Gicquel, C. Colomes, and H. Cherifi,“Sporadic frame dropping impact on quality perception,”in Human Vision and Electronic Imaging IX, vol. 5292 ofProceedings of SPIE, pp. 182–193, San Jose, Calif, USA, January2004.
[61] ITU-R BT.500-11, “Methodology for the subjective assessmentof the quality of television pictures,” International Telecom-munications Union - Radiocommunication sector, 2002.
[62] E. M. Rogers, Diffusion of Innovations, Free Press, New York,NY, USA, 5th edition, 2003.
[63] A. Watson and M. A. Sasse, “Measuring perceived quality ofspeech and video in multimedia conferencing applications,”in Proceedings of the 6th ACM International Conference onMultimedia (MULTIMEDIA ’98), pp. 55–60, Bristol, UK,September 1998.
[64] A. Watson and M. A. Sasse, “Evaluating audio and video qual-ity in low-cost multimedia conferencing systems,” Interactingwith Computers, vol. 8, no. 3, pp. 255–275, 1996.
[65] C. Carlsson and P. Walden, “Mobile TV—to live or die by con-tent,” in Proceedings of the 40th Annual Hawaii InternationalConference on System Sciences (HICSS ’07), p. 51, Waikoloa,Hawaii, USA, January 2007.
[66] C. Sodergard, Ed., “Mobile television—technology and userexperiences,” VTT Publications 506, VTT Information Tech-nology, Espoo, Finland, 2003.
[67] ETSI, “Digital Video Broadcasting (DVB); Specification forthe use of video and audio coding in DVB services delivereddirectly over IP,” ETSI standard, ETSI TS 102 005 V1.2.0, 2005.
[68] G. Faria, J. A. Henriksson, E. Stare, and P. Talmola, “DVB-H:digital broadcast services to handheld devices,” Proceedings ofthe IEEE, vol. 94, no. 1, pp. 194–209, 2006.
[69] ETSI, “Digital Video Broadcasting (DVB): Transmission sys-tems for handheld terminals,” ETSI standard, EN 302 304V1.1.1, 2004.
[70] ETSI, “Digital Video Broadcasting (DVB): DVB specificationfor data broadcasting,” ETSI standard, EN 301 192 V1.4.1,2004.
[71] ITU-T P.920, “Interactive test methods for audiovisual com-munications,” International Telecommunications Union -Telecommunication sector, 2002.
[72] H. Coolican, Research Methods and Statistics in Psychology, J.W. Arrowsmith, London, UK, 4th edition, 2004.
[73] E. A. Styles, The Psychology of Attention, Psychology Press,Hove, UK, 1997.
[74] U. Reiter and S. Jumisko-Pyykko, “Watch, press, and catch—impact of divided attention on requirements of audiovisualquality,” in Proceedings of the 12th International Conference onHuman-Computer Interaction (HCI ’07), pp. 943–952, Beijing,China, July 2007.
[75] V. K. Malamal Vadakital, M. M. Hannuksela, M. Rezaei, andM. Gabbouj, “Method for unequal error protection in DVB-H for mobile television,” in Proceedings of the 17th IEEEInternational Symposium on Personal, Indoor and Mobile RadioCommunications (PIMRC ’06), pp. 1–5, Helsinki, Finland,September 2006.
[76] S. Jumisko-Pyykko, M. V. Vinod Kumar, and J. Korhonen,“Unacceptability of instantaneous errors in mobile televi-sion: from annoying audio to video,” in Proceedings of the8th International Conference on Human-Computer Interactionwith Mobile Devices and Services (MobileHCI ’06), pp. 1–8,Helsinki, Finland, September 2006.
[77] R. M. Hogarth and H. J. Einhorn, “Order effects in beliefupdating: the belief-adjustment model,” Cognitive Psychology,vol. 24, no. 1, pp. 1–55, 1992.

International Journal of
AerospaceEngineeringHindawi Publishing Corporationhttp://www.hindawi.com Volume 2010
RoboticsJournal of
Hindawi Publishing Corporationhttp://www.hindawi.com Volume 2014
Hindawi Publishing Corporationhttp://www.hindawi.com Volume 2014
Active and Passive Electronic Components
Control Scienceand Engineering
Journal of
Hindawi Publishing Corporationhttp://www.hindawi.com Volume 2014
International Journal of
RotatingMachinery
Hindawi Publishing Corporationhttp://www.hindawi.com Volume 2014
Hindawi Publishing Corporation http://www.hindawi.com
Journal ofEngineeringVolume 2014
Submit your manuscripts athttp://www.hindawi.com
VLSI Design
Hindawi Publishing Corporationhttp://www.hindawi.com Volume 2014
Hindawi Publishing Corporationhttp://www.hindawi.com Volume 2014
Shock and Vibration
Hindawi Publishing Corporationhttp://www.hindawi.com Volume 2014
Civil EngineeringAdvances in
Acoustics and VibrationAdvances in
Hindawi Publishing Corporationhttp://www.hindawi.com Volume 2014
Hindawi Publishing Corporationhttp://www.hindawi.com Volume 2014
Electrical and Computer Engineering
Journal of
Advances inOptoElectronics
Hindawi Publishing Corporation http://www.hindawi.com
Volume 2014
The Scientific World JournalHindawi Publishing Corporation http://www.hindawi.com Volume 2014
SensorsJournal of
Hindawi Publishing Corporationhttp://www.hindawi.com Volume 2014
Modelling & Simulation in EngineeringHindawi Publishing Corporation http://www.hindawi.com Volume 2014
Hindawi Publishing Corporationhttp://www.hindawi.com Volume 2014
Chemical EngineeringInternational Journal of Antennas and
Propagation
International Journal of
Hindawi Publishing Corporationhttp://www.hindawi.com Volume 2014
Hindawi Publishing Corporationhttp://www.hindawi.com Volume 2014
Navigation and Observation
International Journal of
Hindawi Publishing Corporationhttp://www.hindawi.com Volume 2014
DistributedSensor Networks
International Journal of