accountingassignment2 (1)
TRANSCRIPT
SCHOOL OF ARCHITECTURE, BUILDING AND DESIGN
Centre for Modern Architecture Studies in Southeast Asia
Foundation of Natural and Built Environments (FNBE)
Basic Accounting [ACC30205/FNBE0145]Prerequisite: None
Lecturer: Chang Jau Ho
Assignment: Financial Ratio Analysis
Submission: by 12pm, Friday, 4th June 2015 (Week 16)
Kiraly Renaud 0320322
Lam Wee Wee 0320129
Nur Iman Bin Mohd Zahari 0321736
COMPANY BACKGROUNDTOYOTA MOTOR CORPORATION is an automotive company that based in Japan. It was founded by Kiciro Toyoda in 1937 as a result from his father company. Toyota is the most famous automotive brand in Japan as the company was ranked the twelfth- largest company in the world .Toyota was the top brand name of the automotive, ahead from Volkswagen Group and General Motors by its production. It’s produced 5.5 million units worldwide which is equivalent to produce 1 unit of the car in 6 seconds. The company made named when they created their first product, the type A engine in 1934 .and their first passenger car in 1936. There are 5 brand names of car that are produced under Toyota Motor Corporation which include Lexus , Hino , Toyota and Ranz.The vision of Toyota Motor Corporation is to lead the way to the future of mobility , enriching lives around the world with the safest and most responsible ways of moving people .
Recent Developments
On 15 May 2015, Toyota Motor Corp said that it is recalling 637,000 vehicles in the United States as part of massive expansion of global recall to replace potentially defective air bag that could burst, with metal fragments sending shrapnel into the vehicle occupants. Document posted by the National Highway Traffic Safety Administration(NHTSA) and air bag supplied by Takata Corp with the effort of Toyota in helping them.
To raise up to 500 billion yen,Toyota Motor Corp have issued up to 50 million first class series of Class AA shares through public offering on 28 April 2015. Stating that the issue period will last for 1 year starting from May 9 2015 to May 8 2016. The money with then used for development of fuel cell electric vehicle, infrastructure research.
Furthermore, Toyota Motor Corp have announced that they have agreed to cooperate with Mazda Motor as their business alliance to work on environmental technology and advanced safety technology.
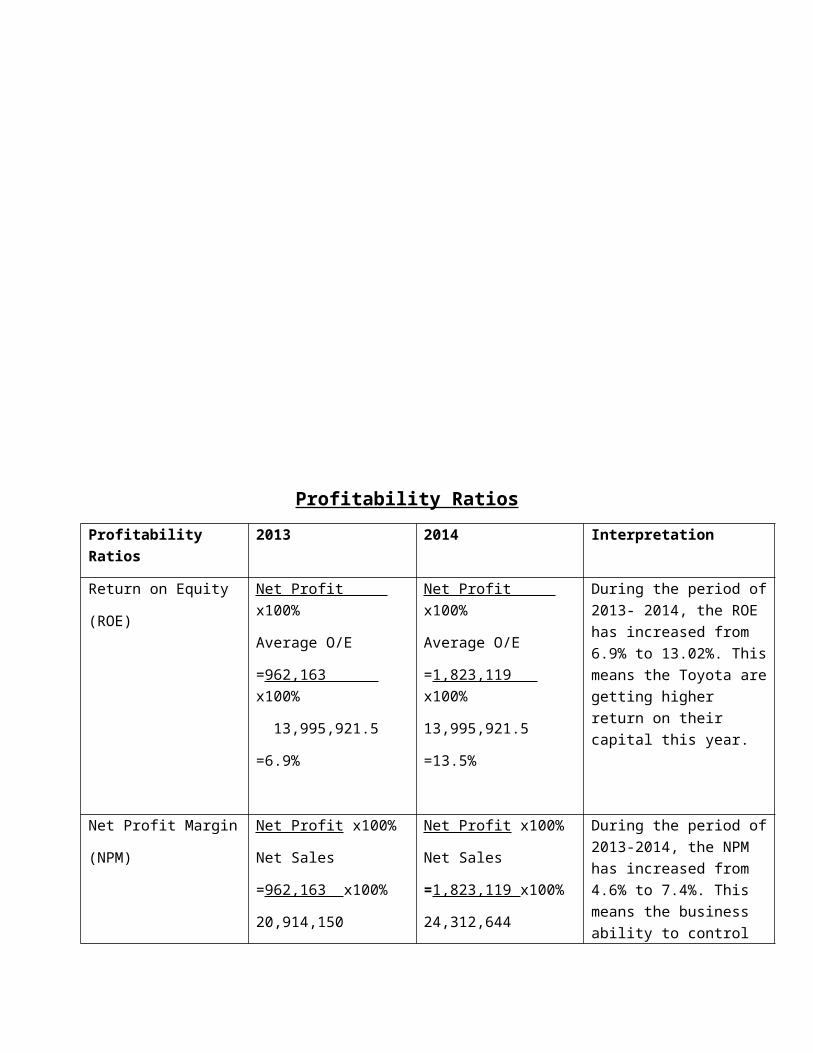
Profitability Ratios
Profitability Ratios 2013 2014 Interpretation
Return on Equity
(ROE)
Net Profit x100%
Average O/E
=962,163 x100%
13,995,921.5
=6.9%
Net Profit x100%
Average O/E
=1,823,119 x100%
13,995,921.5
=13.5%
During the period of 2013- 2014, the ROE has increased from 6.9% to 13.02%. This means the Toyota are getting higher return on their capital this year.
Net Profit Margin
(NPM)
Net Profit x100%
Net Sales
=962,163 x100%
20,914,150
=4.6%
Net Profit x100%
Net Sales
=1,823,119 x100%
24,312,644
=7.4%
During the period of 2013-2014, the NPM has increased from 4.6% to 7.4%. This means the business ability to control overall expense has improved.
Gross Profit Margin
(GPM)
Gross Profit x100%
Net Sales
=4,053,623 x100%
20,914,150
=19.4%
Gross Profit x100%
Net Sales
=5,703,666 x100%
24,312,644
=23.5%
During the period of 2013-2014, the GPM has increase from 19.4% to 23.5%. This means the business ability to control Cost of goods sold expenses has improved
Selling Expense Ratio
(SER)
Selling Expense x100%
Net Sales
=1,051,154.5 x100%
20,914,150
=5.03%
Selling Expense x100%
Net Sales
=1,299,330 x100%
24,312,644
=5.3%
During the period of 2013-2014, the SER has increased from 5.03% to 5.3%. This means the business ability to control the SER is slightly worsening.
General Expense Ratio
(GER)
General Expense x100%
Net Sales
=1,051,154.5 x100%
General Expense x100%
Net Sales
=1,299,330 x100%
During the period of 2013 – 2014, the GER has increased from 5.03% to 5.3%. This means the business ability to control the GER is slightly
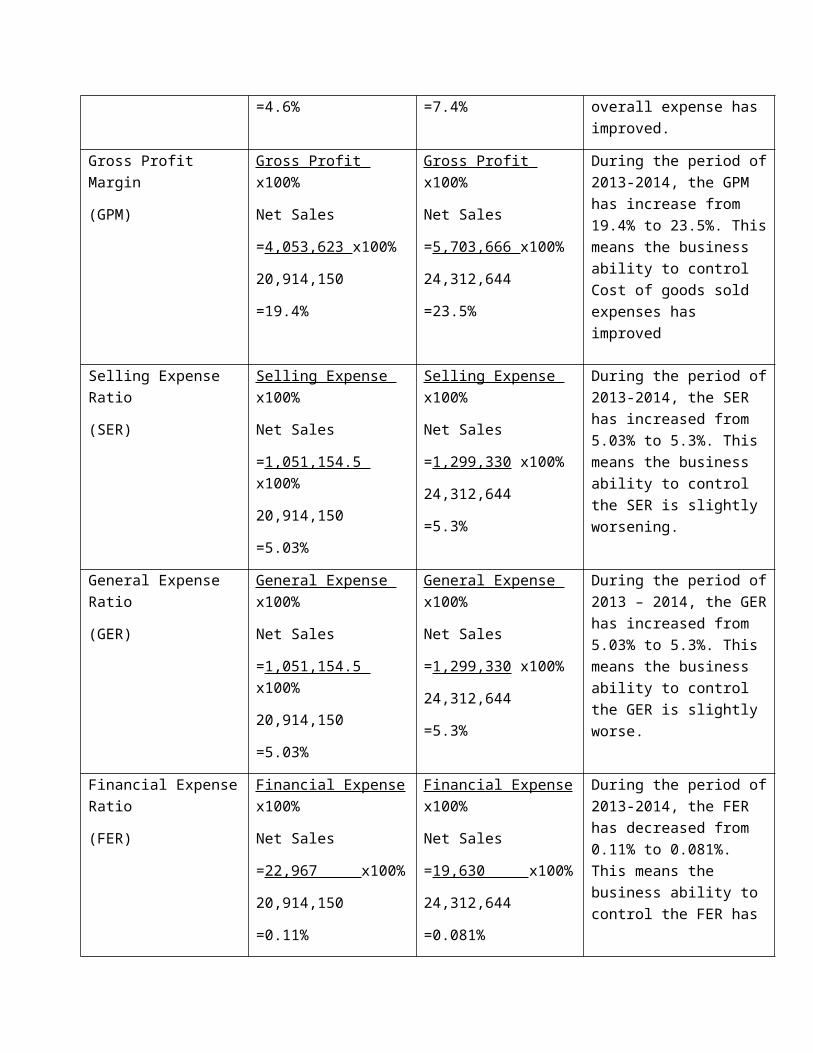
20,914,150
=5.03%
24,312,644
=5.3%
worse.
Financial Expense Ratio
(FER)
Financial Expense x100%
Net Sales
=22,967 x100%
20,914,150
=0.11%
Financial Expense x100%
Net Sales
=19,630 x100%
24,312,644
=0.081%
During the period of 2013-2014, the FER has decreased from 0.11% to 0.081%. This means the business ability to control the FER has increased.
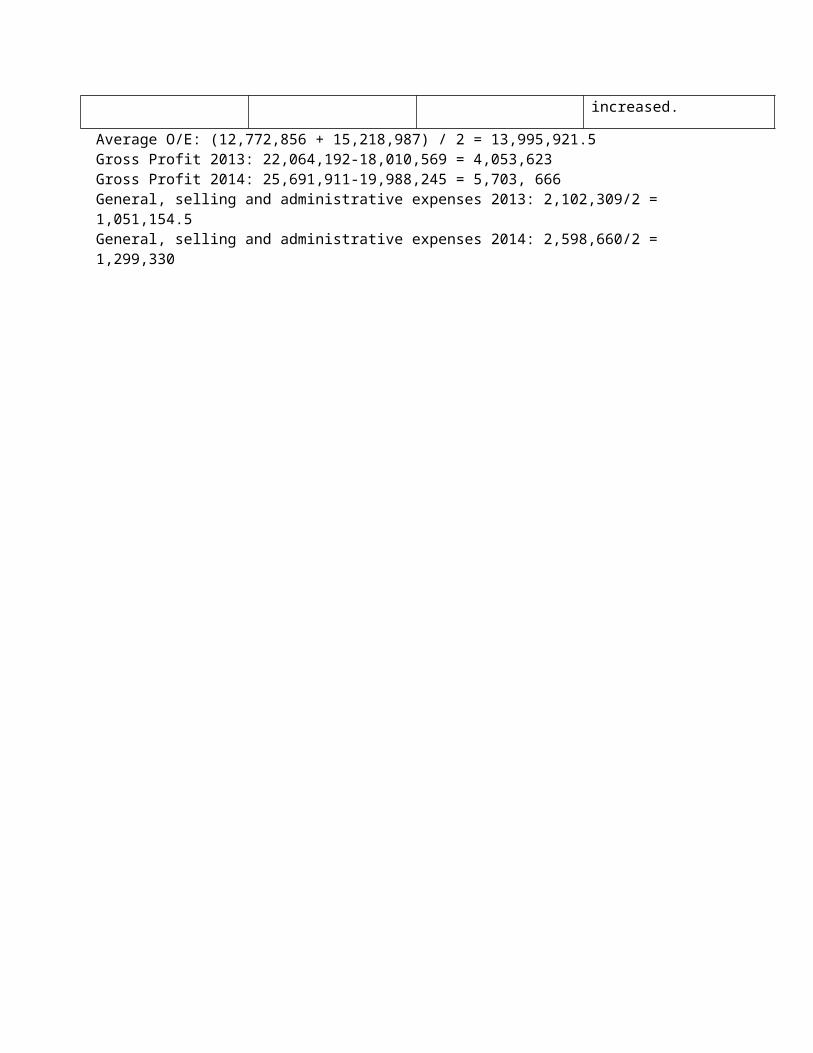
Average O/E: (12,772,856 + 15,218,987) / 2 = 13,995,921.5Gross Profit 2013: 22,064,192-18,010,569 = 4,053,623Gross Profit 2014: 25,691,911-19,988,245 = 5,703, 666General, selling and administrative expenses 2013: 2,102,309/2 = 1,051,154.5General, selling and administrative expenses 2014: 2,598,660/2 = 1,299,330
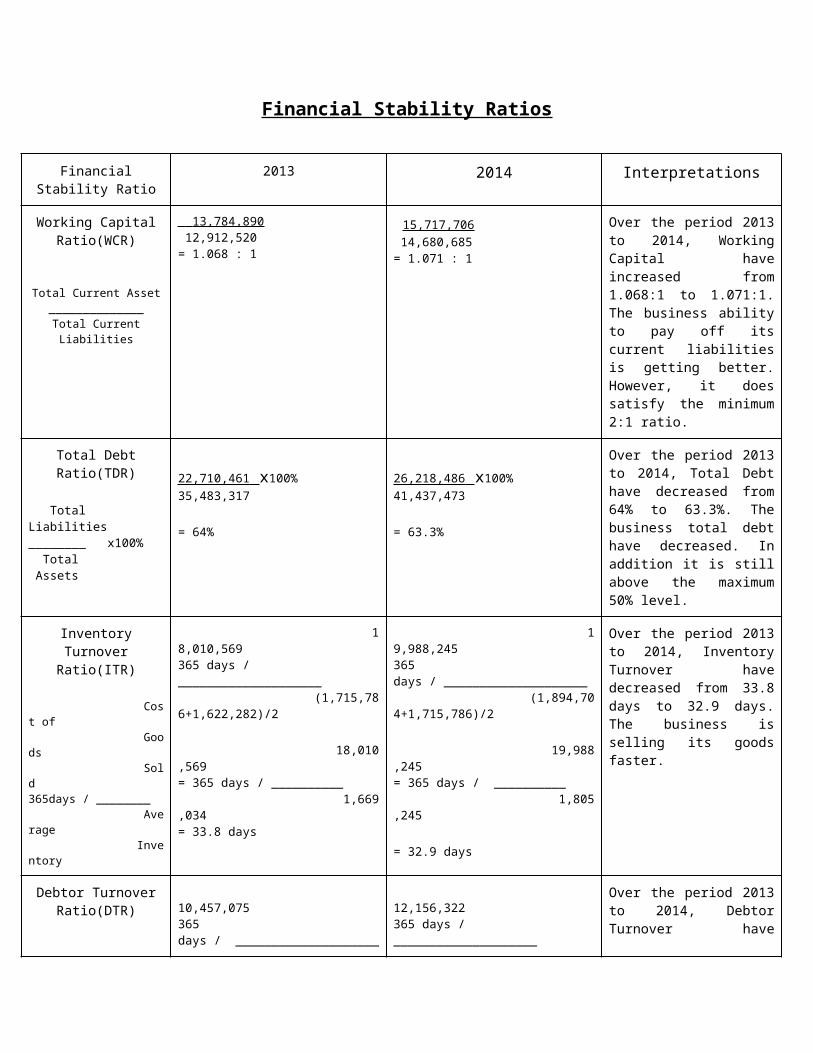
Financial Stability Ratios
Financial Stability Ratio
2013 2014 Interpretations
Working CapitalRatio(WCR)
Total Current Asset______________
Total Current Liabilities
13,784,890 12,912,520= 1.068 : 1
15,717,706 14,680,685= 1.071 : 1
Over the period 2013 to 2014, Working Capital have increased from 1.068:1 to 1.071:1. The business ability to pay off its current liabilities is getting better. However, it does satisfy the minimum 2:1 ratio.
Total Debt Ratio(TDR)
TotalLiabilities________ x100% Total Assets
22,710,461 x100%35,483,317
= 64%
26,218,486 x100%41,437,473
= 63.3%
Over the period 2013 to 2014, Total Debt have decreased from 64% to 63.3%. The business total debt have decreased. In addition it is still above the maximum 50% level.
Inventory Turnover Ratio(ITR)
Cost of Goods Sold365days / ________ Average Inventory
18,010,569365 days / ____________________ (1,715,786+1,622,282)/2
18,010,569= 365 days / __________ 1,669,034= 33.8 days
19,988,245365 days / ____________________ (1,894,704+1,715,786)/2
19,988,245= 365 days / __________ 1,805,245
= 32.9 days
Over the period 2013 to 2014, Inventory Turnover have decreased from 33.8 days to 32.9 days. The business is selling its goods faster.
Debtor Turnover Ratio(DTR)
Credit Sales365days / ________ Average Debtors
10,457,075365 days / ____________________ (1,971,659+1,999,827)/2
10,457,075= 365 days / _________ 1,085,743= 38 days
12,156,322365 days / ____________________ (2,041,232+1,971,659)/2
12,156,322= 365 days / _________ 2,006,445.5
= 59.8 days
Over the period 2013 to 2014, Debtor Turnover have increased from 38 days to 59.8 days. The business is taking a longer to collect off their debts.
Interest Coverage Ratio(ICR)
Interest Expense +Net Profit________________Interest Expense
22,967+962,163_______________ 22,967
= 42.9 times
19,630+1,823,119_______________ 19,630
= 93.9 times
Over the period 2013 to 2014, Interest coverage have increased from 42.9 times to 93.9 times. The business ability to pay off its interest is getting better. In addition, it satisfy the minimum requirement of 5 times.
Price/Earnings Ratio
P/E= Current Share Price
Earnings per share
= 116.55
11.17
=10.43
The ratio measures how expensive a share is. The higher the P/E ratio, the more expensive it is.
The P/E ratio for Toyota Motors is 10.43 therefor we say that it will take investors 10.43 years to recoup their investment.

Investment Recommendations
A) ProfitabilityFrom the information we gathered about profitability investing in Toyota Motors Corporation for the period of 2013 to 2014 is beneficial. This is because based on the profitability ratios the business has improved. The return on equity shows an increase of 6.9% - 13.5% which means that Toyota Motors owners are getting a higher return on their capital during that period. Also the businesses ability to control its overall expenses has improved. The Net Profit Margin has increased from 4.6% to 7.4% giving a rise of 2.8%. The Gross Profit Margin has also made an improvement of 4.1% meaning that the businesses has improved at controlling its Cost of Goods Sold expenses. On the other hand the Selling expense ratio and General Expense ratio haven’t done quite well, both showing an increase during that period. But it is only a slight increase of 0.27%. This means the business hasn’t worsened by a large margin. And lastly the Financial Expense Ratio has improved compared to the previous year from 0.11% to 0.081%.This is a decrease of 0.029% and will result in a higher Net Profit Margin.
B) StabilityToyota Motors Corporation demonstrates small signs of being financially stable. During the period of 2013 to 2014 the Working Capital Ratio has increased from 1.068:1 to 1.071:1. This shows a slight improvement albeit does not satisfy the minimum 2 : 1 ratio. The Total Debt Ratio also shows improvement as there is a decrease from 64%-63.3% as well as exceeding the maximum 50% limit we believe that this does not hinder its stability. The Inventory Turnover Ratio proves that the business is selling its goods faster (33.8 days previously to 32.9 days currently), the Debtor Turnover Ratio shows that the business is collecting its debt by a margin of 21.8 days (38 days to 59.8 days. Toyota is taking longer to collecting its debt. And finally the Interest coverage Ratio has increased from 42.9 times to 93.9 times in addition it exceeds the minimum requirement 5 times.
C) PriceToyota Motors Corporations share price is considerably cheap.
To conclude from all the information gathered and compiled investors are encouraged to invest in this company seeing as it shows good profitability, signs of financial stability and the share prices are not exaggerated.

Appendix


REFERENCES

http://www.toyota-global.com/innovation/environmental_technology/hv-record/
http://topics.nytimes.com/top/news/business/companies/toyota_motor_corporation/index.html
http://en.wikipedia.org/wiki/Toyota
http://www.reuters.com/finance/stocks/TM/key-developments