acetyl bromide soluble lignin (absl) assay for total ... 2017 acetyl... · acetyl bromide soluble...
TRANSCRIPT

1
www.bio-protocol.org/e2149 Vol 7, Iss 05, Mar 05, 2017 DOI:10.21769/BioProtoc.2149
Acetyl Bromide Soluble Lignin (ABSL) Assay for Total Lignin Quantification from Plant Biomass
William J. Barnes1, 2 and Charles T. Anderson1, 2, *
1Department of Biology, The Pennsylvania State University, University Park, PA, USA; 2Center for
Lignocellulose Structure and Formation, The Pennsylvania State University, University Park, PA, USA
*For correspondence: [email protected]
[Abstract] Lignin is the second most abundant biopolymer on Earth, providing plants with mechanical
support in secondary cell walls and defense against abiotic and biotic stresses. However, lignin also
acts as a barrier to biomass saccharification for biofuel generation (Carroll and Somerville, 2009; Zhao
and Dixon, 2011; Wang et al., 2013). For these reasons, studying the properties of lignin is of great
interest to researchers in agriculture and bioenergy fields. This protocol describes the acetyl bromide
method of total lignin extraction and quantification, which is favored among other methods for its high
recovery, consistency, and insensitivity to different tissue types (Johnson et al., 1961; Chang et al., 2008;
Moreira-Vilar et al., 2014; Kapp et al., 2015). In brief, acetyl bromide digestion causes the formation of
acetyl derivatives on free hydroxyl groups and bromide substitution of α-carbon hydroxyl groups on the
lignin backbone to cause a complete solubilization of lignin, which can be quantified using known
extinction coefficients and absorbance at 280 nm (Moreira-Vilar et al., 2014). Keywords: Lignin, Biochemical measurement, Plant biomass, Acetyl bromide, Plant cell walls
[Background] The acetyl bromide method for quantification of lignin from plant biomass has been used
to accurately measure total lignin content for decades (Johnson et al., 1961). Recently, this method has
gained support as an optimal procedure for lignin quantification, as opposed to the alternative
thioglycolic acid and Klason lignin methods (Moreira-Vilar et al., 2014). Comparison of these three
methods has empirically shown that the acetyl bromide method consistently results in the highest
recovery of lignin, and is insensitive to tissue type, extent of lignification, and lignin composition (Moreira-
Vilar et al., 2014). In our previous work (Kapp et al., 2015), we adapted the scale of the acetyl bromide
assay to facilitate a rapid, small-scale determination of lignin that uses a small amount of alcohol
insoluble residue (AIR) derived from Brachypodium distachyon, based on a protocol described in the
‘Microscale Method for Cuvettes’ method detailed by Chang et al. (2008). The protocol described below
can be performed with standard laboratory equipment and requires 5-9 days total after harvesting plant
material, which can be derived from a variety of tissues or developmental stages.

2
www.bio-protocol.org/e2149 Vol 7, Iss 05, Mar 05, 2017 DOI:10.21769/BioProtoc.2149
Materials and Reagents
1. Personal protective equipment (PPE; these should be worn at all times when dealing with
concentrated acids and alkali. see Note 1)
a. Safety glasses
b. Lab coat
c. Gloves
2. Pipette tips
3. Pipette set
4. Ice bucket
5. 2 ml Sarstedt tubes (SARSTEDT, catalog number: 72.694.007)
6. Plant material or cell wall preparation of choice
7. Liquid nitrogen
8. Acetone, ≥ 99.5% (EMD Millipore, catalog number: AX0120)
9. Lugol’s Iodine staining solution (Sigma-Aldrich, catalog number: 32922)
10. 1.5 N sodium hydroxide (NaOH, strong base), ≥ 97% (Fisher Scientific, catalog number: BP359-
500)
11. 0.5 M hydroxylamine hydrochloride (strong reducing agent; store in Drierite container, make
fresh in water), 98% (Sigma-Aldrich, catalog number: 255580)
12. Chloroform, ≥ 99.5% (Sigma-Aldrich, catalog number: C2432)
13. Methanol, ≥ 99.8% (Fisher Scientific, catalog number: A412P)
14. Deionized water
15. Ethanol, 100%, 200 proof (Decon Labs, catalog number: V1001)
16. Acetyl bromide (strong acid, violently reacts with water; dilute in acetic acid), 99% (Sigma-
Aldrich, catalog number: 135968)
17. Glacial acetic acid, ≥ 99.7% (EMD Millipore, catalog number: AX0073)
18. DMSO (Dimethyl sulfoxide), ≥ 99.9% (Sigma-Aldrich, catalog number: 276855)
19. Chloroform-methanol mixture (see Recipes)
20. 70% ethanol (see Recipes)
21. 25% acetyl bromide (see Recipes)
22. 90% DMSO (see Recipes)
Equipment
1. -80 °C freezer 2. Wiley Mini-Mill (Thomas Scientific, catalog number: 3383L10)
3. Cryogenic-compatible containers 4. CryoMill ball mill along with all sizes of steel balls, grinding jars, safety valves, and Autofill
(Retsch, catalog numbers: 20.749.0001; 02.480.0002)

3
www.bio-protocol.org/e2149 Vol 7, Iss 05, Mar 05, 2017 DOI:10.21769/BioProtoc.2149
5. Microcentrifuge capable of spinning at 10,000 x g (e.g., Eppendorf, catalog number: 5424)
6. Chemical hood 7. Platform rocker (VWR, catalog number: 12620-906)
8. 10 ml glass graduated cylinder (Kimble Chase Life Science and Research Products, catalog
number: 20024D-10)
9. NanoDrop 2000C spectrophotometer, or other UV-Vis (Thermo Fisher Scientific, Thermo
ScientificTM, model: ND-2000C-PC)
10. Quartz cuvette, 0.7 ml volume (Sigma-Aldrich, catalog number: Z600199)
11. Pipette 12. Water bath or incubator capable of reaching 70 °C (e.g., VWR, catalog number: 89032-216)
13. Analytical balance (Mettler Toledo, Excellence Series)
14. Vortex mixer (VWR, catalog number: 58816-123)
15. Tissue lyophilizer (4.5 Liter Freeze Dry Freeze Dryer) (Labconco, catalog number: 7750020)
16. Solid cap with PTFE Liner 15 mm, for 7 ml glass screw-cap vial (Sigma-Aldrich, catalog number:
27152)
17. Optional: Glass beads (Kimble Chase Life Science and Research Products, catalog number:
13500-4)
18. Optional: Reacti-Therm Heating and Stirring Module (Thermo Fisher Scientific, Thermo
ScientificTM, catalog number: TS-18823)
Procedure A. Plant material preparation (requires 2-4 d after harvesting of tissue)
1. After harvesting approximately 5 g (fresh weight) of desired tissue for lignin content
determination, flash freeze in liquid nitrogen and store at -80 °C for at least 1 h until use.
2. Lyophilize tissue until completely dry; duration of lyophilization often depends on tissue density,
but commonly takes at least 24 h and up to 72 h for complete drying.
3. Grind freeze-dried tissue to pass through a 60-mesh screen using a Wiley Mini-Mill. Wiley Mini-
Mills are equipped to grind dried samples ranging from long, thin Arabidopsis stems (several
mm thick) to thicker woody tissues (~1 cm).
4. Transfer coarsely-ground samples to cryogenic-compatible containers with steel balls (leave 1/3
of the container empty for air space) and mill using a Retsch CryoMill ball mill with a pre-cooling
cryo setting at 5 Hz for ~3 min, followed by grinding at 5-10 min at 30 Hz. If the sample is not a
homogenously fine powder after this initial grinding, another round of cryogenic milling should
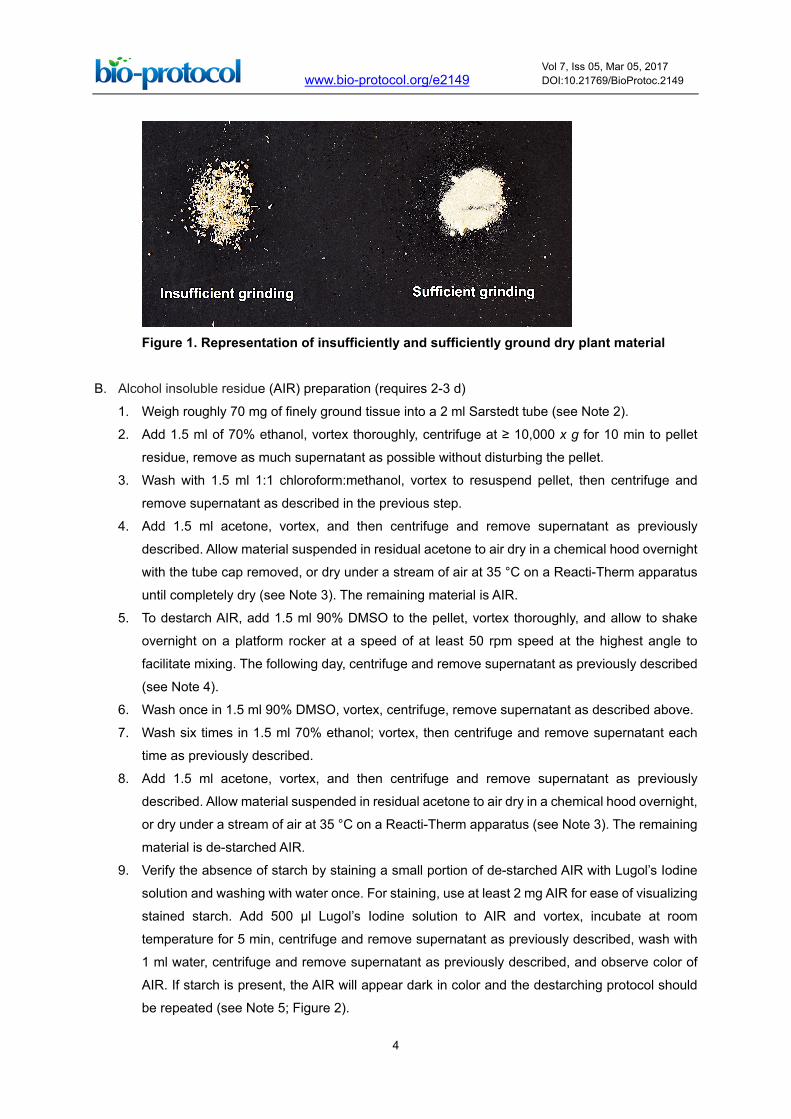
be performed. It is essential to obtain a fine powder with high surface area to facilitate the
complete digestion of lignin present in the AIR (Figure 1). This tissue will be used to prepare
alcohol insoluble residue (AIR).
4
www.bio-protocol.org/e2149 Vol 7, Iss 05, Mar 05, 2017 DOI:10.21769/BioProtoc.2149
Figure 1. Representation of insufficiently and sufficiently ground dry plant material
B. Alcohol insoluble residue (AIR) preparation (requires 2-3 d)
1. Weigh roughly 70 mg of finely ground tissue into a 2 ml Sarstedt tube (see Note 2).
2. Add 1.5 ml of 70% ethanol, vortex thoroughly, centrifuge at ≥ 10,000 x g for 10 min to pellet
residue, remove as much supernatant as possible without disturbing the pellet.
3. Wash with 1.5 ml 1:1 chloroform:methanol, vortex to resuspend pellet, then centrifuge and
remove supernatant as described in the previous step.
4. Add 1.5 ml acetone, vortex, and then centrifuge and remove supernatant as previously
described. Allow material suspended in residual acetone to air dry in a chemical hood overnight
with the tube cap removed, or dry under a stream of air at 35 °C on a Reacti-Therm apparatus
until completely dry (see Note 3). The remaining material is AIR.
5. To destarch AIR, add 1.5 ml 90% DMSO to the pellet, vortex thoroughly, and allow to shake
overnight on a platform rocker at a speed of at least 50 rpm speed at the highest angle to
facilitate mixing. The following day, centrifuge and remove supernatant as previously described
(see Note 4).
6. Wash once in 1.5 ml 90% DMSO, vortex, centrifuge, remove supernatant as described above.
7. Wash six times in 1.5 ml 70% ethanol; vortex, then centrifuge and remove supernatant each
time as previously described.
8. Add 1.5 ml acetone, vortex, and then centrifuge and remove supernatant as previously
described. Allow material suspended in residual acetone to air dry in a chemical hood overnight,
or dry under a stream of air at 35 °C on a Reacti-Therm apparatus (see Note 3). The remaining
material is de-starched AIR.
9. Verify the absence of starch by staining a small portion of de-starched AIR with Lugol’s Iodine
solution and washing with water once. For staining, use at least 2 mg AIR for ease of visualizing
stained starch. Add 500 µl Lugol’s Iodine solution to AIR and vortex, incubate at room
temperature for 5 min, centrifuge and remove supernatant as previously described, wash with
1 ml water, centrifuge and remove supernatant as previously described, and observe color of
AIR. If starch is present, the AIR will appear dark in color and the destarching protocol should
be repeated (see Note 5; Figure 2).

5
www.bio-protocol.org/e2149 Vol 7, Iss 05, Mar 05, 2017 DOI:10.21769/BioProtoc.2149
Figure 2. Image of non-destarched and destarched AIR following staining with Lugol’s Iodine solution
C. Acetyl bromide soluble lignin determination (requires 1-2 d)
1. Weigh out approximately 5 mg of destarched AIR and put into a 7 ml glass screw-cap vial;
record the exact mass. Small aggregates of particulate AIR below ~0.5 mm in diameter will not
affect lignin solubilization as small aggregates should be permeable to the 25% acetyl bromide
due to cryo-milling and will likely disintegrate during digestion. For each biological sample,
perform technical replicates in triplicate.
2. In a chemical hood, prepare 25% acetyl bromide by diluting in glacial acetic acid (see Note 6).
Be sure to wear appropriate PPE and use a glass graduated cylinder for measuring and only
glass containers for all steps involving acetyl bromide.
3. To each glass tube containing destarched AIR, gently add 1 ml of 25% acetyl bromide, swirl
gently to mix AIR into 25% acetyl bromide. Also add 1 ml of 25% acetyl bromide to an empty
glass tube, which will serve as a blank.
4. Put all samples at 70 °C for 1 h with gentle swirling every 10 min (see Note 7).
Note: If using a water bath to fit the large 7 ml tubes, make sure to use a glass secondary
container, such as a tall glass beaker, to prevent the tubes from tipping over.
5. Immediately put samples on ice to cool. While samples are on ice, add 5 ml of glacial acetic
acid and vortex thoroughly in the chemical hood.
6. Allow any residual AIR to settle to the bottom of the glass vials for at least 1 h to overnight at
room temperature. The reaction is complete and stable after the addition of glacial acetic acid
and the absorbance corresponding to ABSL values will not be significantly affected; waiting for
any residue to settle is important because suspended particles may interfere with the accuracy
of the spectrophotometer (see Note 8).
7. Once settled, gently transfer 300 µl from the top of each acetyl bromide solution to a quartz
cuvette while avoiding resuspending any residual AIR. Add 400 µl 1.5 N NaOH, then 300 µl 0.5
M freshly made hydroxylamine hydrochloride. Pipette solutions gently into the cuvette until fully
mixed together after addition of the hydroxylamine hydrochloride (pipette up and down ~15-20
times for thorough mixing, look for complete miscibility of the mixed solutions), and measure
6
www.bio-protocol.org/e2149 Vol 7, Iss 05, Mar 05, 2017 DOI:10.21769/BioProtoc.2149
absorption at 280 nm against a blank on a spectrophotometer immediately after mixing is
complete. The blank consists of the blank acetyl bromide digestion sample mixed with 1.5 N
NaOH and hydroxylamine hydrochloride in the same ratio as previously described. Due to the
utilization of a single quartz cuvette, each sample must be prepared in the cuvette immediately
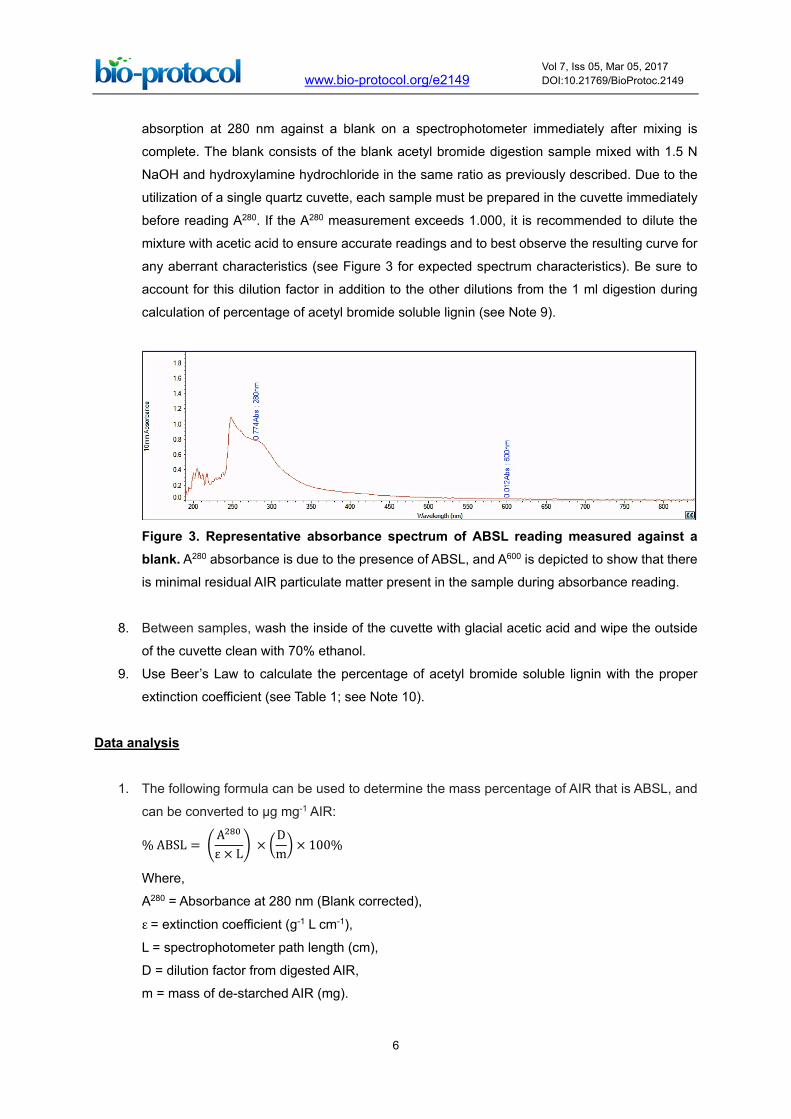
before reading A280. If the A280 measurement exceeds 1.000, it is recommended to dilute the
mixture with acetic acid to ensure accurate readings and to best observe the resulting curve for
any aberrant characteristics (see Figure 3 for expected spectrum characteristics). Be sure to
account for this dilution factor in addition to the other dilutions from the 1 ml digestion during
calculation of percentage of acetyl bromide soluble lignin (see Note 9).
Figure 3. Representative absorbance spectrum of ABSL reading measured against a blank. A280 absorbance is due to the presence of ABSL, and A600 is depicted to show that there
is minimal residual AIR particulate matter present in the sample during absorbance reading.
8. Between samples, wash the inside of the cuvette with glacial acetic acid and wipe the outside
of the cuvette clean with 70% ethanol.
9. Use Beer’s Law to calculate the percentage of acetyl bromide soluble lignin with the proper
extinction coefficient (see Table 1; see Note 10).
Data analysis
1. The following formula can be used to determine the mass percentage of AIR that is ABSL, and
can be converted to µg mg-1 AIR:
% ABSL = �A280
ε × L� × �
Dm� × 100%
Where,
A280 = Absorbance at 280 nm (Blank corrected),
ε = extinction coefficient (g-1 L cm-1),
L = spectrophotometer path length (cm),
D = dilution factor from digested AIR,
m = mass of de-starched AIR (mg).
7
www.bio-protocol.org/e2149 Vol 7, Iss 05, Mar 05, 2017 DOI:10.21769/BioProtoc.2149
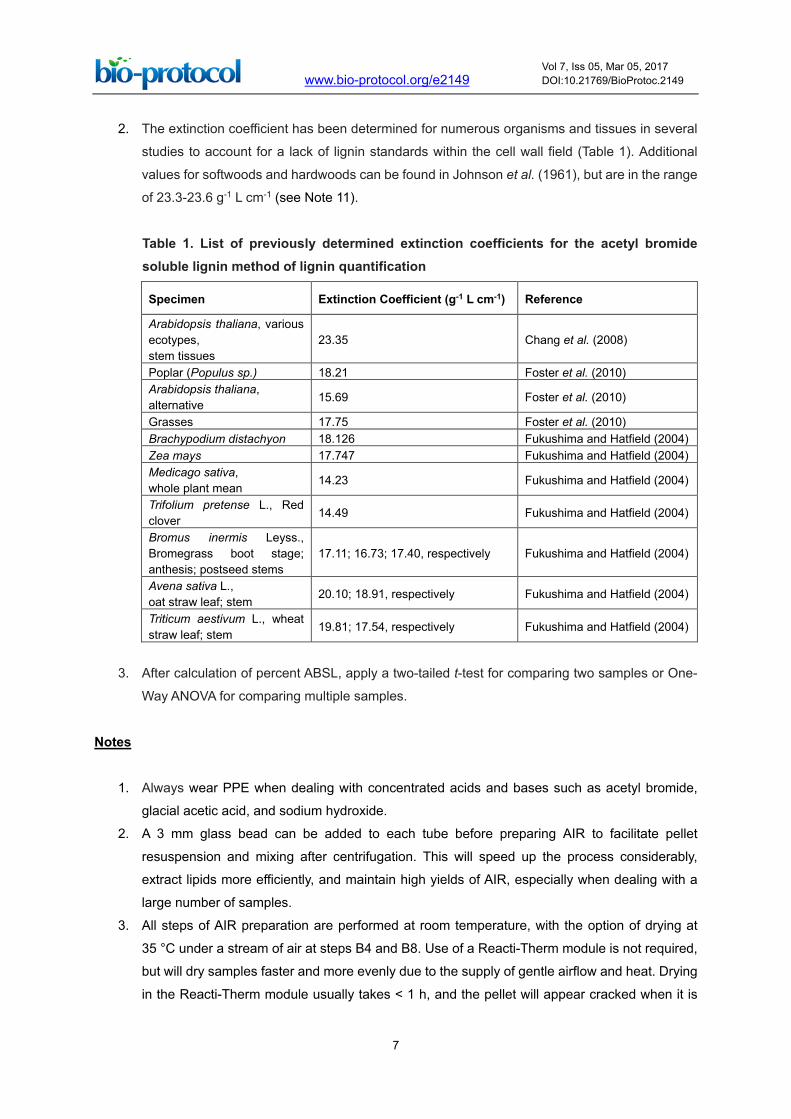
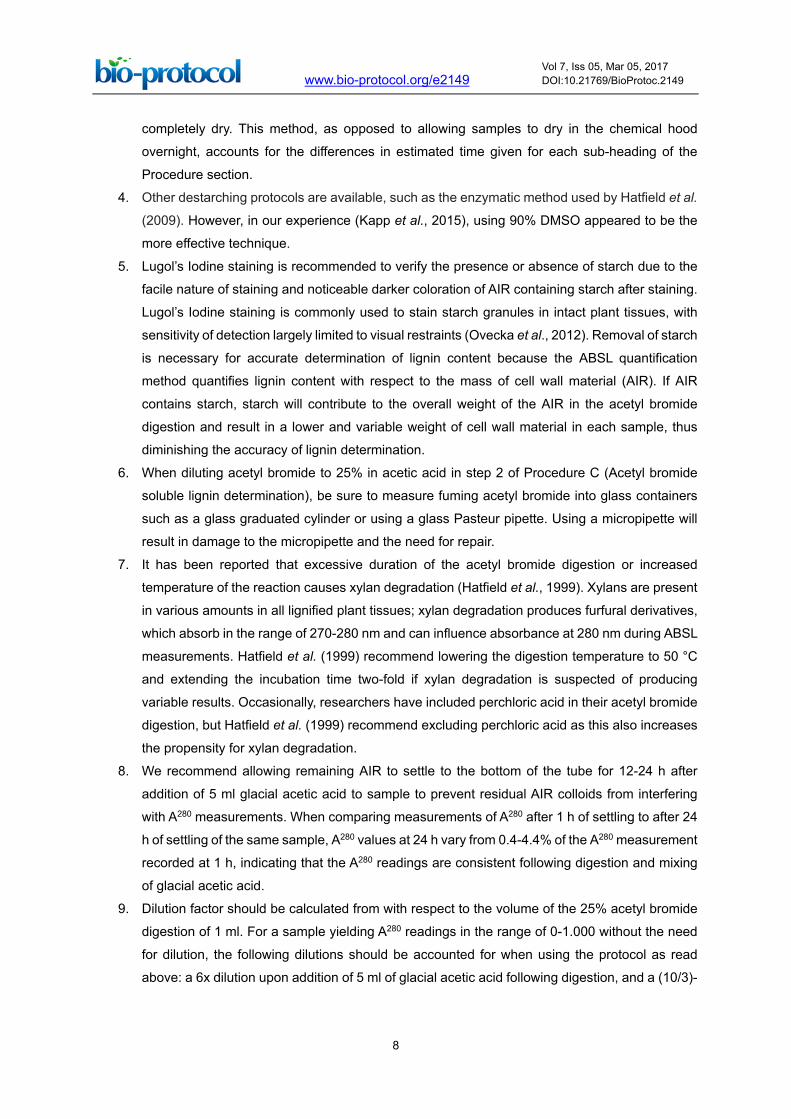
2. The extinction coefficient has been determined for numerous organisms and tissues in several
studies to account for a lack of lignin standards within the cell wall field (Table 1). Additional
values for softwoods and hardwoods can be found in Johnson et al. (1961), but are in the range
of 23.3-23.6 g-1 L cm-1 (see Note 11).
Table 1. List of previously determined extinction coefficients for the acetyl bromide soluble lignin method of lignin quantification
Specimen Extinction Coefficient (g-1 L cm-1) Reference
Arabidopsis thaliana, various ecotypes, stem tissues
23.35 Chang et al. (2008)
Poplar (Populus sp.) 18.21 Foster et al. (2010) Arabidopsis thaliana, alternative 15.69 Foster et al. (2010)
Grasses 17.75 Foster et al. (2010) Brachypodium distachyon 18.126 Fukushima and Hatfield (2004) Zea mays 17.747 Fukushima and Hatfield (2004) Medicago sativa, whole plant mean 14.23 Fukushima and Hatfield (2004)
Trifolium pretense L., Red clover 14.49 Fukushima and Hatfield (2004)
Bromus inermis Leyss., Bromegrass boot stage; anthesis; postseed stems
17.11; 16.73; 17.40, respectively Fukushima and Hatfield (2004)
Avena sativa L., oat straw leaf; stem 20.10; 18.91, respectively Fukushima and Hatfield (2004)
Triticum aestivum L., wheat straw leaf; stem
19.81; 17.54, respectively Fukushima and Hatfield (2004)
3. After calculation of percent ABSL, apply a two-tailed t-test for comparing two samples or One-
Way ANOVA for comparing multiple samples.
Notes
1. Always wear PPE when dealing with concentrated acids and bases such as acetyl bromide,
glacial acetic acid, and sodium hydroxide.
2. A 3 mm glass bead can be added to each tube before preparing AIR to facilitate pellet
resuspension and mixing after centrifugation. This will speed up the process considerably,
extract lipids more efficiently, and maintain high yields of AIR, especially when dealing with a
large number of samples.
3. All steps of AIR preparation are performed at room temperature, with the option of drying at
35 °C under a stream of air at steps B4 and B8. Use of a Reacti-Therm module is not required,
but will dry samples faster and more evenly due to the supply of gentle airflow and heat. Drying
in the Reacti-Therm module usually takes < 1 h, and the pellet will appear cracked when it is
8
www.bio-protocol.org/e2149 Vol 7, Iss 05, Mar 05, 2017 DOI:10.21769/BioProtoc.2149
completely dry. This method, as opposed to allowing samples to dry in the chemical hood
overnight, accounts for the differences in estimated time given for each sub-heading of the
Procedure section.
4. Other destarching protocols are available, such as the enzymatic method used by Hatfield et al.
(2009). However, in our experience (Kapp et al., 2015), using 90% DMSO appeared to be the
more effective technique.
5. Lugol’s Iodine staining is recommended to verify the presence or absence of starch due to the
facile nature of staining and noticeable darker coloration of AIR containing starch after staining.
Lugol’s Iodine staining is commonly used to stain starch granules in intact plant tissues, with
sensitivity of detection largely limited to visual restraints (Ovecka et al., 2012). Removal of starch
is necessary for accurate determination of lignin content because the ABSL quantification
method quantifies lignin content with respect to the mass of cell wall material (AIR). If AIR
contains starch, starch will contribute to the overall weight of the AIR in the acetyl bromide
digestion and result in a lower and variable weight of cell wall material in each sample, thus
diminishing the accuracy of lignin determination.
6. When diluting acetyl bromide to 25% in acetic acid in step 2 of Procedure C (Acetyl bromide
soluble lignin determination), be sure to measure fuming acetyl bromide into glass containers
such as a glass graduated cylinder or using a glass Pasteur pipette. Using a micropipette will
result in damage to the micropipette and the need for repair.
7. It has been reported that excessive duration of the acetyl bromide digestion or increased
temperature of the reaction causes xylan degradation (Hatfield et al., 1999). Xylans are present
in various amounts in all lignified plant tissues; xylan degradation produces furfural derivatives,
which absorb in the range of 270-280 nm and can influence absorbance at 280 nm during ABSL
measurements. Hatfield et al. (1999) recommend lowering the digestion temperature to 50 °C
and extending the incubation time two-fold if xylan degradation is suspected of producing
variable results. Occasionally, researchers have included perchloric acid in their acetyl bromide
digestion, but Hatfield et al. (1999) recommend excluding perchloric acid as this also increases
the propensity for xylan degradation.
8. We recommend allowing remaining AIR to settle to the bottom of the tube for 12-24 h after
addition of 5 ml glacial acetic acid to sample to prevent residual AIR colloids from interfering
with A280 measurements. When comparing measurements of A280 after 1 h of settling to after 24
h of settling of the same sample, A280 values at 24 h vary from 0.4-4.4% of the A280 measurement
recorded at 1 h, indicating that the A280 readings are consistent following digestion and mixing
of glacial acetic acid.
9. Dilution factor should be calculated from with respect to the volume of the 25% acetyl bromide
digestion of 1 ml. For a sample yielding A280 readings in the range of 0-1.000 without the need
for dilution, the following dilutions should be accounted for when using the protocol as read
above: a 6x dilution upon addition of 5 ml of glacial acetic acid following digestion, and a (10/3)-

9
www.bio-protocol.org/e2149 Vol 7, Iss 05, Mar 05, 2017 DOI:10.21769/BioProtoc.2149
fold dilution during mixing of 300 µl digested AIR material, with 400 µl 1.5 N NaOH, and 300 µl
hydroxylamine hydrochloride, to produce a total dilution factor of 20.
10. The method described above produced highly consistent results between different biological
samples of Arabidopsis basal stem tissue (Xiao et al., 2017) and Brachypodium distachyon
(Kapp et al., 2015). The higher variation in the study performed by Kapp et al. (2015) is likely
derived from the heterogeneity of tissues samples, as percentage ABSL was determined for the
entirety of aerial tissue from 2-12 week-old Brachypodium distachyon plants, with variation in
leaf:stem:tiller biomass ratios. Determination of ABSL content in the basal three internodes of
Arabidopsis stems yielded a standard deviation ranging from 3.7-8% ABSL of the mean across
three biological replicates, with standard deviation between technical replicates within a single
biological replicate ranging from 0.07-1.12% ABSL, indicating highly precise results (Xiao et al.,
2017).
11. For determination of ABSL content in Arabidopsis stem tissue using this method in Xiao et al.
(2017), we chose to use the extinction coefficient determined by Chang et al. (2008) because
this extinction coefficient was determined using a method most similar to the protocol above on
Arabidopsis thaliana (Col-0) stem tissues, and was experimentally determined across various
Arabidopsis thaliana ecotypes, allowing our values to be readily compared to other studies using
this method in the future.
Recipes
1. Chloroform-methanol mixture
Chloroform:methanol (1:1, v/v)
2. 70% ethanol
100% ethanol (200 proof):double distilled water (7:3, v/v)
3. 25% acetyl bromide
Acetyl bromide:glacial acetic acid (1:3, v/v)
4. 90% DMSO
Double distilled Water:DMSO (1:9, v/v)
Note: The final volume of each mixture required by the procedure is dependent on the number of
samples.
Acknowledgments
This work was supported as part of The Center for Lignocellulose Structure and Formation, an
Energy Frontier Research Center funded by the U.S. Department of Energy, Office of Science, Basic
Energy Sciences under Award # DE-SC0001090. Thanks to the authors of Foster et al. (2010) for
guidelines and tips on AIR preparation, and the authors of Chang et al. (2008) for developing the

10
www.bio-protocol.org/e2149 Vol 7, Iss 05, Mar 05, 2017 DOI:10.21769/BioProtoc.2149
ABSL method across different scales and providing excellent insight and expertise on the subject
matter. The authors have no conflicts of interest in submitting this work.
References
1. Carroll, A. and Somerville, C. (2009). Cellulosic biofuels. Annu Rev Plant Biol 60: 165-182.
2. Chang, X. F., Chandra, R., Berleth, T. and Beatson, R. P. (2008). Rapid, microscale, acetyl
bromide-based method for high-throughput determination of lignin content in Arabidopsis
thaliana. J Agric Food Chem 56(16): 6825-6834.
3. Foster, C. E., Martin, T. M. and Pauly, M. (2010). Comprehensive compositional analysis of plant
cell walls (Lignocellulosic biomass) part I: lignin. J Vis Exp(37).
4. Fukushima, R. S. and Hatfield, R. D. (2004). Comparison of the acetyl bromide
spectrophotometric method with other analytical lignin methods for determining lignin
concentration in forage samples. J Agric Food Chem 52(12): 3713-3720.
5. Hatfield, R. D., Grabber, J., Ralph, J., and Brei, K. (1999). Using the acetyl bromide assay to
determine lignin concentrations in herbaceous plants: some cautionary notes. J Agric Food
Chem, 47, 628-632.
6. Hatfield, R. D., Marita, J. M., Frost, K., Grabber, J., Ralph, J., Lu, F. and Kim, H. (2009). Grass
lignin acylation: p-coumaroyl transferase activity and cell wall characteristics of C3 and C4
grasses. Planta 229(6): 1253-1267.
7. Johnson, D. B., Moore, W. E., and Zank, L. C. (1961). The spectrophotometric determination of
lignin in small wood samples. Tappi, 44, 793-798.
8. Kapp, N., Barnes, W. J., Richard, T. L. and Anderson, C. T. (2015). Imaging with the fluorogenic
dye Basic Fuchsin reveals subcellular patterning and ecotype variation of lignification in
Brachypodium distachyon. J Exp Bot 66(14): 4295-4304.
9. Moreira-Vilar, F. C., Siqueira-Soares, Rde. C., Finger-Teixeira, A., de Oliveira, D. M., Ferro, A.
P., da Rocha, G. J., Ferrarese, Mde. L., dos Santos, W. D., and Ferrarese-Filho, O. (2014). The
acetyl bromide method is faster, simpler and presents best recovery of lignin in different
herbaceous tissues than klason and thioglycolic acid methods. PloS One, 9(10), e110000.
doi:10.1371/journal.pone.0110000.
10. Ovecka, M., Bahaji, A., Munoz, F. J., Almagro, G., Ezquer, I., Baroja-Fernandez, E., Li, J. and
Pozueta-Romero, J. (2012). A sensitive method for confocal fluorescence microscopic
visualization of starch granules in iodine stained samples. Plant Signal Behav 7(9): 1146-1150.
11. Wang, Y., Chantreau, M., Sibout, R. and Hawkins, S. (2013). Plant cell wall lignification and
monolignol metabolism. Front Plant Sci 4: 220.
12. Xiao, C., Barnes, W. J., Zamil, M. S., Yi, H., Puri, V. M. and Anderson, C. T. (2016). Activation
tagging of Arabidopsis POLYGALACTURONASE INVOLVED IN EXPANSION2 promotes
hypocotyl elongation, leaf expansion, stem lignification, mechanical stiffening, and lodging.
Plant J.

11
www.bio-protocol.org/e2149 Vol 7, Iss 05, Mar 05, 2017 DOI:10.21769/BioProtoc.2149
13. Zhao, Q. and Dixon, R. A. (2011). Transcriptional networks for lignin biosynthesis: more complex
than we thought? Trends Plant Sci 16(4): 227-233.