acknowledgements - loomis, californialoomis.ca.gov/wp-content/uploads/2015/10/final-report.pdf ·...
TRANSCRIPT

Acknowledgements
Town Council Rhonda Morillas, Mayor
Mike Boberg, May Pro Tem Gary Gade
Carl DeWing Helen Florance
Planning Commission Robert Hollis, Chairman
Janet Daniel Bill Hudson
R. H. “Bob” Myer Gaylord Wilson
Town Staff Art Rangel, City Manager
Kathy Kerdus, Planning Director Sonja Maggard, Planning Secretary
General Plan Advisory Committee Nancy Adkins
Jim Bertoni Greg Fellers Norman Hile John Ireland
Stacy Li John Picone Joan Phillipe Ralph Trimm Sam Vaughn
Alternates:
Don Hartwick Marguerite Li Kevin Trimm
Consultant Team Crawford Multari & Clark Associates
Rincon Consultants Fehr and Peers Associates

David Taussig Associates
Contents Section 1. Land Use & Population ................................................................................................................................... 1
Introduction .................................................................................................................................................................... 1 Land Use .......................................................................................................................................................................... 1 Population ..................................................................................................................................................................... 15 Sphere of Influence ...................................................................................................................................................... 19 Regional Plans & Policies ............................................................................................................................................ 20 Findings .......................................................................................................................................................................... 29
Section 2. Circulation & Transportation ...................................................................................................................... 31
Introduction .................................................................................................................................................................. 31 Existing Conditions...................................................................................................................................................... 31 Parking ........................................................................................................................................................................... 38 Transit System ............................................................................................................................................................... 38 Future Baseline Conditions ......................................................................................................................................... 40
Section 3. Natural Resources .......................................................................................................................................... 44
Introduction .................................................................................................................................................................. 44 Water Resources ........................................................................................................................................................... 44 Soil & Mineral Resources ............................................................................................................................................ 48 Biological Resources: Flora & Fauna ........................................................................................................................ 54 Air Resources ................................................................................................................................................................ 67 Findings .......................................................................................................................................................................... 70
Section 4. Archaeological Resources, Parks & Recreation ......................................................................................... 71
Introduction .................................................................................................................................................................. 71 Archaeological Resources ........................................................................................................................................... 71 Parks & Recreation ...................................................................................................................................................... 73 Findings .......................................................................................................................................................................... 76
Section 5. Public Services & Facilities ........................................................................................................................... 79
Introduction .................................................................................................................................................................. 79 Public Services .............................................................................................................................................................. 79 Findings .......................................................................................................................................................................... 87
Section 6. Market Analysis ............................................................................................................................................... 89
Purpose of the Market Analysis ................................................................................................................................. 89 Context: Western Placer County .............................................................................................................................. 89 Economic Development in Placer County .............................................................................................................. 89 The Town of Loomis................................................................................................................................................... 90 Loomis Retail Absorption Analysis ........................................................................................................................... 93 Loomis Office & Industrial Absorption Analysis ................................................................................................... 96 Findings & Conclusions .............................................................................................................................................. 99

Section 7. Safety & Noise Issues ................................................................................................................................. 103 Introduction ................................................................................................................................................................ 103 Seismic & Geologic Hazards .................................................................................................................................... 103 Wildland & Urban Fire Hazards .............................................................................................................................. 110 Flooding Hazards ....................................................................................................................................................... 111 Dam Inundation ......................................................................................................................................................... 111 Hazardous Materials .................................................................................................................................................. 114 Noise Sources & Standards ...................................................................................................................................... 115 Findings ........................................................................................................................................................................ 124
Appendix A. References ................................................................................................................................................ 125 Appendix B. Public Workshop Results ....................................................................................................................... 130 Appendix C. Capture/Leakage Analysis ..................................................................................................................... 140 Appendix D. Absorption Analysis ............................................................................................................................... 150

List of Tables Table 1-1: Town of Loomis General Plan Acreage ....................................................................................................... 2 Table 1-1a: Holding Capacity ............................................................................................................................................ 2 Table 1-2: Loomis Town Center Land Use Plan ........................................................................................................... 5 Table 1-3: Town of Loomis 1998 Existing Land Use Acreage ................................................................................... 7 Table 1-4: Residential Build-out Potential ...................................................................................................................... 8 Table 1-5: Other Recreational Facilities ........................................................................................................................ 10 Table 1-9: Town of Loomis Selected 1990 Household Characteristics ................................................................... 16 Table 1-10: Town of Loomis 1990 Population Age Distribution ............................................................................. 16 Table 1-11: Town of Loomis Gender Distribution ..................................................................................................... 17 Table 1-12: Town of Loomis Ethnic Distribution ...................................................................................................... 17 Table 1-13: Town of Loomis Educational Attainment .............................................................................................. 17 Table 1-14: Town of Loomis Households by Income ............................................................................................... 19 Table 1-15: Town of Loomis Housing Units ............................................................................................................... 19 Table 1-16: Town of Loomis Estimated Housing Demand 1998-2020 .................................................................. 19 Table 1-18: Town of Loomis Persons by Tenure ........................................................................................................ 19 Table 2-1: Existing Roadway System ............................................................................................................................. 32 Table 2-2: Roadway Segment Operations - Existing Conditions .............................................................................. 36 Table 2-3: Intersection Level of Service Definitions .................................................................................................. 37 Table 2-4: Peak Hour Intersection Operations - Existing Conditions ..................................................................... 37 Table 2-6: Existing Deficiencies ..................................................................................................................................... 39 Table 2-7: Estimated Land Use Totals within Loomis ............................................................................................... 40 Table 2-8: Roadway Segment Operations - Existing and Future Baseline Conditions ......................................... 41 Table 2-9: Future Deficiencies ........................................................................................................................................ 43 Table 3-1: Soil Constraints to Development ................................................................................................................ 53 Table 3-2: Planning Area Habitat and Sensitivity ........................................................................................................ 54 Table 3-3: Definition of Special-Status Species ........................................................................................................... 58 Table 3-4: Special Status Species Potentially-Occurring in the Town of Loomis ................................................. 59 Table 3-5: Wildlife Species Observed in the Planning Area ..................................................................................... 60 Table 3-6: Sacramento Valley Airflow Patterns (%) .................................................................................................... 67 Table 3-7: Ambient Air Quality Standards .................................................................................................................. 68 Table 3-8: Attainment Status of the Sacramento Valley Air Basin .......................................................................... 69 Table 4-1: Park & Recreational Facilities Accessible to the Town of Loomis ........................................................ 73 Table 4-2: National Recreation & Parks Association Recommended Parkland Design Standards ..................... 77 Table 4-3A: Neighborhood and Community Park Acres Needed by Planning Area ............................................ 78 Table 4-3B: Total Required Park & Recreation Facilities by Planning Area ........................................................... 78 Table 5-1. Planning Area School Capacity & Enrollment ........................................................................................ 82 Table 5-2. Water Available to the PCWA .................................................................................................................... 83 Table 7-1. Modified Mercalli Intensity Scale (Abridged) .......................................................................................... 106 Table 7-2. Modified Mercalli Intensity and Ground Motion ................................................................................... 107 Table 7-3 Locations Experiencing Flooding - 1986 and 1995 ................................................................................ 112 Table 7-4: Relative Loudness ........................................................................................................................................ 116 Table 7-5: Maximum Allowable Noise Exposure: Transportation Noise Sources (Placer County) ................ 119 Table 7-6: Existing Traffic Noise Levels ..................................................................................................................... 120 Table 7-7. Traffic Noise Adjustments for Topography .......................................................................................... 121 Table 7-8: Approximate Distance to Railroad Noise Contours ............................................................................. 123

Table B-1. Citizen "Likes" About Loomis .................................................................................................................. 131 Table B-2. Citizen "Dislikes" About Loomis ............................................................................................................. 134 Table B-3. Citizens' Ideas for Changes to Loomis .................................................................................................... 137 Table C-1: Estimated Households in Trade Areas .................................................................................................... 140 Table C-2: Estimated Mean Household Income ....................................................................................................... 140 Table C-3: Estimated Total Income ............................................................................................................................ 140 Table C-4A: Estimated Demand by Retail Sales Category Town of Loomis ....................................................... 141 Table C-4B: Estimated Demand by Retail Sales Category Loomis Rural Area .................................................... 141 Table C-4C: Estimated Demand by Retail Sales Category Granite Bay ................................................................ 142 Table C-4D: Estimated Demand by Retail Sales Category Rocklin Area .............................................................. 142 Table C-4E: Estimated Demand by Retail Sales Category Lincoln Area .............................................................. 143 Table C-4F: Estimated Demand by Retail Sales Category Roseville Area ............................................................ 143 Table C-4G: Estimated Total Demand by Retail Sales Category ............................................................................ 144 Table C-4H: Estimated Retail Demand by Trade Area - Year 1998 ...................................................................... 144 Table C-5: Estimated Retail Supply by Trade Area (Year 1998) ............................................................................. 145 Table C-6A: Retail Market Estimated Supply vs. Estimated Demand Town of Loomis ................................... 145 Table C-6B: Retail Market Estimated Supply vs. Estimated Demand Loomis Rural Area ................................ 146 Table C-6C Retail Market Estimated Supply vs. Estimated Demand Granite Bay.............................................. 146 Table C-6D: Retail Market Estimated Supply vs. Estimated Demand Rocklin Area .......................................... 147 Table C-6E: Retail Market Estimated Supply vs. Estimated Demand Lincoln Area .......................................... 147 Table C-6F: Retail Market Estimated Supply vs. Estimated Demand Roseville Area ......................................... 148 Table C-6G: Retail Market Estimated Supply vs. Estimated Demand Summary by Retail Sales Category ..... 148 Table C-6H: Retail Market Estimated Supply vs. Estimated Demand Summary by Trade Area ...................... 149 Table C-7: "Other Retail" Category ............................................................................................................................. 149 Table D-1: Town of Loomis Retail Assumptions ..................................................................................................... 150 Table D-2: Town of Loomis - Future Retail Demand & Absorption.................................................................... 150 Table D-3: Description of Employment Categories ................................................................................................. 152 Table D-4: Town of Loomis Job Distribution ........................................................................................................... 152 Table D-5: Town of Loomis Future Office/Industrial Demand & Absorption ................................................. 153 Table D-6: Town of Loomis Estimated Demand for Non-Residential Acreage 1998-2020 ............................. 154

List of Figures Figure 1-1: General Plan Land Use Designations ......................................................................................................... 4 Figure 1-2: Land Use and Zoning Designations in Town Center............................................................................... 6 Figure 1-3: Existing Land Uses ......................................................................................................................................... 9 Figure 1-4: Generalized Zoning...................................................................................................................................... 12 Figure 1-5: Surrounding Zoning ..................................................................................................................................... 21 Figure 2-1: Existing Daily Volumes ............................................................................................................................... 34 Figure 2-2: Existing Peak Hour Volumes ..................................................................................................................... 35 Figure 2-3: Future Baseline Volumes ............................................................................................................................. 42 Figure 3-1. Surface Water Features ............................................................................................................................... 46 Figure 3-2. Geology ......................................................................................................................................................... 50 Figure 4-1: Park and Recreation Facilities ...................................................................................................................... 74 Figure 5-1. Water Distribution Network ..................................................................................................................... 84 Figure 7-1. Critical Facilities ......................................................................................................................................... 104 Figure 7-1B. Regional Geologic Map ......................................................................................................................... 108 Figure 7-2. FEMA 100-Year Flood Plain .................................................................................................................. 113 Figure 7-3. Noise Land Use Compatibility Standards ............................................................................................. 118 Figure 7-4. Existing Noise Contours .......................................................................................................................... 122

Section 1. Land Use & Population August 1998
1
Section 1. Land Use & Population
Introduction The Town of Loomis is located in western Placer County in California’s Central Valley, approximately 25 miles northeast of the City of Sacramento along Interstate 80. The Town is situated in the heart of the Loomis Basin, an 80 square-mile area of the Placer County foothills that generally includes Loomis, portions of the Cities of Rocklin and Roseville, and the unincorporated communities of Penryn and Newcastle.
Land Use The purpose of a land use element is to provide an orderly plan for the general distribution, location and intensity of land uses within the Town of Loomis. The following section provides a detailed overview of existing land use conditions within the Town of Loomis. Included are descriptions of the Town’s planning areas, existing land uses, General Plan and Town Center Master Plan land use designations, and zoning districts. Data for this section was obtained from a combination of field surveys, secondary data sources and government documents dictating land use distribution in the Town of Loomis, including the Town of Loomis General Plan (1987), the Loomis Town Center Master Plan, the Town of Loomis Zoning Ordinance, and assessor’s and Town parcel data.
Planning Areas The Town of Loomis is divided into three planning areas. The North Planning Area, which lies to the north of Interstate 80, contains all of the existing commercial, office and industrial development within the Town limits. This planning area also contains all medium and multi-family residential development, as well as larger areas designated for rural residential development. The South Planning Area, located south of I-80, consists mostly of scattered, rural residential development. The Loomis Town Center is a 490-acre area located on both sides of Interstate 80 and south of the Union Pacific Railroad. This planning area is bounded generally by King Road, the Union Pacific Railroad tracks, Brace Road and Secret Ravine. An area south of Brace Road, between Interstate 80 and Sierra College Boulevard, is also part of the Town Center. The Town Center, whose use is governed by the Loomis Town Center Master Plan, consists of the Town’s main commercial core along Taylor Road, several older and newer residential areas, and a substantial amount of vacant and underutilized land.

Section 1. Land Use & Population August 1998
2
General Plan Land Use Designations Table 1-1 lists the acreage for each land use category under the Town’s current General Plan Land Use Element. These land use categories are depicted on Figure 1-1, General Plan Land Use Designations. Table 1-1a shows the range of units and population based on these land use categories.
Table 1-1: Town of Loomis General Plan Acreage
Land Use Acreage Residential - High Density (10-15 units/acre) 1.4Residential - Medium Density/General Commercial (6-10 units/acre)
94.2
Residential - Medium Density (6 units/acre) 9.5Residential - Medium Density (4 units/acre) 206.7Residential - Medium Density (2-6 units/acre) 109.6Residential - Low Density (1 unit/acre) 294.5Residential - Low Density (1 unit/.5 acre) 12.4Residential - Rural Estate (1 unit/2.3 acres) 379.1Residential - Rural Estate (.22 - .43 units/acre) 117.4Residential - Rural Agricultural (1 unit/4.6 acres) 2,646.3 General Commercial 95.6General Commercial - Downtown Core 38.6General Commercial - Neighborhood 9.7General Commercial - Office 15.6Shopping Center 24.6Industrial Park 146.2Planned Development 28.1Public Parks and Open Space* 36.8Public Quasi-Public 72.0
TOTAL 4,338.3 Source: Crawford Multari & Clark Associates, 1998. *75-foot stream buffers primarily in Rural Agricultural areas
Table 1-1a: Holding Capacity
Land Use Units Population Low High Low High Residential - High Density (10-15 units/acre) 26 39 70 105 Residential - Medium Density/General Commercial (6-10 units/acre)
717 1,196 1,930 3,216
Residential - Medium Density (6 units/acre) 72 72 195 195 Residential - Medium Density (4 units/acre) 938 938 2,522 2,522 Residential - Medium Density (2-6 units/acre) 254 761 683 2,048 Residential - Low Density (1 unit/acre) 301 301 810 810 Residential - Low Density (1 unit/.5 acre) 7 7 18 18 Residential – Rural Estate (1 unit/2.3 acres) 168 168 452 452 Residential - Rural Estate (.22 - .43 units/acre) 26 50 69 135 Residential - Rural Agricultural (1 unit/4.6 acres) 596 596 1,602 1,602
TOTAL 3,105units
4,128units
8,351 people
11,104people
Source: Crawford Multari & Clark Associates, 1998.

Section 1. Land Use & Population August 1998
3
Joint Planning Area as designated in the Town’s 1987 Land Use Element.
1987 Land Use Element The following detail the land use classifications as described in the Town’s General Plan Land Use Element. Residential - Agricultural (1 unit/4.6 acres). This land use designation allows for single family residential development with a minimum lot size of 4.6 acres, and allows a range of agricultural uses along with single family dwellings, schools, churches and public facilities. Rural Estates. This land use category allows for single family residential development with a minimum lot size no smaller than 2.3 acres in size. This land use category allows for a range of agricultural uses along with a single family unit per parcel, plus public and quasi-public uses such as schools, churches and public utility facilities. Residential Low Density. This land use designation allows for single family residential development with a minimum lot size of no smaller than one acre. Public and quasi-public uses may also be allowed. Residential Medium Density. This land use designation allows for single family residential development with a density not to exceed four dwelling units per acre. This land use category represents the basic residential use patterns in the Town of Loomis. In addition to single family dwellings, public and quasi-public uses may be permitted Residential High Density. High density means land designated for multiple family residential development including duplexes, triplexes, townhouses, condominiums, mobile home parks, senior living centers, nursing homes, and apartments. The maximum density acceptable in this classification is ten units to the acre. Commercial. This designation allows for uses such as shopping centers, heavy commercial and central commercial as depicted on the Zoning Map. Residential uses are not allowed in commercial zones. Industrial. This designation allows for manufacturing, distribution, processing, heavy transportation and other related uses. Open Space. This designation allows for farming, hiking and equestrian trails, recreation, pasture, orchards, forests and parks. Areas Subject to Specific Plan. This designation is applied to lands with potential for significant growth to promote specific planning and performance standards. Densities for residential units under this designation are not to exceed ten units per acre. Commercial Reserve. The Commercial Reserve desig- nation applies only to parcels at Interstate 80 and Horseshoe Bar Road under one ownership that the Town may consider for future commercial development, particularly in the area south of I-80 in the Town Center planning area. Joint Planning Area. This designation applies to that area adjacent to the City of Rocklin in the southwest portion of the Town that was designated as subject to a joint planning effort between the Town of Loomis and the City of Rocklin (shown at right). The implementation of this effort was to occur once a Tentative Map Application or General Plan Amendment has been submitted to either jurisdiction.

Section 1. Land Use & Population August 1998
4
Figure 1-1: General Plan Land Use Designations

Section 1. Land Use & Population August 1998
5
Town Center Master Plan Land Use Designations In 1992, Loomis adopted the Town Center Master Plan as an Element of its General Plan. Table 1-2 lists the acreage for land uses in the Master Plan area. Figure 1-2 illustrates the geographic distribution of these land uses. The following is a detailed listing of the land use designations found in the Town Center Master Plan. Rural Estate. This residential land use designation allows for single family residential development at a density of 0.22 - 0.43 units per acre. Residential Medium Density. Residential dwelling unit densities in this category are from two to six dwelling units per acre, and may include small lot, single family detached homes. Residential Medium-High Density. This category allows residential densities of six to ten dwelling units per acre. Types of residences may include duplexes, single family detached homes, and senior citizen residences.
Table 1-2: Loomis Town Center Land Use Plan
Land Use Acreage
Dwelling Units Estimated
Square Footage Total Residential 323 1,317 units
Large Lot Single Family 140 Small Lot Single Family 100 Rural Estate 80 Townhomes 3
Total Commercial 63 1,052,000 square feetDowntown Core 24 Shopping Center 12 Office 13 179,000 square feetGeneral Commercial 10
Neighborhood Commercial 4 Public Parks & Open Space 30 Public/Quasi-Public Uses 16 Roads 58 Total 490
Source: Town Center Master Plan, 1992. Residential High Density. This land use designation allows densities between 10 to 15 dwelling units per acre. Townhouses, apartments and duplexes/triplexes are allowed here. Special Medium-High Density Residential. Residential dwelling unit densities in this category range from six to eight units per acre. General Commercial. This land use designation allows for auto-oriented commercial uses, including auto dealers, hardware stores, lodging, gas stations, restaurants, auto repair shops, and similar retail goods and services businesses. Office. Uses appropriate for this designation include insurance and financial services, law and medical offices, and similar local-serving general and professional services. Neighborhood Commercial. Commercial uses appropriate for this designation include a small grocery store, laundromat, video store, salon, and similar uses.

Section 1. Land Use & Population August 1998
6
Figure 1-2: Land Use and Zoning Designations in Town Center
Section 1. Land Use & Population August 1998
7
Shopping Center. Land uses associated with this designation include auto-oriented businesses such as a major grocery store, restaurants, service stations, dry cleaners, and similar type businesses.
Commercial Reserve (CR). This land use designation applies to that portion of the Town Center south of Interstate 80, amidst that land currently designated for Rural Estates. This area is reserved for future mixed-use development to include highway-commercial service, commercial, residential and recreational park uses.
Downtown Core (Mixed Use). This land use designation encourages a mix of complementary goods and services, including specialty retail stores, restaurants, offices, existing fruit distribution activities, and entertainment-oriented uses such as night clubs and theaters. Higher density housing and residential and office uses over ground floor retail are also permitted.
Planned Development (Mixed Use). Permitted land uses within this designation include a mix of Downtown Core type commercial, public facilities, offices, and multi-family and small-lot single family dwelling units.
Public & Quasi-Public. This land use overlay designation refers specifically to the proposed Community Center, rail stop, and Loomis Elementary School. Other allowable uses include those that are considered publicly owned such as a post office, police/fire station or library, as well as some uses that are privately owned but essentially open to the public such as day care centers, museums and public utilities.
Public Parks & Open Space. Public parks and open space is a land use overlay designation which allows for the placement of passive and active recreational parkland and facilities, pedestrian plazas, trails, buffer zones, and preserved natural habitats. Public and quasi-public uses such as auditoriums, community centers, government buildings and day care centers are also allowed.
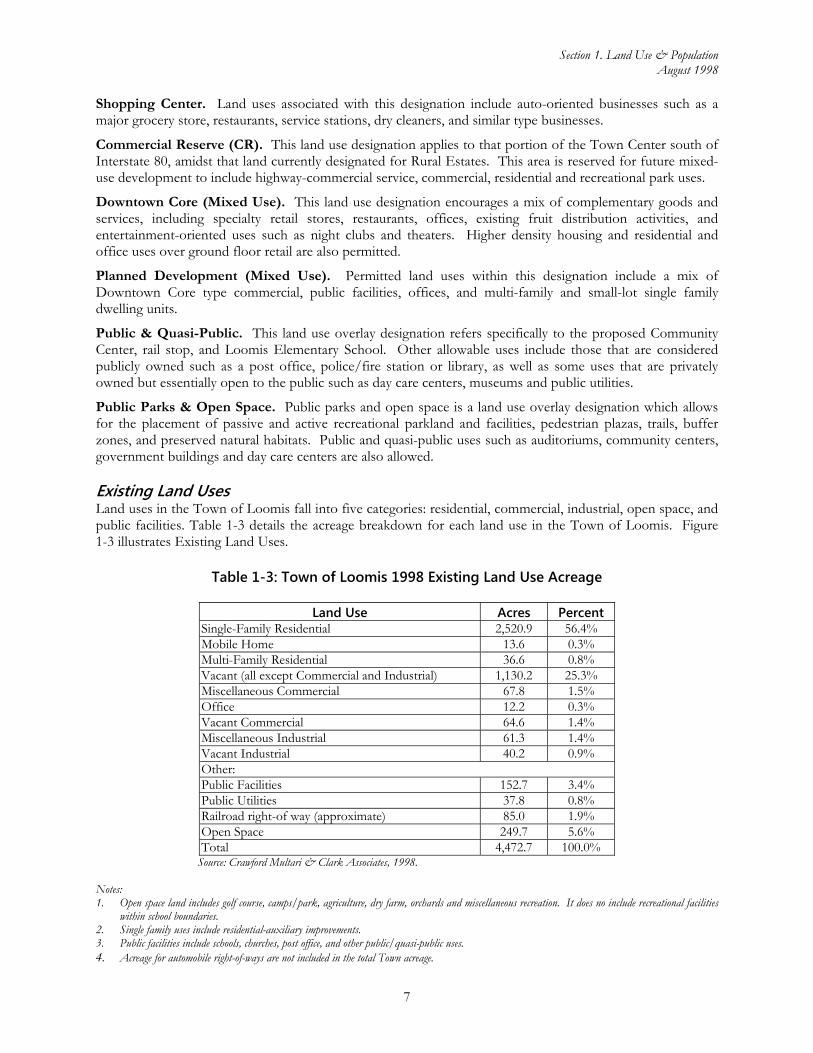
Existing Land Uses Land uses in the Town of Loomis fall into five categories: residential, commercial, industrial, open space, and public facilities. Table 1-3 details the acreage breakdown for each land use in the Town of Loomis. Figure 1-3 illustrates Existing Land Uses.
Table 1-3: Town of Loomis 1998 Existing Land Use Acreage
Land Use Acres Percent Single-Family Residential 2,520.9 56.4% Mobile Home 13.6 0.3% Multi-Family Residential 36.6 0.8% Vacant (all except Commercial and Industrial) 1,130.2 25.3% Miscellaneous Commercial 67.8 1.5% Office 12.2 0.3% Vacant Commercial 64.6 1.4% Miscellaneous Industrial 61.3 1.4% Vacant Industrial 40.2 0.9% Other: Public Facilities 152.7 3.4% Public Utilities 37.8 0.8% Railroad right-of way (approximate) 85.0 1.9% Open Space 249.7 5.6% Total 4,472.7 100.0%
Source: Crawford Multari & Clark Associates, 1998.
Notes: 1. Open space land includes golf course, camps/park, agriculture, dry farm, orchards and miscellaneous recreation. It does no include recreational facilities
within school boundaries. 2. Single family uses include residential-auxiliary improvements. 3. Public facilities include schools, churches, post office, and other public/quasi-public uses. 4. Acreage for automobile right-of-ways are not included in the total Town acreage.

Section 1. Land Use & Population August 1998
8
Residential Residential land uses make up the single largest land category in the Town. Existing residential land uses make up over 2,500 acres, approximately 60 percent of the total Town acreage (CMCA, 1998). According to the 1993 Housing Element, 1,868 acres of vacant or underutilized residentially zoned land exists within the Town. Based on allowable densities within each residential zoning district, Loomis can accommodate between 1,533 and 2,508 new housing units; see Table 1-4 (Town of Loomis Housing Element, 1993). The California Department of Finance reports there are 2,200 housing units in the Town of Loomis (1998). The Sacramento Area Council of Governments (SACOG) projects a 2020 population of 12,000 residents for the Town of Loomis. Based on an average household size of 2.69 persons (Department of Finance) the Town will need to provide an additional 2,407 units, for a total of 4,612 housing units. This total assumes a vacancy rate of 3.27 percent (US Census, 1990). Given the amount of available land for residential use and current zoning standards, the Town can accommodate this anticipated housing demand. Table 1-4 lists each of the residential zoning districts and their corresponding maximum allowable number of housing units.
Table 1-4: Residential Build-out Potential
Land Use Designation
Town Center Master Plan Outside of Town Center
Total
Acreage Units Acreage
Lots
Total Units
Multi-Family Residential (R-3) (10 to 15 units per acre)
3 30-45
30-45
Multi-Family Residential (R-2) (6 to 10 units per acre)
100 600-1000
600-1000
Single Family (R-1) (2 to 6 units per acre)
140 280-840
280-840
Rural Estates (1 unit per 0.43 acres)
80 30
30
Downtown Core (up to 15 units per acre)
6 77
77
Rural Estate Outside Town Center (1 unit per 2.3 acres)
136
57 57
Rural Low Density (1 acre minimum)
152
136 136
Residential Low Density (1/2 acre minimum)
19
38
38
Medium Density (4 unit/acre)
211
740 1600-2200
Medium Density (6 units/acre) 9 48 54 Rural Agriculture (4.6 acres per lot) 1235 273 273
Total 329 1017 -1992 1762
1292
3175 -4750
Source: Chart 5-1, Town of Loomis Residential Buildout Potential, Housing Element 1993.

Section 1. Land Use & Population August 1998
9
Figure 1-3: Existing Land Uses

Section 1. Land Use & Population August 1998
10
Commercial Commercial land uses consist of locations for the sale of goods and services as well as professional and business offices. Commercial areas within the Town are located primarily along the Taylor Road and Horseshoe Bar Road corridors, and near Interstate 80. Existing commercial land uses make up 80 acres. Additionally, vacant commercial lands occupy 64.6 acres (CMCA, 1998). Industrial Industrial land uses consist of manufacturing, processing, distribution, storage, transportation and other related uses. Industrial areas within the Town are located between King Road and the northern Town limits, along the Union Pacific Railroad line. Existing industrial uses make up 61.3 acres. Approximately 40.0 acres are vacant and available for development of additional industrial land uses (CMCA, 1998). Open Space/Recreation Open space land includes golf course, camps/park, agriculture, dry farm, orchards and miscellaneous recreation. It does not include recreational facilities within school boundaries. Approximately 249.7 acres of open space exist in the Town. The Sunrise-Loomis Neighborhood Park, at four acres, is the only park within the Town limits. Table 1-5 lists the acreage of other recreational facilities in Loomis that are within school boundaries. These facilities are included with the public facilities land use category in Table 1-3.
Table 1-5: Other Recreational Facilities
School Facilities Acreage Loomis Elementary School 3.5 Franklin Elementary School 4.2 H. Clarke Powers Elementary School 6.5 Del Oro High School 25.0
Source: Town of Loomis Parks and Recreation Element

Section 1. Land Use & Population August 1998
11
Public Facilities Public facilities consist of publicly-held land uses such as government offices, schools, public safety buildings, civic corporate yards, and utilities, as well as quasi-public, privately-held uses such as day care centers, churches, social and fraternal organizations, and museums. Existing public facilities make up 152.7 acres in Loomis.
Right-of-Ways Two railroad right-of-ways run through the Town of Loomis. The Union Pacific Railroad corridor that runs along Taylor Road and Rippey Road varies in width from 200 to 360 feet, and covers approximately 85 acres. It contains some scattered commercial land uses. The other right-of-way runs north-south, east of Del Mar Rd. at the Western edge of Town.
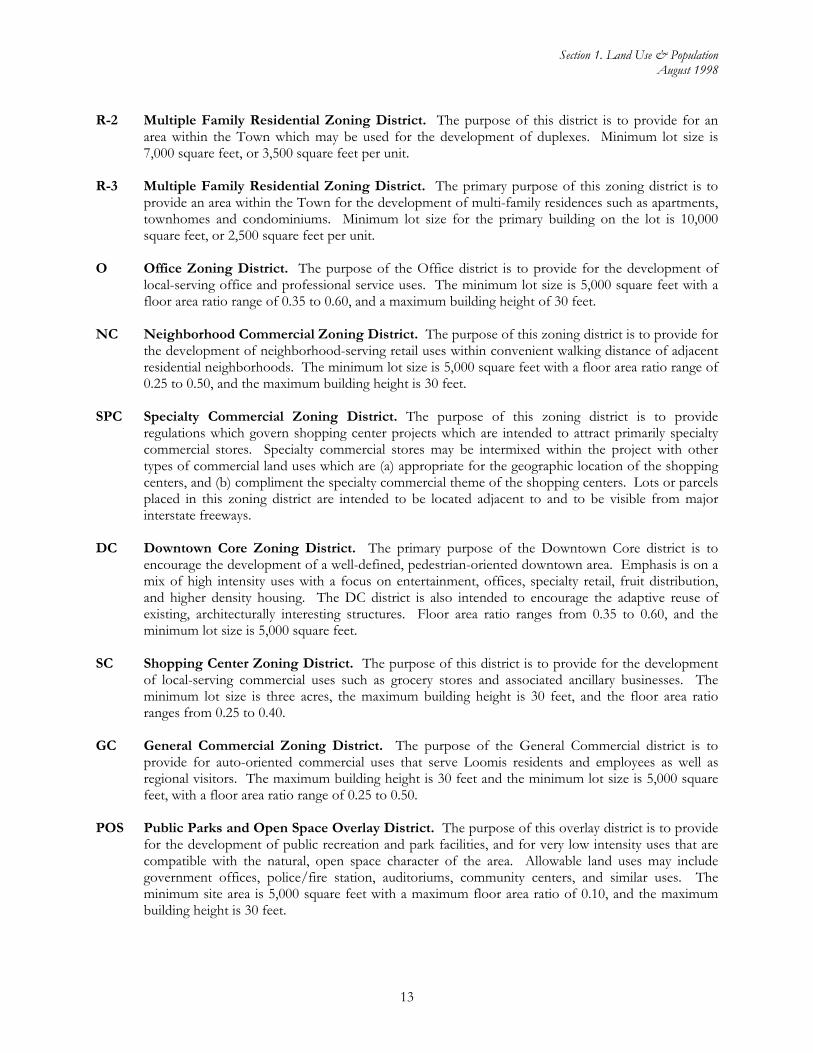
Zoning The Town of Loomis Zoning Ordinance has been revised several times since its initial adoption in 1985, with the most recent amendments in 1997. Zoning districts are shown on Figure 1-2 and are described below: RA Rural Agricultural 4.6-Acre Zoning District. The purpose of this district is to permit residential
and farm uses and to provide an area for people to have parcel of land larger than traditional residential lots, where they may carry on farming and raise livestock and small animals in limited numbers for business, home use or pleasure. This district also provides for less intensely developed areas within the Town that preserve its rural character and allow for minimal residential development without the need for additional infrastructure. This district allows one dwelling unit on a minimum lot size of 4.6 acres.
RE Rural Estate - 2.3 to 4.6-Acre Zoning District. The purpose of this district is to permit residential and farm uses and to provide an area for people to have parcels of land larger than traditional residential lots, where they may carry on light farming and raise livestock and small animals in limited numbers for home use or pleasure. It also provides for less intensely developed areas within the Town that preserve the rural character of the Town and allow for minimal residential development without the need for additional infrastructure. This district allows one dwelling unit per 2.3 to 4.6 acres.
RR Rural Residential - 1.0 to 2.3-Acre Zoning District. The purpose of this district is to permit residential and minor farm uses and to provide an area for people to have parcels of land larger than traditional residential lots, where they may carry on light farming and raise small animals in limited numbers for home use or pleasure. The purpose of this zoning district is to provide for less intensely developed areas within the Town that preserve the rural character of the Town and allow for less dense residential development. This district allows one dwelling unit per one to 2.3 acres.
R-1 Single Family Residential Zoning District. The purpose of this zoning district is to provide for four zoning districts of varying intensity of residential land use for single family dwellings. The single family residential zone provides for the development of adequate homes, yards and other residential facilities and to protect and stabilize desirable characteristics of residential neighborhoods. The R-1 Zoning Districts consist of the following:
R-1-10,000: Minimum lot sizeB10,000 square feet R-1-7,000: Minimum lot sizeB7,000 square feet R-1-5,000: Minimum lot sizeB5,000 square feet

Section 1. Land Use & Population August 1998
12
R-1-3,500: Minimum lot sizeB3,500 square feet Figure 1-4: Generalized Zoning
Section 1. Land Use & Population August 1998
13
R-2 Multiple Family Residential Zoning District. The purpose of this district is to provide for an
area within the Town which may be used for the development of duplexes. Minimum lot size is 7,000 square feet, or 3,500 square feet per unit.
R-3 Multiple Family Residential Zoning District. The primary purpose of this zoning district is to
provide an area within the Town for the development of multi-family residences such as apartments, townhomes and condominiums. Minimum lot size for the primary building on the lot is 10,000 square feet, or 2,500 square feet per unit.
O Office Zoning District. The purpose of the Office district is to provide for the development of
local-serving office and professional service uses. The minimum lot size is 5,000 square feet with a floor area ratio range of 0.35 to 0.60, and a maximum building height of 30 feet.
NC Neighborhood Commercial Zoning District. The purpose of this zoning district is to provide for
the development of neighborhood-serving retail uses within convenient walking distance of adjacent residential neighborhoods. The minimum lot size is 5,000 square feet with a floor area ratio range of 0.25 to 0.50, and the maximum building height is 30 feet.
SPC Specialty Commercial Zoning District. The purpose of this zoning district is to provide
regulations which govern shopping center projects which are intended to attract primarily specialty commercial stores. Specialty commercial stores may be intermixed within the project with other types of commercial land uses which are (a) appropriate for the geographic location of the shopping centers, and (b) compliment the specialty commercial theme of the shopping centers. Lots or parcels placed in this zoning district are intended to be located adjacent to and to be visible from major interstate freeways.
DC Downtown Core Zoning District. The primary purpose of the Downtown Core district is to
encourage the development of a well-defined, pedestrian-oriented downtown area. Emphasis is on a mix of high intensity uses with a focus on entertainment, offices, specialty retail, fruit distribution, and higher density housing. The DC district is also intended to encourage the adaptive reuse of existing, architecturally interesting structures. Floor area ratio ranges from 0.35 to 0.60, and the minimum lot size is 5,000 square feet.
SC Shopping Center Zoning District. The purpose of this district is to provide for the development
of local-serving commercial uses such as grocery stores and associated ancillary businesses. The minimum lot size is three acres, the maximum building height is 30 feet, and the floor area ratio ranges from 0.25 to 0.40.
GC General Commercial Zoning District. The purpose of the General Commercial district is to
provide for auto-oriented commercial uses that serve Loomis residents and employees as well as regional visitors. The maximum building height is 30 feet and the minimum lot size is 5,000 square feet, with a floor area ratio range of 0.25 to 0.50.
POS Public Parks and Open Space Overlay District. The purpose of this overlay district is to provide
for the development of public recreation and park facilities, and for very low intensity uses that are compatible with the natural, open space character of the area. Allowable land uses may include government offices, police/fire station, auditoriums, community centers, and similar uses. The minimum site area is 5,000 square feet with a maximum floor area ratio of 0.10, and the maximum building height is 30 feet.

Section 1. Land Use & Population August 1998
14
PD Planned Development Zoning District. The purpose of this district is to apply flexible
regulations to a large scale integrated development. This allows diversification in the relationship of uses, building structures, lot sizes and open spaces while ensuring compliance with the general plan and the intent of the development code. Any land use may be permitted if it is in harmony with other uses and serves to fulfill the function of the planned development while complying with the general plan.
S&R Stream and Riparian Combining District. The purpose of this district is: 1) to preserve and
protect the waterways and or riparian areas, retaining major stream corridors in their natural state, consistent with the objectives of the General Plan; 2) to retain the scenic aspects of the corridor from streamside and adjacent properties; 3) to protect fish, riparian vegetation and wildlife habitat; 4) to minimize landslides, erosion, siltation and sedimentation; 5) to provide for natural drainage; 6) to protect water quality, supply and stream ecosystems; and 7) to eliminate or minimize potential flood damage.
PQP Public Quasi-Public Overlay District. The purpose of the PQP district is to provide for the
development of public and quasi-public uses such as schools, libraries, and utility facilities. Permitted uses include public and private recreational facilities, recreational trails, churches, live theaters, commercial uses such as nurseries and fruit sheds, schools, museums, libraries, and similar uses.
MHP Mobile Home Park Combining District. The purpose of this combining district is to provide
development standards for the accommodation of mobile homes in planned integrated mobile home parks so as to protect the health, safety and welfare of the community and those living within the park.
C-1 General Commercial Zoning District. Allows specific uses are noted in the Zoning Ordinance. C-2 Heavy Commercial Zoning District. Allows specific uses are noted in the Zoning Ordinance. IP-A Industrial Park Combining Agriculture Zoning District. Allows specific uses are noted in the
Zoning Ordinance. AR Agricultural Residential Zoning District. Allows specific uses are noted in the Zoning Ordinance.

Section 1. Land Use & Population August 1998
15
Population In order to effectively establish land use patterns and set policies regarding housing and public services and facilities, the Town must have a thorough understanding of who lives in the community and how the population has changed and is expected to change in the future. This section examines the Town of Loomis’ population trends and projections, current demographics, and housing characteristics. The information contained in this section is taken from the 1990 U.S. Census, the California Department of Finance, the Sacramento Area Council of Governments (SACOG), and the Town of Loomis Housing Element. According to the 1990 US Census, the population of Loomis was 5,705, a 36 percent increase in population since the 1980 Census. Since 1990, population growth in the Town of Loomis has slowed. Based on the Department of Finance’s 1999 estimates, Loomis’ population is 6,006. According to the Sacramento Area Council of Governments’ population projections, the Town will see an increase in total population to a projected 2020 total of 12,000 residents. This coincides with the expected population growth for Placer County, which is expected to reach nearly 400,000 people by the year 2020, up from an estimated 218,000 in 1998.
Household Size The average household size for the Town of Loomis has seen a decline since 1980. The average household size in 1980 was 2.95 persons per household, while the estimate for 1998 (CA Department of Finance) is 2.80. The estimated household size in Loomis remains larger than that of Placer County, with figures of 2.80 and 2.63 persons per household respectively. This number is expected to further decline as the number of senior and single-parent households increases. The projected 2010 average household size is 2.69, which is still larger than that of Placer County, which is expected to be 2.41. Table 1-8 shows the total population of the Town of Loomis for each size of household in 1990, based on the 1990 US Census. In 1990, 71 percent of all households in Loomis consisted of 2-4 people. Over 14 percent of all households were single-person residences, while the remaining 14.5 percent of households contained five or more persons.
Table 1-6: Town of Loomis Population: 1980-2020
Year Loomis Placer County 1980 4,210 1990 5,705 172,796 1995 5,950
1997** 5,975 212,392 1998** 6,025 217,942 2000* 7,100 248,400 2005* 8,000 286,100 2010* 10,000 343,400 2015* 11,300 378,200 2020* 12,000 397,100
Source: 1980 U.S. Census 1990 U.S. Census*1997 SACOG P p l ti n E tim t
Table 1-7: Town of Loomis Average Household Size
Year Loomis Placer County
1980 2.95 1990 2.94 2.64 1995 2.9 1998 2.80 2.63 1999 2.77 2000 2.82 2005 2.74 2010 2.69 2.41
Source: 1990 US Census CA Department of Finance

Section 1. Land Use & Population August 1998
16
Household Characteristics In 1990, 79.5 percent of all households considered themselves a family household and 21.5 percent were non-family households. Forty-three percent (43%) of all households have children; of these, about 20 percent of the households are single-parent households.
Table 1-9: Town of Loomis Selected 1990 Household Characteristics
Characteristic 1990 Total Percentage Family Households with Children Single Male Head 39 2.0% Single Female Head 132 6.7% Married Couple 681 34.7% Family Households – No Children Single Male Head 35 1.8% Single Female Head 58 3.0% Married Couple 597 30.4% Non-Family Households 422 21.5% Total 1,964 100.0% Source: 1993 Town of Loomis Housing Element
Age and Gender In 1990, the median age for the Town of Loomis was 33 years. This is less than Placer County’s median age of 35.1 years.
Table 1-10: Town of Loomis 1990 Population Age Distribution
Age Group Female Male Total Percentage 0-4 330 245 575 10.4%5-9 146 183 329 5.9%
10-14 149 286 435 7.9%15-19 177 227 404 7.3%20-24 210 76 286 5.2%25-29 177 318 495 8.9%30-34 275 192 467 8.4%35-39 242 247 489 8.8%40-44 236 221 457 8.2%45-49 196 139 335 6.0%50-54 124 94 218 3.9%55-59 138 108 246 4.4%60-64 113 112 225 4.1%65-69 92 100 192 3.5%70-74 65 99 164 3.0%75-79 57 84 141 2.5%80+ 67 16 83 1.5%Total 2,794 2,747 5,541 100.0%
Table 1-8: Town of Loomis Persons per Household /Household Size
Persons per Household
# of Households
% of Total
1 276 14.5%2 569 29.8%3 499 26.1%4 288 15.1%5 153 8.0%6 97 5.1%
7+ 26 1.4%Total 1,908 100.0%
Source: 1990 US Census

Section 1. Land Use & Population August 1998
17
Source: 1990 US Census In 1990, 31.5 percent of the total population for the Town of Loomis was between the ages of 0 and 19, while 45.5 percent of the population was between the ages of 20 and 49. Just over 14 percent of the population was over the age of 60. Table 1-11 shows the population breakdown by gender for the Town of Loomis in 1990.
Table 1-11: Town of Loomis Gender Distribution
Female Male Total Loomis 2,794 (49.0%) 2,911 (51.0%) 5,705Placer County 88,178 (51.0%) 84,618 (49.0%) 172,796
Source: 1990 US Census Slightly less than half of the population in Loomis is female. This differs from that of Placer County, whose female population makes up a little more than half of its total population.
Ethnicity In 1990, the majority of the population for the Town of Loomis was Caucasian/White, with just over 87 percent of the population fitting this category. This is just slightly below that of Placer County, which had a Caucasian population of just over 88 percent. Nearly seven percent of Loomis’ population was Hispanic, which was again below that of Placer County. Approximately 3.5 percent of the Town’s population was Asian.
Table 1-12: Town of Loomis Ethnic Distribution
Ethnic Background Loomis Placer County Caucasian/White 4,980 87.3% 152,763 88.4% Hispanic 395 6.9% 13,303 7.7% Asian/Pacific Islander 220 3.9% 3,715 2.15% American Indian 93 1.6% 2,062 1.2% Black 0 0% 861 0.5% Other 17 0.3% 92 0.05% Total 5,705 100% 172,796 100%
Source: 1990 US Census
Educational Attainment In 1990, over 81 percent of those Loomis residents aged 18 and over had obtained at least a high school diploma or equivalent. Nearly 26 percent of these residents have some type of college degree. Both percentages are slightly less than that of Placer County, which had over 84 percent with a high school diploma or equivalent, and nearly 30 percent with some college degree.
Table 1-13: Town of Loomis Educational Attainment
Educational Level Loomis Placer County Population % Population %Less than high school 744 19.1% 19,762 15.5%High School Diploma or equivalent 1,138 29.1% 34,169 26.8%Some college 1,010 25.9% 35,675 28.0%Undergraduate college degree 820 21.0% 30,353 23.8%Graduate/Professional 192 4.9% 7,561 5.9%Total 3,904 100% 127,520 100%

Section 1. Land Use & Population August 1998
18
Source: 1990 US Census

Section 1. Land Use & Population August 1998
19
Income Levels According to the 1990 US Census, the median household income for Loomis residents was $38,042, which was slightly higher than Placer County’s median income of $37,601. Table 1-14 illustrates the income levels and respective population figures for the Town of Loomis. Nearly 20 percent of those Loomis households of age make over $60,000 annually. Thirty-five percent make between $0 and $29,999, and 45 percent make have an annual income of between $30,000 and $59,999.
Table 1-14: Town of Loomis Households by
Income
Income Level # of
Households %
of Total $0 - $14,999 259 13.6%$15,000 - $29,999 429 22.5%$30,000 - $44,999 518 27.1%$45,000 - $59,999 327 17.1%$60,000 - $74,999 152 8.0%$75,000 - $99,999 145 7.6%$100,000 + 78 4.1%Total 1,908 100%Source: 1990 US Census
Housing Units According to the Department of Finance, the Town of Loomis has 2,220 dwelling units, including nearly 2,000 single family houses. With an anticipated population of 12,000 residents by the year 2020, the Town will need an additional 2,407 dwelling units for a total of 4,612 housing units. This assumes a vacancy rate of 3.27 percent, and an average household size of 2.69 persons.
Table 1-15: Town of Loomis Housing Units
Single Family Multi-Family Mobile Homes Total
1990* 1,798 110 113 2,021 1995 1,943 110 117 2,170 1997* 1,957 110 118 2,185 1998** 1,971 120 114 2,205 1999 1,985 120 114 2,220
Source: * SACOG 1997 Population Estimates & Housing Inventory ** Department of Finance Note: Vacancy rate = 3.27 percent

Section 1. Land Use & Population August 1998
19
Table 1-16: Town of Loomis Estimated Housing Demand 1998-2020
Year Population Average
Household Size New Housing Units Needed
Total Housing Units
1998 6,006 2.8 N/A 2,205 2000 6,100 2.82 15 2,220 2005 6,900 2.74 480 2,500 2010 8,600 2.69 600 3,100 2015 9,700 2.69 350 3,450 2020 10,300 2.69 250 3,650
Source: Department of Finance Sacramento Area Council of Governments Crawford, Multari & Clark Associates
Housing Tenure The percentage of owner-occupied and renter-occupied units in the Town of Loomis is similar to that of Placer County, with 71 percent and 29 percent, respectively. The Town of Loomis differs from Placer County in that 73 percent of all renters live in single family homes, whereas 50 percent of all County renters live in single family homes. Similarly, a much smaller proportion of Loomis renters live in multi-family units.
Table 1-18: Town of Loomis Persons by Tenure
Tenure/Unit Type 1990 Percent Owner Occupied Single Family 4,193 74% Multi-Family 30 0.5% Mobile Home/Other 143 2.5%Renter Occupied Single Family 1,011 18% Multi-Family 206 3.6% Mobile Home/Other 67 1.2%Total 5,650 100%
Source: 1990 US Census 1993 Town of Loomis Housing Element
Sphere of Influence A "Sphere of Influence" is a boundary established around Loomis and other municipalities as required by State law by the Placer County Local Agency Formation Commission (LAFCO). A Sphere of Influence defines areas into which towns, cities, and special districts may expand through the annexation process. Currently, the Sphere of Influence for Loomis is coterminous (the same as) the Town's corporate boundary. Although there have been previous discussions among Town officials and citizens about possible longer-term geographic growth boundary alternatives for Loomis, and a preliminary study of long-term growth and Sphere of Influence alternatives was commissioned by the Town, there is no current proposal for specific changes to the existing sphere. Long-term growth alternatives and possible changes to the current Sphere of Influence will instead be issues to be addressed in the General Plan update process.
Table 1-17: Town of Loomis Housing Tenure
Tenure 1990 Percent Owner Occupied 1,506 71%Renter Occupied 458 29%Total 1,964 100%
Source: 1990 US Census; 1993 Town of Loomis Housing Element

Section 1. Land Use & Population August 1998
20
Regional Plans & Policies The Town of Loomis and various regional agencies are undertaking special planning efforts to address certain issues that are either not required to be addressed in the general plan or cover a larger area. This section discusses plans affecting land use, growth and development in the Town of Loomis that are either regional in nature or that deal with a particular governmental function. Figure 1-5 illustrates zoning boundaries and general land uses adjacent to the Loomis town limits.
General and Community Plans Surrounding Town of Loomis Placer County General Plan Placer County adopted its original general plan in 1967 and, in 1990, began its comprehensive update process of the Countywide General Plan. This process was structured in ten phases over the course of four years and culminated with the adoption of the updated general plan in August of 1994. The Placer County General Plan consists of two types of planning documents: the Countywide General Plan and focused community plans. The Placer County General Plan establishes a broad planning framework to guide land use decisions in the unincorporated portions of the county and communities within the region. Community-specific issues are addressed and further discussed in the Acommunity plans.@ The community plans address the unique issues and concerns arising in the different unincorporated areas and contain specific, goals, policies, and programs that apply to each particular community and area. The general plan is based on the premise that Placer County will be in a continued growth and economic development trend and, to accommodate that growth, public services and recreation opportunities will need the appropriate expansion. The plan includes the following planning principles: a balance should be encouraged between jobs and labor force; concentrated and diverse commercial areas should be established that are accessible from major
transportation corridors; industrial areas should be located should be located on large tracts of land, near transportation facilities,
buffered from residential lands and other potential conflicting uses; and residential densities should decrease as a function of distance from urban areas. The plan also identifies implementation programs that Placer County should implement to meet its goals, objectives, and policies. Horseshoe Bar/Penryn Community Plan Horseshoe Bar/Penryn area is located northeast of the Town of Loomis and west of Folsom Lake. The Horseshoe Bar/Penryn Community Plan encompasses an area of approximately 25 square miles of the area south of the unincorporated area of Newcastle and the City of Auburn, north of the Granite Bay community, west of Folsom Lake, and east of the cities of Rocklin and Roseville. The community plan was adopted in 1994 and replaced the 1975 Loomis Basin General Plan. Revisions to the plan were made in 1995 and 1996 to reflect the updated Noise and Recreation Elements, minor changes, park development standards, and Public Facilities and Services implementation measures associated with the County-wide General Plan.

Section 1. Land Use & Population August 1998
21
Figure 1-5: Surrounding Zoning

Section 1. Land Use & Population August 1998
22
The goals and policies in the community plan tend to limit growth based on available services and facilities. The plan states that there is sufficient land within its current land use plan to accommodate planned future growth. If Horseshoe Bar/ Penryn area is built out in accordance with its 1994 community plan, it would achieve a population of approximately 7,800-9,200 person by the year 2010. The proposed land use plan has a total population holding capacity of 13,525. The community plan does not contain specific growth management policies to maintain or achieve its desired rate of growth or annexation policies, except to state that the rate of development and project locations shall not exceed the community’s capacity, special districts, and utility companies ability to provide all necessary services in an orderly and economic manner. The plan also has a policy that allows for increased commercial and residential development only where all public services can be provided in an adequate and timely manner. Existing and future land uses in the Horseshoe Bar/Penryn Area abutting the Loomis Town limits and conflicting with uses in Loomis will be resolved through implementation of the Horseshoe Bar/Penryn community plan goals and policies. These goals and policies require buffers, compatibility between neighboring land uses and zoning classification, and a minimum lot size (of one to 2.3 acres) that is compatible with the Town’s minimum lot size. Currently, land use designations in the Horseshoe Bar/ Penryn area adjacent to Loomis include Rural Estates, Rural Residential, and Low Density Residential. The Rural Estates (RE) designation provides for farming, grazing, open space uses while the Rural Residential (RR) provides for hobby farms, animal husbandry, and other rural activities and are expected to be maintained in the Plan area. New development under Rural Residential is encouraged to maintain and promote rural character of the area. Low Density Residential (LDR) areas are primarily located along Auburn-Folsom Road and northwest of I-80 near Penryn Parkway. Under this designation, the majority of the land developed has been subdivided into Planned Unit Developments (PUDs). Granite Bay Community Plan The community of Granite Bay is located approximately 20 miles northeast of Sacramento and is immediately south of the Town of Loomis. The Granite Bay Community Plan was adopted in 1989 and replaced the southerly portion (Granite Bay Area) of the 1975 Loomis Basin General Plan and provides guidance for development to the year 2000. The plan was revised in 1995 and 1996 to reflect changes in the Noise and Recreation Elements and to conform with the Countywide General Plan regarding stream setbacks and park development standards. The plan contains all seven state-mandatory elements and optional elements such as recreation, public services, and community design. The Granite Bay Community Plan encompasses approximately 25 square miles and is conveniently located to major employment centers in Roseville, Sacramento, Folsom, as well as recreational areas in the Sierra Nevada Mountains and San Francisco Bay area. The community plan policies promote limited growth in keeping with its small rural/residential environment. Primary policies that are implemented by the plan to limit growth include: uses of land shall be restricted to residential sites, open space preserves, agricultural pursuits, and
services necessary to serve frequent needs of the community; population density shall be consistent with natural constraints, preservation of natural areas, and role
of Granite Bay as a transition areas between urban areas and agricultural communities; provide utility and services on an “as-needed” basis; and charge fees associated with new development. Future development accommodated by Granite Bay’s adopted community plan is not expected to adversely affect the Town of Loomis because the proposed land use plan for Granite Bay will adequately accommodate future development without substantially affecting adjacent communities. The population projections for

Section 1. Land Use & Population August 1998
23
Granite Bay for the year 2000 is 21,200 and the total population holding capacity for Granite Bay is approximately 29,000 people. Further, the adopted community plan designates the northern portion of the plan area and adjacent to the Loomis town limits as rural estates (RE) and rural residential (RR). These designations are recognized as having rural or agricultural land uses that will be maintained and protected into the future. These areas will allow for a large number of farms and agricultural uses including animal husbandry. The Rural-Low Density Residential land use designation allows for a density from 0.9 to 2.3 acres per dwelling unit. Specific policies for “Intensity of Use” indicates that a transition area between the urban densities in the adjoining communities and non-intensive land uses to the north and west in the plan area should be provided. These land use designations will provide a buffer zone between Granite Bay and Loomis.
City of Rocklin General Plan Rocklin is the second largest city in Placer County and is located southwest of Loomis and east of the City of Roseville. The City’s planning area for the general plan covers approximately 12,945 acres, 10,251 of which are within the city limits. The current Rocklin General Plan was adopted in April, 1991. The update included six of the seven elements required by state law; the Housing Element was last updated in April, 1992. Rocklin adopted a major update to its Circulation Element in 1994. Rocklin has experienced marked growth over the past ten years and is expected its continued growth trend into the future since Rocklin lies within one of the fastest growing areas in the state (Placer County). The Rocklin General Plan has policies that allow for additional growth. Although the general plan does not contain policies that establish a desired rate and direction of growth, approximately 4,000 acres are designated for future urban development, resulting in a projected buildout population of about 64,000 in the year 2020 (projected in the 1994 Circulation Element). This scenario would result in an average annual growth rate of about 3.5 percent. The general plan does not identify a formal agreement or policy addressing land use within the City's sphere of influence other than to encourage low density, rural land use designations be maintained in such areas "unless public services can be provided and annexation is accomplished." Residential development in Rocklin is concentrated primarily in the Sierra Community College area, Mission Hills/Clover Valley area, and western Rocklin near Roseville. These areas also abut the Loomis town limits. Future development in Rocklin includes expansion of the existing college in the Sierra College area; residential and commercial development, and open space along Secret Ravine Creek; and low density residential use with minor commercial development in the Clover Valley Lakes area. Rocklin’s adopted sphere of influence includes a portion of the Sunset Industrial area and a rural residential area known as Sunset Rancho Estates. This area is designated as "plan reserve" and "non-residential urban reserve study area" by the County General Plan. Rocklin’s general plan designates the Sunset Rancho area as "planning reserve," and notes that appropriate land use designations for the areas should be determined through the preparation and adoption of a specific plan prior to annexation, which would also include an evaluation of needed infrastructure. Rocklin is currently processing an annexation and urban development plan for the Sunset Rancho area. The plan, if approved, would provide for commercial, parks, schools and open space uses, and approximately 4,300 dwelling units. The Rocklin Circulation Element provides a plan for the transportation and transit services and facilities necessary to serve the development if the City of Rocklin as provided in the Land Use Element of the General Plan. The element also includes descriptions of roadway improvement projects identified by Rocklin to alleviate problem areas which may arise as a result of anticipated growth. The Element addresses roadways that are common boundaries with the Town of Loomis.

Section 1. Land Use & Population August 1998
24
Although the plan originally identified circulation and roadway system capacity as a significant constraint to future development, Rocklin’s circulation element was amended in 1994 to resolve problematic traffic areas which could occur with anticipated development under the Rocklin General Plan by the year 2020. Roadway improvements in the amendment include: Pacific Street and Rocklin Road; one new I-80 overpass, Dominguez Road to Sierra College Boulevard;* widening of Rocklin Road at I-80; Rocklin Road extension to Whitney Boulevard; Summit Project to Delmar Avenue; Sunset West Circulation Plan; widening of Pacific Street near Sunset Boulevard; Stanford Ranch Road/Sunset Boulevard Intersection; Highway 65 to Sierra College Boulevard Connection; and Sunset Ranchos to West Oaks Boulevard Connection. *In 1996, a General Plan amendment was made to the Circulation Element to eliminate the Granite Drive Overcrossing of Interstate-80. Roadway improvements would require consistency with the policies of the Circulation Element including maintaining a minimum traffic level of service “C” for all future streets and intersections (except where intersections are located within ½ mile direct access to interstate freeway) and coordinating with adjacent jurisdictions to complete and improve roads which extend into other communities. Roadway improvements identified by in the North Rocklin Circulation Element that may have affected Loomis included roadway improvements for the Pacific Street/Del Mar Avenue intersection. However, this improvement was eliminated from consideration because the improvement was not needed by the year 2020. Future development in these areas could place additional circulation system and housing pressures on the Town of Loomis because of its immediate proximity to these growth areas.
Regional Plans Sierra Planning Organization (SPO) The Town of Loomis is a member of the Sierra Planning Organization and participates in this forum with other local government agencies to discuss and recommend action for governmental issues affect the region. The Sierra Planning Organization (SPO), formed in 1970, is an association of local governments formed by four counties and seven cities. SPO serves the counties of El Dorado, Nevada, Placer and Sierra except for the Lake Tahoe Basin and the cities of Roseville, Rocklin, and Lincoln. SPO serves the cities of Loyalton, Nevada City, Grass Valley, Placerville, Colfax, Auburn and Loomis. SPO serves as an advisory agency to local governments on matters of inter-jurisdictional concern, and has developed regional mandated state housing allocations, housing elements, and land use plans. SPO also serves as the designated Foothill Airport Land Use Commission (FALUC) for the four counties and is responsible for development and adoption of

Section 1. Land Use & Population August 1998
25
Comprehensive Land Use Plans for each general aviation airport in the region (Burnes, pers. comm.). The Sierra Economic Development District (SEDD) is a non-profit organization and is co-located with the SPO. The SEDD provides assistance to its local government members by providing regional economic and demographic data, assisting in grant writing for general program funding and special projects, researching in new industry development. The SEDD also prepares the Overall Economic Development Plan (ODEP) which outlines goals and strategies to alleviate unemployment and underemployment in the Sierra Nevada region and establishes a prioritized list of projects that have applied or would like to receive federal funding (Riley pers. comm.). Sacramento Council of Governments (SACOG) SACOG is an association of 19 city and county governments including Sacramento, Sutter, Yolo, and Yuba Counties and the Cities of Sacramento and West Sacramento, Davis, Folsom, Galt, Isleton, Lincoln, Live Oak, Marysville, Rocklin, Roseville, Wheatland, Winters, Woodland, and Yuba. SACOG serves as an advisory, federally-designated, planning agency which coordinates with local governments on matters of inter-jurisdictional concern, including transportation, land use, and air quality. SACOG is the Metropolitan Planning Organization (MPO) for its four member counties and for western portions of Placer and El Dorado Counties, and is the Regional Transportation Planning Agency for Sacramento, Sutter, Yolo, and Yuba Counties. In 1996, SACOG prepared and adopted the Metropolitan Transportation Plan (MTP) which encourages alternate forms of transportation, ride-sharing and other efforts to reduce trips, especially commuter trips. The plan sets policies for future transportation needs to the year 2015. To date, the MTP is currently in the process of being updated to reflect future transportation needs of the region to the year 2020 (Kays, pers. comm.). Placer County Transportation Planning Agency The Placer County Transportation Planning Agency is a state-designated agency responsible for transportation planning in the Placer County region. In 1986, this agency prepared and adopted the Regional Transportation Plan (RTP) that is designed to be a blueprint for the systematic development of a balanced, comprehensive, multi-modal transportation system. The RTP identifies long term (10-20 years) transportation needs, and the CMP identifies shorter term (7-10 years) transportation needs and expands the scope of transportation planning to include air quality and land use issues. The RTP is currently in the process of being updated and will identify future transportation needs to the year 2020 (Kays, pers. Comm.). In 1998, the Placer County Transportation Planning Agency completed its Regional Transportation Improvement Plan that identified transportation projects for construction utilizing state grant funding. Cities interested in receiving funding for transportation projects are required to apply with the planning agency.
South Placer Municipal Utility District Sewer Master Plan The South Placer Municipal Utility District (SPMUD) (formerly known as the Rocklin-Loomis Municipal Utility District) provides sewer service to Loomis, Rocklin, and Penryn, as well as to some portions of Placer County. The SPMUD Sewer Master Plan was prepared in 1986 as a revision to the District’s previous plan. Although the planning horizon for the Master Plan is ten years (1986-1996), this Plan is considered accurate and current by the SPMUD and identifies the flow capacity and existing sewer infrastructure of the Town of Loomis (Stein, pers. comm.). The Plan concludes that an increase in total sewage flow of approximately nine percent will occur and the need for additional trunk sewer systems will be required as a result of intensive development activities in the northwest Rocklin areas and east of I-80, south of Rocklin Road and Horseshoe Bar Road, as well as Loomis and northeast of Loomis along Taylor Road. At that time, the Plan

Section 1. Land Use & Population August 1998
26
recommended for the SPMUD to begin making progress on the Roseville Parallel Trunk Sewer Project. Construction of the trunk sewer project has since been completed. Although not part of the SPMUD Sewer Master Plan, the SPMUD fully participated in providing data for the preparation of the Roseville Regional Wastewater Treatment Service Area Master Plan. The Master Plan, adopted in 1996, analyzed strategies for providing wastewater treatment service to the areas of Roseville, Newcastle, the SPMUD (Rocklin and Loomis), Lincoln, and portions of South Placer County. SPMUD’s service area (Loomis and Rocklin) was included in the Roseville Regional Wastewater Treatment Service Area Master Plan analysis to determine the Roseville Wastewater Treatment Plant’s ability to provide adequate wastewater treatment capacity to each participating area. The Master Plan concludes that the SPMUD is assured adequate capacity at the Roseville Regional Wastewater Treatment Plant for the Town of Loomis at least through 2015 (Stein pers. comm.).
Solid Waste Management Plan Solid waste management is generally under the jurisdiction of the Town of Loomis and its Solid Waste Management Plan has been incorporated by reference into the Placer County Integrated Waste Management Plan. Loomis operates its solid waste management in accordance with the Town of Loomis Comprehensive Waste Management Plan mandated by Assembly Bill 939. The Solid Waste Management Plan was submitted and approved by the California Integrated Waste Management Board in 1997 and complies with the mandate to reduce waste by 25 percent in 1995 and 50 percent by the year 2000. The Plan includes a Source Reduction and Recycling Element, Household Hazardous Waste Element and Non-disposal Facilities Element. The Placer County Solid Waste Management Plan (CoSWMP) was approved by the County in December 1989 as a revision to the County's previous plan. The CoSWMP was submitted to the California Solid Waste Management Board for review, but to date has not yet been accepted. The CoSWMP complies with requirements for identifying an implementation schedule, designating existing and proposed solid waste facilities sites, and presenting management alternatives for the short term (five years) mid-term (ten years) and long-term periods (25 years). In 1994, the Placer County Source Reduction and Recycling Element (SRRE) portion of the CoSWMP was approved pursuant to the requirements of AB 939. Further discussion is presented in Section 5, Public Services & Facilities, of this report.
Hazardous Waste Management Plan The Placer County Hazardous Waste Management Plan (CHWMP) was approved in March 1988. The CHWMP is currently being reviewed by the State Department of Health Services, but to date has not yet been accepted. The Plan contains descriptive background information and policy guidance for: current hazardous waste generation; projected hazardous waste generation by the year 2000; hazardous waste treatment, storage, or disposal facilities; hazardous waste reduction; siting of hazardous waste facilities; and implementation. The Hazardous Waste Management Plan was prepared for the Placer County Health Department, Division of Environmental Health. Placer County is anticipated to generate approximately 6,700 tons of hazardous waste by the year 2,000. Currently, all of Placer County's hazardous waste is transported out of the county to treatment and disposal facilities. The CHWMP states that Placer County does not now produce enough hazardous waste to justify a treatment or disposal facility, nor is it projected in "the foreseeable future", based on a three percent annual industrial growth rate between 1988 and the year 2000. The plan also identifies a comprehensive set of siting criteria for hazardous waste facilities and identifies areas of the county where such criteria might be applicable upon more detailed site-specific investigations. The Placer County Agricultural Commission currently has a storage permit for pesticide waste, but has not stored any waste since 1985. Many of the large-quantity users recycle their materials on-site. The County encourages on-site treatment for large-quantity generators and is implementing source reduction strategies including household waste

Section 1. Land Use & Population August 1998
27
collection and education programs. Hazardous waste producers are regulated by the Certified Unified Program Agency (CUPA), a division of the County Environmental Health Services. In May 1997, the program was state-certified to enforce hazardous waste regulatory permits for small facilities. Currently, Loomis does not have substantial amounts of hazardous materials stored within its planning area. Most of the hazardous materials in Loomis are road maintenance- or equipment- related solvents used for road repair, equipment clean up, or photographic processing. Additionally, underground storage tanks (USTs) are not present in the planning area because of previous remediation and removal (Miners, pers. comm.).
Placer County Air Quality Management Plan (Federal) Loomis is located in the Sacramento Valley Air Basin and is in non-attainment status for ozone based on state and federal air quality standards. The Federal Clean Air Act requires each Air Pollution Control District to submit an Air Quality Management Plan (AQMP) for approval by the Air Resources Board (ARB) and the Environmental Protection Agency (EPA). The primary goal of the AQMP is to reduce air pollutants below federal standards. In 1982, SACOG prepared an AQMP for its jurisdiction but was not approved by the EPA because the AQMP did not meet Federal air quality standards. Subsequently, the EPA prepared a Federal Implementation Plan (FIP) for the Sacramento Valley Air Basin and was finalized in 1995. The FIP provides control measures to reduce air emissions to Federal standards by the year 2005. However, the Sacramento Valley Air Basin will be subject to comply with the 1992 Air Quality Attainment Plan for Placer County because the FIP was rescinded as a result of recent legislation (HR 889 now law).
Placer County Air Quality Attainment Plan (State) Assembly Bill 2595 (known as the California Clean Air Act (CCAA)) took effect on January 1,1989. The CCAA requires the Placer County Air Pollution Control District (PCAPCD) to prepare and adopt an Air Quality Attainment Plan which demonstrates how the state air quality standards will be attained and maintained. The Plan must, therefore, discuss the sources of emissions, how the amount of these emissions is expected to change in the future, and emission control strategies. Among the requirements of the CCA is that non-attainment areas reduce the emission of non-attainment pollutants, or their precursors, by 5 percent per year until the standard is achieved. The CCA requires the following: No net increase in emissions of non-attainment pollutants or their precursors from any new or modified
source. Application of Best Available Control Technology (BACT) to existing emissions sources. Implementation of all reasonably available transportation control measures, and a program to achieve a
"substantial reduction" in the growth rate of passenger trips and miles traveled. Demonstration that the control measures will achieve at least a 40% reduction in ozone precursor
emissions (Reactive Organic Gases and Nitrogen Oxides) countywide compared to 1987 levels. In 1992, PCAPCD adopted the Air Quality Attainment Plan (AQAP) to meet the goals outlined above. The AQAP included control measures to reduce air emissions to the extent feasible.
Placer County Water Agency The Placer County Water Agency (PCWA) was created by a “special act” for the purposes of developing and operating major water facilities in Placer County. In 1986, PCWA prepared the Treated Water Supply Master Plan to identify treated water requirements, sources of water supplies, and facilities necessary to meet the Lower Zone 1 service area short-term (until 1995) and long-term treated water demands until the year 2011. Lower Zone 1 service area extends to Auburn to the north, Folsom Lake to the east, Roseville to the south, Rocklin to the west, and includes Loomis and Lincoln. The objectives of the plan include:

Section 1. Land Use & Population August 1998
28
Developing treated water supply alternatives to meet project long-term water supply demands; Planning future primary transmission mains, storage facilities, treatment facilities and pumping plants to
develop other water sources in coordination with efficient use of PCWA’s existing water supply and facilities; and
Providing a basis for planned construction of proposed facilities in anticipation of increased development activities.
The plan identifies several short- and long-term raw and treated water supply alternatives for meeting the water demands of the Lower Zone 1 service area. The plan concludes that the PCWA’s water supply is adequate to meet the projected demands through 1994 given the short-term recommendations, and long-term supply needs could be accommodated with use of American River water.
Placer County Flood Control and Water Conservation District Placer County and the cities of Auburn, Colfax, Loomis, Lincoln, Rocklin, and Roseville participate in a “special act” district, entitled the Placer County Flood Control and Water Conservation District (District). The District was created to provide countywide water conservation; development of water resources; and control and management of drainage, storm, flood, and other waters; and exercise other powers as provided by law. The District is responsible for: Coordinating efforts to solve water conservation, drainage, and flood problems; Studying, evaluating, and implementing reasonable measures, standards, and activities designed to
mitigate the effects of development activities on drainage, flooding, erosion and sedimentation, water quality, and water conservation; and
Reviewing the development plans and environmental documentation for each new discretionary development project that would potentially alter the rate or volume of runoff or alter floodplain elevations in major streams.
The Town of Loomis is located in the Dry Creek Watershed in Placer County and has two main drainages, Secret Ravine and Antelope Creek, and numerous smaller tributaries flowing through the area. In 1992, the District adopted the Dry Creek Watershed Flood Control Plan which identifies flood control issues within the Placer County region. The primary concern in the region deals with existing and future development in the region and its effects on drainage facilities and downstream flows. Some of the policies in the Plan include cities providing on-site detention basins or drainage facilities for all new development or cities must collect “developer fees” for new development. These fees would be used to construct and maintain regional detention basins and drainage facilities. The District also adopted a Stormwater Management Plan in 1991. The Plan provides regional design standards for drainage facilities and infrastructure. Loomis has adopted those standards for implementation during development activities. In 1996, the District completed the Placer County Flood Hazard Mitigation Plan. This Plan identifies how the County will develop and fund flood hazard removal projects utilizing state grant monies.
Placer County Open Space Implementation Project In April 1997, the Placer County Board of Supervisors adopted a resolution to pursue the Open Space Implementation Project that would provide a framework for the preparation of long-range comprehensive open space preservation for Placer County. The primary goal of the project is to develop specific, economically viable, implementation programs to enable Placer County residents to preserve the natural

Section 1. Land Use & Population August 1998
29
resources to maintain a high quality of life and an abundance of diverse natural habitats while supporting Placer County’s economic viability and enhancing property values. The project would be guided by a citizen’s committee of various interest groups including environmental, business, development, agriculture, and recreation to review, discuss, and provide recommendations on project-related information from Placer County staff. The project comprises two phases. The first phase would consist of establishing policies for the project based on the existing Placer County General Plan’s Open Space and Conservation Element, identifying and establishing funding sources, and protective mechanisms for long-term preservation of open space. The second phase of the project would include preparing the Natural Communities Conservation Plan for Placer County (NCCP) and other open space preservation-related activities which may result from aesthetic, recreation, and public safety concerns. The NCCP is a conservation plan that will provide solutions and options to the development community related to compliance with state and federal regulations for all plants and animals that are currently protected or will be protected in the future under the state and federal Endangered Species Acts. Key elements of the plan would include: Providing a wide variety of ownership, preservation, and funding methods to address the diverse
circumstances present in the county; Maintaining local land use control by taking a leadership role in the preservation of endangered species
and habitat preservation; Identifying open spaces of importance to residents of the cities as well as the unincorporated area; and Improving the certainty in the regulatory process. The NCCP would allow Placer County to become the permit authority for state and federal regulations and to retain maximum local jurisdiction over land use development. This plan would create a comprehensive approach for open space preservation and unified efforts among communities where open space is an important common value.
Findings 1-1. According to the 1990 US Census, the population of Loomis was 5,705. The Sacramento Area Council
of Governments (SACOG) projects a 2020 population of 12,000 residents in the Town of Loomis. 1-2. A Sphere of Influence defines areas into which towns, cities, and special districts may expand through the
annexation process. Currently, the Sphere of Influence for Loomis is coterminous (the same as) the Town's corporate boundary. Long-term growth alternatives and possible changes to the current Sphere of Influence will be issues to be addressed in the General Plan update process.
1-3. The Town of Loomis updated its Housing Element in 1993. The Element identified 1,868 acres of
vacant or underutilized residentially zoned land within the Town. 1-4. The percentage of owner-occupied and renter-occupied units in the Town of Loomis is similar to that
of Placer County, with 71 percent and 29 percent, respectively. 1-5. Horseshoe Bar/Penryn area is located northeast of the Town of Loomis and west of Folsom Lake.
The 1994 Horseshoe Bar/Penryn Community Plan encompasses an area of approximately 25 square miles. The goals and policies in that Plan tend to limit growth based on available services and facilities. The Plan states that there is sufficient land within its current Land Use Plan to accommodate planned future growth. If the Horseshoe Bar/Penryn area is built out in accordance with its Community Plan,

Section 1. Land Use & Population August 1998
30
it would achieve a population of approximately 7,800 to 9,200 person by the year 2010. The proposed Land Use Plan has a total population holding capacity of 13,525.
1-6. Granite Bay is located approximately 20 miles northeast of Sacramento and immediately south of
Loomis. The Granite Bay Community Plan was adopted in 1989 and provides guidance for development to the year 2000. Future development accommodated by Granite Bay’s adopted community plan is not expected to adversely affect Loomis. The population projections for Granite Bay for the year 2000 is 21,200 and the total population holding capacity is approximately 29,000 people.
1-7. Rocklin is the second largest city in Placer County and is located southwest of Loomis. The City’s
planning area for the General Plan (1991) covers approximately 12,945 acres, 8,430 of which are within the city limits. Future development in Rocklin could place additional circulation system and housing pressures on the Town of Loomis because of its immediate proximity to growth areas.
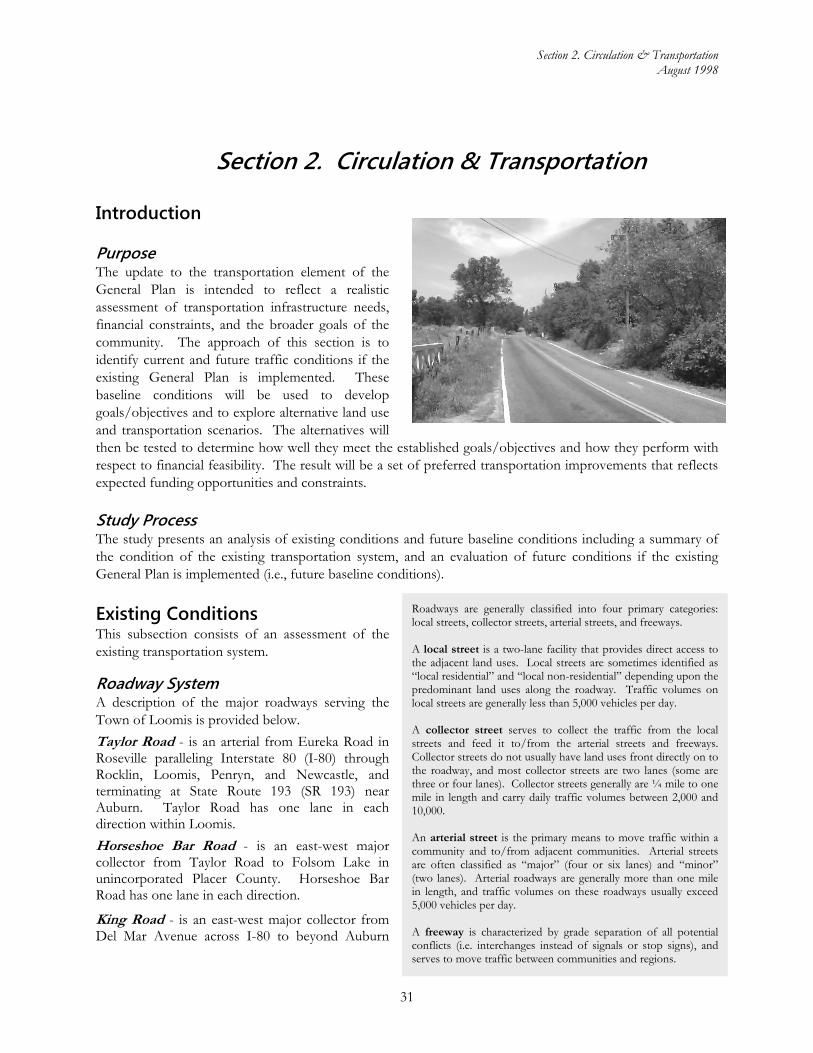
Section 2. Circulation & Transportation August 1998
31
Roadways are generally classified into four primary categories: local streets, collector streets, arterial streets, and freeways. A local street is a two-lane facility that provides direct access to the adjacent land uses. Local streets are sometimes identified as “local residential” and “local non-residential” depending upon the predominant land uses along the roadway. Traffic volumes on local streets are generally less than 5,000 vehicles per day. A collector street serves to collect the traffic from the local streets and feed it to/from the arterial streets and freeways. Collector streets do not usually have land uses front directly on to the roadway, and most collector streets are two lanes (some are three or four lanes). Collector streets generally are ¼ mile to one mile in length and carry daily traffic volumes between 2,000 and 10,000. An arterial street is the primary means to move traffic within a community and to/from adjacent communities. Arterial streets are often classified as “major” (four or six lanes) and “minor” (two lanes). Arterial roadways are generally more than one mile in length, and traffic volumes on these roadways usually exceed 5,000 vehicles per day. A freeway is characterized by grade separation of all potential conflicts (i.e. interchanges instead of signals or stop signs), and serves to move traffic between communities and regions.
Section 2. Circulation & Transportation
Introduction
Purpose The update to the transportation element of the General Plan is intended to reflect a realistic assessment of transportation infrastructure needs, financial constraints, and the broader goals of the community. The approach of this section is to identify current and future traffic conditions if the existing General Plan is implemented. These baseline conditions will be used to develop goals/objectives and to explore alternative land use and transportation scenarios. The alternatives will then be tested to determine how well they meet the established goals/objectives and how they perform with respect to financial feasibility. The result will be a set of preferred transportation improvements that reflects expected funding opportunities and constraints.
Study Process The study presents an analysis of existing conditions and future baseline conditions including a summary of the condition of the existing transportation system, and an evaluation of future conditions if the existing General Plan is implemented (i.e., future baseline conditions).
Existing Conditions This subsection consists of an assessment of the existing transportation system.
Roadway System A description of the major roadways serving the Town of Loomis is provided below.
Taylor Road - is an arterial from Eureka Road in Roseville paralleling Interstate 80 (I-80) through Rocklin, Loomis, Penryn, and Newcastle, and terminating at State Route 193 (SR 193) near Auburn. Taylor Road has one lane in each direction within Loomis.
Horseshoe Bar Road - is an east-west major collector from Taylor Road to Folsom Lake in unincorporated Placer County. Horseshoe Bar Road has one lane in each direction.
King Road - is an east-west major collector from Del Mar Avenue across I-80 to beyond Auburn

Section 2. Circulation & Transportation August 1998
32
Folsom Road. King Road has one lane in each direction.
Sierra College Boulevard - is a principal arterial from SR 193, south through Loomis, Rocklin, and Roseville, and into Sacramento County, where it becomes Hazel Avenue. Sierra College Boulevard has one lane in each direction from SR 193 to south of I-80.
Barton Road - is a north-south major collector from Brace Road into Granite Bay in unincorporated Placer County. Barton Road has one lane in each direction.
Brace Road - is an east-west major collector from Sierra College Boulevard across I-80 to Laird Road. Brace Road has one lane in each direction.
Swetzer Road - is a two-lane collector street from King Road north-south to beyond the Town Limits.
Table 2-1 summarizes the existing number of travel lanes, posted speed limit, travel lane and shoulder widths, and pavement condition of these roadways.
Table 2-1: Existing Roadway System Roadway From To Posted
Speed Limit Travel Lane and Shoulder Widths
Pavement Condition
Taylor Road West Town Limits
Downtown 35 mph 12- to 14-ft. lanes 3- to 8-ft. shoulders
Good
Through Downtown 25 mph 12- to 16-ft. lanes 0- to 8-ft. shoulders
Fair
Downtown East Town Limits
35 to 45 mph 11- to 12-ft. lanes 0- to 4-ft. shoulders
Poor to Fair
Sierra College Blvd.
South Town Limits
Interstate 80 55 mph 12- to 14-ft. lanes 6- to 8-ft. shoulders
Fair to Good
Interstate 80 Brace Road 45 mph 12-ft. lanes 6- to 8-ft. shoulders
Poor to Fair
Brace Road North Town Limits
45 to 55 mph 12- to 14-ft. lanes 4- to 8-ft. shoulders
Fair to Good
Horseshoe Bar Road Taylor Road Interstate 80 25 mph 12- to 15-ft. lanes 0- to 8-ft. shoulders
Fair
Interstate 80 East Town Limits
30 mph 10- to 12-ft. lanes 0- to 2-ft. shoulders
Good
King Road Sierra College Blvd.
Interstate 80 35 to 40 mph 11- to 12-ft. lanes 0- to 6-ft. shoulders
Fair to Good
Barton Road Brace Road South Town Limits
40 mph 10- to 12-ft. lanes 0- to 2-ft. shoulders
Fair to Good
Brace Road Sierra College Blvd.
Barton Road 35 mph 12-ft. lanes 0- to 2-ft. shoulders
Fair to Good
Bankhead Road Sierra College Blvd.
King Road 25 mph 9- to 10-ft. lanes 0- to 1-ft. shoulders
Fair
Rocklin Road Barton Road West Town Limits
40 mph 11- to 12-ft. lanes 0- to 2-ft. shoulders
Fair to Good
Swetzer Road King Road North Town Limits
25 to 35 mph 12- to 15-ft. lanes 4- to 8-ft. shoulders
Fair to Poor
Note: Pavement condition categorized as poor, fair, or good based on field observations.
Posted speed limits range from 25 miles per hour on roadways with fronting residences such as Bankhead Road to 55 miles per hour on limited-access arterials such as Sierra College Boulevard. Pavement condition was rated as good, fair, or poor depending on the frequency of potholes, cracks, and pavement overlays. Most study roadways were rated as fair or good with the exception of Taylor Road east of King Road, which

Section 2. Circulation & Transportation August 1998
33
was rated as poor. Several of the non-study roadways (such as Bankhead Road, Del Mar Avenue, and Saunders Avenue) have been the subject of complaints by residents regarding pavement quality. Field observations of these roadways showed some potholes and substantial elevation changes that are consistent with minimal or no sub-base material Figure 2-1 displays average weekday daily traffic volumes on key roadways within the Town of Loomis. Fehr & Peers Associates conducted traffic counts in June 1998, where necessary, to complement the 1996 and 1997 count data from the Shadowbrook EIR and the Downtown Loomis Improvement Traffic Circulation and Parking Study. The segments of Taylor Road and Horseshoe Bar Road near the downtown area and Sierra College Boulevard near Taylor Road carry the greatest volumes of traffic (between 9,000 and 14,000 vehicles per day). Traffic volumes on King Road, Swetzer Road, Webb Street, Barton Road, Laird Road, and Brace Road range from approximately 1,000 to 5,000 vehicles per day. Table 2-2 summarizes the daily volume-to-capacity ratio for each roadway based upon regional standards for rural and urban roadways. Figure 2-2 displays a.m. and p.m. peak hour turning movement volumes, lane configurations, and traffic control devices at key intersections within the Town of Loomis. Traffic counts were conducted by Fehr & Peers Associates where necessary in June, 1998 to complement the 1996 and 1997 counts from the Shadowbrook EIR and the Downtown Loomis Parking and Circulation Study. As shown, traffic signals are located on Taylor Road at Sierra College Boulevard, Horseshoe Bar Road, and King Road. Traffic signals are also located at the I-80/Sierra College Boulevard eastbound and westbound ramps intersections and at the I-80/Horseshoe Bar Road westbound ramps intersection. The remaining study intersections are stop-controlled on the side-street approach. Peak hour intersection operations were evaluated by computing the level of service (LOS) at each intersection. Level of service is a term that describes the operating performance of an intersection or roadway, and is reported on a scale from A to F, with A representing the best performance and F representing the worst. Table 2-3 relates the operational characteristics associated with service level category. Intersections were analyzed using the methodology contained in the Highway Capacity Manual - Special Report 209 (Transportation Research Board, 1994). This methodology determines the level of service by computing the average delay per vehicle and comparing the results to the thresholds shown in Table 2-3. Table 2-4 displays the existing a.m. and p.m. peak hour levels of service at each intersection. Table 2-4 shows that each intersection currently operates at LOS C or better during the a.m. and p.m. peak hours with the exception of the Taylor Road/King Road intersection, which operates at LOS D during the a.m. peak hour. Field observations indicate that this intersection actually operates at LOS E or F during the peak 30 minutes in the morning when school is in session. To avoid this congested intersection, many motorists use Webb Street to travel between northwest Loomis and the downtown area. Although the Taylor Road/Horseshoe Bar Road intersection operates at LOS C or better during each peak hour, field observations indicated significant queuing of northbound right-turn vehicles (queues extended beyond Laird Street), eastbound through vehicles, and westbound left-turn vehicles (queues exceeded the available turn lane storage). Sierra College Boulevard, Taylor Road, and Horseshoe Bar Road (north of I-80) carry the greatest volume of truck traffic in Loomis. Traffic counts conducted in September, 1997 revealed that the segments of Taylor Road and Horseshoe Bar Road through the downtown area carried about 400 to 450 trucks (three or more axles) per day. This represents between two and four percent of all traffic on these roadways. With the exception of Sierra College Boulevard, none of the roadways within Loomis are posted as truck routes. King Road has “Not a Truck Route” signs, while Brace Road has signs indicating truck weight restrictions.

Section 2. Circulation & Transportation August 1998
34
Figure 2-1: Existing Daily Volumes

Section 2. Circulation & Transportation August 1998
35
Figure 2-2: Existing Peak Hour Volumes

Section 2. Circulation & Transportation August 1998
36
Table 2-2: Roadway Segment Operations - Existing Conditions
Roadway Segment Number of
Lanes Average
Daily Traffic Daily Volume-
to-Capacity Ratio
Sierra College Blvd. - north of King Road 2 6,100 0.27Sierra College Blvd. - between King Road and Bankhead Road 2 5,400 0.24Sierra College Blvd. - between Bankhead Road and Taylor Road 2 9,300 0.41Sierra College Blvd. - between Taylor Road and I-80 2 12,300 0.54Sierra College Blvd. - between Rocklin Rd. and Ridge Park Dr. 2 14,400 0.63Taylor Rd. - between Sierra College Blvd. and Horseshoe Bar Rd. 2 10,500 0.70Taylor Rd. - between Horseshoe Bar Road and King Road 2 13,800 0.92Taylor Rd. - east of King Road 2 6,100 0.41Horseshoe Bar Rd. - between Taylor Road and Magnolia Ave. 2 10,400 0.69Horseshoe Bar Rd. - between Magnolia Avenue and I-80 2 12,600 0.84Horseshoe Bar Rd. - between I-80 and Brace Road 2 5,300 0.23Horseshoe Bar Rd. - east of Oak Tree Lane 2 3,500 0.15King Rd. - between Sierra College Blvd. and Bankhead Road 2 800 0.05King Rd. - between Arcadia Avenue and Taylor Road 2 5,300 0.35King Rd. - between Taylor Road and Boyington Road 2 3,900 0.26Webb Street - between Saunders Avenue and Taylor Road 2 3,500 0.23Bankhead Rd. - between Sierra College Blvd. and King Road 2 3,400 0.23Del Mar Avenue - north of Alvis Court 2 400 0.03Laird Road - south of High Cliff Road 2 1,900 0.08Barton Road - south of Brace Road 2 1,400 0.06Barton Road - north of Rocklin Road 2 1,700 0.07Rocklin Road - west of Barton Road 2 4,500 0.20Brace Road - west of Barton Road 2 1,800 0.08Swetzer Road - north of King Road 2 4,900 0.21Humphrey Road - north of King Road 2 2,000 0.09

Section 2. Circulation & Transportation August 1998
37
Table 2-3: Intersection Level of Service Definitions
Level of Service
Description Unsignalized Intersections
(Average Delay)
Signalized Intersections
(Average Delay) A Represents free flow. Individual users are
virtually unaffected by others in the traffic stream.
< 5 sec/veh < 5 sec/veh
B Stable flow, but the presence of other users in the traffic stream begins to be noticeable.
5.1 - 10.0 sec/veh 5.1 - 15.0 sec/veh
C Stable flow, but the operation of individual users becomes significantly affected by interactions with others in the traffic stream.
10.1 - 20.0 sec/veh 15.1 - 25.0 sec/veh
D Represents high-density, but stable flow. 20.1 - 30.0 sec/veh 25.1 - 40.0 sec/veh
E Represents operating conditions at or near the capacity level.
30.1 - 45.0 sec/veh 40.1 - 60.0 sec/veh
F Represents forced or breakdown flow. > 45 sec/veh > 60 sec/veh
Source: Highway Capacity Manual - Special Report 209 (Transportation Research Board, 1994) Fehr & Peers Associates, 1998.
Table 2-4: Peak Hour Intersection Operations - Existing Conditions
Intersection Control AM Peak Hour PM Peak Hour Average
Delay (sec/veh)
Level of Service
Average Delay
(sec/veh)
Level of Service
Taylor Road/Oak Street 2-way Stop < 5.0 A < 5.0 ATaylor Road/Walnut Street 2-way Stop < 5.0 A < 5.0 ATaylor Road/Horseshoe Bar Road Signal 21.8 C 13.8 BTaylor Road/Webb Street 2-way Stop < 5.0 A < 5.0 ATaylor Road/King Road Signal 30.9 D 22.9 CKing Road/Webb Street 2-way Stop < 5.0 A < 5.0 AKing Road/Sierra College Boulevard 2-way Stop < 5.0 A < 5.0 ATaylor Road/Sierra College Road Signal 16.9 C 18.4 CI-80 Westbound Ramps/Horseshoe Bar Rd. Signal 15.4 C 17.5 CI-80 Eastbound Ramps/Horseshoe Bar Rd. 2-way Stop < 5.0 A 6.8 BI-80 Westbound Ramps/Sierra College Blvd. Signal 24.3 C 22.8 CI-80 Eastbound Ramps/Sierra College Blvd. Signal 12.7 B 21.7 C
The presence of the Union Pacific Railroad tracks limits access between northwest Loomis and the downtown area. At-grade crossings are currently provided at King Road, Webb Street, and Sierra College Boulevard. Union Pacific Railroad representatives and the Loomis Fire Protection District are concerned about the close spacing (about 1,000 feet) of the railroad crossings at Webb Street and King Road. Given that trains frequently exceed 1,000 feet in length, it is possible that a slow moving or stopped train could simultaneously block the Webb Street and King Road at-grade crossings. The primary connections between southeast Loomis and the downtown area (i.e., across I-80) are Horseshoe Bar Road and Brace Road. These two roads have narrow travel lanes and little or no paved shoulders, which limits travel speeds for emergency vehicles.

Section 2. Circulation & Transportation August 1998
38
Parking The only wide-spread area within the Town that experiences a consistent shortage of parking is the downtown area in the vicinity of Taylor Road. The 1998 Downtown Loomis Traffic Circulation and Parking Study found that the heaviest parking utilization occurs along, and immediately south of, Taylor Road between Horseshoe Bar Road and Walnut Street. On-street and off-street parking in this area was observed to be 75 to 100 percent utilized. The on-street parking spaces on Taylor Road adjacent to the Post Office were observed to have the greatest parking demand.
Transit System Public transportation service is provided to the Loomis area by Placer County Transit. The Loomis-Penryn Shuttle interconnects Loomis, Penryn, Lincoln, and Sierra College in Rocklin. This route has stops within Loomis at Taylor Road/King Road, Flag Stop (at Stahr Liquor Store), Del Oro High School, and Raleys. Service is provided between 6:30 a.m. and 4:15 p.m. Monday through Friday with four stops per day. Loomis is also served by the Auburn-Roseville Express Shuttle, which runs from 6:00 a.m. to 8:00 p.m. Monday through Friday, and 10:00 a.m. to 6 p.m. on Saturday. This service operates with one-hour headways (the time between bus pick-ups/drop-offs).
Bicycle/Pedestrian System The existing bicycle system consists of a series of Class I (off-street trails) and Class II (on-street lanes with guide signs and pavement marking) bike lanes on major arterials. The Class II facilities are generally well signed, but the pavement markings and surface quality are less than ideal in many cases. Table 2-5 summarizes existing bicycle facilities in the Town.
Table 2-5: Bicycle Facilities
Facility Type Location Limits Condition Class I* South side of
Taylor Road King Road to Del Oro High Type of facility unclear (see text),
pavement markings poor King Road South of Bankhead Road Good
Class II Sierra College Boulevard
Granite Drive to Del Mar Avenue Pavement markings not visible
Taylor Road Sierra College Boulevard to Oak Street and Webb Street to King Road
Pavement condition poor in locations, markings not visible
King Road Sierra College Boulevard to I-80 GoodSource: Fehr and Peers, 1998. *both facilities are off street (Class I) but are one-way and less than eight feet (Class II). The bicycle facility on the south side of Taylor Road between King Road and Del Oro High School is unusual. Although the facility is off street for most of its length (which is consistent with a Class I), it does not have sufficient width to meet Caltrans standards for a Class I and it is signed and marked as a one-way (eastbound) Class II lane.
Rail System Existing train traffic through Loomis uses two tracks: westbound traffic uses the tracks adjacent to Taylor Road, while eastbound traffic uses the tracks near Sierra College Boulevard. Installation of Centralized Traffic Control (CTC) by Union Pacific Railroad is probable, allowing two way rail traffic to be handled more easily and safely on the ‘westbound’ track. The historic train station at the terminus of Horseshoe Bar Road is the planned location for passenger service. The existing Capitol Corridor train service provides four trains per day in each direction between Sacramento and San Jose. Two trains per day extend east from Sacramento with stops in Roseville, Rocklin, Auburn, and Colfax. In the near future, passenger rail service will be expanded to include Loomis and Newcastle.

Section 2. Circulation & Transportation August 1998
39
Existing Deficiencies Existing deficiencies of the roadway, bicycle/pedestrian systems are identified and displayed in Table 2-6. A review of the transit and rail systems did not reveal any existing deficiencies.
Table 2-6: Existing Deficiencies
Facility Description of Deficiency Roadways
Taylor Road through the downtown area
Existing traffic volumes are near the capacity of the road through the downtown area. Travel speeds through downtown are also perceived as excessive by many for pedestrian/bicycle safety.
Taylor Road east of the downtown area
Poor pavement condition and narrow travel lanes and shoulders results in difficult driving conditions.
Horseshoe Bar Road between I-80 and Taylor Road
Existing traffic volumes are near the capacity of the road.
Horseshoe Bar Road south of I-80 Sharp curves and narrow travel lanes and shoulders result in difficult driving conditions.
Bankhead Road and Barton Road Narrow travel lanes and little or no paved shoulders result in difficult driving conditions.
Several minor roadways (such as Bankhead, Saunders, etc.)
Poor pavement quality.
Intersections Taylor Road/Horseshoe Bar Road Intersection
Significant delays occur on three of the four approaches due to heavy traffic volumes and inefficient signal timing.
Taylor Road/King Road Intersection Significant delays occur in the morning when school is in session. Insufficient turn lane storage contributes to delays.
Sierra College Boulevard/Brace Road Intersection
Lack of left-turn bays on Sierra College Boulevard and a traffic signal results in operational problems and safety concerns.
Bicycle/Pedestrian System Taylor Road through the downtown area
The striping for the Class II bicycle lane is weathered and difficult to see. The Class II bicycle lane terminates at Oak Street creating a gap to King Road.
Taylor Road, Sierra College Boulevard, King Road, and Horseshoe Bar Road
Sidewalks are discontinuous throughout Taylor Road, King Road, Sierra College Boulevard, and Horseshoe Bar Road.
Taylor Road from King Road to Del Oro High
Facility is blend of Class I and II, which is confusing to users and does no meet standards.
Parking Downtown Parking Lack of available parking during peak periods.

Section 2. Circulation & Transportation August 1998
40
Future Baseline Conditions This subsection provides an assessment of future transportation conditions assuming that the existing General Plan is implemented. This “future baseline” condition will be used to explore alternative land use and transportation scenarios.
Planned Transportation Improvements & Land Use Growth Future (2020) baseline conditions assume buildout of Loomis with the current land use zoning and projected development in surrounding communities by 2020. It also assumes the following transportation improvements outside the Loomis area (as listed in the 1996 Draft Placer County Regional Transportation Plan), but no transportation improvements within Loomis:
Widen Sierra College Boulevard to six lanes north of I-80 to Granite Drive; Reconstruct the I-80/Sierra College Boulevard interchange; Widen I-80 from a six-lane to an eight-lane freeway east and west of Horseshoe Bar Road; Install bicycle lanes on Taylor Road from Midas Avenue (in Rocklin) to Sierra College Boulevard
and from King Road to the Loomis Town Limits; and Provide passenger rail service in Loomis.
Transportation improvements that were identified in the Town of Loomis General Plan and the Downtown Parking and Circulation Study were not assumed in place. The City of Rocklin 2020 traffic model, which covers the entire Sacramento region, was utilized to obtain future traffic forecasts because this model contains more zonal and roadway network detail than the other available models (SACMET, PCTPA models). The future land uses within Loomis were modified slightly by Fehr & Peers Associates to reflect buildout of Loomis based on the current General Plan zoning. In addition, new development in the downtown area was assumed based on projections contained in the Loomis Town Center Master Plan (1992). Table 2-7 summarizes the projected land use totals within Loomis assuming buildout of the existing General Plan. It should be noted that these totals have been approximated based on the Town of Loomis Zoning Map (1989) and the Loomis Town Center Master Plan (1992).
Table 2-7: Estimated Land Use Totals within Loomis
Assuming Buildout of General Plan
Land Use Amount Residential 4,046 dwelling unitsCommercial 1,476,000 square feetOffice 182,000 square feetIndustrial 1,220,000 square feetNote: Does not include supporting land uses such as schools and parks.
These totals represent an approximate 80 percent increase over the existing housing supply (estimated to be 2,275 units in 1996 based on Department of Finance and Census data) and a five-fold increase in the amount of commercial uses (based on the base year (1992) traffic model). The vast majority of the increase in commercial square footage is expected to occur within the downtown area, where more than one million square feet are planned.

Section 2. Circulation & Transportation August 1998
41
Future Baseline Traffic Forecasts Figure 2-3 displays average daily traffic volume forecasts under future (2020) baseline conditions. Sierra College Boulevard is projected to carry between 18,200 vehicles per day south of King Road to 39,300 vehicles per day near the southern Town limits. This is an approximate three-fold increase over existing traffic that is primarily attributable to new developments, such as Twelve Bridges, Whitney Oaks, and Clover Valley Lakes planned in the surrounding communities. Traffic volumes on Taylor Road will range from about 1,500 vehicles per day near the north Town limits to about 17,100 vehicles per day through the downtown area. Traffic volumes on King Road, Swetzer Road, Webb Street, Barton Road, Laird Road, and Brace Road are expected to range from 2,800 to 7,600 vehicles per day. Table 2-8 summarizes the daily volume-to-capacity ratio for each roadway (based on capacities used by the City of Sacramento and Sacramento County). Table 2-8 shows that projected volumes exceed the capacity on the segments of Taylor Road and Horseshoe Bar Road in the downtown area. The planned widening of Sierra College Boulevard to six lanes provides adequate capacity to accommodate the projected traffic levels in 2020.
Table 2-8: Roadway Segment Operations - Existing and Future Baseline Conditions
Roadway Segment
Existing Conditions Future Baseline Conditions
Average Daily
Traffic
Daily V/C Ratio1
Average Daily
Traffic
Daily V/C Ratio1
Sierra College Blvd. - north of King Road 2 6,100 0.27 23,700 1.03Sierra College Blvd. - between King Road and Bankhead Road 5,400 0.24 18,200 0.79Sierra College Blvd. - between Bankhead Road and Taylor Rd. 9,300 0.41 27,100 1.18Sierra College Blvd. - between Granite Drive and Taylor Rd. 12,300 0.54 36,200 1.58Sierra College Blvd. - between Rocklin Rd. and Ridge Park Dr. 14,400 0.63 39,300 1.72Taylor Rd. - between Sierra College Blvd. and Horseshoe Bar Rd.
10,500 0.70 17,100 1.14
Taylor Rd. - between Horseshoe Bar Road and King Road 13,800 0.92 18,300 1.22Taylor Rd. - east of King Road 6,100 0.41 11,500 0.77Horseshoe Bar Rd. - between Taylor Road and Magnolia Ave. 10,400 0.69 14,300 0.95Horseshoe Bar Rd. - between Magnolia Avenue and I-80 12,600 0.84 15,900 1.06Horseshoe Bar Rd. - between I-80 and Brace Road 5,300 0.23 7,900 0.35Horseshoe Bar Rd. - east of Oak Tree Lane 3,500 0.15 3,600 0.16King Rd. - between Sierra College Blvd. and Bankhead Road 800 0.05 5,300 0.35King Rd. - between Arcadia Avenue and Taylor Road 5,300 0.35 7,600 0.51King Rd. - between Taylor Road and Boyington Road 3,900 0.26 5,800 0.39Webb Street - between Saunders Avenue and Taylor Road 3,500 0.23 4,800 0.32Bankhead Rd. - between Sierra College Blvd. and King Road 3,400 0.23 6,600 0.44Del Mar Avenue - north of Alvis Court 400 0.03 1,400 0.09Laird Road - south of High Cliff Road 1,900 0.08 4,800 0.21Barton Road - south of Brace Road 1,400 0.06 2,800 0.12Barton Road - north of Rocklin Road 1,700 0.07 2,800 0.12Rocklin Road - west of Barton Road 4,500 0.20 12,500 0.55Brace Road - west of Barton Road 1,800 0.08 3,100 0.14Swetzer Road - north of King Road 4,900 0.33 6,200 0.41Humphrey Road - north of King Road 2,000 0.13 2,800 0.19Notes: 1 V/C Ratio = Volume-to-Capacity Ratio.
2 Sierra College Boulevard assumed to remain two lanes within Loomis.

Section 2. Circulation & Transportation August 1998
42
Figure 2-3: Future Baseline Volumes

Section 2. Circulation & Transportation August 1998
43
Future Deficiencies Future deficiencies of the roadway, bicycle/pedestrian systems are identified and displayed in Table 2-9 assuming no improvements are made. A review of the transit and rail systems did not reveal any future deficiencies.
Table 2-9: Future Deficiencies
Facility Description of Deficiency Roadways
Taylor Road and Horseshoe Bar Road through the downtown area
Projected traffic volumes will exceed the capacity of these roadways.
Taylor Road east of the downtown area
Poor pavement condition and narrow travel lanes and shoulders will result in difficult driving conditions.
Horseshoe Bar Road south of I-80 Sharp curves and narrow travel lanes and shoulders will result in difficult driving conditions.
Bankhead Road and Barton Road Narrow travel lanes and little or no paved shoulders will result in difficult driving conditions.
Sierra College Boulevard (within Loomis)
Projected traffic volume will exceed capacity of roadway
Several minor roadways (such as Bankhead, Saunders, etc.)
Poor pavement quality.
Intersections Taylor Road/Horseshoe Bar Road Intersection
Projected increases in traffic will significantly worsen operations at this intersection.
Taylor Road/King Road Intersection Projected increases in traffic will significantly worsen operations at this intersection.
Sierra College Boulevard/Brace Road Intersection
Lack of left-turn bays on Sierra College Boulevard and a traffic signal will result in operational problems and safety concerns.
Bicycle/Pedestrian System Taylor Road through the downtown area
The striping for the Class II bicycle lane is weathered and difficult to see. The Class II bicycle lane on the north side of Taylor Road terminates at Oak Street creating a gap to King Road.
Taylor Road, Sierra College Boulevard, King Road, and Horseshoe Bar Road
Sidewalks are discontinuous throughout Taylor Road, King Road, Sierra College Boulevard, and Horseshoe Bar Road.
Taylor Road from King Road to Del Oro High
Facility is blend of Class I and II, which is confusing to users and does no meet standards.
Parking Downtown Parking Lack of available parking during peak periods.

Section 3. Natural Resources August 1998
44
Section 3. Natural Resources
Introduction This chapter summarizes information concerning the natural resources of the planning area, including water, soil and mineral, biological, and air resources. It represents a compilation of existing published information combined with reconnaissance-level field surveys.
Water Resources
Surface Water The planning area is located within the Loomis Basin, a relatively shallow depression covering 88 square miles between the Sierra Nevada and the floor of the Sacramento Valley. Technically, the Loomis Basin is not a basin at all, as it is drained by several tributaries of westward-trending streams flowing from higher elevations. The planning area lies within a portion of the Dry Creek watershed. Several manmade water features, including reservoirs and canals, are also present within Loomis. The most important surface water features within the planning area are described below and shown on Figure 3-1. Dry Creek Watershed The Dry Creek watershed covers about 101 square mile in Placer and Sacramento counties, with its headwaters located in the upper portions of the Loomis Basin, near Penryn and Newcastle. Ultimately, Dry Creek empties into the Natomas East Main Drain, a man-made flood control channel that captures runoff west of the communities of Rio Linda and Robla in Sacramento County. The Natomas East Main Drain directs water southward, eventually emptying into the Sacramento River in Discovery Park. Dry Creek experiences frequent flooding events in the Rio Linda area, well downstream of the Loomis planning area. Municipal water supplies come from outside this watershed, and are brought to the area via pipes or canals from the Yuba, Bear, American, or Rubicon rivers higher in the Sierra Nevada (see Section 5, Public Services and Facilities, Water and Sewer Services). The major tributaries of the Dry Creek watershed within Loomis are described below. Antelope Creek Antelope Creek is the northwesternmost of the three primary tributaries of Dry Creek within the planning area. The smallest of these tributaries, it roughly parallels Sierra College Boulevard before crossing it to the west south of King Road. In Loomis, Antelope Creek drains the rural western portion of the Town. Antelope Creek ultimately flows through the cities of Rocklin and Roseville before joining Dry Creek near Sculpture Park in Roseville. Secret Ravine Secret Ravine is the primary drainage in the Town south of Interstate 80, and roughly parallels the freeway from its headwaters in Newcastle. After leaving the Town, it flows through the City of Rocklin before joining Miners Ravine in Roseville. From there, the stream enters Dry Creek at Sculpture Park in Roseville.

Section 3. Natural Resources August 1998
45

Section 3. Natural Resources August 1998
46
Figure 3-1. Surface Water Features

Section 3. Natural Resources August 1998
47
Sucker Ravine Sucker Ravine is the smallest of the primary drainages within the Loomis town limits. This minor creek system drains the southwestern part of Loomis and has been partially realigned and modified for flood control purposes. Sucker Ravine crosses under Taylor Road and Interstate 80, ultimately joining Secret Ravine in the City of Rocklin. Clover Valley Creek Though outside of the existing Town limits, this tributary of Antelope Creek runs in a narrow valley just inside the western edge of the planning area. It is physically separated from the Town by a distinctive ridge, and no direct roadway access from Loomis is available. It eventually empties into Antelope Creek about a mile southwest of Loomis, in the City of Rocklin. Unnamed drainages Two significant unnamed drainages traverse the Town, flowing from north to south. The first begins just north of Del Oro High School and crosses Taylor Road and Interstate 80 before joining Secret Ravine. The second begins in Penryn and joins Antelope Creek in the northwestern part of the Town near King Road. Lakes and Reservoirs No natural lakes of any substantial size are located within the Loomis planning area. However, several small unnamed reservoirs, built primarily for flood control or water storage purposes, are found within the Town. None of these is greater than 800 feet across and they are generally located on private property. Canals Several manmade canals, most notably the Boardman Canal, traverse the southern portion of Loomis. The Boardman Canal flows through the planning area and terminates in Roseville Reservoir within the City of Roseville. The canals are owned and operated by the Placer County Water Agency (PCWA), the service provider for the Town. The source of most of the water for these canals is the Yuba/Bear River (see Section 5, Public Services & Facilities, Water and Sewer Services, for further discussion).
Groundwater The planning area is part of the Sierra Nevada geomorphic province, an area generally described as being underlain by hard, non-water-bearing rocks (USGS, 1985). The water-bearing capacity of this area is limited to alluvial soils from highly weathered granite. Distinct aquifers do not exist in the planning area because of the presence of shallow decomposed granitic soils and dense bedrock. Limited quantities of groundwater, however, provide a domestic household water supply within alluvial material of ancient buried stream channels, and along open fractures within the bedrock. The Loomis planning area overlies a portion of the Placer County Hydrologic Basin, as defined by the California Department of Water Resources. Groundwater yield within this basin is sporadic and highly variable. Individual wells may demonstrate sufficient yields, while nearby wells may show almost no yield (Horseshoe Bar/Penryn Community Plan Draft EIR, 1993). Groundwater in sufficient quantity to supply domestic requirements occurs only in small openings along bedrock fractures. Wells within alluvial Terrace deposits are unreliable and subject to surface contamination. During recharge by winter rains, water tables rise up to near the surface, where the quality of groundwater decreases as it intercepts septic tank leach zones. Well depths typically range from 50 to 150 feet below the surface, with the most common depth of encountering water within granitic rocks being between 60 and 70 feet. The average production for granitic rock wells in the planning area is four to nine gallons per minute. (Horseshoe Bar/Penryn Community Plan Draft EIR, 1993). Although few comprehensive groundwater studies within the planning area are available, groundwater depth is known to be highly variable. For example, groundwater depth in the southeastern portion of the planning area is estimated to be in the range of 300 feet below the surface (Town of Loomis, Sherwood Park Draft EIR, 1998).

Section 3. Natural Resources August 1998
48
There has been no recent hydrogeologic evaluation of available groundwater supplies within the underlying basin. Livingston (1974) estimated the volume of available groundwater to be between 40 and 200 million gallons per day.
Water Quality Virtually no data on streamflow and water quality for streams in the planning area were found in a review of local, state, and federal agency records. Limited water quality data, however, are available from PCWA for its canal and water distribution system. Although the source of PCWA’s water is outside the planning area, a portion of the canal system flows through the area. Test results show that contaminants levels of inflow into the canal distribution system are consistently below maximum allowable levels, except those of coliform bacteria, which fluctuate with the time of year (Placer County, Horseshoe Bar/Penryn Community Plan Draft EIR, 1993). The primary sources of pollution to surface and groundwater resources include stormwater runoff from paved areas, which can contain hydrocarbons, sediments, pesticides, herbicides, toxic metals, and coliform bacteria. Seepage from sewage treatment lagoons can further contribute to degraded water quality in the form of elevated nitrate levels. Improperly placed septic tank leach fields can cause similar types of contamination. Illegal waste dumping can introduce contaminants such as gasoline, pesticides, herbicides and other harmful chemicals. The growing use of septic tanks in the area may adversely affect both surface and groundwater quality. Parts of the planning area are subject to high nitrate concentrations from overuse of septic tanks and agricultural uses. While no detailed study has been performed, several shallow wells have shown high nitrate concentrations, suggesting surface contamination. Septic tanks are also a source of pollution to some wells in both alluvial and granitic rocks. Septic tanks discharging into alluvium have a high potential to pollute wells producing from the same deposit because of high permeability and low gradient. In the winter, the rains raise the water table in these areas, which can exacerbate possible contamination.
Regulatory Framework Development in the planning area is subject to various local, state, and federal regulations and permits regarding the use of water resources. The Placer County Flood Control and Water Conservation District, California Department of Water Resources, and Central Valley Regional Water Quality Control Board are the primary agencies responsible for the protection of watersheds, floodplains, and water quality. The Placer County Department of Health and Medical Services is the primary agency responsible for establishing design standards and permitting septic tanks and wells. The federal government administers the National Pollutant Discharge Elimination System (NPDES) permit program, which regulates discharges into surface waters. Section 404 of the Clean Water Act prohibits the discharge of dredged or fill materials into Waters of the United States or adjacent wetlands without a permit from the U.S. Army Corps of Engineers.
Soil & Mineral Resources
Regional Geology The Loomis planning area is located within the Sierra Nevada geomorphic province, which extends about 400 miles from Lassen Peak in the north to the Mojave Desert in the south. Much of the Sierra Nevada batholith is composed of Mesozoic (144 million to 245 million years ago--roughly the period in which dinosaurs lived) plutonic and volcanic rocks. A metamorphic belt, characterized by extremely folded and faulted Paleozoic (286 to 700 million years ago) to Mesozoic rocks, lies along the western edge of the batholith. More recent
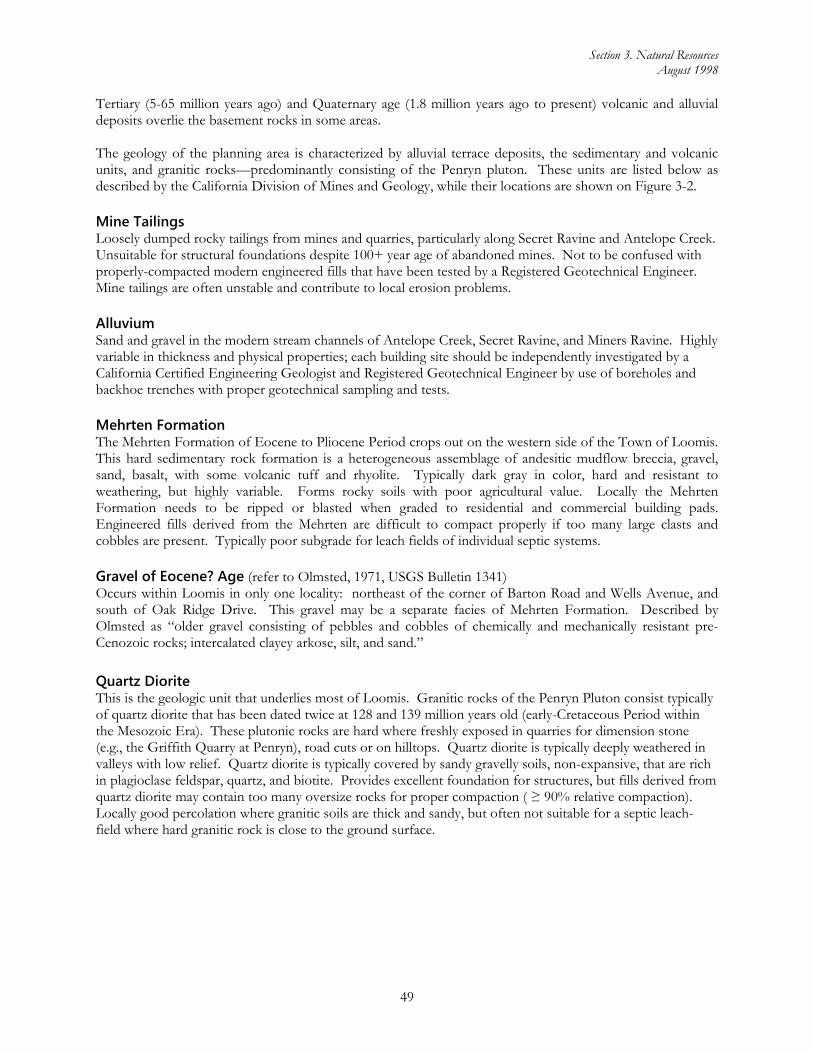
Section 3. Natural Resources August 1998
49
Tertiary (5-65 million years ago) and Quaternary age (1.8 million years ago to present) volcanic and alluvial deposits overlie the basement rocks in some areas. The geology of the planning area is characterized by alluvial terrace deposits, the sedimentary and volcanic units, and granitic rocks—predominantly consisting of the Penryn pluton. These units are listed below as described by the California Division of Mines and Geology, while their locations are shown on Figure 3-2. Mine Tailings Loosely dumped rocky tailings from mines and quarries, particularly along Secret Ravine and Antelope Creek. Unsuitable for structural foundations despite 100+ year age of abandoned mines. Not to be confused with properly-compacted modern engineered fills that have been tested by a Registered Geotechnical Engineer. Mine tailings are often unstable and contribute to local erosion problems. Alluvium Sand and gravel in the modern stream channels of Antelope Creek, Secret Ravine, and Miners Ravine. Highly variable in thickness and physical properties; each building site should be independently investigated by a California Certified Engineering Geologist and Registered Geotechnical Engineer by use of boreholes and backhoe trenches with proper geotechnical sampling and tests. Mehrten Formation The Mehrten Formation of Eocene to Pliocene Period crops out on the western side of the Town of Loomis. This hard sedimentary rock formation is a heterogeneous assemblage of andesitic mudflow breccia, gravel, sand, basalt, with some volcanic tuff and rhyolite. Typically dark gray in color, hard and resistant to weathering, but highly variable. Forms rocky soils with poor agricultural value. Locally the Mehrten Formation needs to be ripped or blasted when graded to residential and commercial building pads. Engineered fills derived from the Mehrten are difficult to compact properly if too many large clasts and cobbles are present. Typically poor subgrade for leach fields of individual septic systems. Gravel of Eocene? Age (refer to Olmsted, 1971, USGS Bulletin 1341) Occurs within Loomis in only one locality: northeast of the corner of Barton Road and Wells Avenue, and south of Oak Ridge Drive. This gravel may be a separate facies of Mehrten Formation. Described by Olmsted as “older gravel consisting of pebbles and cobbles of chemically and mechanically resistant pre-Cenozoic rocks; intercalated clayey arkose, silt, and sand.” Quartz Diorite This is the geologic unit that underlies most of Loomis. Granitic rocks of the Penryn Pluton consist typically of quartz diorite that has been dated twice at 128 and 139 million years old (early-Cretaceous Period within the Mesozoic Era). These plutonic rocks are hard where freshly exposed in quarries for dimension stone (e.g., the Griffith Quarry at Penryn), road cuts or on hilltops. Quartz diorite is typically deeply weathered in valleys with low relief. Quartz diorite is typically covered by sandy gravelly soils, non-expansive, that are rich in plagioclase feldspar, quartz, and biotite. Provides excellent foundation for structures, but fills derived from quartz diorite may contain too many oversize rocks for proper compaction ( ≥ 90% relative compaction). Locally good percolation where granitic soils are thick and sandy, but often not suitable for a septic leach-field where hard granitic rock is close to the ground surface.

Section 3. Natural Resources August 1998
50
Figure 3-2. Geology

Section 3. Natural Resources August 1998
51
Topography The topography within the planning area ranges from nearly level interspersed with rolling hills and a few steeper escarpments, such as the Mehrten ridge at the western edge of the planning area adjacent to the eastbound Union Pacific rail line. The highest elevations range from 540-580 feet above sea level, both along the Mehrten ridge and among the rises in the southeastern portion of the planning area. The lowest elevations are along Secret Ravine and Antelope Creek (300-340 feet), which generally traverse the area from northeast to southwest. Most of downtown Loomis lies at about 400 feet, above the immediate flood plains of the two creeks. Interstate 80, Taylor Road and the rail lines follow the easiest grades as they slowly gain elevation when traveling eastbound, gaining from about 40 feet in the case of the freeway to about 160 feet in the case of Taylor Road.
Agricultural Lands Agricultural activities in and around Loomis began as early as the turn of the 19th century. Early pioneers, prior to the Donner party and the gold rush, planted fruit trees and eventually vineyards in the area now known as Loomis. The Loomis Basin soon was known as an excellent location to grow fruit. With the construction of the Central Pacific Railroad through the town in 1864, and a local train station, Loomis soon became a focal point as a fruit shed and shipping depot. The Town of Loomis is no longer a significant commercial agricultural area. Hobby farming occurs on the southeast side of town, on rural residential parcels and in adjacent areas. Residents and visitors value the open views of farming activities in the surrounding landscape.
Soils The Soil Survey of Placer County, Western Part (USDA, Natural Resources Conservation Service, 1980) identified several soil series within the planning area, including: Andregg Coarse Sandy Loam (106 and 107); Caperton-Andregg Coarse Sandy Loams (130 and 131) Inks Cobbly Loam (152 and 153); Rubble Land (180); Xerofluvents, frequently flooded (194); and Xerothents, placer areas (197). By far the most common of these types within the planning area are the Andregg and Caperton-Andregg soils, found throughout the planning area. In general, soils within the planning area exhibit one or more physical constraints to development. Many soils are rocky or cobbly, or percolate slowly because of a cemented underlying pan. Most soils are relatively shallow, rarely more than five feet and more typically about one to two feet. The shallow depth to rock often makes excavation difficult, while the wet-clay characteristics of the common Andregg soil inhibit many uses. Other soils are subject to flooding due to their proximity to creeks. On the whole, no soil within the planning area may be considered ideal for development. These soil types are described below, with their most important characteristics summarized in Table 3-1.
Andregg coarse sandy loam, 2-9% slopes (106) This is a moderately deep, gently rolling, well-drained soil underlain by weathered granitic bedrock. Typically, the surface layer of Andregg soil is grayish brown coarse sandy loam about 15 inches thick. The subsoil is pale brown and very pale brown coarse sandy loam. Permeability is moderately rapid and erosion hazard is moderate.

Section 3. Natural Resources August 1998
52
Andregg coarse sandy loam, 9-15% slopes (107) This is similar to the previously described Andregg soil, except it is found on steeper slopes. Consequently, it has similar appearance and permeability characteristics, but exhibits a high erosion hazard. Surface runoff associated with this soil is medium to rapid. Caperton-Andregg coarse sandy loams (130 & 131) Caperton-Andregg soils are shallow (8 to20 inches deep) and somewhat excessively drained gravelly sandy loams that exhibit moderate erosion potential and low shrink-swell potential. Inks cobbly loams (152 & 153) This is a shallow, well-drained cobbly soil underlain by andesitic conglomerate. The surface layer is generally yellowish brown cobbly loam about five inches thick. The subsoil is brown very cobbly clay loam. Permeability is moderate, surface runoff is medium to rapid, and the erosion hazard is highly variable (slight to high).
Rubble land (180) Rubble land is cobbly and stony mine debris and tailings from dredge or hydraulic mining. It is essentially barren; grass and brush are sparse. Nearly all soil material either has been washed away from hydraulic mining or buried from dredge mining. Surface runoff and erosion hazard are variable. Rubble land is used mainly for watershed and provides limited wildlife habitat. Some areas are a source of aggregate.
Xerofluvents, frequently flooded (194) These soils consist of narrow stringers of somewhat poorly drained recent alluvium adjacent to stream channels. These are variably colored, stratified gravelly clay or sandy loams that generally grade to sand and gravel with increasing depth. Permeability is variable, surface runoff is slow, and erosion hazard is high. The soils are subject to frequent flooding and channelization.
Xerothents, placer areas (197) These soils consist of stony, cobbly and gravelly material commonly adjacent to streams that have been placer mined. The soil material is derived from a mixture of rocks. It is stratified or poorly sorted. Such soils contain enough fine sand and silt to support some grass. The depth of this soil is highly variable, ranging from as little as 6 inches to more than five feet. Permeability, runoff, erosion hazard, and drainage are highly variable. Such areas are frequently flooded because of their typical proximity to streams.

Section 3. Natural Resources August 1998
53
Table 3-1: Soil Constraints to Development Soil
Number and Name
Shallow Excavation
Homes w/o Basements
Roads and Streets
Playgrounds Septic Fields
Drainage Grassed Waterways
106 Andregg Sandy Loam 2-9% slope
Severe: -wetness -too clayey
Severe: -wetness -shrink-swell -low strength
Severe: -shrink-swell -low strength
Severe: -slope -too clayey -percs slowly
Severe: -too clayey
-percs slowly -slope
-percs slowly -slope
107 Andregg Sandy Loam 9-15% slope
Moderate: -slope -depth to rock
Moderate: -slope -depth to rock
Moderate: -slope -depth to rock
Severe: -slope -depth to rock
Severe: -depth to rock
-depth to rock -slope
-slope -rooting depth –drought
152 Inks Cobbly Loam
Severe: -slope -depth to rock
Severe: -slope
Severe: -slope -depth to rock
Severe: -slope -depth to rock -small stones
Severe: -slope -depth to rock
-depth to rock -slope
-slope -rooting depth
180 Rubble Land
Severe: -cemented
Severe: -shrink-swell
Severe: -shrink-swell -low strength
Moderate: -slope -percs slowly -cemented
Severe: -percs slowly -cemented
-percs slowly -cemented
-percs slowly -cemented
194 Xerofluvents
Severe: -floods -wetness
Severe: -floods -wetness
Severe: -floods
Moderate: -floods -wetness
Severe: -floods -wetness
?
?
197 Xerothents
Severe: -floods -large stones
Severe: -floods -large stones
Severe: -floods
Severe: -large stones -floods
Severe: -floods -large stones
_
_
Slight: Moderate: Severe:
Soil properties are generally favorable for the specified use. Any limitations are minor and easily overcome. Soil properties are unfavorable, but limitations can be overcome through careful design. One or more soil properties are unfavorable and difficult to overcome without a major increase in construction effort, design or maintenance.
Source: Soil Survey of Placer County, Western Part (1980).

Section 3. Natural Resources August 1998
54
Biological Resources: Flora & Fauna This section provides a generalized overview of the vegetation and wildlife resources found within the planning area. It includes sections on plant communities and wildlife habitat, special status plant and animal species, and a discussion of wildlife movement corridors.
Plant Communities and Wildlife Habitat The planning area includes both urban and rural elements in a topographically diverse setting. As such, it supports a variety of natural and artificial plant communities and wildlife habitat, as shown in Table 3-2:
Table 3-2: Planning Area Habitat and Sensitivity
Plant Community/Habitat Sensitivity * Oak Woodland and Savanna SensitiveRiparian and Stream Habitat Sensitive
Wetlands SensitivePerennial/Annual Grasslands Sensitive/Common
Chaparral CommonUrban Landscape Artificial
Agriculture Artificial
* See text following for explanation of this notation These habitat types are grouped by sensitivity, as described below. Sensitive Natural Communities For the purpose of this report, a sensitive natural community refers to a habitat which, if substantially degraded or eliminated, would result in significant impacts under CEQA on plants, fish, or wildlife. In the planning area, oak woodland and savanna, native perennial grasslands, riparian and stream habitat, and wetlands are considered sensitive plant communities. These are given special consideration because they provide important ecological functions, including water quality maintenance, stream bank stabilization, and the provision of essential habitat for wildlife and fisheries resources. These communities are typically limited in extent compared to their historical distribution due to clearing for agriculture and other development activity. Sensitive natural communities are afforded special consideration under federal, state and county laws. A brief description of these communities follows. Oak Woodland and Savanna Blue oak woodland, interior live oak woodland, and valley oak savanna are the dominant oak associations that occur throughout the planning area. Blue oak woodland occurs primarily in the portions of the planning area that support shallow or infertile soils. Typically, blue oak woodland includes a mixture of blue oak, foothill pine, buck brush, coffee berry and various grassland species. Interior live oak woodland occurs in lower-lying portions of the planning area, typically along riparian and stream corridors. In some areas, interior live oaks form a dense woodland with an understory comprised of annual and perennial grassland species. In other areas, interior live oaks intermix with foothill pine, California buckeye, buck brush, coyote brush, poison oak, coffeeberry and grassland species. Valley oak savanna occurs on deep alluvial soils along streams and riparian corridors in the low-lying portions of the planning area. Several valley oak savanna communities contain large, heritage-size valley oaks. The understory in a valley oak savanna is usually composed of pasture grassland and annual grassland species.

Section 3. Natural Resources August 1998
55
Oak woodland and savanna provide shelter, breeding, and foraging habitat for many of the wildlife species typically found in grassland or chaparral habitats. Oak acorns are an important food source for wild turkeys, acorn woodpeckers, northern flickers, and mule deer. Oaks also provide nest sites for western gray squirrels and cavity-nesting birds, including acorn woodpeckers, northern flickers, and white-breasted nuthatches. Native Perennial Grassland These grasslands are dominated by native grasses such as purple needlegrass, woodland ryegrass, and California melic grass. Perennial grasslands historically extended throughout the state and comprised one of the most extensive plant associations in the state, but native grasslands have largely been replaced by annual grasslands composed of Mediterranean species that had adapted to heavy grazing pressure. For this reason, most native grassland associations are considered sensitive by the California Natural Diversity Data Base. Besides grasses, perennial grasslands typically support a larger number of native forb species and wildflowers than the annual grasslands. Annual wildflowers include harvest brodiaea, soap plant, tarplant, lupine, and mariposa lily. Native perennial grasslands typically occur on north-facing, mesic slopes near oak woodlands and savannas. Riparian and Stream Habitat Riparian communities develop in areas with high water tables that support seasonal and perennial (permanent) surface water. Riparian communities are common along streams, ponds, and swales in the planning area, most notably Secret Ravine and Antelope Creek. There are many variations of riparian habitat types. Three basic types commonly found in the planning area include mixed riparian woodland, riparian forest, and willow scrub. These are described below. Mixed riparian woodland is the dominant riparian community in the planning area, and is characterized by intermixed layers of trees, shrubs and herbaceous species. Typical plants include Fremont’s cottonwood, valley oak, willows, California blackberry, Himalayan blackberry, California rose, blue elderberry, poison oak, sedges, rushes and grasses. Riparian forest is found in the planning area particularly along Secret Ravine. Two basic types of riparian forest are present, cottonwood and oak, both of which are structurally complex and varied plant communities. Cottonwood riparian forest is characterized by a canopy of Fremont’s cottonwood, valley oak, and alders, overtopping a tangle of Himalayan blackberry, poison oak, wild honeysuckle, and arroyo willow. The canopy of oak riparian forest is dominated by mature valley oaks, with scattered black willow. The understory is comprised of poison oak, pipevine, creeping wild rye, and Himalayan blackberry. Willow scrub is an early-colonizing riparian community dominated by sandbar willow, mugwort, rush and sedge. It also forms along small creeks and drainages that lack the water supply necessary to develop woodland and forest communities. Riparian and stream communities provide the highest quality habitat for wildlife in the planning area. The multi-layered riparian community provides escape cover, forage and nesting opportunities for a variety of species. Typical wildlife that are found in riparian and stream habitats include California quail, Bewick’s wren, song sparrow, red-shouldered hawk, Cooper’s hawk, raccoon, coyote, cottontail, opossum, striped skunk, gray fox, and mule deer. Wetlands Wetlands include a variety of habitats that are characterized by a prevalence of hydrophytic (water-loving) vegetation, hydric soils, and wetland hydrology. Natural and artificially-created wetlands exist throughout the low-lying portions of the planning area, typically along drainages or in topographic depressions. Wetland types in the planning area include perennial streams, ponds, and seasonal drainage, including vernal pools. Seasonal freshwater wetlands occur within perennial grasslands as swales and shallow depressions underlain by slowly permeable soils. These wetlands are typically wet from November to June. Vegetation is a mix of wetland

Section 3. Natural Resources August 1998
56
and upland species including perennial ryegrass, popcornflower, creek monkeyflower, spikerush, soft chess, tarweed, long-beak filaree, and medusa-head grass. Vernal pools occur on the impermeable Mehrten breccia that exists on ridge tops within the planning area. Vernal pools, intermittent drainages, and other seasonal wetlands represent unique natural resource habitats within the study area and the state. Vernal pools are considered sensitive habitat areas not only due to their limited occurrence and distribution, but also because they support several unique, and often rare, plant and animal species that are endemic to this kind of habitat. Intermittent drainages and seasonally wet swales within the planning area, while typically low in plant and wildlife species diversity, provide important watershed sources to vernal pools and are also limited in occurrence and distribution. A comprehensive wetland survey for the planning area has not been conducted. Delineation of wetlands within the planning area has been conducted sporadically, and generally in conjunction with development proposals. Many wildlife species depend on wetland habitats for foraging, nesting, water, and cover. Ponds in the planning area provide important resting and foraging habitat for migrating birds, such as Canada goose, mallard, and cinnamon teal. Wetlands also provide habitat for ring-necked duck, American coot, great blue heron, great egret, and black phoebe. Please refer to Regulatory Framework section for more information regarding wetlands. Common Natural Communities Common natural communities are native or apparently native landscapes that have not been substantially altered by farming or other land disturbance. Annual grassland and chaparral are considered common communities because of their abundance in the planning area and throughout California. Grasslands Grassland is an herbaceous community characterized by annual and perennial grasses and forbs. Grasslands occur in pastures, along fence rows, and more extensively in undisturbed rural areas. Three types of grassland associations occur in the planning area: annual grassland, native perennial grassland, and pasture grassland. Native perennial grasslands were previously discussed above. Annual grasslands are dominated by annual grasses intermixed with annual forbs and perennial forbs, including wild oat, ripgut brome, soft chess, fescue, clover, summer mustard, wild radish, yellow-star-thistle, and elegant clarkia. While the dominant plants that make up this association are exotic species that originated primarily from the Mediterranean area, these plants have been present in California sufficiently long that this can be considered a “naturalized” community. Pasture grasslands are typically dominated by perennial sod-forming grasses, such as harding grass, orchard grass, Kentucky fescue, and common velvet grass. Pasture grasslands are maintained through artificial irrigation systems. Grasslands provide nesting and foraging habitat for several wildlife species, including red-tailed hawk, American pipit, western meadowlark, lesser goldfinch, American kestrel, California ground squirrel, and California vole. Chaparral Chaparral communities are characterized by evergreen, hard-leaved shrubs adapted to dry, infertile soils. The herbaceous layer is usually sparse because chaparral shrubs produce growth-inhibiting oils that prevent the establishment of herbaceous species. Buck brush and chamise chaparral are the two chaparral types found within the planning area. Buck brush chaparral is dominated by buck brush with scattered chamise, toyon, coffee berry, poison oak, and interior live oak. Chamise chaparral occurs on recently burned hillsides and is

Section 3. Natural Resources August 1998
57
usually dominated by chamise. Chaparral provides high-quality cover and roosting habitat for western rattlesnake, California thrasher, wrentit, California quail, gray fox and mule deer. Artificial Plant Communities Artificial plant communities are human-created landscapes that provide some wildlife habitat value. Urban landscape and agricultural areas are the primary artificial communities located in the planning area. Urban Landscape Urban landscape exists around commercial, residential and park sites within the planning area. Urban landscape is composed of primarily non-native plants, shrubs and trees. These areas provide habitat for a variety of native and non-native wildlife, including northern mockingbird, European starling, house sparrow, house finch, acorn woodpecker, mourning dove, Brewer’s blackbird, gopher snake, and western toad. Agricultural Land Orchards and irrigated crops are the primary types of agricultural within the planning area. Agriculture is dispersed throughout the planning area, forming a mosaic between grasslands, oak woodland, and riparian habitats. Areas along fence rows and drainage ditches that support some remnant native vegetation or weedy species provide limited habitat for common wildlife species, which include: western meadowlark, red-tailed hawk, American kestrel, and red-winged blackbird. Migrant birds also use agricultural areas for winter foraging and roosting. Typical migrant species that occur on agricultural land in the planning area include rough-legged hawk, American pipit, Canada goose, and house finch.
Special-Status Plant and Wildlife Species Special-status species are plants and animals legally protected, either under federal, state, or local law, or through documentation put forth by the scientific community. Table 3-3 illustrates the most commonly-recognized definitions of what qualifies as “special status.” Special-status species include those that are listed as rare, threatened, or endangered by the CDFG or the U.S. Fish and Wildlife Service; candidates for either state or federal listing; species designated as “fully protected” or “species of special concern” by the CDFG. The CDFG utilizes the California Natural Diversity Data Base (NDDB) to document occurrences of special status species. The NDDB includes information on plant species prepared by the California Native Plant Society (CNPS). An inquiry of the California Department of Fish and Game’s Natural Diversity Data Base for the Rocklin Quadrangle was conducted to determine the location of any known sensitive plants, animals, and communities in the vicinity of Loomis (CDFG, June 18, 1998). A list of sensitive plants and animal species that could potentially occur in the planning area was also compiled from available literature. Table 3-4 summarizes the results of the literature search.

Section 3. Natural Resources August 1998
58
Table 3-3: Definition of Special-Status Species
Plant Species Animal Species Plants listed or proposed for listing as threatened or endangered under the federal Endangered Species Act (50 CFR 17.12); Plants that are candidates for possible future listing as threatened or endangered under the federal Endangered Species Act (55 CFR 6184, 2-21-90); Plants that meet the definition of rare or endangered under CEQA (CEQA Guidelines, Section 15380); Plants considered by the CNPS to be “rare, threatened or endangered” in California (Lists 1B and 2 in Skinner and Pavlik, 1994, per NDDB, April 1998); Plants considered by the CNPS about which more information is needed and plants of limited distribution (Lists 3 and 4 in Skinner and Pavlik, 1994, per NDDB, April 1998); Plants listed or proposed for listing by the State as threatened or endangered under the California Endangered Species Act (14 CCR 670.5); Plants listed under the California Native Plant Protection Act (CFG Code 1900 et. seq.); Plants considered sensitive by other federal agencies, state and local agencies or jurisdictions; Plants considered sensitive or unique by the scientific community or occurring at the limits of its natural range (CEQA Guidelines, Appendix G).
Animals listed or proposed for listing as threatened or endangered under the federal Endangered Species Act (50 CFR 17.11 and various notices); Animals that are candidates for possible future listing as threatened or endangered under the federal Endangered Species Act (54 CFR 554); Animals that meet the definition of rare or endangered under CEQA (CEQA Guidelines, Section 15380); Animals listed or proposed for listing by the State as threatened or endangered under the California Endangered Species Act (14 CCR 670.5); Animal species of special concern to the CDFG (Natural Diversity Data Base, March 1998) Animal species that are fully-protected in California (CFG Code, Section 3511, 4700 and 5050)

Section 3. Natural Resources August 1998
59
Table 3-4: Special Status Species Potentially-Occurring in the Town of Loomis
Common Name Scientific Name Status HabitatPLANTS Big-scale balsamroot Balsamorhiza macrolepis var macrolepis 1B GRDwarf downingia Downingia pusilla 2 VP,WETLegenere Legenere limosa 1B VPHispid bird’s-beak Cordylanthus mollis ssp hispidus 1B akaline soilsBoggs lake hedge-hyssop Gratiola heterosepala 1B VP,WETINVERTEBRATES Vernal pool fairy shrimp Branchinecta lynchi FT VPConservancy fairy shrimp Branchinecta conservatio FE VPVernal pool tadpole shrimp Lepidurus packardi FE VPCalifornia linderiella Linderiella occidentalis SA VPValley Elderberry longhorn beetle Desmocercus californicus dimorphus FT WDLAMPHIBIANS and REPTILES Western spadefoot Scaphiopus hammondii CSC SAV,GRFoothill yellow-legged frog Rana boylei CSC WETCalifornia red-legged frog Rana aurora draytoni FT, CSC Stream poolsNorthwestern pond turtle Clemmys marmorata marmorata CSC Stream poolsBIRDS Great blue heron (rookery) Ardea herodias SA WDLCooper's hawk (nesting) Accipiter cooperii CSC WDL,GRSharp-shinned hawk (nesting) Accipiter striatus CSC WDLTricolored blackbird (nesting) Agelaius tricolor CSC WETGolden eagle (nest & winter) Aquila chrysaetos CSC GR, CH, WDLLong-eared owl (nesting) Asio otus CSC WDLShort-eared owl (nesting) Asio flammeus CSC GRBurrowing owl Athene cunicularia CSC GRSwainson's hawk (nesting) Buteo swainsoni ST WDL, GRFerruginous hawk (wintering) Buteo regalis CSC GRNorthern harrier (nesting) Circus cyaneus CSC GRWhite-tailed kite (nesting) Elanus caeruleus SA WDL, GRMerlin (wintering) Falco columbarius CSC WDL, GRPrairie falcon (nesting) Falco mexicanus CSC GRLoggerhead shrike Lanius ludovicianus CSC GRYellow-breasted chat (nesting) Icteria virens CSC WDLMAMMALS Pallid bat Antrozous pallida CSC GR, WDLTownsend’s big-eared bat Corynorhinus townsendii townsendii CSC GR, WDLAmerican badger Taxidea taxus SA GR
KEY: STATUS CODES:
FE Federally listed Endangered SE State-listed Endangered FT Federally listed Threatened ST State-listed Threatened PFE Proposed Federal Endangered SR State-listed Rare (plants only) FC Federal Candidate SCE State Endangered Candidate SCT State Threatened Candidate 1B CNPS: Rare, Threatened, Endangered in CA CSC California Species of Special Concern 2 CNPS: Rare, Threatened, Endangered SA Special Animal per CDFG, March 1998 in CA but more common elsewhere HABITAT CODES:
GR Grassland SAV Savanna CH Chaparral WDL Oak/Riparian Woodland WET Wetland VP Vernal Pool Source: CDFG, June 18, 1998; CDFG March 1998, CDFG April 1998.

Section 3. Natural Resources August 1998
60
Special-Status Plants Five special status plants have been reported in the general vicinity, but none are reported to be within the planning area. However, based on known habitat requirements and distributions, the special-status species listed in Table 3-4 have the potential to occur in the planning area. Several of these plants are associated with vernal pools that occur within old volcanic mud flows, which are generally located southwest of the planning area. However, they could also occur within vernal pools in the planning area. Special-Status Wildlife The Department of Fish and Game’s Natural Diversity Data Base (CDFG, June 18, 1998) listed one special-status wildlife species, the valley elderberry longhorn beetle, as known to occur in the planning area. However, based on known habitat requirements and distributions, the 28 special-status species listed in Table 3-4 have the potential to occur in the planning area. Many site-specific wildlife surveys have been conducted in the planning area and Table 3-5 lists the wildlife observed during several surveys. Special-status wildlife species have been marked with an asterisk.
Table 3-5: Wildlife Species Observed in the Planning Area
Common Name Scientific Name Source BIRDS Cooper’s hawk * Accipiter cooperii 4Red-winged blackbird Agelaius phoeniceus 2Mallard Anas platyrhynchos 4Scrub jay Aphelocoma coerulescens 1, 2, 4Red-tailed hawk Buteo jamaicensis 1Red-shouldered hawk Buteo lineatus 1California quail Callipepla californica 1, 4American goldfinch Carduelis tristis 4Purple finch Carpodacus purpureus 4Turkey vulture Cathartes aura 4Wrentit Chamaea fasciata 1Killdeer Charadrius vociferus 1Northern flicker Colaptes auratus 1, 2Western wood-pewee Contopus sordidulus 1American crow Corvus brachyrhynchos 1Raven Corvus corax 2Warbler sp. Dendroica sp. 4Black-shouldered kite * Elanus caeruleus 1, 2, 4Brewer’s blackbird Euphagus cyanacephalus 1Acorn woodpecker Melanerpes formicivorus 2, 4Northern mockingbird Mimus polyglottos 4Ash-throated flycatcher Myiarchus cinerascens 4Plain titmouse Parus inornatus 2, 4Savannah sparrow Passerculus sandwichensis 4Ring-necked pheasant Phasianus colchicus 4Grosbeak Pheucticus sp. 4Nuttall’s woodpecker Picoides nuttallii 1, 4Bushtit Psaltriparus minimus 1Black phoebe Sayornis nigrians 1, 4Western bluebird Sialia mexicana 4White-breasted nuthatch Sitta carolinensis 4Western meadowlark Sturnella neglecta 1European starling Sturnis vulgaris 1Barn owl Tyto alba 1Solitary vireo Vireo solitarius 4

Section 3. Natural Resources August 1998
61
Mourning dove Zenaida macroura 1, 2, 4Golden-crowned sparrow Zonotrichia atricapilla 2White-crowned sparrow Zonotrichia leucophrys 2MAMMALS Coyote Canis latrans 1Black-tailed jackrabbit Lepus californicus 1Black-tailed deer Odocoileus hemionous 1Raccoon Procyon lotor 2Botta’s pocket gopher Thomomys bottae 1, 2Skunk Mephitus mephitus 5REPTILES AND AMPHIBIANSWestern pond turtle * Clemmys marmorata 4Western skink Eumeces skiltonianus 2Western fence lizard Sceloprus occidentalis 2, 4Alligator lizard Gerrhonotus sp. 4Pacific chorus frog Pseudacris (Hyla) regilla 2, 4Bullfrog Rana catesbeiana 4Common garter snake Thamnophis sirtalis 4Side-blotched lizard Uta stansburiana 4FISH Sacramento sucker Catostomus occidentalis 3Brown bullhead Ictalurus nebulosus 3Green sunfish Lepomis cyanellus 3Bluegill Lepomis macrochirus 3Largemouth bass Micropterus salmoides 3Sacramento squawfish Ptychocheilus grandis 3Key:
1 2 3 4 5
Shadowbrook Recirculated Draft EIR, ESA, 1997 K-8 Elementary School Site Draft EIR, Quad, 1994 Jones & Stokes Secret Ravine survey, March 1988 Laird Road survey, Jones & Stokes, 1993. Town staff, 1998.
Following is a description of the sensitive wildlife species that are known to exist, or have the potential to exist, in the planning area.
Invertebrates Vernal pool fairy shrimp (Branchinecta lynchi). Status: Federally threatened. The vernal pool fairy shrimp is a large freshwater shrimp, approximately two centimeters long. It is endemic to California and is known from 32 populations that are located from Stillwater Plain in Shasta County through most of the length of the Central Valley to Pixley in Tulare County, and along the central coast range from northern Solano County to Pinnacles in San Benito County. The fairy shrimp is restricted to seasonal wetlands (primarily vernal pools) with clear to tea-colored water. They hatch, breed, and produce eggs during the period of pool inundation. Highly resistant eggs remain dormant until the following winter rains. Conservancy fairy shrimp (Branchinecta conservatio). Status: Federally endangered. The conservancy fairy shrimp is known from six disjunct populations in Tehema, Glenn, Solano, Merced and Ventura Counties. This fairy shrimp inhabits vernal pools and swales with highly turbid water and has a similar life cycle to that of the vernal pool fairy shrimp. Vernal pool tadpole shrimp (Lepidurus packardi). Status: Federally endangered. The tadpole fairy shrimp is known from 18 populations in the Central Valley, ranging from east of Redding in Shasta County south through the Central Valley, to the San Luis National Wildlife Refuge in Merced County, and from a single vernal pool complex located on the San Francisco Bay National Wildlife Refuge in the City of

Section 3. Natural Resources August 1998
62
Fremont, Alameda County. Preferred habitat consists of vernal pools with clear to turbid water; pools size ranges from a few square yards to several acres. California linderiella (Linderiella occidentalis). Status: California Species of Special Concern. The California linderiella is more abundant in the Central Valley than previously known and the proposal to list the linderiella as endangered was withdrawn by the USFWS. The linderiella inhabits vernal pools and swales with clear to tea-colored water. This species is often associated with other fairy shrimp species. Valley elderberry longhorn beetle (Desmocerus californicus dimorphus). Status: Federally threatened. The valley elderberry longhorn beetle occurs at scattered locations in San Joaquin and Sacramento Valleys from Tehema to Kern County and is known to occur in Secret Ravine within the planning area (Town of Loomis, 1996, Turtle Island Draft EIR). This subspecies is a live wood pith-boring beetle that is dependent on the elderberry (Sambucus ssp.) as its host plant. Females deposit eggs within crevices on the elderberry bark. Shortly thereafter, the eggs hatch and the larvae bore into the pith where they remain for up to two years. Suitable elderberry branches for larvae are greater than one inch in diameter. The presence of emergence holes in elderberry stems is the accepted measure of valley elderberry longhorn beetle presence and habit use. Amphibians Western spadefoot toad (Scaphiopus hammondii). Status: California Species of Special Concern. The western spadefoot toad occurs in the Central Valley and surrounding foothills and Coast Ranges south of San Francisco Bay. It prefers open vegetation and inhabits grasslands, open chaparral, and pine-oak woodlands with sandy or gravelly soil. Breeding and egg laying occur in winter and spring almost exclusively in shallow, temporary pools formed by heavy winter rains (e.g. vernal pools). Spadefoots are primarily active at night during spring rains. Dry periods are spent in burrows in upland habitats. California red-legged frog (Rana aurora draytoni). Status: Federal threatened and California Species of Special Concern. The California red-legged frog formerly ranged from northern California south along the Pacific Coast, west of the Cascade Mountains and the Sierra Nevada, to northern Baja California at elevations from near sea level to 8,000 feet. Red-legged frogs frequent marshes, lakes, reservoirs, ponds, slow parts of streams, and other usually permanent water in lowlands, foothill woodlands and grasslands. Red-legged frogs require areas with extensive emergent vegetation. High value habitats are deep-water ponds with dense stands of overhanging willows and a fringe of cattails. There is a moderate potential for this species to still survive in the planning area along areas such as Secret Ravine. Reptiles Northwestern pond turtle (Clemmys marmorata marmorata). Status: California Species of Special Concern. The western pond turtle occurs primarily in foothills west of the Cascade-Sierra crest throughout California. The northwestern subspecies ranges north of the San Francisco Bay area and intergrades with the southwestern pond turtle in the southern portion of the Central Valley. Pond turtles inhabit rivers, permanent streams, irrigation ditches, ponds, lakes and marshes. Preferred aquatic habitat typically has a rocky or muddy bottom and contains emergent vegetation, such as cattails and other aquatic plants. Birds Great blue heron (Ardea herodius). Status: CDFG is concerned that nest sites of this species are closely associated with a habitat that is declining in California. Heron rookeries are protected. The great blue heron is a fairly common resident throughout most of California. It inhabits shallow estuaries and water bodies, freshwater marshes, brackish and other wetlands. It usually nests in colonies in tops of large snags or live trees in groves near shallow water feeding areas, but a feeding area may be as much as ten miles from a particular nest sites. White-tailed kite (Elanus caeruleus). Status: California fully protected. The white-tailed kite occurs in coastal and valley lowlands, usually associated with agricultural lands and open fields throughout California. Nests are constructed in treetops with dense foliage.

Section 3. Natural Resources August 1998
63
Northern harrier (Circus cyaneus). Status: California Species of Special Concern. The northern harrier is a migratory hawk that occurs throughout most of California, except at higher elevations. Harrier populations are most concentrated in the Central Valley. During the winter months, migrant harrier numbers increase throughout the state. The northern harrier nests on the ground near freshwater and salt marshes. Open areas, such as desert sinks and mountain meadows, provide foraging habitat for the species. Loss of wetland breeding habitat is the main threat to harrier populations in California. Sharp-shinned hawk (Accipiter striatus). Status: California Species of Special Concern. The sharp-shinned hawk ranges throughout California and forages in most habitats. Preferred breeding habitats include mid-elevation riparian deciduous forest, conifer forest, and oak woodlands. However, breeding distribution is poorly documented. The study area provides winter foraging and roosting habitat for the sharp-shinned hawk in the oak riparian forest/blue oak woodland. Cooper's hawk (Accipiter cooperii). Status: California Species of Special Concern. This species is considered sensitive due to the loss of riparian nesting habitat and possible pesticide poisoning. It is a breeding resident throughout most of the wooded portions of California. Preferred nesting habitat is dense stands of live oak, riparian, or other forest habitat near water. Hunting for small birds and mammals occurs in broken woodlands and edge habitats. Suitable nesting and foraging habitat is present throughout much of the planning area. Swainson's hawk (Buteo swainsoni). Status: California threatened. The Swainson's hawk is a summer migrant to the Central Valley and northeastern portion of the state. The Swainson's hawk in California has become almost entirely dependent on agricultural lands such as alfalfa, grain crops, and fallow fields for foraging habitat. Most of the native grasslands that formerly provided foraging habitat have disappeared. The hawk's food source, usually rodents or insects, may only be accessible when vegetative cover is low, such as when a field is disked, fallow, or newly planted. Mature oaks and cottonwoods in riparian areas or individual trees near agricultural fields and grasslands provide suitable nest sites, as do oak riparian forest and blue oak woodland. Ferruginous hawk (Buteo regalis). Status: California Species of Special Concern. Resource agencies are particularly concerned about wintering habitats for this species. The ferruginous hawk is an uncommon winter resident and migrant on the Modoc Plateau, Central Valley and Coast Ranges but does not breed in California. Foraging habitats include open, dry terrain such as grasslands and scrub habitats. This hawk may occasionally occur in the planning area during winter. Golden eagle (Aquila chrysaetos). Status: California Species of Special Concern and fully protected species. The golden eagle is an uncommon, permanent resident and migrant throughout California, except the center of the Central Valley. Habitat typically includes rolling hills, mountain areas, sage-juniper flats, and deserts. Nests are constructed on cliffs and in large trees in open areas. The territories of these raptors in California range from 36 to 48 square miles. Merlin (Falco columbarius). Status: California Species of Special Concern. The merlin is a winter migrant throughout the western portion of the state in grassland to woodland habitats, but does not breed in California. This falcon may occasionally occur in the region during winter. Prairie falcon (Falco mexicanus). Status: California Species of Special Concern. The prairie falcon occurs throughout California, except along the coast and east of the Sierra Nevada. It is primarily associated with grasslands, agricultural lands, and desert scrub areas. Nests are usually constructed on cliffs. The Central Valley is primarily used for winter foraging. Although this falcon probably does not nest in the planning area, it may occur in the area during winter. Burrowing owl (Athene cunicularia). Status: California Species of Special Concern (burrow sites). The burrowing owl is a resident of California, where it inhabits open grasslands, deserts, rolling hills, open pine

Section 3. Natural Resources August 1998
64
habitats and agricultural land throughout the state. Old ground squirrel burrows and other mammal dens provide breeding sites for the burrowing owl. Grasslands within the planning area could provide potential habitat for the burrowing owl. Long-eared owl (Asio otus). Status: California Species of Special Concern. The long-eared owl occurs in most of California, except in high Sierra Nevada, Coast Ranges, and Cascade Ranges. Riparian vegetation is required nesting habitat, but the species also uses oak tree thickets. The Central Valley, including in the general vicinity of Loomis, is primarily used for winter foraging. Short-eared owl (Asio flammeus). Status: California Species of Special Concern. The short-eared owl occurs in California primarily as a winter migrant to the Central Valley but occasionally breeds in northern California. This owl is usually found in open habitats such as grasslands and wetlands. Loggerhead shrike (Lanius ludovicianus). Status: California Species of Special Concern. The loggerhead shrike occurs in lowlands and foothills throughout most of California. Preferred habitats include open-canopied oak and pine woodlands, and foothill and desert riparian habitats with perches such as fences, posts, and scattered trees and shrubs. Suitable nesting and foraging habitat is present in the planning area. Tricolored blackbird (Agelaius tricolor). Status: California Species of Special Concern. The tricolored blackbird is a nomadic resident of the Sacramento and San Joaquin Valleys and lower foothills of the Sierra Nevada. This species nests near freshwater in dense cattails and bulrush, and also in thickets of willow, blackberry, wild rose, and tall herbs. Estimates for colony size range from 15 to 47,000 birds. Flooded lands, pond margins, and grass fields constitute typical foraging habitat. Agricultural fields also provide foraging habitat. Yellow-breasted chat (Icteria virens). Status: California Species of Special Concern. The yellow-breasted chat is an uncommon summer resident and migrant in coastal California and in the foothills of the Sierra Nevada. It prefers riparian woodland that contains willow thickets and other brushy tangles that are near water. Suitable habitat for this species occurs in drainages in the planning area, particularly along Secret Ravine. Mammals Pallid bat (Antozous pallida). Status: California Species of Special Concern. Pallid bats are locally common species of low elevations in California, occurring throughout the state except for the high Sierra Nevada and the northwestern corner of the state. It occupies a wide variety of habitats, including grasslands, shrublands, woodlands, and forests. The species is most common in open, dry habitats with rocky areas that are suitable for roosting. It is very sensitive to disturbance of its roosting sites, which are typically in caves, crevices, and mines. Townsend’s big-eared bat (Plecotus townsendii). Status: California Species of Special Concern. This bat is found throughout California except for subalpine and alpine habitats, and was formerly considered common but is now uncommon within the state. It is most abundant in moister climes. It is extremely sensitive to disturbance of roosting sites and requires caves, mines, tunnels, buildings, or other structures for roosting. American badger (Taxidea taxus). Status: Listed in the NDDB as a Special Animal. Badgers are uncommon residents throughout the state in most shrub, forest, and herbaceous habitats, occurring most frequently in open grasslands where there is an abundance of ground squirrels and gophers. While badgers are a fur-bearing mammal and are still trapped, the loss of suitable habitat, indiscriminate trapping, and use of persistent pesticides has resulted in substantial declines in its population level.

Section 3. Natural Resources August 1998
65
Aquatic Habitat Streams in the planning area provide important habitat for several species. Portions of Secret Ravine and Antelope Creek provide the highest quality habitat because these waterways have moderate perennial flows, clear water, rocky stream beds, and overhanging riparian vegetation. Climate and hydrology interact to create conditions conducive to supporting two distinct fish communities: a cold water community of anadromous fall-run chinook salmon and steelhead during the winter and spring, and warm water resident fishes. The local climatic pattern is Mediterranean in which almost all precipitation occurs during the fall through spring and virtually none during the summer. Since the first annual rain normally occurs in the fall and winter, the high stream flows are cold. This is when cold water species such as fall-run chinook salmon and steelhead occur in streams. These fish may be either returning adults or migrating juveniles that move into the system to rear (non-natal stream rearing). Non-natal stream rearing may account for many fish that rear in the local drainages (Maslin and McKenney 1994, Maslin et al. 1997). The cold water condition in the local streams is not prolonged during the spring because headwaters of the local streams are too low in elevation to collect snowpack. As streamflow declines from spring and throughout the summer, the streams warm. At some temperature the streams become unsuitable for cold water species and they leave for more suitable stream temperatures, and only those with wide temperature tolerances or warm water species remain. Environmental assessments must recognize the nature of this dual fish community. Therefore, it is imperative to survey streams for potential habitat-altering impacts during periods when species of interest are expected to occur. Secret Ravine is a perennial stream used by fall-run chinook salmon (Oncorhynchus tshawytcha) and steelhead trout (Oncorhynchus mykiss) for spawning and rearing of juveniles (Town of Loomis, Turtle Island Draft EIR, 1996). Fall-run chinook salmon is a federal candidate threatened species, and steelhead is a federal threatened species. California Department of Fish and Game has documented chinook salmon spawning in Secret Ravine from its confluence with Dry Creek upstream to Penryn (Gerstung 1965). Of the streams that are tributary to Natomas East Drain and the Natomas Cross Canal, Secret Ravine has supported the most number of spawning salmon. Approximately 60 percent of the 1000 fish run in this drainage in 1964 spawned in Secret Ravine (Gerstung 1965). Fall-run chinook salmon typically spawn from November to January, and most juvenile salmon migrate downstream the following spring to the Sacramento River and through the Sacramento-San Joaquin Delta to the Pacific Ocean. Steelhead trout typically spawn January through March. In contrast to chinook salmon, however, juvenile steelhead my reside in freshwater in California as long as two years before migrating to the Pacific Ocean. In addition to these cold water anadromous salmonids, Secret Ravine also supports resident warm water freshwater species that include largemouth bass (Micropterus salmoides), green sunfish (Lepomis cyannellus), bluegill (Lepomis macrochirus), golden shiner (Notemigonus crysoleucas), hitch (Lavinia exilicauda), Sacramento sucker (Catostomus occidentalis), Scaramento pike-minnow (Ptychocheilus grandis) and may also include California roach (Hesperoleucus symmetricus) and Sacramento splittail (Pogonichthys macrolepidotus). Antelope Creek is a perennial stream that has supported at least fall-run chinook salmon in the past (Gerstung 1965). It may provide non-natal rearing habitat for both fall-run chinook salmon and steelhead trout. Non-natal rearing occurs when juvenile salmonids born elsewhere migrate into the system to rear. California roach and Sacramento splittail may also occur here. Antelope Creek does provide habitat for several game species such as largemouth bass, bluegill, green sunfish, brown bullhead (Ictalurus nebulosus), Sacramento sucker, golden shiner and mosquitofish (Gambusia affinis). In addition, both Secret Ravine and Antelope Creek provide habitat for bullfrog (Rana catesbeiana), Pacific tree-frog (Hyla regilla), northwestern

Section 3. Natural Resources August 1998
66
pond turtle (Clemmys marmorata), as well as potential habitat for federal threatened foothill yellow-legged frog (Rana boylii) and the federal endangered California red-legged frog (Rana aurora draytonii). There are several unnamed tributaries within the Town. The intermittent nature of these streams does not preclude fish species if the water occurs at the appropriate time and remains for a sufficient duration (Erman and Hawthorne 1976).
Regulatory Framework Special-Status Species The federal Endangered Species Act of 1973 (50 CFR 17) provides legal protection and requires definition of critical habitat and development of recovery plans for plant and animal species in danger of extinction. California has a parallel mandate embodied in the California Endangered Species Act of 1984 and the California Native Plant Protection Act of 1977. These laws regulate the listing of plant and animal species as endangered, threatened, or in the case of plants, rare. The federal Endangered Species Act requires federal agencies to make a finding on all federal actions, including the approval by an agency of a public or private action, as to the potential to jeopardize the continued existence of any listed species potentially impacted by the action. Section 9 of the federal Endangered Species Act prohibits the “take” of any member of an endangered species. “Take” is defined by the act as, “...to harass, harm, pursue, hunt, shoot, wound, kill, trap, capture, or collect, or to attempt to engage in any such conduct.” USFWS has further defined the terms “harass” and “harm.” Harass is defined as
“...an intentional or negligent act or omission that creates the likelihood of injury to a listed species by annoying it to such an extent as to significantly disrupt normal behavior patterns which include, but are not limited to, breeding, feeding, or sheltering.” Harm is further defined to include “...significant habitat modification or degradation that results in death or injury to listed species by significantly impairing behavioral patterns such as breeding, feeding, or sheltering.”
Section 10(a) of the federal Endangered Species Act permits the incidental “take” of an endangered species if the take is “incidental to, and not the purpose of, the carrying out of an otherwise lawful activity.” Species listed by the State are not necessarily protected by the federal protection statutes. Under the State laws, the CDFG is empowered to review projects for their potential impacts to listed species and their habitats. In addition to formal endangered and threatened listings, the State of California also lists Species of Special Concern based on limited distribution, declining populations, diminishing habitat, or unusual scientific, recreational, or educational value. These species are not afforded the same legal protection as listed species, but may be added to official lists in the future. Federal Candidate species include taxa for which the USFWS currently has compiled substantial information on biological vulnerability and potential threats in order to support the appropriateness of proposing to list the taxa as endangered or threatened species. The State of California also maintains lists for Candidate-Endangered Species (SCE) and Candidate-Threatened Species (SCT). Wetland Regulation Wetlands are defined by the federal government as “...those areas that are inundated or saturated by surface or groundwater at a frequency and duration sufficient to support, and that under normal circumstances do support, a prevalence of vegetation typically adapted for life in saturated soil conditions. Wetlands generally include swamps, marshes, bogs, and similar areas.” This definition was developed for the purpose of identifying wetlands subject to regulation under Section 404 of the Clean Water Act, which is the principal law regulating the discharge of dredged and/or fill material into waters of the US. This definition differs from the functional definition of wetlands used by the U.S. Fish and Wildlife Service, which
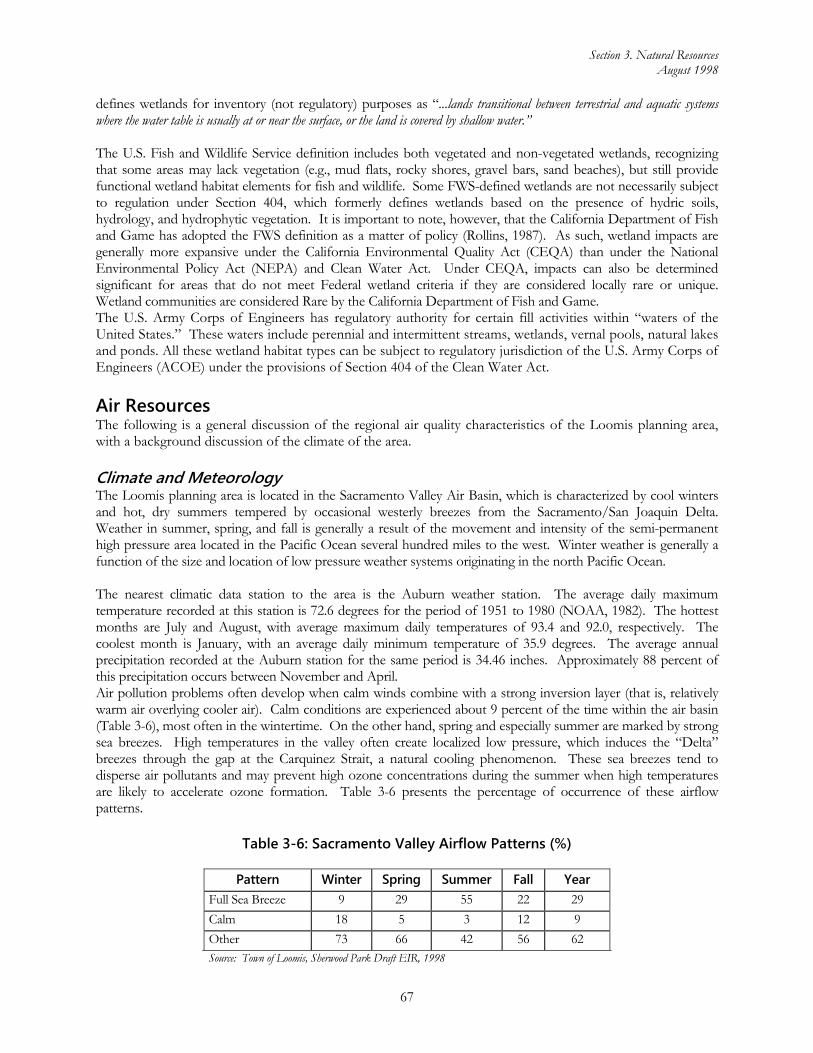
Section 3. Natural Resources August 1998
67
defines wetlands for inventory (not regulatory) purposes as “...lands transitional between terrestrial and aquatic systems where the water table is usually at or near the surface, or the land is covered by shallow water.” The U.S. Fish and Wildlife Service definition includes both vegetated and non-vegetated wetlands, recognizing that some areas may lack vegetation (e.g., mud flats, rocky shores, gravel bars, sand beaches), but still provide functional wetland habitat elements for fish and wildlife. Some FWS-defined wetlands are not necessarily subject to regulation under Section 404, which formerly defines wetlands based on the presence of hydric soils, hydrology, and hydrophytic vegetation. It is important to note, however, that the California Department of Fish and Game has adopted the FWS definition as a matter of policy (Rollins, 1987). As such, wetland impacts are generally more expansive under the California Environmental Quality Act (CEQA) than under the National Environmental Policy Act (NEPA) and Clean Water Act. Under CEQA, impacts can also be determined significant for areas that do not meet Federal wetland criteria if they are considered locally rare or unique. Wetland communities are considered Rare by the California Department of Fish and Game. The U.S. Army Corps of Engineers has regulatory authority for certain fill activities within “waters of the United States.” These waters include perennial and intermittent streams, wetlands, vernal pools, natural lakes and ponds. All these wetland habitat types can be subject to regulatory jurisdiction of the U.S. Army Corps of Engineers (ACOE) under the provisions of Section 404 of the Clean Water Act.
Air Resources The following is a general discussion of the regional air quality characteristics of the Loomis planning area, with a background discussion of the climate of the area.
Climate and Meteorology The Loomis planning area is located in the Sacramento Valley Air Basin, which is characterized by cool winters and hot, dry summers tempered by occasional westerly breezes from the Sacramento/San Joaquin Delta. Weather in summer, spring, and fall is generally a result of the movement and intensity of the semi-permanent high pressure area located in the Pacific Ocean several hundred miles to the west. Winter weather is generally a function of the size and location of low pressure weather systems originating in the north Pacific Ocean. The nearest climatic data station to the area is the Auburn weather station. The average daily maximum temperature recorded at this station is 72.6 degrees for the period of 1951 to 1980 (NOAA, 1982). The hottest months are July and August, with average maximum daily temperatures of 93.4 and 92.0, respectively. The coolest month is January, with an average daily minimum temperature of 35.9 degrees. The average annual precipitation recorded at the Auburn station for the same period is 34.46 inches. Approximately 88 percent of this precipitation occurs between November and April. Air pollution problems often develop when calm winds combine with a strong inversion layer (that is, relatively warm air overlying cooler air). Calm conditions are experienced about 9 percent of the time within the air basin (Table 3-6), most often in the wintertime. On the other hand, spring and especially summer are marked by strong sea breezes. High temperatures in the valley often create localized low pressure, which induces the “Delta” breezes through the gap at the Carquinez Strait, a natural cooling phenomenon. These sea breezes tend to disperse air pollutants and may prevent high ozone concentrations during the summer when high temperatures are likely to accelerate ozone formation. Table 3-6 presents the percentage of occurrence of these airflow patterns.
Table 3-6: Sacramento Valley Airflow Patterns (%)
Pattern Winter Spring Summer Fall Year Full Sea Breeze 9 29 55 22 29
Calm 18 5 3 12 9
Other 73 66 42 56 62 Source: Town of Loomis, Sherwood Park Draft EIR, 1998

Section 3. Natural Resources August 1998
68
The topography of the planning area is such that frequent temperature inversions are not expected. However, meteorological conditions may occur such that the entire Sacramento Valley experiences a temperature inversion, facilitating the accumulation of ozone precursors and ozone formation.
Pollutants of Concern There are many pollutants present in the atmosphere. However, most are not a significant public health concern in the planning area. Pollutants of concern in the planning area are summarized below. Particulate Matter (PM10) Particulate matter refers to solid matter and fine droplets (aerosols) suspended in the atmosphere. Ambient air quality standards for particulate matter have historically been based on particulates equal to or less than 10 microns in diameter, called PM10. The USEPA also recently adopted a standard for 2.5 micron particulates (PM2.5) in addition to the standard for PM10. Particulates, as opposed to dust, cannot be adequately filtered by the human respiratory system and is considered inhalable. Inhaled atmospheric particulates can be harmful to humans by directly causing injuries to the respiratory tract and lungs or by the reactive gases which were absorbed by the inhaled particulate. Suspended particulates scatter and absorb sunlight, producing haze and reducing visibility. Nitrogen Oxide (NOX) Oxides of nitrogen (NO and NO2) and reactive organic compounds (ROC) participate in photochemical reactions that produce smog. These chemicals are considered to be precursors of ozone, as their reaction leads to its formation. High temperatures associated with internal combustion engines and industrial operations cause the formation of NOX by combining atmospheric nitrogen and oxygen. Ozone Ozone is the most common component of smog and is the principal pollutant that causes adverse health effects. Ozone is toxic and colorless, and has a pungent odor. In high concentrations, ozone and other photochemical oxidants are directly detrimental to humans by causing respiratory irritation and possible alterations in the functioning of the lungs. Oxidants also inhibit vegetation growth. Carbon Monoxide Carbon monoxide is a primary pollutant emitted directly from combustion sources, principally automobile engines, and may cause localized problems associated with congested vehicle traffic.
Ambient Regional Air Quality Both the U.S. Environmental Protection Agency (EPA) and the California Environmental Protection Agency, Air Resources Board (ARB) have established air quality standards, based on consideration of the health and welfare of the general public. The National Ambient Air Quality standards (NAAQS) and the California Ambient Air Quality Standards (CAAQS) are summarized in Table 3-7. State standards are more stringent than the Federal standards; therefore, when Federal air pollutant standards are exceeded, the State standards are also exceeded.
Table 3-7: Ambient Air Quality Standards
Pollutant Averaging Time State Standard Federal Standard Ozone 1-Hour 0.09 ppm 0.12 ppmCarbon Monoxide (CO) 1-Hour
8-Hour 20 ppm9.0 ppm
35 ppm9.0 ppm
Nitrogen Dioxide (NO2) 1-HourAnnual
0.25 ppm---
---0.053 ppm
Inhalable Particulate Matter (PM10) 24-HourAnnual Geometric Mean Annual Arithmetic Mean
50 ug/m330 ug/m3
---
150 ug/m3---
50 ug/m3

Section 3. Natural Resources August 1998
69
Sulfur Dioxide (SO2) 24-Hour 0.04 ppm 0.14 ppm
Air Quality Attainment Status The Federal and California Clean Air Acts require identification and classification of each state air basin as attainment, nonattainment, or unclassified based on the NAAQS and CAAQS. An attainment designation for a particular pollutant indicates that available ambient monitoring data have shown that the NAAQS or CAAQS for that pollutant have not been violated (or exceeded). A nonattainment designation for a given pollutant indicates that the standards have been exceeded for that pollutant. An unclassified designation indicates that insufficient ambient monitoring data are available to determine whether or not there have been violations of the NAAQS or CAAQS for the pollutant in question. For regulatory purposes, an unclassified area is generally treated the same as an attainment area. The planning area is located in the Sacramento Valley Air Basin. Table 3-8 provides the attainment status for each pollutant in the Sacramento Valley Air Basin. The planning area is in non-attainment for ozone based on both state and federal standards. For PM10, it is in nonattainment for the state standard only. The planning area is in attainment for all other pollutants.
Table 3-8: Attainment Status of the Sacramento Valley Air Basin
Pollutant Federal Status State Status Ozone Nonattainment Nonattainment
CO Nonattainment (Sacramento Urbanized Area only) Unclassified PM10 Attainment Nonattainment NO2 Attainment Attainment SO2 Attainment Attainment
Odors No single source of odors can be identified in the planning area. However, the Loomis area supports substantial agricultural uses, often in close proximity to residences and other odor-sensitive land uses. Typical odors from such uses include manure from livestock and fertilizer for crop production, which are often perceived as objectionable. Consequently, while odors are not an acute problem within the planning area, they may be considered substantial for some area residents.
Regulatory Framework Air pollution control is administered on three government levels in the State of California: Federal (EPA), State (ARB) and local (Placer County Air Pollution Control District [APCD]). The Placer County APCD administers air pollution control programs in Placer in consultation with the EPA and ARB. Federal Amendments to the Federal Clean Air Act required each Air Pollution Control District to submit an Air Quality Management Plan (AQMP) for approval by ARB and the EPA. The goal of the AQMP was to reduce pollutant concentrations below the Federal standards. The Sacramento Area Council of Governments prepared an AQMP in 1982. That AQMP was based upon transportation control measures and land use measures that were not adopted by local planning authorities. On December 1, 1988, the EPA formally disapproved the 1982 AQMP based upon the inability to meet Federal ozone standards. As a result of formal disapproval of local efforts to attain Federal air quality standards, the EPA prepared a Federal Implementation Plan (FIP) for the southern Sacramento Valley Air Basin. The FIP was finalized on February 14, 1995. The purpose of the FIP was to provide control measures to reduce emissions with the goal that the Sacramento Valley Air Basin will attain the Federal ozone standard by 2005. However, on April 11, 1995, President Clinton signed into law HR 889, a Department of Defense appropriations bill that contained provisions rescinding the FIP. As a consequence, the

Section 3. Natural Resources August 1998
70
area is subject to the provisions of the Placer County 1992 Air Quality Attainment Plan (AQAP) prepared to comply with the requirements of the California Clean Air Act. State Assembly Bill 2595 (known as the California Clean Air Act) took effect on January 1, 1989. The goal of this bill is to attain the CAAQS by the earliest practicable date. The 1992 Air Quality Attainment Plan (AQAP) was prepared by the Placer County APCD to meet the requirements of the California Clean Air Act. The AQAP included stationary source, mobile source and indirect source control measures to reduce emissions to the extent feasible. The control measures identified in the SIP are expected to reduce emissions to the extent feasible and enable progress towards attainment of the State ozone standard.
Findings 3-1 Small perennial creeks, including Antelope Creek and Secret ravine, are the most important surface
water features in the planning area. There are no lakes in the area, only small reservoirs for local storage or flood control. Local surface water is not used as a municipal drinking supply.
3-2 Groundwater resources can be unreliable because of the geology of the area. The depth to groundwater is highly variable, but typically between 50 and 150 feet below the surface.
3-3 Groundwater quality is variable, but the growing use of septic tanks in the area has contributed to a degradation of water quality.
3-4 Most of the planning area is underlain by granitic rock units, with alluvium deposits near the streams of the area. This geology contributes to the variability and reliability of groundwater supplies.
3-5 The planning area supports a variety of mineral deposits. Gold mining and granite quarrying were historic activities in the area.
3-6 The topography of the planning area is variable, generally sloping upward from southwest to northeast. Elevations range from 300 to 580 feet above sea level.
3-7 Sandy loams are predominant among the soils of the planning area. Most soils have moderate to severe constraints to development, typically because of their unreliable drainage and percolation characteristics.
3-8 Oak woodland, riparian habitat and wetlands are the most sensitive biological communities in the planning area. These communities are widespread and support a variety of plant and animal life.
3-9 Federally and state listed-species known to occur in the planning area include the threatened valley elderberry longhorn. Vernal pool fairy shrimp (threatened), California red-legged frog (threatened), and Swainson’s hawk (threatened) could also potentially occur in the planning area.
3-10 Secret Ravine is a perennial stream used by fall-run Chinook salmon and steelhead trout for spawning and rearing of juveniles.
3-11 The planning area is in the Sacramento Valley Air Basin. Air quality in the area is strongly affected by prevailing winds. Local inversions and seasonal fluctuations in temperature. No season can be characterized as being particularly worse than others for air quality.
3-12 The Sacramento Valley Air Basin is in nonattainment for ozone based on both state and federal standards. For PM10, it is in nonattainment for the state standard only. The planning area is in attainment for all other pollutants.

Section 4. Open Space, Recreation & Cultural Resources August 1998
71
Section 4. Archaeological Resources, Parks & Recreation
Introduction Cultural resources, parks and recreational resources are important to identify and evaluate because they provide a significant measure of the physical quality of life in a community. Not only do they enhance the aesthetic qualities, but how they are managed affects the health of the Town’s environment, and residents' perceptions and enjoyment of the Town. This section identifies information that will be used in the development of policies to manage these resources. In-depth information on related topics such as biological resources including water, air, and soil resources is provided in Chapter 3, Natural Resources. A detailed assessment of safety issues related to geologic hazards and flooding is provided in Chapter 7, Safety and Noise Issues.
Archaeological Resources This section summarizes the archaeological resources in the planning area, based on previous reports published for projects throughout the area. It also discusses the potential for discovering paleontological resources (fossils) in the planning area.
Ethnographic Background Prehistoric Period The Loomis planning area is located within the region that was occupied by the Nisenan or Southern Maidu at the time of Euro-American contact. Nisenan territory included the drainages of the Yuba, Bear, Feather, and American Rivers. Their villages were commonly located on ridges or large flats along major streams. The region provided an abundance of resources, which supported numerous villages in the area. However, the discovery of gold and subsequent influx of Euro-Americans in the mid-19th century caused resulted in the near extinction of the native population, culture and language. Nisenan political organization was based on kinship. A community group controlled subsistence resources, such as hunting and fishing grounds and plant gathering areas. Subsistence activities were seasonal, taking advantage of availability of foods. Salmon were caught in rivers and creeks when they ascended shallow stretches. Eels and other fish were caught using nets or soaproot poison. Acorns were the primary staple of Nisenan life. They were harvested in great numbers when plentiful, and stored in large granaries for yearly consumption. In some years when oaks did not produce, buckeyes were processed by leaching. Pits in the granite bedrock were used to process acorns and other plant foods. Therefore, village locations and food processing locales were often associated with granite outcrops and available water. Numerous surveys around the Loomis, Rocklin, and Roseville areas have demonstrated this pattern in archaeological remains. The Nisenan built two types of permanent structures, the dwelling and the dance house. While valley people tended to build earth covered houses, in the foothills, the cedar bark house and lean to were more common. These could be covered with deer skins as well as bark slabs. The dance house was an important ceremonial center for Nisenan people. It was used for meetings, dances, and ceremonials. It ranged in size from 35 to 90 feet and was excavated several feet into the earth.

Section 4. Open Space, Recreation & Cultural Resources August 1998
72
Major Nisenan settlements were concentrated along the larger streams where village sites often occupied low hills with a southern exposure. Typically, four to twelve family dwellings measuring ten to twelve feet in diameter would constitute a village. Sweathouses were also prominent. They were formed from poles and deer skins and had medicinal and cleansing purposes. A large dance house and numerous acorn granaries might also be present. Historic Period The first historical exploration of the Loomis area was conducted by the Spanish under Gabriel Moraga between 1806 and 1808. The purpose of his expedition was to search for possible mission sites, find any runaway Indians, and to punish those hostile to Spanish rule. Jedediah Smith and his party of fur trappers are credited with next visiting the project vicinity in historic times. In 1827-28, he trapped beaver from camps near Roseville. The 1852 California State Census of Placer County lists 730 Indian residents. Meanwhile, the discovery of gold brought over 10,000 people to Placer County during the 1850s and 1860s. After the gold rush, ranching and farming became the dominant industries of Roseville, Rocklin, and Loomis. Quarries in Rocklin, Loomis, and Penryn areas supplied granite blocks to areas as far away as Honolulu.
Known Archaeological Resources The planning area was included in an overall resources survey conducted by Placer County in the early 1990s. A comprehensive records search conducted at the North Central Information Center of the California Archaeological Inventory at CSU Sacramento in early 1992 showed 634 recorded prehistoric and historic sites countywide. Of this number, 52 were recorded in the general vicinity of the planning area, including the upstream areas toward Penryn and Newcastle (Placer County, Horseshoe Bar/Penryn Community Plan EIR, 1993). The sites included 6 prehistoric villages with surface artifacts and bedrock mortars. Most other sites also included bedrock mortars. Historical sites in the area are generally associated with 19th century mining operations, and include ditches, foundations, and mining equipment. While the number of recorded sites appears impressive, it is estimated that less than 5 percent of the general area has been surveyed. Consequently, the potential for finding other archaeological resources in the area is very high, particularly in the types of areas where such resources have already been found: near streams or springs, in open fields, on ridges, and on or near granite outcrops. According to the Placer County Department of Museums, the probability of prehistoric sites being found on any given parcel is moderate to high (Placer County, Horseshoe Bar/Penryn Community Plan EIR, 1993). Given this, it is interesting that recent cultural resources surveys prepared within Loomis have found relatively few archaeological sites. A survey of an undeveloped 322-acre site north of Wells Avenue found no sites in spite of the presence of many rock outcroppings, a conclusion the report’s author found “surprising” (Town of Loomis, Loomis Hills Draft EIR, 1998). No sites were found for surveys associated with other recent projects, including the Town of Loomis Specific Plan (1988), a proposed elementary school near No Name Lane (1994), and the Loomis Ranch subdivision southeast of the intersection of English Colony Road and Sierra College Boulevard (1997). The 1986 survey for the 105-acre St. Francis Woods project (southeast of the Rocklin Road/Barton Road intersection) found a single prehistoric milling station, but noted several nearby sites just outside the project area. Other recent development proposals, such as the one for the 22-acre Heritage Park Estates project, dismissed potential impacts to cultural resources in the Initial Study for the EIR.
Paleontology The geology of the planning area includes Cenozoic-era sedimentary rock formations, which potentially contain fossils. However, the expected abundance and kinds of fossils varies widely from place to place, according to the underlying geologic rock unit. The foothills of the Sierra Nevada are of particular interest to paleontologists because the area was once at or near the shoreline of an ancient sea that occupied the Central Valley. Sea level fluctuations caused alternating deposition of marine and non-marine sediments, creating conditions favorable for preserving fossils.

Section 4. Open Space, Recreation & Cultural Resources August 1998
73
All but the youngest geologic formations have been tilted upward by the rise of the Sierra Nevada. Gradual long-term erosion has removed parts of these formations, exposing rocks that may contain fossils. In some places, such rocks may be overlaid by a thin layer of recently deposited sediment or soil. The areas with the greatest potential to contain fossils are those underlain by Mehrten conglomerate; low-lying areas south of Horseshoe Bar Road are also considered highly sensitive (Placer County, Horseshoe Bar/Penryn Draft Community Plan EIR, 1993). For a more detailed description of the geology of the area, please refer to Soils and Mineral Resources discussion in Section 3.
Parks & Recreation Community parks are both recreation and open space resources, which can provide opportunities for both active and passive recreation, and can also include natural preserve areas. Loomis recently identified many of the community’s park and recreation needs, and adopted a Parks and Recreation Element and Parks and Recreation Master Plan in 1997. Existing Park and Recreational Facilities The Town of Loomis currently owns and operates one park site. There are also several other facilities and open space resources that serve the community's recreational needs. The Town has contributed funds to the Loomis Union School District to provide recreational improvements. Although school facilities have limitations on use of their facilities (available to the public approximately 40 percent of the time, according to a City of Rocklin study), they represent a significant park and recreation resource for Loomis residents. Placer County also operates the Loomis Basin Regional Park on the northeast border of the Town, which Loomis residents frequently use. In addition, Sierra Community College has recreational facilities available for limited use by non-students. Bikeways, hiking and equestrian trails also provide recreational opportunities for residents. Figure 4-1 identifies the locations of all park and recreation facilities in Loomis. An inventory of park and recreational facilities in the vicinity of Loomis is provided in Table 4-1.
Table 4-1: Park & Recreational Facilities Accessible to the Town of Loomis
Facility Amenities Acreage Location PARKS Sunrise-Loomis Neighborhood Park
2 softball fields; 1 tot lot; picnic area; open space
4.0 North Planning Area on Arcadia Avenue, between Humphrey and Swetzer Roads
Loomis Basin Regional Park (Placer County)
2 softball fields; 1 soccer field; 1 basketball court; 1 tot lot; picnic area; snack bar; portable restrooms
33.0 Intersection of King and Winters Roads
SCHOOLS FACILITIES Loomis Elementary School 2 softball fields; 2 volleyball
courts; 3 basketball courts; track field; tot lot
3.5 Intersection of Taylor and King Roads
H. Clarke Powers School 2 ball fields/soccer fields 6.5 Humphrey Road Franklin Elementary School 3 ball diamonds; 1 soccer field;
2 basketball courts; 1 tract field; 2 volleyball courts; 1 tot lot
4.2 Laird Road
Del Oro High School 1 softball field; 2 soccer fields; 1 football fields; track field; pool; 4 basketball courts; 5 tennis courts; 2 hardball courts
25.0 (approx.)
Taylor Road
Sierra Community College track fields; trails not known Intersection of Rocklin Road and Sierra College Blvd.

Section 4. Open Space, Recreation & Cultural Resources August 1998
74
Total Acreage 76.2Source: Town of Loomis Park and Recreation Master Plan.
Figure 4-1: Park and Recreation Facilities
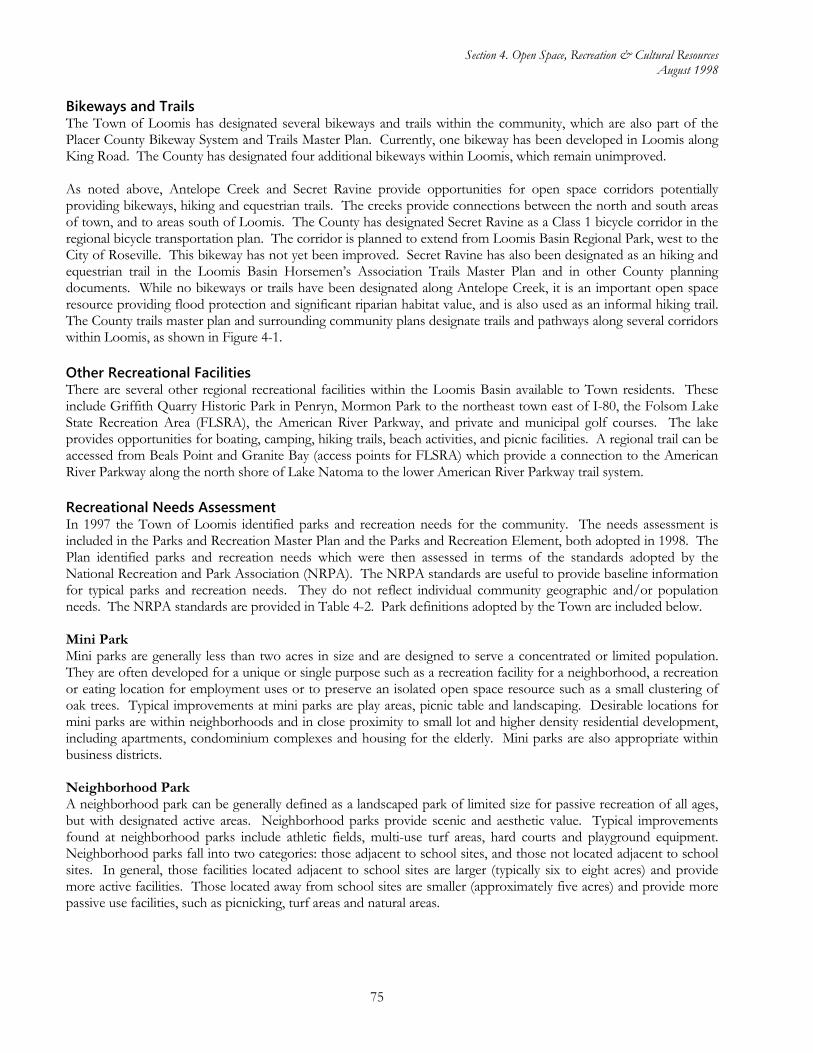
Section 4. Open Space, Recreation & Cultural Resources August 1998
75
Bikeways and Trails The Town of Loomis has designated several bikeways and trails within the community, which are also part of the Placer County Bikeway System and Trails Master Plan. Currently, one bikeway has been developed in Loomis along King Road. The County has designated four additional bikeways within Loomis, which remain unimproved. As noted above, Antelope Creek and Secret Ravine provide opportunities for open space corridors potentially providing bikeways, hiking and equestrian trails. The creeks provide connections between the north and south areas of town, and to areas south of Loomis. The County has designated Secret Ravine as a Class 1 bicycle corridor in the regional bicycle transportation plan. The corridor is planned to extend from Loomis Basin Regional Park, west to the City of Roseville. This bikeway has not yet been improved. Secret Ravine has also been designated as an hiking and equestrian trail in the Loomis Basin Horsemen’s Association Trails Master Plan and in other County planning documents. While no bikeways or trails have been designated along Antelope Creek, it is an important open space resource providing flood protection and significant riparian habitat value, and is also used as an informal hiking trail. The County trails master plan and surrounding community plans designate trails and pathways along several corridors within Loomis, as shown in Figure 4-1. Other Recreational Facilities There are several other regional recreational facilities within the Loomis Basin available to Town residents. These include Griffith Quarry Historic Park in Penryn, Mormon Park to the northeast town east of I-80, the Folsom Lake State Recreation Area (FLSRA), the American River Parkway, and private and municipal golf courses. The lake provides opportunities for boating, camping, hiking trails, beach activities, and picnic facilities. A regional trail can be accessed from Beals Point and Granite Bay (access points for FLSRA) which provide a connection to the American River Parkway along the north shore of Lake Natoma to the lower American River Parkway trail system. Recreational Needs Assessment In 1997 the Town of Loomis identified parks and recreation needs for the community. The needs assessment is included in the Parks and Recreation Master Plan and the Parks and Recreation Element, both adopted in 1998. The Plan identified parks and recreation needs which were then assessed in terms of the standards adopted by the National Recreation and Park Association (NRPA). The NRPA standards are useful to provide baseline information for typical parks and recreation needs. They do not reflect individual community geographic and/or population needs. The NRPA standards are provided in Table 4-2. Park definitions adopted by the Town are included below. Mini Park Mini parks are generally less than two acres in size and are designed to serve a concentrated or limited population. They are often developed for a unique or single purpose such as a recreation facility for a neighborhood, a recreation or eating location for employment uses or to preserve an isolated open space resource such as a small clustering of oak trees. Typical improvements at mini parks are play areas, picnic table and landscaping. Desirable locations for mini parks are within neighborhoods and in close proximity to small lot and higher density residential development, including apartments, condominium complexes and housing for the elderly. Mini parks are also appropriate within business districts. Neighborhood Park A neighborhood park can be generally defined as a landscaped park of limited size for passive recreation of all ages, but with designated active areas. Neighborhood parks provide scenic and aesthetic value. Typical improvements found at neighborhood parks include athletic fields, multi-use turf areas, hard courts and playground equipment. Neighborhood parks fall into two categories: those adjacent to school sites, and those not located adjacent to school sites. In general, those facilities located adjacent to school sites are larger (typically six to eight acres) and provide more active facilities. Those located away from school sites are smaller (approximately five acres) and provide more passive use facilities, such as picnicking, turf areas and natural areas.

Section 4. Open Space, Recreation & Cultural Resources August 1998
76
City-wide (Regional) Park City-wide parks are identified as unique recreational centers serving the entire urban population. These consist of extensive park areas that provide service and facilities that are specialized or of City-wide or regional interest. Typical facilities may include large open space areas, large group picnic facilities, rest rooms, nature centers, libraries, swimming pools, water-oriented facilities for boating, swimming and fishing, competitive sports fields, outdoor arenas, play equipment for varied age groups, tennis courts and concessions. Citywide parks may be located adjacent to high schools. The parks and recreation needs assessment prepared and adopted by the Town indicated that the appropriate standard to apply to Loomis is five acres of park area per 1,000 population. Existing park and recreation facilities are generally located in the north area of town (above I-80). Therefore, the needs assessment identified future recreation needs based on the town population and demographics as a whole, and on the two major north/south planning areas. The results of the needs assessment indicate a current (1998) park land need for the north planning area of 21 acres, and a future (2005) need of 28 acres. The south planning area, which does not currently have any existing park facilities, is projected to need nine acres of parkland by the year 2005. Park needs are further defined as needing approximately 7.9 acres of active park land and 30 acres of passive/open space acreage. The parks and recreation land and facility needs represent minimum, versus maximum needs. The projected total acreage and facility type needs for the north and south planning areas are provided in Table 4-3A and 4-3B.
Findings
4-1. A comprehensive records search conducted at the North Central Information Center of the California Archaeological Inventory at CSU Sacramento in early 1992 showed 634 recorded prehistoric and historic sites countywide. 52 were recorded in the general vicinity of the planning area, including the upstream areas toward Penryn and Newcastle. The sites included six prehistoric villages with surface artifacts and bedrock mortars. Historical sites in the area are generally associated with 19th century mining operations, and include ditches, foundations, and mining equipment. Recent cultural resources surveys prepared within Loomis have found relatively few archaeological sites.
4-2. Loomis currently owns and operates one park site. Using a ratio of five acres of park area per 1,000 population,
the Town’s needs assessment indicates a current (1998) parkland need for the north planning area of 21 acres, and a future (2005) need of 28 acres. The south planning area, which does not currently have any existing park facilities, is projected to need nine acres of parkland by the year 2005. Park needs are further defined as needing approximately 7.9 acres of active park land and 30 acres of passive/open space acreage.
4-3. Loomis has designated several bikeways and trails within the community, which are also part of the Placer
County Bikeway System and Trails Master Plan. A bikeway has been developed in Loomis along King Road, and the County has designated three additional bikeways in Loomis, yet to be improved.

Section 4. Open Space, Recreation & Cultural Resources August 1998
77
Table 4-2: National Recreation & Parks Association Recommended Parkland Design Standards
Component
Use
Service Area
Desirable Size (acre)
Acres per 1,000
Population
Desirable Site
Characteristics A. Local/Close to Home Space Mini park Specialized facilities that serve a
concentrated or limited population or specific group, such as tots or senior citizens
Less than¼-mile radius
1 or less 0.25-0.5 Within neighborhoods and in close proximity to apartment complexes, townhouse developments, or housing for the elderly
Neighborhood park/ playground
Area for intense recreational activities, such as field games, court games, crafts, playground apparatus, skating, picnicking, wading pools
¼ to ½-mile radius to serve a popula-tion up to 5,000 (per neighbor-hood)
15+ 1.0-2.0 Suited for intense development; easily accessible to neighborhood population; geographically centered, with safe walking and bike access; may be developed as a school-park facility
Community park
Area of diverse environmental quality; may include areas suited for intense recreational facilities, such as athletic complexes, large swimming pools; may be an area of natural quality for outdoor recreation, such as walking, viewing, sitting, or picnicking; may be any combination of the above, depending on site suitability and community need
Several neighbor-hoods; 1-to 2 mile radius
25+ 5.0-8.0 May include natural features, such as water bodies, and areas suited for intense development; easily accessible to neighborhood served
Total Close-to-Home = 6.25-10.5 acres per 1,000 populationB. Regional Space Regional/metropolitan park
Area of natural or ornamental quality for outdoor recreation, such as picnicking, boating, fishing, swimming, camping, and trail uses; may include play areas
Several commun-ities; one hour driving time
200+ 5.0-10.1 Contiguous to or encompassing natural resources
Regional park reserve
Area of natural quality for nature quality for nature-oriented outdoor recreation, such as viewing and studying nature, wildlife habitat, conservation, swimming, picnicking, hiking, fishing, boating, camping, and trail uses; may include active play areas; generally, 80 percent of the land is reserved for conservation and natural resource management, with less than 20 percent used for recreation development
Several commun-ities; one hour driving time
1,000+; sufficient area to encompass the resource to be preserved or managed
Variable Rivers or unique natural resources, such as lakes, streams, marshes, flora, fauna, topography
Total regional space = 15-20 acres per 1,000 population Source: National Recreation and Park Association, 1983.

Section 4. Open Space, Recreation & Cultural Resources August 1998
78
Table 4-3A: Neighborhood and Community Park Acres Needed by Planning Area
Year
Total Active Park Acres (5 acres/1,000 population)
Neighborhood Park Acres (3
acres/1,000 population)
Community Park Acres
(2 acres/1,000 population) North South North South
1996 30 12.6 5.4 8.4 3.62000 34.4 14.4 6.2 9.6 4.22005 40.5 17 7.3 11.4 4.82010 48.2 20.2 8.7 13.5 5.8
Source: Town of Loomis Park and Recreation Master Plan.
Table 4-3B: Total Required Park & Recreation Facilities by Planning Area
Facility Type (per population)
Planning Areas
1996 2000 2005 2010 North South North South North South North South Tot Lots 1 per 1,000
4.20 1.80 4.80 2.00 5.60 2.40 6.70 2.90
Playground 1 per 3,000
1.40 0.60 1.60 0.70 1.90 0.80 2.20 0.90
Tennis Court 1 per 6,000
0.70 0.30 0.80 0.30 0.90 0.40 1.50 0.50
Basketball Court 1 per 6,000
0.70 0.30 0.80 0.30 0.90 0.40 1.50 0.50
Hardball Field 1 per 3,000
1.40 0.60 1.60 0.70 1.90 0.80 2.20 0.90
Hiking, Horse Trails 1 mile per 1,000
4.20 1.80 4.80 2.00 5.60 2.40 6.70 2.80
Youth Soccer Field 1 per 2,000
2.10 0.90 2.40 1.00 2.80 1.20 3.40 1.40
Adult Soccer Field 1 per 2,000
2.10 0.90 2.40 1.00 2.80 1.20 3.40 1.40
Golf Course 1 per 50,000
0.08 0.04 0.09 0.04 0.11 0.04 0.13 0.05
Source: Town of Loomis Park and Recreation Master Plan.

Section 5. Public Services & Facilities August 1998
79
Section 5. Public Services & Facilities
Introduction Development within the planning area depends on an elaborate network of public services and utilities. This chapter describes these services, including law enforcement, fire protection, schools, libraries, water and sewer services, drainage, solid waste, gas service, and electrical service.
Public Services
Law Enforcement Law enforcement services are provided in Loomis by the Placer County Sheriff’s Department. The department operates from the South Placer Substation located at Horseshoe Bar Road and Interstate 80 in Loomis. About 27 deputies are based out of the substation and are responsible for patrolling west and south Placer County. The South Placer Substation staff includes 4.25 patrol deputy, 0.5 sergeant, and 0.25 detective positions patrolling for Loomis. Deputies from this substation provide 24-hour protection. The crime rate in Loomis is relatively low, and calls for law enforcement services are usually directed at the protection of property rather than responding to emergency incidents. The Department has found that community involvement programs, such as Neighborhood Watch, are particularly effective in assisting the efforts of Sheriff’s patrols. Response times average about 3.5 minutes for priority one (more critical) calls and 6.7 minutes for priority two calls (Town of Loomis, Heritage Park Estates Draft EIR, 1998). Based on the industry standard of 1 sworn officer per 800 residents, the Town would currently need about 7.5 additional law enforcement positions assigned to it. The current staffing level of fire officers also does not meet this standard.
Fire Protection The Loomis Fire Protection District (LFPD) serves nearly all of the planning area. Only a small portion of the planning area is outside the LFPD’s service area. This portion is located in the Penryn Fire District and South Placer County Fire District. The California Department of Forestry also provides fire protection services, particularly with regard to rural wildland fires. These agencies and their service abilities are described below. The Loomis Fire Protection District (LFPD) serves nearly all of the Town of Loomis as established by the 1999 boundaries. Small portions of the Town limits are served by the Penryn Fire Protection District and South Placer Fire District. Mutual aid and automatic aid agreements are in place with the City of Rocklin, The South Placer Fire District, the Penryn Fire Protection District and the State of California Division of Forestry. LFPD provides fire protection, fire suppression, emergency medical service, open area (wildlands) fire protection, assists in search and rescue operations and assists appropriate agencies with site control during removal of hazardous materials. The LFPD operates out of two stations with a paid staff of 12 and a volunteer base of 35 positions. The headquarters station is at Horseshoe Bar Road and Magnolia, houses the permanent staff, and contains one emergency medical rescue unit and three engines. The second station is not staffed except on call and is located at Horseshoe Bar and Tudsbury Roads, about two miles from the headquarters station, and contains one rescue unit/grass fire truck and two engines. LFPD provides response times of 5 minutes or less on 80% of all calls for service.

Section 5. Public Services & Facilities August 1998
80
The Insurance Service Office (ISO), a national rating service sponsored by fire insurance carriers to measure fire fighting capability to reduce structural fire losses, provides rankings of fire fighting capability on a scale of 1 - 10 with 1 being best. The LFPD fire services are rated 7 in areas that do not have fire hydrants and 6 in areas served by fire hydrants. Service calls in the LFPD area of responsibility occur mainly within the limits of the Town of Loomis. In 1999 LFPD responded to 735 calls of which 487, or 66%, were within the Town limits. Of the 487 calls 395 were for emergency medical service and 40 were for fire and other calls for service. In addition, LFPD participates in various community events, 52 in 1999, such as parades, school programs etc. LFPD operating costs are financed from three property related tax sources: a general property tax of approximately 3 cents per $100 assessed valuation; a 1997 voter approved a benefit assessment tax of $63.46 per year per parcel that can be adjusted annually based on the cost price index; and a special benefit assessment limited to non-residential developments that occur within the District. The separate benefit assessment applies to zones created for each such new development. An impact fee is also charged on new construction to finance capital costs, buildings and equipment, required to serve newly developed property. The Town of Loomis collects the fees within Town limits, and Placer County collects the fees outside of Town limits. The current LFPD development impact fee is $615.00 for non-residential construction less than 2,000 sq ft and 31.8 cents per sq ft over 2,000. The residential development impact fee is $552.00 for single family dwellings under 2,100 sq ft and 27.1 cents per sq ft over 2,100. Development fees are placed into a trust account used by the District exclusively for capital improvements. In addition to the taxes and fees noted, the Town of Loomis contracts with LFPD to provide open area fire protection during the fire season. This had been a responsibility of the State of California Department of Forestry prior to incorporation of the Town. The Town currently pays LFPD $7,000 per year for this protection effort. All money collected helps pay the annual LFPD budget which was budgeted for 1999/00 for expenditures of $404,592 ($342,822 emergency medical and fire services; $29,770 other activities; and $32,000 capital). Penryn and South County Fire Districts The Penryn Fire District operates one fire station located on Church Street, off English Colony Way, in Penryn. The station serves about 3,000 residents, very few of whom live within the Loomis planning area. The district receives about 250 calls per year, about 42 percent of which are related to fire incidents (Placer County, Horseshoe Bar/Penryn Community Plan EIR, 1993). Response times range from three to five minutes. The ISO rating for the district is 6. All six South Placer County Fire District stations are located outside of Town. Station 3 at 7070 Auburn Folsom Road is the base for most responses in Loomis, which comprise a small portion of the district's 1300 calls per year, about 30 percent of which are related to fire incidents. The ISO rating for the district is 4 for buildings within 1000 feet of a hydrant, and 8 for other structures. California Department of Forestry The entire planning area is served by the CDF. This agency is responsible for controlling wildland fires in the unincorporated areas of the state. In Placer County, the CDF operates stations in Auburn, Lincoln, Colfax, Foresthill, Alta, and Higgins. The Auburn or Lincoln stations are most likely to serve the planning area, but all stations could respond in the event of a major wildfire.

Section 5. Public Services & Facilities August 1998
81
Schools Facilities and Enrollment The Loomis planning area encompasses portions of three school districts: Placer Union High School District (PUHSD), Loomis Union School District (LUSD), and Penryn School District (PSD). The entire planning area lies within the PUHSD, which serves grades 9-12. In addition, most of the planning area lies within the LUSD; only the far northeastern portion of the area lies within the PSD. The facilities and enrollments within these districts are described below. Placer Union High School District. Placer Union High School District operates several high schools within its far-reaching boundaries. Del Oro High School lies within the planning area, and is the only one to serve planning area residents. Its permanent capacity of 1,084 is augmented by 12 portable classrooms. The school’s enrollment of about 1,400 exceeds the permanent capacity by about 29 percent. Table 5-1 shows the enrollment and capacity of Del Oro High School. Loomis Union School District. There are three schools within the LUSD. Loomis Elementary School serves grades K-6, while both Franklin and Placer Elementary schools serve grades K-8. The current enrollment districtwide exceeds the permanent capacity of the facilities by about 5 percent. Only Loomis Elementary School has any remaining capacity, but this is offset by overenrollment at the other schools. Portable classrooms are used to house excess enrollment. With the recent introduction of the statewide Class Size Reduction Program, the demand for new facilities has increased, and the shortage of space is exacerbated. Table 5-1 shows the current capacity and enrollment within planning area schools.
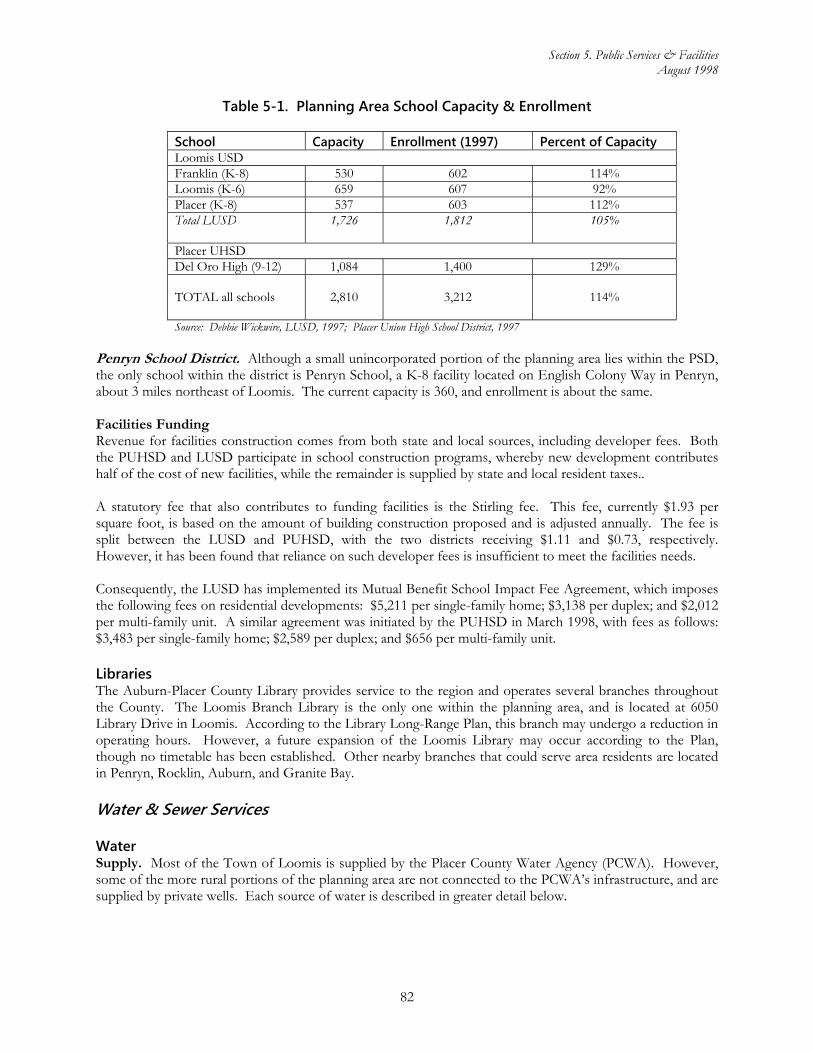
Section 5. Public Services & Facilities August 1998
82
Table 5-1. Planning Area School Capacity & Enrollment
School Capacity Enrollment (1997) Percent of Capacity Loomis USD Franklin (K-8) 530 602 114% Loomis (K-6) 659 607 92% Placer (K-8) 537 603 112% Total LUSD
1,726 1,812 105%
Placer UHSD Del Oro High (9-12) 1,084 1,400 129% TOTAL all schools
2,810 3,212
114%
Source: Debbie Wickwire, LUSD, 1997; Placer Union High School District, 1997 Penryn School District. Although a small unincorporated portion of the planning area lies within the PSD, the only school within the district is Penryn School, a K-8 facility located on English Colony Way in Penryn, about 3 miles northeast of Loomis. The current capacity is 360, and enrollment is about the same. Facilities Funding Revenue for facilities construction comes from both state and local sources, including developer fees. Both the PUHSD and LUSD participate in school construction programs, whereby new development contributes half of the cost of new facilities, while the remainder is supplied by state and local resident taxes.. A statutory fee that also contributes to funding facilities is the Stirling fee. This fee, currently $1.93 per square foot, is based on the amount of building construction proposed and is adjusted annually. The fee is split between the LUSD and PUHSD, with the two districts receiving $1.11 and $0.73, respectively. However, it has been found that reliance on such developer fees is insufficient to meet the facilities needs. Consequently, the LUSD has implemented its Mutual Benefit School Impact Fee Agreement, which imposes the following fees on residential developments: $5,211 per single-family home; $3,138 per duplex; and $2,012 per multi-family unit. A similar agreement was initiated by the PUHSD in March 1998, with fees as follows: $3,483 per single-family home; $2,589 per duplex; and $656 per multi-family unit. Libraries The Auburn-Placer County Library provides service to the region and operates several branches throughout the County. The Loomis Branch Library is the only one within the planning area, and is located at 6050 Library Drive in Loomis. According to the Library Long-Range Plan, this branch may undergo a reduction in operating hours. However, a future expansion of the Loomis Library may occur according to the Plan, though no timetable has been established. Other nearby branches that could serve area residents are located in Penryn, Rocklin, Auburn, and Granite Bay.
Water & Sewer Services Water Supply. Most of the Town of Loomis is supplied by the Placer County Water Agency (PCWA). However, some of the more rural portions of the planning area are not connected to the PCWA’s infrastructure, and are supplied by private wells. Each source of water is described in greater detail below.

Section 5. Public Services & Facilities August 1998
83
Placer County Water Agency The Placer County Water Agency (PCWA) provides domestic water service throughout Placer County, including the Loomis community. The Agency’s water supplies include 125,000 acre-feet of water per year (AFY) from the Yuba-Bear River watershed and 120,000 AFY from the Middle Fork of the American and Rubicon rivers. An additional 117,000 AFY can be purchased from the U.S. Bureau of Reclamation. Table 5-2 summarizes the water supply available to the PCWA.
Table 5-2. Water Available to the PCWA
Water Source Amount (AFY)
Yuba-Bear rivers 125,000 American-Rubicon rivers
120,000
Bureau of Reclamation 117,000 TOTAL 362,000 Source: PCWA
Service Area. Loomis is within PCWA’s Zone 1 service area, which also extends from as far north and east as Auburn, west to Lincoln, and south to Granite Bay. PCWA operates five water treatment plants in Zone 1: the Auburn, Bowman and Newcastle treatment plants serve the upper portion of Zone 1, while the Foothill and Sunset plants serve the lower portion of the service area. Distribution and Storage Facilities. The Foothill Water Treatment Plant near Newcastle provides the required water treatment for the domestic water supplied to the Loomis community. The design capacity of the plant is 25 million gallons per day (mgd), which is sufficient to serve the present needs of its service area (about 7,500 connections). However, the plant is in the preliminary stages of being expanded to increase its capacity to 35 mgd. Water reaches the Foothill Water Treatment Plant from two conduits: PG&E’s South Canal is the main source, while the PCWA’s Boardman Canal is a secondary source. The water is stored in two reservoirs, the Penryn Tank in Penryn and Mammoth Reservoir between King and Horseshoe Bar roads. Both are located outside the planning area. The Penryn Tank stores about 1 million gallons of treated water, while Mammoth Reservoir stores canal water. A 120,000-gallon storage tank on Taylor Road across from Del Oro High School can hold additional water for the community. The Cross-Basin Pipeline connects to the Foothill Water Treatment Plant to the Sunset Water Treatment Plant providing additional service to Loomis and the areas north and east of Loomis. Phases I and II of the Cross Basin Pipeline were recently completed and are currently in service. Residential, commercial and industrial customers in the Town receive water service by feeder lines that branch from a 24-inch main running along the Union Pacific Railroad corridor on the west side of Taylor Road. The primary north-south main in the community is a 12-inch pipeline along Laird Road. Figure 5-1 shows the major lines in the PCWA water distribution network within the Loomis planning area. System Deficiencies. PCWA’s Zone 1 Water System Master Plan identifies no major transmission problems with the distribution system in the planning area.

Section 5. Public Services & Facilities August 1998
84
Figure 5-1. Water Distribution Network

Section 5. Public Services & Facilities August 1998
85
Private Wells. Portions of the Loomis community do not have access to the PCWA’s distribution system and are supplied by private wells. The rural residential properties along Barton Road are within the largest area in Loomis not served by the PCWA. Groundwater distribution in the planning area is sporadic and well yield is highly variable. The average production of wells in the area is 4 to 9 gallons per minute. Water quality varies with the source. Granitic rock wells provide the best water quality in the area and many of the area’s wells are of this type. Wells overlying alluvial deposits vary from low to moderate quality. Many wells in the area experience iron and manganese contamination, sometimes associated with low yield. Please refer to Section 4.2.3, Groundwater, for further discussion of this issue.
Wastewater Most of the planning area is connected to wastewater collection infrastructure, a service provided by the South Placer Municipal Utility District (SPMUD). North of Interstate 80, the Town is served by sewer lines ranging from six to 12 inches in diameter. The primary service line is a 15-inch pipe near Taylor Road, known as the Lower Loomis Trunk Sewer. South of the freeway, the Middle Secret Ravine Trunk extends to Barton Road and a tributary pipe network serves portions of the community in this area. The SPMUD Sewer Master Plan (1986) identifies the need for an 18-inch Middle Antelope Creek Trunk Sewer to serve future development in the western portion of the community. SPMUD would extend this trunk northward along the general alignment of Antelope Creek as growth requires. This plan would be most easily implemented if growth occurred from south to north along this corridor, so infrastructure could be extended logically. The trunk sewer system collects wastewater from residential and commercial uses and transports it to the Roseville Regional Wastewater Treatment Plant (RRWWTP). The RRWWTP currently treats an inflow of about 13 million gallons per day (mgd), and was recently expanded to accommodate up to 18 mgd. Some of the wastewater in the planning area is treated by on-site private septic systems, particularly within larger rural residential lots on the periphery of the planning area, especially (but not exclusively) in unincorporated areas. Some septic systems in the area have a history of discharge and maintenance problems. However, because the placement and maintenance of septic systems is up to private individuals and not public agencies, issues related to septic systems are discussed in more detail in Sections 4.2 and 4.3 of this report, Water Resources and Soil and Mineral Resources, respectively.
Drainage & Flood Control The planning area is within the Dry Creek watershed, which covers about 101 square miles in Placer and Sacramento counties. Antelope Creek, Secret Ravine, and their tributaries are the primary drainages in the area. The Placer County Flood Control and Water Conservation District (PCFCWCD) is responsible for developing flood control management strategies within the County. The Dry Creek Watershed Flood Control Plan (James M. Montgomery, 1992) prepared for the PCFCWCD and the Sacramento County Water Agency addresses flood control within the watershed, and suggests the following development principles: New development should provide on-site detention; Local policies should be implemented to restrict the removal of riparian vegetation along channels,
(except as necessary to mitigate flooding potential); Regional detention basins should be constructed; Inadequate bridges and culverts should be replaced; and Procedures for flood preparedness should be formulated.

Section 5. Public Services & Facilities August 1998
86
The Town of Loomis Resolution 97-70 establishes an agreement between PCFCWCD and the Town to coordinate the development, support and operation of PCFCWCD facilities. Within the planning area, the Loomis Town Manager is the Town Floodplain Administrator. The PCFCWCD provides guidance to the Town in dealing with potential flooding impacts. To help implement the above principles, on-site detention that reduces runoff to 90 percent of existing flows is required of new development within the Dry Creek watershed. No regional flood control facilities are located within the Loomis planning area. However, several small unnamed reservoirs provide local flood detention within the Town. Please refer to Section 7, Safety & Noise Issues, Flooding Hazards, for additional information regarding the location of flood-prone areas in the Town.
Solid Waste Management The Auburn Placer Disposal Service (APDS) provides solid waste disposal for the planning area. If households elect to subscribe to the service, each is provided with a 32- or 90-gallon container for weekly collection of domestic refuse. APDS places a 180-pound weight limit for refuse within these containers. At this time, subscription to APDS is not mandatory. It is expected that the issue of mandatory collection will be brought before the Town Council in late 2000/early 2001. APDS estimates that individual households produce about 100 pounds of solid waste per week (Town of Loomis, Heritage Park Estates Draft EIR, 1998). This estimate is somewhat higher than that of the Placer County Solid Waste Management Plan, which estimates about 3.5 pounds per person per day, or about 65 pounds per household per week; however, it is lower than suggested by a recent survey in Rocklin. Solid waste is taken to the Western Regional Sanitary Landfill (WRSL) in western Placer County at the intersection of Athens Avenue and Fiddyment Road. The landfill is managed by the Western Placer Waste Management Authority, which consists of representatives from Rocklin, Lincoln, Roseville, and Placer County. The 800-acre landfill has been operating since 1979. A materials recovery facility at the landfill was opened in 1997. The facility currently has a 750-ton capacity per 8-hour shift, and processes an average of 600 tons per day (Smith, 1996). The facility is expandable to handle up to 2,000 tons per day with a 16-hour shift, with a 17 percent guaranteed minimum recovery rate. The materials recovery facility includes a compacted residential waste tipping area and recyclables drop-off/buy back center. Currently, recyclable materials are co-mingled with household garbage or collected in “blue bags” and transported to the materials recovery facility. In accordance with AB 939, recyclables are sorted from the refuse, and the residual is transferred to the landfill. With the introduction of the materials recovery facility, the effective lifespan of the WRSL is estimated at 50-75 years. The Placer County Source Reduction and Recycling Element (SRRE) was approved in 1994, pursuant to the requirements of AB 939. The SRRE describes the existing waste stream, evaluates reduction and recycling alternatives, and indicates how the county will divert 50 percent of solid waste from its landfills and incinerators by 2000.
Utilities Gas and Electricity The Pacific Gas and Electric Company (PG&E) supplies natural gas and electricity to homes and businesses in Loomis. These services are provided in accordance with Public Utilities Commission (PUC) rules and regulations. Some rural locations on the periphery of the community are not connected to the existing gas

Section 5. Public Services & Facilities August 1998
87
distribution network, and are instead on individual propane hookups. This service is currently provided by many private propane providers on an individual basis. Telephone Pacific Bell currently provides phone service to homes and businesses in the Loomis area and is responsible for maintaining telephone infrastructure in the area. However, many alternative local and long-distance companies are available to provide service using Pacific Bell’s network of phone lines. Cable Television Starstream Communications of Rocklin is the cable television provider to the Loomis community. No service deficiencies have been identified.
Findings 5-1 Law enforcement services to the Loomis community are provided by the Placer County Sheriff’s
Department. Response times average about 3.5 to 7 minutes.
5-2 The Town of Loomis tries to maintain a standard of one sworn officer per 800 residents. Current staffing levels do not meet this standard.
5-3 The Loomis Fire Protection District (LFPD) serves nearly all of the planning area. Only a small portion of the planning area is outside the LFPD’s service area and is located in the Penryn Fire District. The California Department of Forestry also provides fire protection services, particularly with regard to rural wildland fires.
5-4 LFPD personnel provide first response to emergency calls, emergency medical care, hazardous spill removal, and rescue assistance.
5-5 The LFPD receives about 600 emergency calls per year, about 45 percent of which are for medical assistance. Only about 10 percent of these calls are for fires or mutual aid assistance.
5-6 Emergency response times for fire assistance typically range from three to four minutes.
5-7 The Loomis planning area encompasses portions of three school districts: Placer Union High School District (PUHSD), Loomis Union School District (LUSD), and Penryn School District (PSD). The entire planning area lies within the PUHSD, which serves grades 9-12. Most of the planning area lies within the LUSD, while only the far northeastern portion of the area lies within the PSD.
5-8 Del Oro High School is the only high school to serve planning area residents. The school’s enrollment of about 1,400 exceeds the permanent capacity by about 29 percent.
5-9 There are three schools within the LUSD. The current enrollment districtwide exceeds the permanent capacity of the facilities by about five percent. Only Loomis Elementary School has any remaining capacity. Portable classrooms are used to house excess enrollment, which is about 3,200 districtwide.
5-10 Revenue for facilities construction comes from both state and local sources. Both the PUHSD and LUSD participate in the Office of Public School Construction 50/50 program. A statutory fee, currently $1.84 per square foot, also provides funding to area schools. However, reliance on such developer fees is insufficient to meet facilities needs.
5-11 The LUSD has implemented its Mutual Benefit School Impact Fee Agreement, which imposes the following fees on residential developments: $5,015 per single-family home; $3,023 per duplex; and $1,937 per multi-family unit. A similar agreement was initiated by the PUHSD in March 1998, with fees as follows: $3,483 per single-family home; $2,589 per duplex; and $656 per multi-family unit.

Section 5. Public Services & Facilities August 1998
88
5-12 The Auburn-Placer County Library provides service to the region, and operates several branches throughout the County. The Loomis Branch Library is the only one within the planning area and is located at 6050 Library Drive in Loomis.
5-13 Most of the Town of Loomis is supplied by the Placer County Water Agency (PCWA). Some of the more rural portions of the planning area are supplied by private wells.
5-14 The Foothill Water Treatment Plant near Newcastle provides the required water treatment for the domestic water supplied to Loomis. Water reaches the Foothill Water Treatment Plant from two conduits: PG&E’s South Canal is the main source, while the PCWA’s Boardman Canal is a secondary source. Water is stored in two reservoirs, the Penryn Tank in Penryn, and Mammoth Reservoir between King and Horseshoe Bar roads. Both are located outside the planning area.
5-15 Residential, commercial and industrial customers in Loomis receive water service by feeder lines that branch from a 24-inch main running along the Union Pacific Railroad corridor on the west side of Taylor Road. The primary north-south main in the community is a 12-inch pipeline along Laird Road.
5-16 Most of the planning area is connected to wastewater collection infrastructure, a service provided by the South Placer Municipal Utility District (SPMUD). North of Interstate 80, the Town is served by sewer lines ranging from six to 12 inches in diameter. The primary service line is a 15-inch pipe near Taylor Road, known as the Lower Loomis Trunk Sewer. South of the freeway, the Middle Secret Ravine Trunk extends to Barton Road, and a tributary pipe network serves portions of the community in this area.
5-17 The Placer County Flood Control and Water Conservation District (PCFCWCD) is responsible for developing flood control management strategies within the County. The Dry Creek Watershed Flood Control Plan (James M. Montgomery, 1992) prepared for the PCFCWCD and the Sacramento County Water Agency addresses flood control within the watershed, and provides guidance for area development.
5-18 There are no regional flood control facilities within the Loomis planning area. However, several small unnamed reservoirs provide local flood detention within the Town.
5-19 The Auburn Placer Disposal Service (APDS) provides solid waste disposal for the planning area. At this time, subscription to this service is not required. It is expected that the issue of mandatory collection will be brought before the Town Council in 1998.
5-20 Solid waste is taken to the Western Regional Sanitary Landfill (WRSL). A materials recovery facility (MRF) at the WRSL was opened in 1997. The facility currently has a 750-ton capacity per 8-hour shift, and processes an average of 600 tons per day (Smith, 1996). With the introduction of the MRF, the effective lifespan of the WRSL is estimated at 75 years (Dominguez, 1997).
5-21 The Pacific Gas and Electric Company (PG&E) supplies natural gas and electricity to homes and businesses in Loomis. Pacific Bell currently provides phone service to homes and businesses. Starstream Communications of Rocklin is the cable television provider to the Loomis community. No service deficiencies have been identified.

Section 6. Market Analysis August 1998
89
PLACER
SACRAMENTOCOUNTY
COUNTY
COUNTY
COUNTY
COUNTY
PLACER
NEVADAYUBA
Roseville
Rocklin
Granite Bay
LincolnAuburn
Loomis65
99
70
193
70
I-80
49
Douglas Blvd.
I-80
Section 6. Market Analysis
Purpose of the Market Analysis This market analysis was conducted to: Provide information regarding the regional and local economic setting, Evaluate the dynamics between supply and demand of various land uses, Estimate the amount of development that could be absorbed in Loomis, and Determine where the new development may be best suited relative to existing land uses. The analysis focuses on the growth potential of non-residential land uses, including retail, office, and industrial uses; however, a forecast of residential demand through the year 2020 is also included. The results of the market analysis will assist in the formulation of economic development policies to be incorporated into the General Plan Update.
Context: Western Placer County The Town of Loomis functions within in regional economy that includes the portion of Placer County from Roseville to the south up to Auburn to the north. This region can generally be divided into two components, the western Placer County areas of Roseville, Rocklin, Granite Bay, Loomis, Penryn, and Lincoln, and the central Placer County areas of Newcastle, Auburn, Bowman, Christian Valley, Meadow Vista, and Clipper Gap. The context of the regional marketplace in which Loomis operates is focused on the western Placer County areas.
Economic Development in Placer County Placer County can boast of having many of the qualities and amenities that families and employers alike seek in a living and working environment: clean and safe schools and neighborhoods with small town charm; available housing, from affordable to executive; the lifestyle of country living with big city conveniences; a trained and educated work force; an effective transportation network, including ready access to an international airport; seismic stability; rolling foothills and easy access to world class recreational opportunities, including Lake Tahoe.

Section 6. Market Analysis August 1998
90
The following residential and business discussion is excerpted from Discover Placer County, February 1998, which is a publication of Neighbors, the community newspapers division of The Sacramento Bee. The excerpted articles in Discover Placer County were written by Dirk Werkman and are used here to provide an overview of the residential and business settings in western Placer County. Residential Overview A significant amount of interest in both residential and non-residential property in the County and its constituent cities is coming from the San Francisco Bay Area. Because housing costs are lower, employees of businesses located in the Placer County area have an easier time finding a place to live than they do in the Bay Area. Quality of life issues play into a decision to move, also. The Roseville and Rocklin areas have experienced rapid growth; Rocklin is currently the county’s fastest growing city with a 47 percent increase in population since 1990. Between now and 2005, though, Lincoln is expected to become the fastest growing city, with a population predicted to nearly double from approximately 8,100 to 15,000 in 2005. Granite Bay Granite Bay, an unincorporated portion of Placer County, has much to attract homebuyers, including approximately 75 miles of shoreline along Folsom Lake. Much like Loomis, preserving the atmosphere of the community is an important element governing development. For example, protecting trees and maintaining free flowing traffic are two major factors involved in the Gladstone Park proposal (an area between Douglas Boulevard and Eureka Road) to construct 82 semi-custom homes. Approximately 24 percent of the 76-acre project site is to be designated open space, including most of Strap Ravine. Other projects being proposed for Granite Bay include a plan to construct seven single-family homes 200 feet south of Joe Rodgers Road at the southerly terminus of Ebony Oaks Lane. County officials are also looking at plans to create a 16.5-acre park at the southeast corner of Douglas Boulevard and Barton Road. Lincoln Lincoln’s population is expected to double by the middle of the next decade. A list of planned projects compiled by Lincoln officials suggests that if everything that has been proposed for construction is eventually built, more than 15,000 new dwelling units could be added to the community’s housing stock over the next several decades. Those projects don’t include the second Sun City that the Del Webb Corporation is planning to construct in the Lincoln area. When Sun City-Roseville is completed, a similar active retirement community is scheduled to begin in Lincoln. Big population increases are expected to occur in two proposed planned developments: the Twelve Bridges project, with 10,075 units; and the Lincoln Crossing project, with 3,073 dwelling units. Moving through the City’s planning and permit process are 14 residential projects, with the largest being the 733-lot single family residential subdivision constituting the first phase of Lincoln Crossing. Another 13 projects, ranging in size from seven single family homes to 357 houses, would add more than 1,400 dwelling units.
The Placer County Electronics Industry Technical Report, prepared by the Real Estate & Land Use Institute, California State University, Sacramento, in April 1997 for the Placer County Office of Economic Development features the opportunities and advantages of Placer County as a location for electronics companies. The Real Estate & land Use Institute also conducted a survey in January 1997 of software and computer services firms entitled Placer County Computer Support and Software Industry Survey. Based on survey data and secondary research, Placer County was determined to be well-positioned in all ten of the following key site selection factors that influence high-technology firms: 1. Proximity to customers or clients 2. Access to interstate highways 3. Reasonable real estate costs 4. Availability of skilled workers 5. Pro-business government officials 6. Reasonable wage rates 7. Reasonable/stable utility rates 8. Reasonable costs of living 9. Reasonable business taxes 10. Cultural and recreational activities Note that both studies included comments from survey respondents expressing concern about rapid growth and encouraging the County and its cities to exercise responsible planning and to monitor growth. One study noted that “[f]irms want to ensure that this fast-paced economic growth does not lead to environmental deterioration, inadequate infrastructure, declining public services, inadequate support for existing businesses, or economic imbalances such as a skilled labor shortage.” An approach to planning in Loomis that is responsive to the need to both accommodate growth and preserve a quality of life may go a long way to attract certain high-technology companies.
The Town of Loomis Description The Town is divided into two distinct areas by I-80. The area north of I-80 contains all of the existing retail, office, and industrial uses. Commercial development is located predominantly along Taylor Road, virtually from one side of the Town limits to the other, although it is focused in the Town Center area on either side of Horseshoe Bar Road in the oldest part of Town. Older commercial areas also exist along King Road, and the new Raley’s Center is

Section 6. Market Analysis August 1998
91
Rocklin Census figures show that Rocklin is one of the fastest growing cities in California. Permits for single family homes rose from 422 in 1996 to 569 last year. Permits for multi-family homes increased at an even faster pace, from 103 in 1996 to 372 in 1997. New permits for both single family and multi-family residential projects are expected in 1998 to equal or exceed the 1997 numbers. Stanford Ranch has been a major contributor to the growth in Rocklin, with 6,500 residences, new commercial development, parks, and other facilities. Stanford Ranch will include approximately 8,000 dwelling units when it is completed. Other big developments in Rocklin include Whitney Oaks, with 2,385 dwelling units and an 18-hole golf course, and Sunset West, with 3,081 dwelling units. Roseville Sun City-Roseville continues to attract retirees in numbers that help make Roseville the County’s largest municipality. With six new models opening this year, potential buyers will have 23 product types from which to choose. Sun City has less than 1,000 homes remaining to build out the community’s 3,100-unit plan. Of the 1,685 residential building permits issued last year in Roseville, 617 were for Sun City; the remainder reflected dozens of other projects scattered throughout the city. More dwelling units are under construction or in the planning process, and City officials are working to strike a balance between all types of housing. At the beginning of 1998, more than 50 single family subdivisions and 900 multi-family units were moving toward the construction phase. However, the supply of residential land in Roseville is expected to be exhausted prior to the planning horizon of 2020. Existing General Plan areas, including the Southeast Roseville Specific Plan, Northeast Roseville Specific Plan, North Central Roseville Specific Plan, and Northwest Roseville Specific Plan, are expected to generate 6,000 homes through 2005, with the majority of those occurring in the North Central area around Roseville Parkway. New growth areas, including the North Roseville Specific Plan, Stoneridge Specific Plan, and Highland Reserve North Specific Plan, are predicted to generate another 7,000 homes through the year 2010. Stoneridge and Highland Reserve North are the areas of Roseville closest to Loomis. Business Overview Placer County is experiencing an explosion of commercial and industrial development providing high-paying jobs. For example, Hewlett-Packard now employs more than 5,000 people in Roseville, Rocklin, and Lincoln, and announced plans last year to construct a seventh building on its 500-acre Roseville campus—a three-story, 300,000-square foot complex where another 1,000 employees will be housed. Quality of life, abundant available land for development, a pro-business and planned-growth approach to land use, preservation of open space, and a variety of skilled, trained workers will combine to continue to attract businesses bringing high-paying jobs. The Placer County Board of Supervisors recently demonstrated its conviction to build a strong economic base for the future by approving the Sunset Industrial Area Plan, which earmarks about 8,900 acres of land for industrial development. A
just off the freeway on Horseshoe Bar Road. Industrial uses are located in the triangular area between Taylor Road and Swetzer Road in the northern part of this section of town, with the newer light industrial uses concentrated along Swetzer Road. The area north of I-80 also contains multi-family and higher density residential uses, although vast sections of the western part of this northern area along Sierra College Boulevard are devoted to rural residential uses on parcels generally from two to 20 acres in size. The Town Hall, Veteran’s Building, library, schools, fire department, South Placer Municipal Utility District and Placer County sheriff substation are located in the north area. The area south of I-80 is almost exclusively rural and residential in nature, with the exception of Indian Creek County Club on Barton Road, some churches where Barton, Brace, and Horseshoe Bar Roads intersect, and Mount St. Joseph Seminary south of Wells Avenue. Rural estate and rural residential uses ranging from half-acre lots to 300-acre ranches give this area a rural, equestrian character.
Perception As stated in the 1987 General Plan, “[t]he citizens of the Town of Loomis chose to incorporate so that the course of future development might be locally determined and directed and to preserve the semi-rural aspects of the community…The overriding goal in the General Plan indicates a preference for a slower rate of growth.” An article in the February 1998 Discover Placer County notes that “Loomis was described by the Placer County Association of Realtors several years ago as ‘one of the slower growing areas’ in the county.” It also states that “[r]esidents of this agriculturally oriented community that is home to the Eggplant and Chicken Teriyaki festivals would rather preserve their quality of life than add more residents.” Despite recent efforts by the Town to foster more of a responsible-growth rather than no-growth attitude about its community, the prevailing perception that apparently goes back over a decade is that Loomis does not encourage new development. Conversations with commercial brokers, the Placer County Office of Economic Development, and others revealed that, while many

Section 6. Market Analysis August 1998
92
redevelopment plan will help provide backbone infrastructure and services to help attract businesses to this unincorporated area between Roseville, Rocklin, and Lincoln. Aside from attracting employers to the area, the intent of the plan is to separate industrial developments from neighborhood developments. The plan illustrates how Placer County continues to foster economic growth rather than let it happen by accident. Also, the Highway 65 Jobs Coalition, created in March 1993, allows the cities of Roseville, Rocklin, and Lincoln and two major industrial parks to cooperatively draw more businesses to the area. Lincoln With so much residential development planned in coming years, Lincoln might appear to be shaping up as a bedroom community. However, two planned developments that would add thousands of new homes to Lincoln would also provide nearly 200 acres of new commercial space. The proposed Twelve Bridges development envisions 107 acres of commercial enterprise, and more than 43 acres of commercial development is included as part of the planned Lincoln Crossing development. Another project proposed by Buzz Oates Enterprises II involves the construction of a 378,000-square foot building in two phases. The Lincoln Airport also attracts commercial and industrial development. Rocklin Oracle, which is the world’s second largest software company, selected Stanford Ranch in Rocklin for its newest facility. Oracle purchased a 35.4-acre site to construct a 100,000-square foot facility, which opened last fall, to house approximately 350 data processing employees. Rocklin officials have approved plans that would expand Oracle’s workforce in Rocklin to 2,000 in the future. Oracle is one of many high-tech companies that have or will be operating in Rocklin. Stanford Ranch has also attracted other significant employers such as Herman Miller, TASQ Technology, VeriFone, Financial Pacific Insurance Company, and 1-800-Courier. New growth areas in Rocklin are expected to include light industrial, business park, retail, and hotel uses. For example, the Sunset West planning area includes approximately 66 acres of light industrial and business park uses as well as 72 acres of commercial land uses (retail and potentially hotel). Clover Valley also includes approximately five acres of land for retail, hotel and other commercial uses. Roseville With major corporations such as Hewlett-Packard and NEC planning expansions of their Roseville facilities, the City of Roseville is processing numerous plans that will add shopping facilities, hotel rooms, and office space to an increasingly rich economic mix of job-producing companies. Building permits are expected to be issued by December for the 1.1 million-square foot Roseville Regional Mall planned near Harding Boulevard and the Highway 65 bypass. Macy’s, JC Penny, and Sears have already signed as anchor tenants, and the mall is scheduled to open in April 2000. Plans are being developed to
feel there is a market for new residential and non-residential development in Loomis, they also consider Loomis a town adhering to a policy of slow or no growth. It seems clear that in order to simply stimulate interest in Loomis for new development projects, not necessarily promote rapid growth, the Town must shed its label as a no-growth community.
Current Development Projects Although these no-growth perceptions persist, a disconnect between perception and reality appears to exist. The Town of Loomis is experiencing development and growth pressures just like the rest of western Placer County, albeit not as intense. Several projects are in various stages of the entitlement, development, or lease-up process, indicating that a change in perception may bring a heightened interest in Loomis development. Current projects include the following: 1. Raley’s Shopping Center was completed in late
1996 and is currently fully leased. Located just off the Horseshoe Bar Road interchange with I-80, this center includes Raley’s supermarket/drug center superstore with nearly 45,000 square feet of main sales area. The superstore is attracting shoppers from as far away as Auburn due, in part, to its convenient access immediately off the freeway. The shopping center also includes a Round Table Pizza, Trend Cuts, Loomis Cleaners, Gold Crown Hallmark, and two fast food restaurant out-parcels, a Burger King and a Taco Bell. This shopping center is a strong sign of the market depth that exists in the Loomis area, responding to unmet demand for these types of goods and services. Raley’s is not known for making site selection mistakes, and this center should prove to be as successful in the distant future as it is today.
2. Construction of Taylor Circle Center at the corner of Taylor Road and Circle Drive is complete. The center offers office and retail space, with approximately 600 square feet still available. The remainder of the center is reported to be pre-leased. The largely pre-leased condition of the building suggests a pent-up demand for new office space in the area.
3. Calthorpe Associates prepared a plan to guide physical development of downtown Loomis, much of which was adopted by the Town in 1992 as the Downtown Center Master Plan. Several downtown projects are underway, including a multi-modal

Section 6. Market Analysis August 1998
93
construct the Creekside Center eas tof the mall, which will include two hotels and over one million square feet of retail and office space. With the increased commercial and industrial development, the need for additional hotel rooms is increasing. Three new hotels are planned in addition to the two included in Creekside Center. The 151-room Hilton Garden Inn is scheduled for the northwest corner of Taylor Road and Roseville Parkway, a 262-room hotel is planned by Marriott Hotels for the northeast corner of Taylor Road and Roseville Parkway, and a 122-room Extended Stay America is scheduled for the intersection of Lead Hill and Harding Boulevards. Now that the new Sutter Roseville Medical Center opened in June last year, the former hospital site on Sunrise Boulevard may be included in a future redevelopment area. Also, Roseville officials are reviewing proposals for at least six new restaurants. Expansion is continuing at the Roseville Auto Mall, which has become a regional magnet for auto sales. Another 12 theaters are expected this year at the Century Theater complex that will complete the Northeast Roseville Specific Plan, adding to the 12 existing theaters of the United Artist complex at Eureka Road and Sunrise Avenue.
- Discover Placer County, February 1998
transportation facility centered around the historic Southern Pacific Rail Depot in Loomis. The project involves restoring the train depot building and building infrastructure around the depot. It will also include a downtown park-and-ride lot next to the depot building, a pick-up and drop-off plaza in front of the depot building, and roads leading into and out of the facility. A bus stop is also planned to be included.
4. Numerous residential projects of varying density are proposed, including:
North of I-80 Heritage Park, a 68-unit development on 22
acres (3.7 units per gross acre) off South Walnut Street adjacent to I-80.
South of I-80 Loomis Hills, a 64-lot development on 322
acres (5 gross acres per lot) between Barton Road and Laird Road south of the Indian Creek Country Club and just north of Wells Avenue.
Loomis Retail Absorption Analysis Background Conversations with commercial brokers and a review of published documentation, including the Market Absorption Update prepared for the City of Roseville by Hausrath Economics Group in May 1998, provided some insight into the status of the markets for retail, office, and industrial space. Non-residential absorption during the last half of this decade will exceed prior expectations based on low vacancy rates and the continued strength of the regional economy. The City of Roseville is currently processing a large number of applications for retail developments, including 2.0 million square feet in two regional projects alone. Approximately 1.1 million square feet is planned for the up-scale Galleria Regional Mall, which is currently projected to be developed in a single phase. The addition of this high-quality regional shopping destination, together with the 0.9 million square foot retail component of Creekside Center, may significantly affect retail shopping patterns. Niche markets based on tourism (Nevada City and Auburn are good examples), commute patterns, specialty stores, discount stores, and local-serving retail may need to be explored more fully in other areas of Placer County as a result. The Loomis retail market generally consists of small shops, in older buildings, with little turnover. The exception to this, of course, is the Raley’s Shopping Center. Land prices are low, lease rates are low, and vacancies are low. Downtown Loomis appears to have relatively few vacant spaces. The mix of retail, office, and service establishments located in this area include such businesses as Christensen’s, Placer Savings and Loan, Nelthorpe’s, Main Drug, the Post Office, the Chamber of Commerce and The Loomis News, and the new Horseshoe Bar and Grill. Two existing strip shopping centers outside downtown were reported in the Loomis Microbrewery Feasibility and Downtown Study prepared by Bay Area Economics in November 1996 to have a substantial amount of vacant space. However, both centers are now fully leased. Loomis Plaza, located at the corner of King Road and Swetzer Road, includes Woody’s Market & Deli, Custom Picture Framing, T&N Nail Salon, Creative’s Image Beauty Salon, Loomis Chinese Restaurant, and 49'er Cellular. Stonetree

Section 6. Market Analysis August 1998
94
Plaza, located just south of Taylor Circle Center on Taylor Road, includes The Pizza Factory (now closed), Stonetree Liquor Market & Deli, State Farm Insurance, and an Internal Medicine doctor’s office.
Retail Sales Capture and Leakage The first step in analyzing an area’s retail market is to determine whether “leakage” or “capture” of retail sales is occurring. Leakage would occur if there is insufficient retail space to meet the shopping needs of Loomis residents, which would result in retail dollars “leaking” outside the city as shoppers go elsewhere to consume the goods and services they demand. Capture would occur if there is an excessive amount of retail space to meet the shopping needs of Loomis residents, combined with a lack of retail space in surrounding areas, which would result in retail dollars being “captured” from areas outside the city as shoppers from surrounding areas come to Loomis to consume the goods and services they demand. Since 1992, several studies have documented the retail sales leakage condition experienced in Loomis. The Retail Market Opportunity Analysis: Town of Loomis, prepared by Marketing for Professionals in August 1992, documented the massive retail expenditure leakage occurring at the time, analyzed the retail categories that appeared to be most deficient, and recommended appropriate retail stores to recruit into the area. In September 1994, Downtown Revitalization Consultants as the lead consultant completed the Loomis Downtown Economic Development Program Handbook, which included a retail market analysis showing that the Town lacked a critical mass of retail stores, making it difficult to keep shoppers at home and to attract new businesses, resulting in less than half of the Loomis retail potential being realized. Most recently, Bay Area Economics produced the Loomis Microbrewery Feasibility and Downtown Study in November 1996 to evaluate the viability of reusing the LFGA fruit shed for new retail purposes and analyze the economic development needs of both the downtown and overall Town. That study also included an analysis of retail sales in the area, concluding that a significant leakage of retail expenditures from Loomis was occurring. The results of the retail sales leakage analysis for Loomis are consistent with prior studies and are presented in Tables C-1 through C-7 in Appendix C following the text of this report. Table C-1 projects the estimated number of households in each of the areas included in western Placer County. Table C-2 projects the estimated household income for each area, and Table C-3 multiplies the data in Table C-1 by the data in Table C-2 to derive total income projections. Tables C-4A through C-4F present the estimated demand in each area by retail sales category based on spending habits that assume total retail expenditures per household account for approximately 38 percent of household income. Table C-4G summarizes the demand projections by retail category, which amount to $1.5 billion in the year 2000 and increase to $3.1 billion by 2020. Table C-4H summarizes the demand projections by area for 1998. Of the total demand, the Town of Loomis represents the smallest share at 3.6 percent, while demand generated in Roseville constitutes 46.6 percent of the total demand in western Placer County. The estimated supply of retail space in 1998, expressed in terms of retail sales, is shown in Table C-5. The Town of Loomis accounts for only 2.1 percent of the total supply of retail in the area. As expected, Roseville accounts for a very high share of the total supply, estimated to be approximately 75 percent. Tables C-6A through C-6H bring demand and supply together to estimate whether each area is experiencing a capture or leakage of retail sales. Table C-6A illustrates that Loomis is currently experiencing a leakage of over $16 million, and that amount is projected to increase to over $72 million by 2020 if no additional retail space is added to the existing supply. The current leakage amount is very similar to the amount estimated in the BAE study in late 1996, owing to the fact that no major additions to supply have been introduced into the Loomis market since the opening of the Raley’s Shopping Center and the growth in new households has been relatively stagnant. The Loomis rural area, which includes Penryn and the other areas adjacent to the Town limits as defined by the Loomis area regional analysis district according to SACOG (discussed further below), is experiencing a significant amount of leakage as expected. Each of the other areas are also in a leakage situation, except for Roseville, which is capturing approximately $543 million in retail sales from areas outside its boundaries. A large portion of these captured sales relates to the Roseville Auto Mall.

Section 6. Market Analysis August 1998
95
Table 6-1: Trade Area Capture Rates by Retail Category
Trade Area
Neighborhood Retail
Other Retail
Primary 100% 75%Secondary 0% 45%Tertiary 0% 25%Other 0% 5%
As presented in Table C-6G, there appears to be a severe shortage of retail outlets providing a variety of apparel goods and services. This shortage will likely be eliminated or even reversed with the addition of the two new large retail centers in Roseville. These retail centers will also address a shortage in eating and drinking places. However, in Tables C-6A and C-6B, there appears to be ample opportunity for Loomis to retain sales from its residents and capture sales from the rural area around Loomis in several retail categories. For example, specialty or niche apparel stores that will not compete directly with new stores in the Regional Mall may flourish now and in the future. Sales of general merchandise offered by a store such as Target or K-Mart, which often competes head-to-head with Wal-Mart, may be captured in the near term as the local market expands. It appears that demand will exist shortly for another supermarket and drug store. More restaurants and service stations could be supported by the Loomis area. Finally, additional stores in the category of other retail, which includes a wide variety of retail goods and services as shown in Table C-7, could be supported as well.
Loomis Retail Trade Areas Town of Loomis retail establishments operate in a unique environment that includes a vast retail marketplace. Cities to the west, including Rocklin and Roseville, have both substantial purchasing power and community-serving retail centers to satisfy that need. However, areas to the east and south do not have the same level of access to shopping as the cities to the west. Consequently, the Town’s retail trade areas are estimated to include the following: The Primary Trade Area is the Town of Loomis. The Secondary Trade Area is the Loomis Basin area south of the freeway. This is an area immediately
outside the Loomis Town limits, bounded by Highway 193 to the north, Sierra College Blvd to the west, Auburn Folsom Road to the east, and Cavitt Stallman Road to the south. This area includes Penryn but excludes Newcastle.
The Tertiary Trade Area includes the Granite Bay area. Loomis can be reached quickly via Laird Road and Horseshoe Bar Road from various points in Granite Bay; however, shoppers in Granite Bay may choose to travel to Roseville and Folsom as well.
Finally, new development areas of Lincoln and Rocklin will have immediate access to Loomis retail centers on the west side of town as they commute to and from work. It is anticipated that Loomis will capture a share of retail expenditures made by these commuters, as well as by those living on the eastern sides of those cities.
The capture rate assumptions for these areas, together with other retail assumptions, are provided in Table D-1 of Appendix D. The capture rate assumptions are summarized in Table 6-1. The two categories of retail shopping are described below: Neighborhood Retail: Neighborhood shopping
centers generally provide convenience goods and personal services. These goods and services are purchased relatively frequently and at the most convenient location without much comparison shopping. Typical items include food, medication, hardware, dry cleaning, barber and beauty services, and shoe repair services. A neighborhood center is a small shopping center, generally ranging from 75,000 to 125,000 square feet of retail space.
Other Retail: Community, regional, and other shopping centers provide goods and services that are
bought after some degree of deliberation, on a less frequent basis than those provided by neighborhood centers, and that are somewhat specialized in nature. The products purchased at these other centers typically last longer than those from neighborhood centers and are differentiated by brand identification,

Section 6. Market Analysis August 1998
96
Table 6-2: SACOG Employment Projections
SACOG
Employment Category
1995
Employment
2020
Projection Retail 518 1,783Office 181 1,018
Medical 55 150Education 282 352
Manufacturing 11 202Other* 695 1,483Total 1,742 4,988
* Other employment includes jobs in: construction; transportation, communications, and utilities; wholesale trade; hotels/motels; personal, business, and legal services; automotive and miscellaneous repair; engineering, accounting, R&D, and related services; City, County, and other government services.
retailer image, and shopping area ambience. Typical items include apparel, household furnishings, and specialty items like jewelry, cameras, and books. Other retail centers in smaller areas like Loomis range in size from 200,000 to 300,000 square feet of retail space.
It is assumed that Loomis will capture 100 percent of neighborhood shopping demand generated by Loomis residents. Naturally, some residents who work outside the area will conduct some of their neighborhood shopping (including lunches, trips to the dry cleaners, etc.) in the area of their workplace, but workers who commute to Loomis will do the same and some commuters will stop to purchase these types of goods and services rather than do it at home. In terms of other retail shopping demand, the percentages shown in the capture rate table on the previous page are typical for the size and composition of each Loomis trade area. For example, while local shoppers will take advantage of their proximity to community-serving retail centers in Loomis to meet the majority of their community shopping needs, these shoppers are likely to make trips to outlet centers, power retail centers, various upscale centers, and other shopping areas in Roseville, Rocklin, and even Auburn. The farther shoppers in the secondary and tertiary trade areas are from Loomis and the closer they are to other shopping locations, the less likely they are to frequent Loomis shopping centers. This accounts for the declining capture rates from primary to tertiary trade areas. Capture rates for the other trade areas rely exclusively on pass-by traffic.
New Retail Acres in Loomis As Table D-2 illustrates, a total of 44 new retail acres are projected to be required to meet new retail demand in Loomis from 1998 through 2020. Through the year 2020, nine new neighborhood retail acres, or approximately one average-sized or two small neighborhood shopping centers, are projected to be required in Loomis. Another 35 acres of other commercial is estimated to be required as well.
Loomis Office & Industrial Absorption Analysis Background Office absorption in the region during the period 1990-1995 was particularly weak. However, planning areas with office land supply have been experiencing significantly more growth since 1995 due largely to latent demand from the recession of the early 1990s. Office absorption is expected to be stronger in the near term. While the office market is extremely strong in the Roseville/Rocklin area, it is just the opposite in the Auburn area. The addition of the new DeWitt Center has driven the market down in the Auburn area, and it is expected that the market there will continue to erode somewhat and remain weak for the next five years. In general, small Class B office space is not performing well, while Class A office space is typically full. Office space in Loomis is scattered in various places, but is predominantly located downtown, along Taylor Road, and along Horseshoe Bar Road leading into downtown. Planning areas with industrial land supply have also been experiencing substantially more growth since 1995. Continuing strong demand and available supply of highly desirable industrial sites suggest that higher levels of absorption will be realized in the near term. Vacancy rates of 1.5 percent currently exist in the Roseville/Rocklin area. There is a fundamental shortage of light industrial space along the I-80 corridor, and the Loomis area could capitalize on this condition. The primary
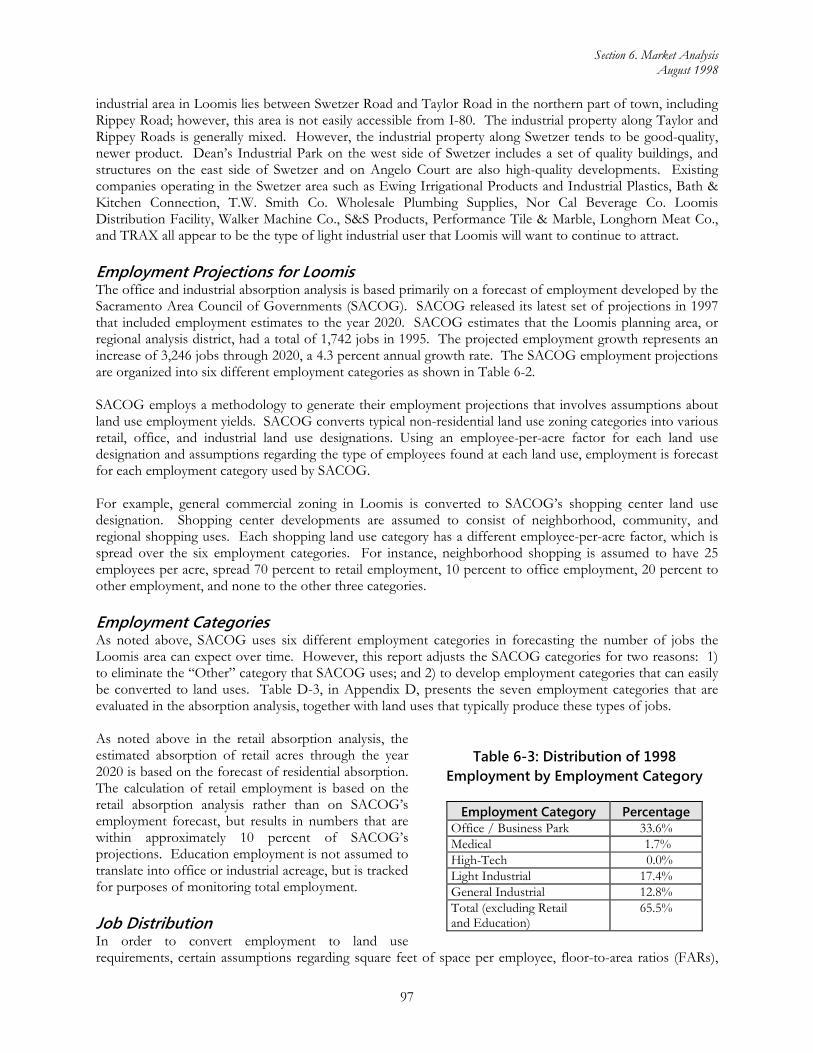
Section 6. Market Analysis August 1998
97
Table 6-3: Distribution of 1998 Employment by Employment Category
Employment Category Percentage
Office / Business Park 33.6%Medical 1.7%High-Tech 0.0%Light Industrial 17.4%General Industrial 12.8%Total (excluding Retail and Education)
65.5%
industrial area in Loomis lies between Swetzer Road and Taylor Road in the northern part of town, including Rippey Road; however, this area is not easily accessible from I-80. The industrial property along Taylor and Rippey Roads is generally mixed. However, the industrial property along Swetzer tends to be good-quality, newer product. Dean’s Industrial Park on the west side of Swetzer includes a set of quality buildings, and structures on the east side of Swetzer and on Angelo Court are also high-quality developments. Existing companies operating in the Swetzer area such as Ewing Irrigational Products and Industrial Plastics, Bath & Kitchen Connection, T.W. Smith Co. Wholesale Plumbing Supplies, Nor Cal Beverage Co. Loomis Distribution Facility, Walker Machine Co., S&S Products, Performance Tile & Marble, Longhorn Meat Co., and TRAX all appear to be the type of light industrial user that Loomis will want to continue to attract.
Employment Projections for Loomis The office and industrial absorption analysis is based primarily on a forecast of employment developed by the Sacramento Area Council of Governments (SACOG). SACOG released its latest set of projections in 1997 that included employment estimates to the year 2020. SACOG estimates that the Loomis planning area, or regional analysis district, had a total of 1,742 jobs in 1995. The projected employment growth represents an increase of 3,246 jobs through 2020, a 4.3 percent annual growth rate. The SACOG employment projections are organized into six different employment categories as shown in Table 6-2. SACOG employs a methodology to generate their employment projections that involves assumptions about land use employment yields. SACOG converts typical non-residential land use zoning categories into various retail, office, and industrial land use designations. Using an employee-per-acre factor for each land use designation and assumptions regarding the type of employees found at each land use, employment is forecast for each employment category used by SACOG. For example, general commercial zoning in Loomis is converted to SACOG’s shopping center land use designation. Shopping center developments are assumed to consist of neighborhood, community, and regional shopping uses. Each shopping land use category has a different employee-per-acre factor, which is spread over the six employment categories. For instance, neighborhood shopping is assumed to have 25 employees per acre, spread 70 percent to retail employment, 10 percent to office employment, 20 percent to other employment, and none to the other three categories.
Employment Categories As noted above, SACOG uses six different employment categories in forecasting the number of jobs the Loomis area can expect over time. However, this report adjusts the SACOG categories for two reasons: 1) to eliminate the “Other” category that SACOG uses; and 2) to develop employment categories that can easily be converted to land uses. Table D-3, in Appendix D, presents the seven employment categories that are evaluated in the absorption analysis, together with land uses that typically produce these types of jobs. As noted above in the retail absorption analysis, the estimated absorption of retail acres through the year 2020 is based on the forecast of residential absorption. The calculation of retail employment is based on the retail absorption analysis rather than on SACOG’s employment forecast, but results in numbers that are within approximately 10 percent of SACOG’s projections. Education employment is not assumed to translate into office or industrial acreage, but is tracked for purposes of monitoring total employment.
Job Distribution In order to convert employment to land use requirements, certain assumptions regarding square feet of space per employee, floor-to-area ratios (FARs),

Section 6. Market Analysis August 1998
98
Table 6-4: Distribution of Employment in 1998 vs. 2020
Employment
Category 1998
Employment 2020
Projection Retail 17.7% 32.1%Education 16.8% 8.1%Office/Business Park 33.6% 26.9%Medical 1.7% 2.6%High-Tech 0.0% 2.9%Light Industrial 17.4% 18.7%General Industrial 12.8% 8.6%Total 100 0% 100 0%
and vacancy rates were made. These three assumptions, taken together, translate into a factor for jobs per acre, which is used to convert employment to acreage. The assumptions for each employment category are presented in Table D-4. These assumptions are industry standards—modified somewhat to account for job densities experienced in Loomis—and are similar to those used by SACOG. It was noted earlier that approximately 1,742 jobs existed in the Loomis area in 1995. Table 6-3 shows the distribution of jobs in 1998 in the Town by employment category, excluding the jobs that are estimated to exist in the Loomis area but outside the Town limits. Data provided by National Decision Systems provided the information required to estimate the types and quantities of jobs located inside city limits. The office and industrial employment categories are shown in Table D-4.
New Office and Industrial Acres in Loomis As Table D-5 illustrates, a total of 61 acres of new office/business park and industrial are projected to absorb in Loomis from 1998 through 2020. As noted above, demand for new office and industrial acres is based on employment growth, which is grouped into seven employment categories in this report. SACOG’s projection of total employment growth for the Loomis area, modified to reflect just the Town of Loomis, is presented in the top line of Table D-5. The distribution of that growth into seven categories is determined as follows: Retail employment as a percentage of total employment is based on the retail absorption analysis and
shown in Table D-2. Education and medical jobs are taken directly from SACOG’s forecast, adjusted to reflect only the Town.
High-tech employment as a percentage of total employment is assumed to increase over time to reflect Placer County’s and the Town’s emphasis on recruiting and attracting such firms as part of its economic development program. As Table D-5 shows, high-tech employment still represents a very small percentage of total employment at 2.9 percent by the year 2020.
General industrial employment as a percentage of total employment is assumed to decrease slightly over time, owing to the transition occurring in the town away from general and heavy industrial to light industrial land uses.
After the above assumptions are factored into the distribution of employment, the percentages of office/business park and light industrial employment remain. Office/business park employment is assumed to decline as a percentage of total employment. With the completion of the new space at Taylor Circle Center (reflected in the high percentage of new office/business park jobs through the year 2000) and the eroding office market in Auburn, it appears that office/business park job growth will be slower than the growth experienced in the light industrial market. It is assumed that office/business park employment increases will primarily serve growth in housing and other non-residential businesses. Light industrial employment is assumed to continue to increase as it has in the past as Loomis capitalizes on its I-80 location and the constrained industrial market. The distribution of employment into seven categories, comparing 1998 employment to that projected for 2020, is presented in Table 6-4.
Table D-5 shows the results of the distribution assumptions. As noted earlier in Table D-4, office/business park employment growth is estimated to absorb into other commercial areas (25 percent) and business park areas (75 percent). Medical employment is assumed to relate strictly to other commercial land uses and high-tech employment is assumed to relate to business park land uses. Light industrial and general industrial employment are separated into their respective industrial categories. Therefore, employment projections translate into demand for the following four land use categories:

Section 6. Market Analysis August 1998
99
Other Commercial Business Park Light Industrial General Industrial Table D-5 presents how many business park and industrial acres will be demanded over time, as well as how many other commercial acres will be required to meet office-related demand in addition to retail-related demand discussed above in the retail absorption analysis. Office and industrial demand is expected to increase after the year 2000 to a level of approximately 15 acres every five years and remain relatively constant through the year 2020.
Findings & Conclusions North Loomis Within the larger western Placer County area, new development has followed a specific path along major transportation routes. This pattern is expected to continue based on the planning areas that are in various stages of the land development and entitlement process. The pattern that takes shape is a rectangle formed by I-80, Hwy 65, Hwy 193, and Sierra College Blvd with Roseville at the southwest corner where I-80 and Hwy 65 intersect. Figure 6-1, a map of western Placer County, depicts this rectangle. At the base of the rectangle is Roseville. Moving north along Hwy 65 on the southwest side of the highway, future developments in Roseville include the Regional Mall, the Highlands Reserve planning area, and the North Industrial Area. The City of Roseville is also processing the Olympus Point planning area just south of the I-80/Hwy 65 interchange. The Highland planning area in Rocklin is north and east of Olympus Point and south of Sierra College and the existing City of Rocklin, near Sierra College Blvd on the southeast side of I-80. The City of Rocklin sits generally inside and toward the southern end of the rectangle. On the west side, between Hwy 65 and Sunset Blvd, is the Sunset West planning area. On the east side, moving in a northeastern direction toward Sierra College Blvd and the Town of Loomis, are the Stanford Ranch, Whitney Oaks, and Clover Valley planning areas. Clover Valley is adjacent to the northwest portion of Loomis town limits. Moving north along Hwy 65, between Rocklin and Lincoln in Placer County, are the Sunset Industrial Area and Sunset Ranchos planning areas. Continuing north along Hwy 65, but prior to reaching the downtown area of Lincoln, are the Twelve Bridges, Del Webb, and Lincoln Crossing planning areas within the city limits of Lincoln. Twelve Bridges, including the Twelve Bridges Golf Course, actually extends easterly across the rectangle almost all the way to Sierra College Blvd. At the northeast portion of the rectangle near Hwy 193 and Sierra College Blvd is the Bickford Ranch planning area in Placer County. These planning areas and proposed projects represent tens of thousands of future homes and thousands of acres of commercial and industrial development. The only area of the rectangle not slated for new development is wedged between the Clover Valley planning area to the north and the Highlands planning area to the south along Sierra College Blvd. This area consists of existing development in Rocklin, Sierra College, and a significant undeveloped portion of Loomis. That portion of Loomis extends from approximately one half mile north of King Road down to one half mile south of Taylor Road. The stretch of Sierra College Blvd that traverses this portion of Loomis is approximately two miles long. Sierra College Blvd is a major thoroughfare connecting I-80 with Hwy 193 to the north, crossing Douglas Blvd in the Roseville/Granite Bay area to the south, and ultimately leading further south into Sacramento suburbs as Hazel Avenue. The portion of Sierra College Blvd heading north from its interchange at I-80 will

Section 6. Market Analysis August 1998
100
likely be used heavily as one of the routes commuters take to and from new developments north of Loomis in Whitney Oaks, Clover Valley, Twelve Bridges, and Bickford Ranch. In fact, these planning areas require road widening projects that will add lanes to Sierra College Blvd. If not for what will probably be a shorter commute and less congestion as compared to Hwy 65, commuters from these areas may want to use Sierra College Blvd for its panoramic vistas to the south and east, including spectacular views of snow-capped mountains in the Sierra Nevada. Loomis, positioned directly in the path of new growth, could participate in rather than ignore the growth planned to occur around it over the next five to 20 years. There are several reasons why commercial development on Sierra College Blvd may be successful, including the following: 1. Just as retail centers on Douglas Blvd capture commuters from Granite Bay and those on Auburn
Folsom Road capture travelers heading north toward Auburn or south toward Folsom, new retail centers on Sierra College Blvd could be developed to meet some of the shopping needs of commuters heading to and from areas to the north of Loomis.
2. Possibly two centers could be developed, one each at the Sierra College Blvd intersections with Taylor Road (or Brace Road) and King Road. This would allow development of higher density residential areas around the centers to transition to lower density residential areas (such as Shadowbrook) and serve as a buffer between the retail centers and the existing rural residential areas. The new residential development would also provide additional support for the new retail centers so that they could draw from both a local and commuter population. Another form of compatible and transitional land use could be high-tech/R&D office space, which could be located, for example, on the parcels adjacent to the Union Pacific Railroad line paralleling Taylor Road and behind the Loomis Basin Veterinary Clinic off Sierra College Blvd.
3. Commercial development in this area would also allow a significant amount of growth in Loomis to be contained in the area north of I-80. This would be consistent with existing Town patterns of growth as well as development trends along the I-80 corridor.
4. Commercial development in this area could better attract the Sierra College student market due to the easier access and shorter distance. It may also attract portions of the existing population base in eastern Rocklin.
5. If the new retail centers on Sierra College Boulevard are designed to both attract commuters and minimize competitive overlap with downtown merchants, these commuters may ultimately discover the Loomis downtown as a refreshing alternative to the sometimes sterile retail environment of the brand new developments where they live. Retail centers on Sierra College Boulevard with a strong commuter draw may, in fact, present an opportunity for downtown merchants to capitalize on the expanded shopper base that would be attracted to Loomis.
Horseshoe Bar/I-80 Commercial Regional and national retail chains rather than small independent specialty retail and dining establishments must be attracted to the Horseshoe Bar/I-80 project to complement, rather than cannibalize, existing and potentially new retail shopping in areas of Loomis north of I-80. Based in part on the increasing demand for housing in the area, a combination of land uses at the Horseshoe Bar/I-80 project best suited to respond to changing market dynamics over the long term might include those recommended by BAE and others as follows: 1. Big box discount retailers such as Wal-Mart already exist in Rocklin and Roseville, and are being
proposed in the Auburn area. The proposed Regional Mall and nearby Creekside Center in Roseville will meet regional demand for high-fashion, high-quality comparison shopping. However, while a factory outlet center already exists in Folsom, it is not easily accessible from points along the I-80 corridor. As the population base along the I-80 corridor expands with the development of new planning areas, a market for a centrally-located outlet center may emerge. This type of retail development may also attract the tourist driving to and from the Lake Tahoe area.

Section 6. Market Analysis August 1998
101
2. Office and light industrial uses in a campus-style, business park setting could be developed. These uses would generate new employees and create a market to patronize local stores and restaurants, as well as retail shops developed in Turtle Island, during the day while residents are away at their place of employment. In fact, these types of land uses may allow more Loomis residents to work in Town, fostering more of a local balance between jobs and housing.
3. Lodging uses could be supported by the growth in office and industrial development both in Turtle Island and in surrounding planning areas. Also, entertainment uses such as a multiplex cinema may be suitable, again, as the surrounding planning areas build out.
4. The demand for housing is undeniable, and Turtle Island could incorporate housing into its development to both meet a market need and expand the local population base to support businesses in Turtle Island and in areas of Loomis north of I-80.
South Loomis With the majority of non-residential development likely to be directed to the area of Loomis north of I-80 or to Turtle Island, there does not appear to be a need to plan for this type of development in the other areas south of I-80. The Turtle Island project, located along I-80 with immediate freeway access via Horseshoe Bar Road, would be a likely candidate for additional non-residential development in Loomis and would allow for a transition to lower intensity uses both to the north and south of the project. In addition, if new residential demand can be met primarily in the north area and the open space feel along the Sierra College Boulevard corridor preserved, the south area could also maintain its existing character and involve predominantly rural residential developments such as Loomis Hills.
Summary The non-residential absorption estimates relate to employment growth in the town, which is expected to be strong during the approximately 20-year timeframe of the analysis. Total employment is expected to increase by 2,582 in the Town of Loomis over the next 20 years, a 4.3 percent compounded annual growth rate. Retail employment is expected to grow at the fastest rate—approximately 7.2 percent per year. High-tech and light industrial employment, combined, is anticipated to grow at a rate of 5.4 percent per year. The high growth rates in these two areas reflect the following major assumptions: Given the large retail sales leakage, the opportunity to serve an area larger than its city limits, and the
possibility of capturing sales from commuters heading north from I-80, Loomis may be able to facilitate a significant amount of retail development.
The Town will achieve many of the goals articulated in its Economic Development Plan. These include revitalization of downtown and attraction of clean, high-wage industries such as high-tech uses or light industrial uses currently located on Swetzer Road.
A total of 2,582 new jobs and an employment growth rate of 4.3 percent per year represent significant non-residential growth for Loomis. However, this non-residential growth can be put into context by relating it back to residential growth projected as part of the retail absorption analysis. Loomis is expected to experience a growth in housing units totaling 1,611 through 2020. With the number of employed residents per household increasing over time, Loomis households may include an average of 1.5 workers per household through 2020, resulting in 2,417 new workers. Therefore, the addition of jobs and workers over the next 20 years may be very similar. Housing affordability and other issues must be considered in fully analyzing a jobs/housing balance for an area, but this cursory analysis suggests that Loomis will experience relatively balanced growth through the year 2020. The analysis also reveals that Loomis is leaking a considerable amount of retail sales. All other areas in western Placer County are experiencing the same condition, except for the large capture of retail sales going on in Roseville. The Town should continue to experience this phenomenon through the year 2020 unless a substantial amount of new retail development occurs.

Section 6. Market Analysis August 1998
102
Table 6 of Appendix D summarizes the demand for commercial and industrial land uses through the year 2020. The major highlights from Table 6 include the following: Demand for neighborhood commercial land amounts to nine acres, and demand for other retail
commercial amounts to 35 acres. In total, these 44 acres represent approximately 42 percent of the total non-residential acreage expected to be absorbed through 2020.
Office demand that could be sited with commercial land uses accounts for another six acres, bringing the total estimated demand for commercial space other than neighborhood commercial to 41 acres.
Demand for light industrial space, approximately 31 acres, accounts for 51 percent of the office and industrial demand. A total of 17 acres may be needed to accommodate office demand in business park uses.
A total of 105 acres are projected to be needed to satisfy the demand for retail, office, and industrial space in Loomis through the year 2020.
The Town’s emphasis on economic development planning, implementation, and communication should prove helpful in ultimately reversing the Town’s image as a no-growth jurisdiction to one of pro-business within a responsible-growth framework. Aggressively adopting a commercial and industrial marketing program, a business retention and recruitment program, a civic beautification program, and other measures outlined in the Loomis Downtown Economic Development Program Handbook and created in an updated economic development element will help the Town to achieve its goals. A Business Improvement District (BID) was formed to serve the majority of the commercial areas in Town, but lasted only one year until it was disestablished by the merchants in December 1996. As a successor effort, a group of residents and business owners in Town formed a non-profit Community Based Organization to develop a Main Street program that will perform some of the functions envisioned for the BID. In addition, the Town has submitted a grant application for $500,000 in CDBG funds to loan to a developer revitalizing one of the fruit sheds. The Town will administer the loan and, as the original loan is repaid, a revolving loan will be established to fund other endeavors in the downtown area. These efforts need to continue, and further planning to attract the required types of retail, office, and industrial development needs to be undertaken. Finally, the Town must develop and implement a strategy to overcome its primary infrastructure problems of drainage and circulation/parking; plans to accomplish these tasks appear to be underway.

Section 7. Safety & Noise Issues August 1998
103
Section 7. Safety & Noise Issues
Introduction
Hazards Overview Jurisdictions planning for future urban growth must consider a wide range of public safety issues. Safety hazards can be natural in origin, such as seismic and geologic hazards, flooding, and wildland fire hazards. Others may be the result of natural hazards that are exacerbated by human activity and alteration of the natural environment, such as urban fires and development in sensitive areas such as floodplains and areas subject to erosion. Other hazards are manmade, including the introduction of hazardous materials. Many of these hazards can be avoided through careful planning and site design. This chapter inventories and assesses the major hazards confronting Loomis, including seismic and geologic hazards, wildland and urban fires, flooding, and hazardous materials incidents. This section also assesses the noise environment of Loomis, which contributes to the health and safety of the community.
Critical Facilities Critical facilities are those that must remain operational after an emergency event, in order for the community to respond effectively. Examples of critical facilities include hospitals, fire stations, electrical power plants, and community facilities. Schools are often important staging and evacuation areas. There are relatively few critical facilities in Loomis; the nearest hospitals, for example, are in Roseville and Auburn. Figure 7-1 shows the location of critical facilities in Loomis.
Seismic & Geologic Hazards The information in this section provides a preliminary indication of the degree of potential risk associated with various seismic and geologic hazards. This assessment should be used as a general guide to indicate when further study may be needed. It should not be used as the sole basis for project approval or denial.
Regional Faulting The major fault systems in the region tend to occur along the interface between differing geologic materials. The nearest major fault system near Loomis is the Foothills Fault System, which traverses Amador, El Dorado, and Placer counties in a path more than 350 kilometers long and several kilometers wide. Two segments of this system are relatively close to Loomis: the segment of the Bear Mountain Fault Zone (Spenceville Fault) between Folsom and Auburn, and the Melones Fault Zone, about 15 miles to the east.

Section 7. Safety & Noise Issues August 1998
104
Figure 7-1. Critical Facilities

Section 7. Safety & Noise Issues August 1998
105
No active faults are known to exist in Placer County, and no Alquist-Priolo Special Studies Zones are designated in the County. The nearest known active fault that has been mapped by the Dunnigan Hills Fault, well to the northwest of the City across the Central Valley. However, investigations performed for the proposed Auburn Dam indicate that the Foothill Fault System may be undergoing reactivation in the vicinity of Folsom Lake and may be capable of producing a magnitude 6.5 Richter Scale event (Woodward-Clyde Associates; Tierra Engineering). In 1975, a magnitude 5.7 earthquake was recorded on the Cleveland Hills Fault within the Foothill Fault System near Oroville, in a region thought at the time to be relatively free of seismic events of this severity. Consequently, even though the Bear Mountain and Melones faults have not ruptured in the past 200 years, they are considered potentially active. The last seismic event recorded in the area with a magnitude of 4.0 or greater was in 1907, with an epicenter between Auburn and Folsom, possibly associated with the Bear Mountain Fault. Within the planning area, an inactive inferred fault was mapped across the area’s southern boundary (Livingston, 1974). The potential for seismic events originating from this fault is considered low (see Figure 3-2, Geology Map).
Seismic Hazards The underlying geologic foundation of the region is a relatively unbroken granitic batholith that extends along the Sierra Nevada. During seismic events, this material tends to react as a uniform block, which has the effect of reducing ground movement, acceleration, and the likelihood of ground rupture. Consequently, the California Division of Mines and Geology (CDMG) classifies the region as a low severity earthquake area. Typical seismic hazards include surface rupture, groundshaking, and various types of ground failure. The potential for these hazards to exist in the planning area is described below. Surface Rupture. Surface rupture during earthquakes is typically limited to those areas immediately adjacent to the fault on which the event is occurring. Because the planning area contains no active faults, so there are no Alquist-Priolo Earthquake Fault Zones delineated by the State Geologist and the likelihood of surface rupture in the area is considered low. Loomis is located in Seismic Zone 3 according to the 1997 Uniform Bldg Code, Fig. 16-2. Groundshaking The most serious direct earthquake hazard is the damage or collapse of buildings caused by groundshaking, which, in addition to property damage, can cause injury or death. Groundshaking is the vibration that radiates from the epicenter of an earthquake. The severity of groundshaking and its potential to cause damage to buildings is determined by several factors: The nature of the underlying soil and geology; The location of the epicenter of the earthquake; The duration and character of the ground motion; The structural characteristics of a building; and The quality of workmanship and materials used in buildings; Groundshaking is the primary seismic concern for Loomis. Portions of Loomis are located on alluvial deposits, which can increase the potential for groundshaking damage. As earthquake waves pass from more dense rock to less dense alluvial material, they tend to reduce velocity, but increase in amplitude. Ground motion lasts longer on loose, water-saturated materials than on solid rock. As a result, structures located on these types of materials may suffer greater damage. “Poor ground” can be a greater hazard for structures than close proximity to the fault or the earthquake’s epicenter. Figure 4-2 shows the geology of the area. The potential for groundshaking may be considered highest on the alluvial deposits along the creeks and ravines in the northern portion of Loomis.
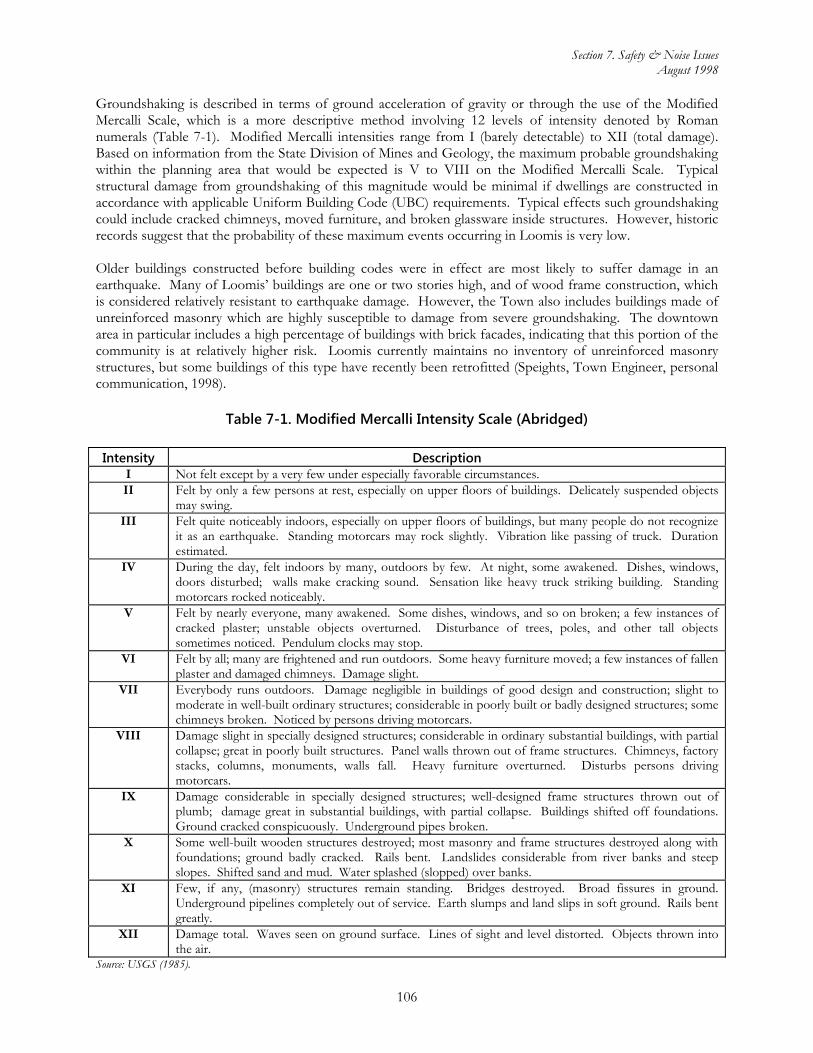
Section 7. Safety & Noise Issues August 1998
106
Groundshaking is described in terms of ground acceleration of gravity or through the use of the Modified Mercalli Scale, which is a more descriptive method involving 12 levels of intensity denoted by Roman numerals (Table 7-1). Modified Mercalli intensities range from I (barely detectable) to XII (total damage). Based on information from the State Division of Mines and Geology, the maximum probable groundshaking within the planning area that would be expected is V to VIII on the Modified Mercalli Scale. Typical structural damage from groundshaking of this magnitude would be minimal if dwellings are constructed in accordance with applicable Uniform Building Code (UBC) requirements. Typical effects such groundshaking could include cracked chimneys, moved furniture, and broken glassware inside structures. However, historic records suggest that the probability of these maximum events occurring in Loomis is very low. Older buildings constructed before building codes were in effect are most likely to suffer damage in an earthquake. Many of Loomis’ buildings are one or two stories high, and of wood frame construction, which is considered relatively resistant to earthquake damage. However, the Town also includes buildings made of unreinforced masonry which are highly susceptible to damage from severe groundshaking. The downtown area in particular includes a high percentage of buildings with brick facades, indicating that this portion of the community is at relatively higher risk. Loomis currently maintains no inventory of unreinforced masonry structures, but some buildings of this type have recently been retrofitted (Speights, Town Engineer, personal communication, 1998).
Table 7-1. Modified Mercalli Intensity Scale (Abridged)
Intensity Description I Not felt except by a very few under especially favorable circumstances.II Felt by only a few persons at rest, especially on upper floors of buildings. Delicately suspended objects
may swing. III Felt quite noticeably indoors, especially on upper floors of buildings, but many people do not recognize
it as an earthquake. Standing motorcars may rock slightly. Vibration like passing of truck. Duration estimated.
IV During the day, felt indoors by many, outdoors by few. At night, some awakened. Dishes, windows, doors disturbed; walls make cracking sound. Sensation like heavy truck striking building. Standing motorcars rocked noticeably.
V Felt by nearly everyone, many awakened. Some dishes, windows, and so on broken; a few instances of cracked plaster; unstable objects overturned. Disturbance of trees, poles, and other tall objects sometimes noticed. Pendulum clocks may stop.
VI Felt by all; many are frightened and run outdoors. Some heavy furniture moved; a few instances of fallen plaster and damaged chimneys. Damage slight.
VII Everybody runs outdoors. Damage negligible in buildings of good design and construction; slight to moderate in well-built ordinary structures; considerable in poorly built or badly designed structures; some chimneys broken. Noticed by persons driving motorcars.
VIII Damage slight in specially designed structures; considerable in ordinary substantial buildings, with partial collapse; great in poorly built structures. Panel walls thrown out of frame structures. Chimneys, factory stacks, columns, monuments, walls fall. Heavy furniture overturned. Disturbs persons driving motorcars.
IX Damage considerable in specially designed structures; well-designed frame structures thrown out of plumb; damage great in substantial buildings, with partial collapse. Buildings shifted off foundations. Ground cracked conspicuously. Underground pipes broken.
X Some well-built wooden structures destroyed; most masonry and frame structures destroyed along with foundations; ground badly cracked. Rails bent. Landslides considerable from river banks and steep slopes. Shifted sand and mud. Water splashed (slopped) over banks.
XI Few, if any, (masonry) structures remain standing. Bridges destroyed. Broad fissures in ground. Underground pipelines completely out of service. Earth slumps and land slips in soft ground. Rails bent greatly.
XII Damage total. Waves seen on ground surface. Lines of sight and level distorted. Objects thrown into the air.
Source: USGS (1985).

Section 7. Safety & Noise Issues August 1998
107
Table 7-2. Modified Mercalli Intensity and Ground Motion
Perceived Shaking
Not Felt Weak Light Moderate Strong Very Strong
Severe Violent Extreme
Damage Potential
None None None Very Light Light Moderate
Moderate to Heavy Heavy
Very Heavy
Peak Acceleration ( g = gravity )
<0.0017g
0.0017g 0.014g
0.014g 0.039g
0.039g 0.092g
0.092g 0.18g
0.18g 0.34g
0.34g 0.65g
0.65g
1.24g > 1.24g
Peak Velocity
( cm/sec ) < 0.1
0.1 to 1.1
1.1 to 3.4
3.4 to 8.1
8.1 to16
16 to 31
31 to 60
60 to116
>116
Modified Mercalli Intensity
I II-III IV V VI
LoomisVII VIII IX X
Notes:
Design Basis Earthquake Ground Motion for “regular” commercial and residential structures. Defined in 1997 UBC §1627 as 10 percent chance of exceedance in 50 years, with a statistical return period of 475 years. For Town of Loomis: Peak Ground Acceleration, PGA = 0.14g Modified Mercalli Intensity, MMI = VI Upper-Bound Earthquake Ground Motion for public schools, hospitals, skilled nursing facilities, essential services buildings (such as, police stations, fire stations, town hall, emergency communication centers). Defined in 1998 CBC §1631A.2.6 as 10 percent chance of exceedance in 100 years, with a statistical return period of 949 years. For Town of Loomis: Peak Ground Acceleration, PGA = 0.17g Modified Mercalli Intensity, MMI = VI GIS site coordinates for Loomis Town Hall are measured from USGS Rocklin 7½-minute Quadrangle: Latitude: 38.820º North, and Longitude: 121.192º West. These ground motion values are appropriate for the entire Town of Loomis for these three reasons: the active earthquake faults (seismogenic sources) are relatively distant (55 to 120 km), the town is relatively compact in geographic extent, and the geologic subgrade of the town is entirely composed of granitic rock (quartz diorite).
Ground Failure In addition to structural damage caused by groundshaking, there are other ground effects caused by such shaking. These ground failure effects include liquefaction, subsidence, lurch cracking, and lateral spreading. The potential for these hazards to occur in Loomis is discussed below. Liquefaction Liquefaction in soils and sediments can occur during earthquake events, when material is temporarily transformed from a solid to a liquid (gelatinous) by increases in interpore pressure. Earthquake-induced liquefaction most often occurs in low-lying areas with soils composed of unconsolidated, saturated, clay-free sands and silts, but can also occur in dry, granular soils or saturated soils with some clay content. Liquefaction also occurs in areas overlain by unconsolidated fill, particularly artificial fill. The presence of several unconsolidated and saturated soils throughout the area indicates a moderate liquefaction potential, particularly on the alluvial soils found along the low-lying ravines and creeks (see Figure 3-2, Geology Map). There are no liquefaction Seismic Hazard Zones delineated.

Section 7. Safety & Noise Issues August 1998
108
Subsidence Subsidence is the compaction of soils and alluvium caused by groundshaking. It occurs irregularly and is largely a function of the underlying soils. Depending on the event, the amount of compaction can vary from a few inches to several feet. In Loomis, the potential for subsidence is greatest in areas underlain by alluvium or other soft water-saturated soils. However, no significant subsidence problems have been identified in the planning area. Lurch Cracking and Lateral Spreading Lurch cracking refers to fractures, cracks and fissures produced by groundshaking, and may occur far from an earthquake’s epicenter. Lateral spreading is the horizontal movement of soil toward an open face of a stream bank or the side of a levee. Steep-sided artificial fill embankments are most susceptible to damage. The potential for these hazards is greatest on steep-sided alluvial soils where the groundwater table is high. In Loomis, this would include areas adjacent to Antelope Creek, Secret Ravine, and Sucker Ravine.
Other Geologic Hazards Landslides Landslides may be triggered by oversaturated soils (after heavy rains) or by earthquakes. Landslide potential is highest in steeply-sloped areas, particularly those areas underlain with saturated and unconsolidated soil. The steepest slopes in Loomis are those west of Antelope Creek, just west of Sierra College Boulevard. Some slopes exceed 30 percent in this area. However, the underlying geology of the area is generally mehrten volcanics and granite, solid foundation materials not highly susceptible to landslides. The southeasternmost portion of the planning area also exhibits locally steep slopes (15-25 percent slopes are common). Again, the underlying materials are typically stable volcanics or granite, and landslide potential would be minimized to some extent. Most other portions of Loomis are relatively level or gently sloping, and thus not highly susceptible to landslides. There are no landslide Seismic Hazard Zones delineated. Erosion Soils in the planning area, some of which are on steep slopes and are loosely textured, generally exhibit moderate erosion potential, particularly when exposed on embankment faces and slopes. The effects of erosion range from nuisance problems, such as increased siltation in storm drains, to extreme cases where watercourses are downcut and gullies develop that can eventually undermine adjacent structures or vegetation. Seiche Seiches are earthquake-generated waves within enclosed or restricted bodies of water. However, because no sizable lakes or reservoirs are present in the planning area, there are no seiche hazards in the Town of Loomis.

Section 7. Safety & Noise Issues August 1998
109
Figure 7-1B. Regional Geologic Map
Source: Olmsted, F.H., 1971: U.S. Geological Survey Bulletin 1341 Concise legend of geologic units: Refer to USGS Bulletin 1341 for a complete lithologic description of each unit. Qs = alluvium; fluvial sediments (unconsolidated sand and gravel in Secret Ravine and Antelope Creek) Tfa = fragmental andesite = Mehrten Formation (andesitic conglomerate, sandstones, and breccias) Tg = gravel of Eocene age KJr = Rocklin pluton, principally trondhjemite, a variety of quartz diorite. KJpl = Penryn pluton, light-colored phase of quartz diorite KJpm = Penryn pluton, medium-colored phase of quartz diorite KJpd = Penryn pluton, dark-colored phase of quartz diorite gb = gabbro, a dark, deeply weathered plutonic rock composed principally of plagioclase & hornblende

Section 7. Safety & Noise Issues August 1998
110
Wildland & Urban Fire Hazards Loomis faces two types of fire hazards that threaten lives and property: urban and wildland fires. Wildland fires may also result in the loss of natural vegetation, loss of agricultural crops, and soil erosion. The threat posed by each type of fire hazard is described below.
Wildland Fires The outbreak and spread of wildland fires within the planning area is a potential danger, particularly during the dry summer and fall months. The buildup of understory brush, which under natural conditions would be periodically burned off, provides fuel to result in larger more intensive fires. Various factors contribute to the intensity and spread of wildland fires: humidity, wind speed and direction, vegetation type, the amount of vegetation (fuel), and topography. Most wildland fires are the result of arson or simple carelessness. The topography, climate, and vegetation of Loomis area are conducive to the spread of wildland fires. It contains extensive grasslands and oak woodlands in rolling terrain. The area is subject to hot, dry summers, with frequent wind gusts. Fortunately, prolonged summer heat spells often induce the delta breeze, a moist, cooling wind that temporarily reduces the high fire hazard condition common during that time of year. Although small grass fires are common in the planning area, they have historically been limited in size by prompt emergency response. No major wildland fires that threatened lives and property have been recorded in the Loomis area in recent years.
Urban Fires Urban fires are primarily those associated with structures and the activities in and around them. Most urban fires are caused by human activity. Over the years, development standards have become more stringent to reduce the frequency and severity of such events. Building codes now require fire walls for adjacent structures. Local ordinances often prohibit the use of fire-prone materials, such as shake-shingle roofs. Electrical standards have also changed to reduce fire risk inside structures. Smoke detectors are now commonly required. Urban fire hazards are greatest in areas containing older buildings that do not meet current building codes. Loomis contains many such structures, even though the Town requires that such buildings be brought up to code when made aware of such buildings. Many older homes (and barns) in the rural portions of the community still have substandard electrical fixtures and do not otherwise meet code. Utility facilities also present a potential urban fire hazard. Earthquakes or floods may rupture buried gas lines, while high winds or accidents could cause overhead electric lines to break. Either condition could result in a fire. Catastrophic earthquakes could cause widespread urban fires, as multiple gas and electrical lines could be broken or disrupted. However, the potential for earthquakes of this magnitude striking Loomis is low (see discussion of Seismic Hazards in this section). Once an urban fire starts, fast emergency response is critical to ensure that the fire does not spread. Urban fires by their nature occur in areas with a high density of human occupation and property. The threat to life and property is high. While Loomis has had urban fires, most have been small and easily contained. No catastrophic fires have been recorded in recent history, particularly since emergency response and building codes have been improved.

Section 7. Safety & Noise Issues August 1998
111
Flooding Hazards
Effects of Flooding Flooding can cause widespread damage to affected areas. Buildings and vehicles can be damaged or destroyed, while smaller objects can be buried in flood-deposited sediments. Floods can also cause drowning or isolation of people or animals. In addition, floodwaters can break utility lines, interrupting services and potentially affecting health and safety, particularly in the case of broken sewer or gas lines. The secondary effects of flooding are due to standing water, which can result in crop damage, septic tank failure, and water well contamination. Standing water can also damage roads, foundations, and electrical circuits.
FEMA 100-Year Flood Hazard Flooding has historically been a relatively minor hazard in the Loomis area, primarily due to its relatively elevated location within the Dry Creek watershed. The lower portions of the Dry Creek watershed have historically been hit hard by flooding, particularly in the Roseville area (where tributaries of Dry Creek converge) and in the flatlands in the Rio Linda area. The National Flood Insurance Study of the Federal Emergency Management Agency (FEMA) produced the Flood Insurance Rate Map (FIRM) for the Town in 1998. The map identifies special flood hazard areas in the community, focusing on areas that could be inundated in the event of a 100-year flood (which statistically has a 1 percent chance of occurring in any given year). The map shows the locations of 100-year and 500-year flood plains in the community, which are generally along Secret Ravine, Antelope Creek, Sucker Ravine, and their tributaries. Figure 7-2 shows the FEMA 100-year flood zone in the community.
Local Flooding Concerns Inadequately-sized culverts and bridges can create impediments to the passage of high water flow in streams and gullies. Undersized infrastructure typically result in short-term back-ups behind the culvert or bridge, with pooling water in such areas, in effect, an unintended detention basin. Areas of potential concern in Loomis could include culverts under Interstate 80; the Horseshoe Bar Road crossing over Secret Ravine; the railroad and Taylor Road crossing of Sucker Ravine; and various crossings of Antelope Creek and its tributaries at King Road and Sierra College Boulevard. Various culverts and storm drains throughout the Town are also subject to potential flooding in the event that they become clogged with debris during heavy rains. Locations which experienced flooding in 1986 and 1995 are listed in Table 7-2. The Town of Loomis Master Plan EIR identifies drainage problems associated with the culvert under the southbound freeway ramp of Interstate 80 into a poorly maintained swale near South Walnut Street. Other similar deficiencies are likely elsewhere, though none have been specifically identified in the available literature.
Dam Inundation Loomis is not in the dam inundation area for any major stream or river in the region. There are no dams or reservoirs (except small local detention facilities) upstream of Loomis on any tributary of Antelope Creek or Secret Ravine. Loomis is not subject to potential damage from dam inundation.

Section 7. Safety & Noise Issues August 1998
112
Table 7-3 Locations Experiencing Flooding - 1986 and 1995
Drainage Shed
Address Base Flood
Elevation
Finished Floor
Elevation
Comments
Sucker Ravine 3963 Stonegate Court 341.5 341Sucker Ravine 3987 Stonegate Court 341.5 341Sucker Ravine Humphrey Road 357.5 358Sucker Ravine Humphrey Road 357.5 359Sucker Ravine Humphrey Road 358 358Sucker Ravine Humphrey Road 358 356 House flooded 6” in ‘86 Sucker Ravine Humphrey Road 358 357Sucker Ravine Saunders 333 333Sucker Ravine 3867 Bankhead Road 322 322Sucker Ravine 3855 Bankhead Road 322 322Sucker Ravine 3847 Bankhead Road 322 323Sucker Ravine Sierra College Blvd. 322.5 Clinic flooded 2” in ’86; to door in ‘95Secret Ravine 3820 Oak Tree Lane 355 356 House flooded 4” in ‘86/’95 Secret Ravine 3880 Oak Tree Lane 355 356 Out buildings flooded in ‘86 Secret Ravine 3802 Oak Tree Lane 356 357 House flooded 8” in ‘86/’95 Secret Ravine 6460 Becker Drive 357 345 House flooded 36” in ’86; Improvements
reduced to 8” in ‘95 Secret Ravine 6280 Evans Road 354.7 356 Out buildings flooded, water to front
door Secret Ravine 3890 Oak Tree Lane 354.7 351 House flooded 2” in ‘86/’95 Secret Ravine 6125 Brace Road 336 334 House flooded 36” in ’86 - $100K
damages; 9” in ’95 - $80K damages Secret Ravine 6151 Brace Road 339 340 House flooded 12” in ’86; 9” in ‘95Secret Ravine Horseshoe Bar Road 354 354 House flooded 2” in ‘86 Secret Ravine Horseshoe Bar Road 346 345 House flooded to 18” in ’86/’95Secret Ravine Horseshoe Bar Road 346 347 Water to front porch in ‘95 Antelope Creek 3401 Opal Lane 339 339 Sandbagged to door in ‘86/’95Antelope Creek 3420 Opal Lane 335 336Antelope Creek 3460 Opal Lane 333.5 335Antelope Creek 3415 Opal Lane 337 337 Sandbagged to door ’95 in garageAntelope Creek 3423 Opal Lane 335 336Antelope Creek 3273 Barker Road 348 350Antelope Creek 343.5 344Antelope Creek 3538 Alpine Lane 326 326 House flooded 2” in ‘86 Antelope Creek 3647 Sierra College 319 320Antelope Creek 3994 Del Mar Avenue 293 293 Basement flooded 2” in ‘86 Secret Ravine 6495 Becker Drive 359 358 House flooded 2” in ‘86 Secret Ravine 6290 Horseshoe Bar
Road 347 348 House flooded 6” in 95; no info on ’86
(new owner) Antelope Creek 5230 No Name Lane 350 351 Out buildings flooded Antelope Creek 5260 No Name Lane 345 345Antelope Creek 5220 No Name Lane 346 347Secret Ravine 4303 Dias Lane 325 324 House flooded to 4’ in 86; 3’ in ‘95Secret Ravine 4223 Dias Lane 328 Garage flooded to 3’ in ’86; 18” in ‘95Secret Ravine 5901 Gade Lane 330 327 House flooded to 24” in ’95 and ‘86Sucker Ravine 3939 Stonegate Court 341.5 342Sucker Ravine 3943 Stonegate Court 341.5 342Sucker Ravine 3951 Stonegate Court 341.5 341Sucker Ravine 3955 Stonegate Court 341.5 341

Section 7. Safety & Noise Issues August 1998
113
Source: Psomas & Associates, 1998.
Figure 7-2. FEMA 100-Year Flood Plain

Section 7. Safety & Noise Issues August 1998
114
Hazardous Materials Hazardous materials are defined as those that are a potential threat to human health, having the capacity to cause serious illness or death. This section discusses the types of hazardous materials typically found in the planning area.
Household Products By far the most common hazardous materials are those found or used in the home. Waste oil is a common hazardous material that is often improperly disposed of and can contaminate surface water through runoff. Other household hazardous wastes (used paint, pesticides, cleaning products and other chemicals) are common and often improperly stored in garages and homes throughout the community. Because of their prevalence and proximity to residents, household products constitute the most pervasive health hazard facing residents of the community.
Mine Tailings Historic mining operations often left dredge tailings, or discarded rock and material, either near the mine site in the case of dredge or hardrock mining, or washed downstream as a result of upstream hydraulic mining. Dredge mining was common in the 19th century along the creeks in the Loomis area, and dredge tailings can still be found. Hydraulic operations have scarred hillsides in Loomis, one notable example being on the proposed Loomis Hills Estates development site, where a 60-foot high, 1,000-foot long cliff provides evidence of such operations (Town of Loomis, Sherwood Park Draft EIR, 1998). Mine tailings can be contaminated with mercury or cyanide, both of which are used in the process of gold refining. However, most gold was not refined in the immediate Loomis area and the potential for such contamination in dredge materials is considered low.
Agricultural Pesticide Use Loomis includes many agricultural operations. Orchards in particular are often sprayed with various pesticides, which can contaminate the soils. Denuded vegetation can suggest evidence for soil contamination. Potential contaminants can include DDT, lead and arsenic. In such areas, it is prudent to conduct soil testing (and conducting soil clean-up steps, if necessary) before allowing more intensive development.
Asbestos Asbestos is a highly crumbly material often found in older buildings, typically used as insulation in walls or ceilings. It was formerly popular as an insulating material because it had the desirable characteristic of being fire resistant. However, it can pose a health risk when very small particles become airborne. These dust-like particles can be easily inhaled, where their microscopically sharp structures can puncture tiny air sacs in the lungs, resulting in long-term health problems. Loomis contains many older structures with the potential to contain asbestos. Pre-1979 construction often included asbestos and it should be assumed that the demolition of older structures in the Town may present this hazard. Proper asbestos abatement and disposal procedures should be undertaken whenever the demolition of older structures is considered.
Hazardous Materials Transport The Union Pacific Railroad and Interstate 80 are major transcontinental transportation routes that pass through Loomis. Trains and trucks commonly carry a variety of hazardous materials, including gasoline and various crude oil derivatives, and other chemicals known to cause human health problems. When properly contained, these materials present no hazard to the community. But in the event of an accident or derailment, such materials may be released, either in liquid or gas form. In the case of some chemicals (such as chlorine), highly toxic fumes may be carried far from the accident site.

Section 7. Safety & Noise Issues August 1998
115
Although standard accident and hazardous materials recovery procedures are enforced by the state and followed by private transportation companies, the Town of Loomis is at relatively high risk because of its location along interstate rail and highway corridors.
Hazardous Waste Management Plan Counties are required by state law to prepare hazardous waste management plans. Placer County’s plan addresses the treatment, storage and disposal of such materials. The primary goal of the plan is to protect public health by promoting the safe use and disposal of hazardous waste. To accomplish this, the plan provides for the reduction of hazardous waste through source reduction, recycling, and on-site handling and treatment methods. Public education and community involvement are key features for achieving this goal.
Noise Sources & Standards The State Office of Planning and Research Noise Element Guidelines require that major noise sources be identified and quantified through the preparation of generalized noise contours for current and projected conditions. Significant noise sources in the Loomis area include traffic and railroad operations. Industrial operations are an additional, but less intrusive, noise source in Loomis. There are no airports in the area that could be a source of noise.
Overview of Noise & Sound Measurement Noise is usually defined as "unwanted sound." It consists of any sound that may produce physiological or psychological damage and/or interfere with communication, work, rest, recreation, and sleep. Sound intensity is measured in units called decibels (dB). When this basic unit is adjusted to correct for the relative frequency response of the human ear, the resulting unit is the "A-weighted" decibel (dBA). A-weighting de-emphasizes low frequencies to better correlate with the response of the human ear to sound. The zero on the dBA scale is based on the lowest sound level that the healthy, unimpaired human ear can detect. Unlike linear units (inches or pounds), the decibel scale is logarithmic. When measured on this scale, therefore, sound intensity increases or decreases exponentially with each decibel of change. While ten decibels is ten times more intense than one decibel, twenty decibels is one hundred times more intense and thirty decibels is a thousand times more intense. The decibel scale increases as the square of the change in sound pressure energy. A sound as soft as human breathing is about 10 times greater (10 dBA) than the faintest sound audible to the human ear (just above zero dBA). The decibel system of measuring sound provides us with a simplified relationship between the physical intensity of sound and its perceived loudness to the human ear. Because of the physical characteristics associated with noise transmission and reception, a doubling of noise energy normally results in about a 3 dBA increase in noise levels while a 10 dBA increase in noise level is generally required to perceive a doubling of noise. A 1 to 2 dBA change in ambient noise levels generally is not audible even to sensitive receptors. Sound levels corresponding to typical noise sources are provided in Table 7-3. The decibel level of a sound decreases exponentially as the distance from the source of that sound increases. For a single point source, sound level decays approximately six decibels for each doubling of distance from the source. Noise originating from a linear, or "line" source, such as a traffic or rail corridor, will typically decrease by about three decibels for each doubling of distance, provided the surrounding environment is "hard" (free from "soft," sound-absorbing objects such as vegetation). Noise from a line source in an environment that is relatively flat and well-vegetated will decrease by about 4.5 decibels for each doubling of distance.

Section 7. Safety & Noise Issues August 1998
116
Table 7-4: Relative Loudness
The time of day when a sound is emitted is an important factor in determining whether or not it is considered a nuisance. Sounds that may be barely noticeable at midday may be seriously disruptive at midnight. . A number of measurement scales that attempt to account for this time factor have been developed. Two of the more commonly used scales of this type are the Community Noise Equivalent Level (CNEL) and the day-night sound level (Ldn). The Ldn, which was developed by the Environmental Protection Agency, is a 24-hour average sound level in which a 10 dBA penalty is added to any sounds occurring between the hours of 10:00 pm and 7:00 a.m. The CNEL scale, which is used in California Airport Noise Regulations, is similar except that an additional 5 dBA penalty is added for the evening hours from 7:00 p.m. to 10:00 p.m.
Noise Compatibility Standards State and Federal Standards Figure 7-3 presents the California Department of Health, Office of Noise Control, noise compatibility guidelines for various land uses. The compatibility table illustrates the range of community noise exposure in terms of what is considered “normally acceptable,” “conditionally acceptable,” “normally unacceptable,” and “clearly unacceptable.” For the most sensitive uses, such as single family residences, 60 dBA Ldn is recommended as the maximum normally acceptable level, which is the level below which no special sound attenuation measures are required. These guidelines are recommended by the State to assist communities in

Section 7. Safety & Noise Issues August 1998
117
determining whether or not noise poses a conflict with land development. The following summarizes other pertinent federal and state noise guidelines:

Section 7. Safety & Noise Issues August 1998
118
Figure 7-3. Noise Land Use Compatibility Standards

Section 7. Safety & Noise Issues August 1998
119
Article 4 of the California Administrative Code (California Noise Insulation Standards, Title 25, Chapter 1) requires noise insulation in new hotels, motels, apartment houses, and dwellings other than single-family detached housing to provide an annual average noise level of no more than 45 dBA CNEL. When such structures are located within a 60 dBA CNEL (or greater) noise contour, an acoustical analysis is required to assure that interior levels do not exceed the 45 dBA CNEL annual threshold. The Federal Housing Administration establishes a 65 dBA Ldn standard for outdoor activity areas adjoining residential dwellings, and a 45 dBA Ldn standard for the interior of single family residences. If exterior levels are between the 65 dBA Ldn standard and 75 dBA Ldn, acoustical analysis is required to insure that the interior standard is met. Residential development is unacceptable where exterior noise levels exceed 75 dBA Ldn. Local Standards Loomis’ current noise element sets an exterior standard of 65 dBA Ldn and an interior standard of 45 dBA Ldn. This is less stringent than those provided in the State Guidelines. However, the Town’s current guidelines are consistent with the FHA standards described above. Placer County’s noise standards are more stringent than those adopted by Loomis and could provide a basis for noise guidelines for use within the planning area. These standards are summarized in Table 7-4.
Existing Noise Sources & Sound Levels Noise modeling techniques and measurements were used to develop generalized Ldn or Leq noise contours in the planning area for existing conditions. This method uses source-specific data including traffic mixture, speed limits and traffic volumes, all of which were obtained from either Caltrans, or Fehr & Peers Associates. The modeling methods used in this report follow recommendations made by the State Office of Noise Control. Noise contours along roadways were modeled using the Federal Highway Administration's Highway Traffic Noise Prediction Model (FHWA-RD-77-108, 1978), with California vehicle noise emission levels (CALVENO) developed by Caltrans.
Table 7-5: Maximum Allowable Noise Exposure: Transportation Noise Sources (Placer County)
Land Use Outdoor Activity Areas1 Interior Spaces
dBA Ldn dBA Ldn dBA Leq
Residential 60 45 -- Transient Lodging 60 45 -- Hospitals, Nursing Homes 60 45 -- Theaters, Auditoriums, Music Halls -- -- 35 Churches, Meeting Halls 60 -- 40 Office Buildings -- -- 45 Schools, Libraries, Museums -- -- 45 Playgrounds, Neighborhood Parks 70 -- --
1 Where the location of outdoor activity areas is unknown, the exterior noise levels standard shall be applied to the property line of the receiving land use. 2 Where it is not possible to reduce noise in outdoor activity areas to 60 dB Ldn/CNEL or less using a practical application of the best-available noise reduction measures, an exterior noise level of up to 65 dB Ldn/CNEL may be allowed provided that available exterior noise level reduction measures have been implemented and interior noise levels are in compliance with this table. The resulting noise contours (Figure 7-4) are based on average annual conditions. Local topography and intervening structures at specific locations would alter the contours, which should be considered generalizations. Table 7-5 shows the model results for the distance to the 60, 65 and 70 dBA Ldn contours associated with traffic on major roads traversing the Town.

Section 7. Safety & Noise Issues August 1998
120
Table 7-6 serves as a guide when applying traffic noise exposure contour information to areas with varying topography. The table is used by adding the correction factor to the predicted noise level for a given location. The factors included in this table present conservative (worst-case) results, and complex situations should be evaluated by an acoustical consultant when the potential for a significant noise impact exists. Roadways Roadway traffic is the primary source of noise in the Loomis community. Interstate 80 carries by far the most traffic through the area, and is consequently the major noise contributor. The 60 dBA Ldn contour from this roadway ranges from 1,650 to 1,750 feet from centerline. However, this distance is likely much less than modeled, because of topographic attenuation (see Table 7-6) and intervening buildings. Taylor Road and Sierra College Boulevard are the only other roadways in the Town that carry sufficient traffic to produce audible noise at a significant distance. The 60 dBA Ldn contour for these roads typically ranges from 200 to 400 feet, and less where there are intervening structures. Horseshoe Bar Road, King Road and Rocklin Road carry moderate traffic (4,000-5,000 ADT), but not sufficient to produce far-reaching noise contours. The noise model predicts that the 60 dBA Ldn contour would be less than 100 feet from the center of those roadways. Please refer to Figure 7-4 and Table 7-5 for more detailed information.
Table 7-6: Existing Traffic Noise Levels
Roadway Segment
Traffic (ADT)
Distance to CNEL Contour from Centerline (feet)
Measured Leq (dBA)*
70 dB 65 dB 60 dB Interstate 80 Sierra College Blvd to Horseshoe Bar Rd.
84,000 379 816 1,757 67.1
Interstate 80 Horseshoe Bar Rd. to Penryn exit
78,000 360 776 1,672 66.8
Sierra College Boulevard Interstate 80 to Taylor Road
12,300 84 181 390 62.1
Sierra College Boulevard Taylor Road to Bankhead Road
9,300 70 150 324 60.7
Sierra College Boulevard n/o King Road
6,100
53 113 244 59.3
Taylor Road e/o Sierra College Blvd.
10,500 58 126 271 61.0
Taylor Road s/o King Road
13,800 51 110 238 61.4
Horseshoe Bar Road Interstate 80 to Barton Road
5,300 N/A 40 86 54.2
King Road w/o Swetzer Court
5,300 N/A 40 86 56.1
Rocklin Road w/o Barton Road
4,500 N/A 36 77 54.1
Barton Road n/o Barton Road
1,700 N/A N/A 40 50.5
Laird Road s/o High Cliff Road
1,900 N/A N/A 44 52.7
Source: Traffic volumes from Caltrans and Fehr and Peers (1998). Note: * All measurements taken 50 feet from roadway centerlines, except for Interstate 80 (100 feet).

Section 7. Safety & Noise Issues August 1998
121
Table 7-7. Traffic Noise Adjustments for Topography
Topographic Situation
Distance from Roadway Centerline (feet) <200 200-400 >400
Hillside overlooks roadway no change +1 dB +3 dB Roadway Elevated (>15 feet) -5 dB -2 dB no changeRoadway in cut/below embankment -5 dB -5 dB -5 dB Dense vegetation (100 feet or more thick) -5 dB -5 dB -5 dB Source: Brown-Buntin Associates, Inc., 1994.
Union Pacific Railroad The Union Pacific Railroad operates two rail lines through the Town. The westbound rail line parallels Taylor Road, and cuts through the center of the community. The eastbound line travels northward, along the western edge of the planning area, about 1.5 miles west of downtown Loomis. Noise measurements were conducted on both lines to determine the contribution of freight and passenger rail operations to the noise environment. The goal of the noise measurements was to determine the typical sound exposure levels (SEL), accounting for travel speed, warning horns, locomotive noise, and other factors contributing to noise generation. The average SEL for the two observed freight trains was 108.7 dB at a distance of 100 feet from the track centerline; for the passenger trains, the average SEL was 94 dB. Measurements were taken for trains moving in both directions. Union Pacific officials could not release the precise number of daily trains that travel through Loomis, but estimated that about 12 to 15 trains is typical. This number is consistent with a 1996 Surface Transportation Board ruling that limits the number of trains passing through Reno, Nevada, to 15 as a condition of the recent Union Pacific/Southern Pacific merger (Mike Furtney, Union Pacific, 1998). For the purpose of this analysis, the worst case (15 trains) is assumed, evenly distributed between east and westbound freight. Amtrak operates two eastbound and two westbound passenger trains daily that pass through Loomis. All four passenger trains pass through the Town during the day or early evening. To determine the distance to noise contours, it is necessary to calculate the Ldn for typical rail operations. This is accomplished by using the recorded SEL values and the known number of trains. The Ldn may be calculated as follows:
Ldn = SEL + 10logN – 49.4 dB, where: SEL is the mean SEL of the event, N is the sum of the number of day and evening trains per day plus 10 times the number of nighttime (10 m to 7 am) trains per day, and 49.4 is ten times the logarithm of the number of seconds per day. Based on this information, the calculated noise contour distances from each rail line are shown in Table 7-7. These contours are depicted graphically in Figure 7-4.

Section 7. Safety & Noise Issues August 1998
122
Figure 7-4. Existing Noise Contours

Section 7. Safety & Noise Issues August 1998
123
Table 7-8: Approximate Distance to Railroad Noise Contours
Train Source
Ldn, at 100 feet
Distance to Ldn contour (feet) 70 65 60
Union Pacific (freight) 72.5 - - - Amtrak (passenger) 47.6 - - - Combined Ldn 72.5 147 316 681
Assumes 7.5 freight and 2 passenger trains in each direction daily. 1.5 freight and no passenger trains at night.
Stationary Noise Sources Industrial and commercial operations can be significant sources of noise, depending on the type and hours of operation. Stationary noise sources of concern typically include generators, pumps, air compressors, outdoor speakers, motors, heavy equipment and similar machinery. These are usually often associated with trucking companies, tire shops, auto mechanic shops, metal shops, shopping enters, drive-up windows, car washes, loading docks, gravel operations, athletic fields, and electric generating stations. Many facilities of this type exist in Loomis. However, none have been identified in the existing environmental documents on file with the Town as substantial noise sources causing significant public disruption. Existing or planned commercial/industrial operations may result in noise impacts when they are adjacent to noise sensitive land uses. Typical commercial and industrial noise sources include loading dock operations, parking lot activity, onsite equipment (including heating and air conditioning), and heavy truck idling. By far the most important of these noise sources is from heavy-duty trucks idling at a loading dock. Walker, Celano & Associates (1992) reported that individual trucks idling can produce sound levels in the 65-70 dBA range at 65-85 feet. Measurements reported by the PRA Group (Final EIR for North Broadway Commercial Center, Perspective Planning, 1995) indicated loading dock noise levels ranging from 54-68 dBA at a shielded location 120 feet from the source, to almost 75 dBA at 50 feet from a refrigerator truck (Bolt, Beranek and Newman, 1980). Individual trucks accelerating from depressed loading docks can produce instantaneous maximum sound levels of 85-90 dBA at 50 feet. A study by Brown-Buntin Associates assumed a 60 dBA Leq at a distance of 50 feet from the loading dock during a busy one-hour period (Turtle Island EIR, 1996). Currently, potential noise impacts of this type are most common near the Taylor Road corridor, where residential development often backs against commercial and industrial uses. Industrial parcels along Swetzer Court also back against homes along Kathy Way and Arcadia Avenue, resulting in similar noise impacts to residents in that area. On occasion, there have been complaints regarding excessive industrial-related noise, typically involving the use of heavy equipment or trucks during nighttime hours. Several new or pending developments in the Town have the potential to result in similar noise impacts to adjacent residential development. Turtle Island. The Turtle Island development south of Interstate 80 would include commercial uses
and a hotel, both of which would increase the amount of trucks and buses in the area. Loading dock operations would also contribute noise. The EIR for that project found that increased noise levels from these sources could impacts nearby residential uses on Horseshoe Bar Road and Betty Lane.
Specific Plan Development. Planned commercial development under the Town’s Specific Plan for the
area between Interstate 80, Horseshoe Bar Road, and King Road could result in similar noise impacts to existing housing along Laird Street (not to be confused with Laird Road) and Sun Knoll Drive.
Other Developments. There are several other large-sale developments proposed in the Town (Loomis
Hills Estates, Heritage Park, Shadowbrook), none of which would include industrial or commercial

Section 7. Safety & Noise Issues August 1998
124
components. Short-term construction noise would be an issue in all these areas, which are generally located in rural portions of the community.
Sensitive Receptors Noise exposure goals for various types of land uses reflect the varying noise sensitivities associated with those uses. Residences, hospitals, schools, guest lodging, libraries, churches and parks are most sensitive to noise intrusion and therefore have more stringent noise exposure targets than manufacturing or agricultural uses that are not subject to such impacts as sleep disturbance. The relative sensitivity of various land uses is illustrated in the state’s noise compatibility guidelines, shown previously in Figure 7-3.
Findings 7-1 The primary hazards facing the Town of Loomis include seismic and geologic hazards, wildland and
urban fires, flooding, and hazardous materials incidents. Noise is also an important public welfare issue in the community.
7-2 There are relatively few critical facilities in Loomis.
7-3 Although the potential for an earthquake is low, groundshaking from a distant earthquake can still cause damage to the area.
7-4 Seismically-induced liquefaction and subsidence can cause damage in Loomis, particularly in areas overlain by unconsolidated alluvium or fill.
7-5 The potential for landslides is relatively low.
7-6 While wildland fires are a potential threat because of the area’s extensive grasslands and woodlands, such fires have rarely occurred in the area.
7-7 Urban fires, while rare, are a particular threat to start and spread in older buildings that have not been brought up to modern building codes.
7-8 Flood hazards are most likely along areas adjacent to Antelope Creek or Secret Ravine, as well as behind culverts that have become temporarily clogged during a storm.
7-9 The most common hazardous materials found in the planning area are household products stored in private residences.
7-10 Other potentially hazardous materials found in the planning area include mine tailings, older buildings containing asbestos, and pesticides associated with agricultural uses.
7-11 Interstate 80 and the Union Pacific Railroad are major transportation routes that often carry hazardous materials in trucks or trains.
7-12 The primary noise sources in the planning area are rail and freeway traffic.
7-13 Much of Loomis north of Interstate 80 experiences noise levels in excess of 60 dBA Ldn, which may be considered excessive for sensitive receptors, including homes, parks, schools, and churches.
7-14 The Town should consider adopting more stringent noise standards to be consistent with Placer County and the State Guidelines.

Appendix A August 1998
125
Appendix A. References
Allen, B., R. Evett, B. Holzman, and A. Martin (1989). Report on Rangeland Cover Type Descriptions For California Hardwood Rangelands. California Department of Forestry and Fire Protection. Sacramento, CA. Block, W.M., M.L. Morrison, and J. Verner (1990). Wildlife and Oak-Woodland Interdependency. Fremontia 18(3): 72-76. California Department of Fish and Game (1994). Designated Endangered, Threatened or Rare Plants. Nongame-Heritage Program, Endangered Plant Project. Sacramento, CA. California Department of Fish and Game (1994). Endangered and Threatened Animals of California. Nongame-Heritage Program. Sacramento, CA. California Department of Fish and Game (1998). RareFind: A database application for the use of the California Department of Fish and Game's Natural Diversity Database. Sacramento, CA. California Division of Minerals and Geology (various). Personsal Communications, Robert H. Sydnor, Senior Engineering Geologist. Sacramento, CA. Cowardin, L.M., V. Carter, F.C. Golet, and E.T. LaRoe (1979). Classification of Wetlands and Deepwater Habitats of the United States. U.S. Department of the Interior, Fish and Wildlife Service, Office of Biological Services, FWS-OBS-79/31. Washington, D.C. Dahl, T.E. 1990. Wetland Losses in the United States 1780s to 1980s. U.S. Department of the Interior, Fish and Wildlife Service, Washington, D.C. Dames and Moore. 1995. Draft Environmental Impact Report, Comprehensive Land Use Element Update Project. Erman, D.C. and V.M. Hawthorne. 1976. The quantitative importance of an intermittent stream in spawning rainbow trout. Transactions of the American Fisheries Society 1976(6):675-681. Federal Emergency Management Agency (1998). Flood Insurance Rate Map (FIRM) panels 06061C-0481F, 0414F, 0412F, 0416F, and 0418F. Furtney, Mike. Union Pacific Railroad. Gerstung, E. 1965. 1964 fall-fun king salmon inventory on tributaries of the Natomas East Drain and Natomas Cross Canal. California Department of Fish and Game Memorandum to William O. White, Fisheries Manager II, dated May 25, 1965. Holland, R.F. (1986). Preliminary Descriptions of the Terrestrial Natural Communities of California. California Department of Fish and Game, Nongame Heritage Program. Sacramento, CA. Loomis, Town of (1997). Shadowbrook Recirculated Draft EIR. Prepared by ESA. Loomis, Town of (1998). Sherwood Park Draft EIR. Prepared by Harding Lawson Associates in association with Fugro/ENSR.

Appendix A August 1998
126
Loomis, Town of (1998). Heritage Park Estates Draft EIR. Prepared by CSW Associates. Loomis, Town of (1987). Loomis Oaks EIR. Prepared by R.C. Fuller Associates. Loomis, Town of (1988). Town of Loomis Specific Plan Area EIR. Prepared by Planning Concepts. Loomis, Town of (1996). Turtle Island EIR. Prepared by ESA. Loomis Union Elementary School District (1994). Draft EIR for a New K-8 Elementary School Site. Prepared by QUAD. Maslin, P., M. Lennox, J. Kindopp amd W. McKenney. 1997. Intermittent streams as rearing habitat for Sacramento River chinook salmon (Oncorhynchus tshawytcha). U.S. Fish and Wildlife Service Grant #14-48-0001-96724: 89 pp. Maslin, P. and W.R, McKenney. 1994. Tributary Rearing by Sacramento River Salmon and Steelhead. Unpublished Report, Department of Biology, California State University at Chico. Pavlik, B., P. Muick, S. Johnson, and M. Popper (1991). Oaks of California. Cachuma Press Inc. and California Oak Foundation. Los Olivos, CA. Placer County (1994). Placer County General Plan Update. Final Environmental Impact Report. Volume I. Placer County (1989). Final Environmental Impact Report, Granite Bay General Plan. Placer County (1989). Granite Bay Community Plan. Placer County (1993). Horseshoe Bar/Penryn Draft Community Plan EIR. Prepared by Jones & Stokes. Placer County (1975). Loomis Basin General Plan. Placer County (1975). Loomis Basin General Plan EIR. Placer County (1997). Site-Specific Statement for a Project Consistent with the Horseshoe Bar/Penryn Community Plan (Loomis Ranch Subdivision). Prepared by Jones & Stokes. Placer County Water Agency (1998). Water distribution maps, Books 25 and 30. Professional Archaeological Services (1988). Archaeological Survey of the Proposed Town of Loomis Specific Plan Area. Rollins, G. (1987). Department of Fish and Game Recommended Wetland Definition, Mitigation Strategies, and Habitat Value Assessment Methodology. California Department of Fish and Game, Environmental Services Division. Sacramento, CA. Skinner, M.W. and B.M. Pavlik. (1994). Inventory of Rare and Endangered Vascular Plants of California. California Native Plant Society Special Pub. No. 1, 5th Edition. Sacramento, CA. United States Geological Survey (1981). Rocklin 7.5-minute quadrangle. W.E.S. Technology (1992). Biological Assessment for Loomis Town Center Master Plan EIR.

Appendix A August 1998
127
Zeiner, D.C., W.F. Laudenslayer, Jr., and K.E. Mayer (1988). California's Wildlife, Volume I: Amphibians and Reptiles. California Statewide Wildlife Habitat Relationships System, California Department of Fish and Game. Sacramento, CA. Zeiner, D.C., W.F. Laudenslayer, Jr., and K.E. Mayer (1990). California's Wildlife, Volume II: Birds. California Statewide Wildlife Habitat Relationships System, California Department of Fish and Game. Sacramento, CA. Zeiner, D.C., W.F. Laudenslayer, Jr., and K.E. Mayer (1990). California's Wildlife, Volume III: Mammals. California Statewide Wildlife Habitat Relationships System, California Department of Fish and Game. Sacramento, CA.

Appendix A August 1998
128
References for Regional Plans and Policies Citations Crawford, Multari & Starr et. al. (1992). Placer County General Plan Update Draft General Plan Background Report Volume I. Boyle Engineering Corporation. 1987. Lower Zone 1 Treated Water supply Master Plan Draft Report. Prepared for Placer county Water Agency. CH2MHill. 1998. Evaluation of Regional Wastewater Treatment Options for Placer County. Prepared for Placer County. Granite Bay, Community of (1989). Granite Bay Community Plan adopted in 1989; amended 1996. Horseshoe Bar/Penryn, Community of (1994). Horseshoe Bar/Penryn Community Plan adopted in 1994; amended in 1996. Jones & Stokes Associates. 1994. Draft and Final Environmental Impact Report Horseshoe Bar/ Penryn Draft Community Plan. Loomis, Town of (1987). Town of Loomis General Plan. Rocklin, City of ( 1991). Rocklin General Plan adopted in 1991. Rocklin-Loomis Municipal Utility District (1986). Rocklin- Loomis Municipal Utility District 1986 Sewer Master Plan. Prepared by Harris & Associates. Personal Communications Robbin Burnes, Information Specialist. Sierra Planning Organization- telephone, fax. Dave Campbell, Placer County Water Agency – telephone Nancy Cave, Sacramento Council of Governments - telephone. Loren Clark, Planner Placer County Planning Department; telephone conversation date: 7/22/98 Jim Durfee, Solid Waste Division Acting Manager. Placer County Department of Facility Services, Solid Waste Division- telephone. Dennis Huff, District Engineer. Placer County Flood Control and Water Conservation District- telephone conversation, fax. Nancy Kays, Associate Transportation Planner, SACOG; telephone conversation; sent Metropolitan Transportation Plan (1996) date: 6/25/98 Kathy Kerdus, Director of Planning. Town of Loomis - telephone, fax.

Appendix A August 1998
129
John Miners, Certified Unified Program Agency (CUPA) Division Manager. Department of Health, Division of Environmental Health Services- telephone. Betty Riley, Executive Director Sierra Economic Development District; telephone conversation; sent MOU Agreement date: 7/21/98 Rich Stein, Engineer. South Placer Municipal Utility District - telephone. Hilary Straus, Town of Loomis- telephone, fax. Dave Vince, Placer County Air Pollution Control District - telephone, fax.

Appendix B Draft - August 1998
130
Appendix B. Public Workshop Results
The public participation process for the Loomis General Plan update includes several components, the first of which was a public workshop held on Saturday morning, June 6, 1998. The workshop provided attendees an opportunity to learn about the purposes of, and the process for the General Plan update, and also provided several opportunities to speak directly about planning and other community issues of importance to them as individuals. After some introductory discussion about the need for the General Plan update and the process being followed for the update, the workshop attendees were divided into eight smaller groups, each with a facilitator. Each group was then asked three key questions: "What do you like about Loomis?", "What do you not like about Loomis?", and "If you had total control and cost were no consideration, what would you change about Loomis?" The responses to these questions are summarized in the following tables. Numbers in parentheses indicate the number of groups which gave the same response.

Appendix B Draft - August 1998
131
Table B-1. Citizen "Likes" About Loomis
Category of Issue or Concern Group Responses Aesthetics & Design
Design No chrome or glass
Variety of buildings History Granite/hitching post Historic buildings History (historical places maintained) History/nostalgia Nature Beauty of area Boulders Charm Natural beauty Nature Rolling hills (2) Scenic views Serenity/natural environment Other Unique area
Community Character
Community Services
Community swimming in the summer
Fire protection is responsive
Reasonably good services Culture Arts/potential for arts Close to Sierra College (2) Live theater (2) Parades
Family Oriented
Family orientation
Place for kids Space for kids to grow Traditional values Friendly Familiarity w/neighbors/residents (4) Friendliness (4) Good people Neighbors Private Hidden, unknown community Privacy (2) Quiet Quiet (6) Peaceful Safe Feeling of safety (4) Low crime rate (4) Sense of
Community Community alternatives
Community participation Feeling of community (6) Spirit of place Small Town
Atmosphere Few people
Identity/ sense of being a "small town" No sidewalks
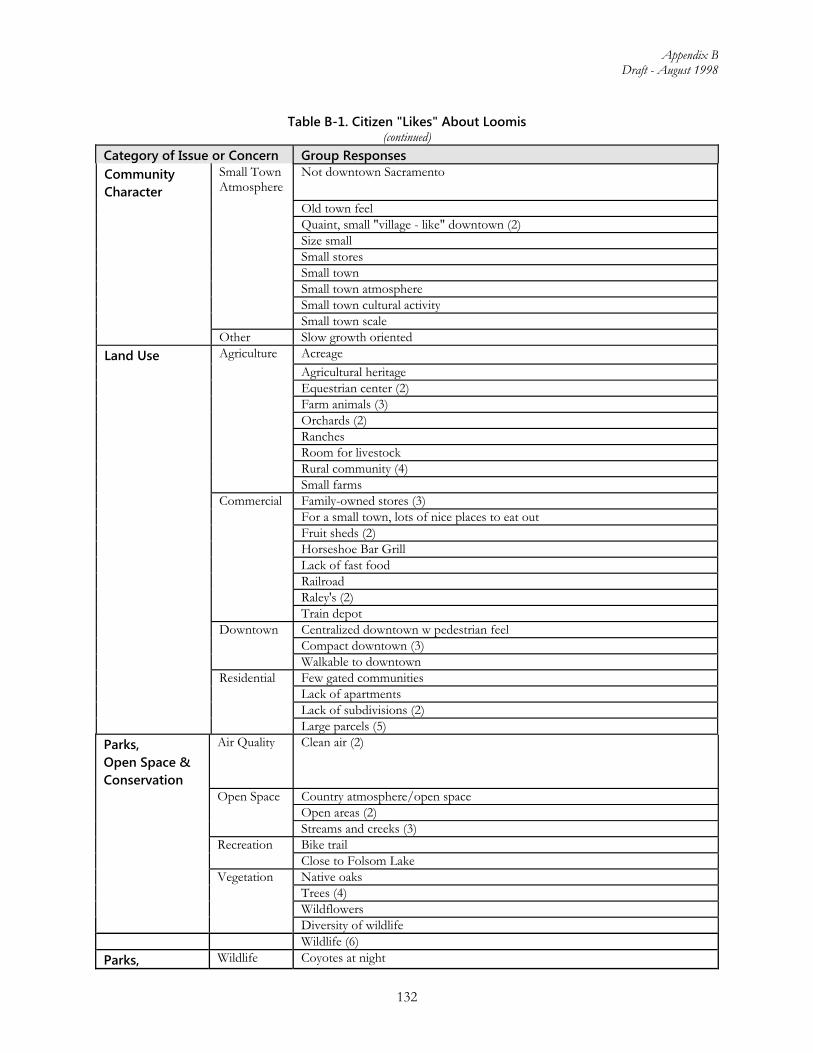
Appendix B Draft - August 1998
132
Table B-1. Citizen "Likes" About Loomis
(continued) Category of Issue or Concern Group Responses Community Character
Small Town Atmosphere
Not downtown Sacramento
Old town feel Quaint, small "village - like" downtown (2) Size small Small stores Small town Small town atmosphere Small town cultural activity Small town scale Other Slow growth oriented
Land Use Agriculture Acreage
Agricultural heritage Equestrian center (2) Farm animals (3) Orchards (2) Ranches Room for livestock Rural community (4) Small farms Commercial Family-owned stores (3) For a small town, lots of nice places to eat out Fruit sheds (2) Horseshoe Bar Grill Lack of fast food Railroad Raley's (2) Train depot Downtown Centralized downtown w pedestrian feel Compact downtown (3) Walkable to downtown Residential Few gated communities Lack of apartments Lack of subdivisions (2) Large parcels (5)
Parks, Open Space & Conservation
Air Quality Clean air (2)
Open Space Country atmosphere/open space Open areas (2) Streams and creeks (3) Recreation Bike trail Close to Folsom Lake Vegetation Native oaks Trees (4) Wildflowers Diversity of wildlife Wildlife (6)
Parks, Wildlife Coyotes at night

Appendix B Draft - August 1998
133
Table B-1. Citizen "Likes" About Loomis (continued)
Category of Issue or Concern Group Responses Open Space & Conservation Other Environmental community
Political Process Access Access to local govt. officials/town staff
Accessibility of town hall
Citizens are listened to be local government, town council, etc.
Schools Quality Quality of schools (6)
Other Del Oro
Support of high school
Traffic Congestion No traffic (4)
Country Roads
Meandering roads (2)
Small country roads (4) Congestion Low traffic density Interstate Access to freeway (3) Freeway provides easy access to nearby cities Other Courteous traffic Not many signal lights
Other Centralized location to everything
Location Entry - I80 Grass/mow strips Mix of economic classes

Appendix B Draft - August 1998
134
Table B-2. Citizen "Dislikes" About Loomis
Category of Issue or Concern Group Responses Aesthetics & Design
Raley’s Center Burger King play structure is ugly (2)
Design guidelines were ignored at Raley's and Burger King Lack of trees at Raley's Town Edge Edge commercial development in rural area Horseshoe Bar entry Inappropriate urban design in a rural area. Interface at edge of community Utilities Power poles downtown Towers/communication Signage Don't want commercial development along freeway if signage seen from
I-80 Downtown sign ordinance McDonald's sign Old signs Signage (all) on I80 View of neighboring city/Chevron sign Other Development pressure to look like anywhere CA Lack of design standards Lack of street trees/business landscaping Setbacks for non-conforming lots (small lots have some setbacks) Sprawling business locations
Growth & Development
Zoning Having to constantly struggle to retain zoning
No "spot" zoning - land uses should be consistent with uses in the area. Encroachment by other cities (2) Lack of quality community & residential growth Outside pressure to develop (2) Residential growth proposals/growth pressure Turtle Island
Land Use Commercial Desire for commercial development for income
Lack of shopping Retail leakage (2) Location of proposed Texaco (2) Auto-related business Downtown Dissension between downtown merchants and residents Downtown facades (Star Liquor) Failure to develop downtown Lack of downtown theme (2) Ugly downtown Residential Don't like high density residential, loss of privacy Don't like subdivisions Gated communities (4) Small lots (subdivided too small)

Appendix B Draft - August 1998
135
Table B-2. Citizen "Dislikes" About Loomis
(continued)
Category of Issue or Concern Group Responses Parks, Open Space & Conservation
Facilities Lack of community facilities for parks and recreation
Lack of parks (2) Lack of things for youth to do No community center (2) No town recreation programs Waterways Flooding Houses in flood plan No comprehensive approach to flood control. Poorly conceived drainage plan o access to stream on west side of town (Deer Creek) Waterway maintenance levels Other No tree protection policies No vision of open space RR tracks not utilized for rec purposes
Political Process
General Plan Having to come to Planning Commission meetings to reinforce general plan
Town council & PC not adhering to General Plan Notification Lack of notice of development proposals Lack of notification of other meetings (like this one) Lack of publicity regarding this process Other Lack of community involvement Long council meetings Political leaders not considering outside influences w/respect to planning of
community The feeling that the community "owes" a landowner rezoning (e.g. Texaco
issue) Too much money spent on planning with no follow through
Schools Facilities Fence at elementary school
Lack of adequate school facilities Lack of gym space in elementary No intermediate schools No showers for gym elementary No water in science classrooms Other Overcrowded schools (2) School adequacy
Traffic & Circulation
Bicycles & Pedestrians
Lack of bicycle/pedestrian lanes (3)
Lack of bike/horse trails (2) Can't walk to post office from house because streets don't connect Unfinished sidewalks in downtown (2) No pathway along Taylor Road Congestion Afternoon/evening traffic jam - morning at schools Busyness of Taylor Road (2) Congestion downtown/poor circulation (events, traffic light at college) Delmar traffic

Appendix B Draft - August 1998
136
Table B-2. Citizen "Dislikes" About Loomis
(continued)
Category of Issue or Concern Group Responses Traffic & Circulation
Congestion I80/Horseshoe Bar interchange needs improvement - alignment/capacity /safety
Lack of connector roads - i.e., King Lincoln traffic using Sierra College Blvd./Delmar Ave Peak hr. traffic downtown Poor circulation - core area Raley's, location of, road/traffic pattern into Sierra Blvd. traffic & Wells Ave. Traffic - Horseshoe Bar, downtown, Delmar Traffic flow during school hours - Taylor at King Parking Lack of parking Lack of parking for post office & other downtown businesses (3) Street Repair Condition of streets (3) Pot holes Quality of roads, conditions, patching, poorly placed drains Rough roads, potholes, mud, water, railroad crossing
Speed Fast pass-through traffic
Lack of speed controls on back roads - King, Barton, HBR/Brace Traffic speed (2) Other No infrastructure plan (Nate Rd. etc.) Only one entrance to Del Oro Proposal to widen HBR between I80 and Taylor Street sweeping Truck traffic on HB Road Unsafe driveways/streets/setbacksOther Dead animals on road Junk, poorly kept properties, unorganized Mailbox burglaries No existing tree value No recycling Snakes Trains idling/stopping for long periods (fumes/hobos displaced from
Rucklin) Trash Lack of development on west & south side of town (amenities like parks)

Appendix B Draft - August 1998
137
Table B-3. Citizens' Ideas for Changes to Loomis
Category of Issue or Concern Group Responses
Aesthetics & Design
Raley’s Center Change appearance of Burger King (3)
Change Raley's facade Other Clean up vacant parcel by Woody's Country, historical facades Define entries to town (3) Get rid of McDonald's/Chevron signs Move Chevron/McDonald's sign away from homes Preserve downtown trees Small town/"village like" development (both residential and
commercial) versus Roseville/Rocklin/rest of S. Placer County
Growth & Develop-ment
Borders Control neighboring development impacts
Rocklin building or development on borders of Loomis and Loomis having to react to development
City Services More police presence/staffing (Sheriff's) Town police dept. vs Sheriff's Dept. on contract Up maintenance of public property Culture Expansion of Theater & Arts Return of open air market (2) Economic
Development Develop economic plan for town
More revenue to implement downtown e.d. plan & master plan -pedestrian/shopper amenities entryway
Sustainable city policies/environmental qualities Up daytime population to increase tax benefits Zoning Compatible zoning change requests
Land Use Commercial Accelerate renovation of fruit sheds
Convert older homes intro small offices Encourage quality development and retail Encouragement of competitive, quality businesses for lower prices. Get appliances off sidewalks More fine restaurants Move gas stations to freeway off-ramps Phasing of commercial development Remove Raley's access to H.B. Blvd. Sidewalk cafes Stop industrial growth Downtown At Taylor/Horseshoe BaR, get train station & plaza Benches in downtown, sit & talk in shade Build out downtown according to master plan Develop a city mall/plaza complex for city hall, festivals, public events
area Downtown development theme/design Downtown facade improvements Revitalization, beautification of downtown (2)

Appendix B Draft - August 1998
138
Table B-3. Citizens' Ideas for Changes to Loomis
(continued)
Category of Issue or Concern Group Responses Land Use (continued)
Downtown Turn downtown into pedestrian destination, upscale, boutique shop area (e.g. Los Altos, Los Gatos) (attractive downtown area
Zoning for downtown core Residential Keep residential zoning as is. Larger parcels (2) More apartments No gated communities (2) Planned Senior units on "Xmas tree farm" Senior housing opportunities Smaller parcels for young families/elderly Other Overhaul building codes
Parks, Open Space & Conservation
Flooding Maintain flood control
Open Space Buffer/greenbelt around town Linkages w/area greenbelt through planning Open space/natural habitat areas preservation (3) Permanent agriculture Parks More & better parks (2) Recreation More community events Bigger swimming pool Coordinate recreation with schools Core area park/more recreation areas for children (2) Develop more parks and recreation facilities and programs (5) New community center/multi use (4) Wells Control pollution of wells Control underground pollution of wells Other Environmental protection program -for kids too
Political Process Facilities Better PA system for town council meeting
Noticing Improve noticing
Schools Facilities Improve schools
More & updated school facilities Pass every school bond Other Better location for new High school Bussing charge for kids (schools)
Traffic & Circulation
Congestion Do a better job re: circulation on Switzer
Improve circulation More "thru" streets (circulation is poor) Paving of dirt roads (for circulation) Interstate Freeway landscaping Sound barriers along I80/berms preferred Landscaping More street trees Street planting Tree planting program & street trees Bicycles &
Pedestrians Bike trail connections
Build some trails - horse/bike/hike (5)

Appendix B Draft - August 1998
139
Table B-2. Citizens' Ideas for Changes to Loomis
Category of Issue or Concern Group Responses Traffic & Circulation
Bicycles & Pedestrians
More bike lanes
More pedestrian orientation to downtown Trail from Loomis to Folsom Lake MU Trails and greenbelts along streams Widen roads for pedestrian/bikes (2) Public
Transportation Amtrak station
Better connection w/county transit Better public transit (surface & RR) Develop a monorail to Sacramento Speed More speed control/law enforcement in rural areas of town Slow down traffic (2) Street Repair Better road maintenance (2) Improve railroad grade crossings (2) Other Alternate highway for Rocklin development Bypass around downtown Cut Rocklin Rd to Fulsom Lake New bridge on H'Bar @ Secret Ravine & Brace Rd Traffic light @ King Rd/Sierra College Blvd.
Other Absentee landlords
Dump Day twice a year More community service cleanup days

Appendix C August 1998
140
Appendix C. Capture/Leakage Analysis
Table C-1: Estimated Households in Trade Areas
Trade Areas 1995 2000 2005 2010 2015 2020
Town of Loomis 2,099 2,330 2,738 3,299 3,661 3,825Loomis Rural Area 2,945 3,408 4,222 5,344 6,069 6,398Granite Bay 5,467 6,502 7,214 8,228 8,854 9,038Rocklin Area 9,472 13,242 15,764 18,391 20,981 23,670Lincoln Area 4,045 4,858 6,601 9,664 11,924 13,612Roseville Area 23,768 28,212 32,935 37,615 40,292 41,175Total 47,796 58,552 69,474 82,541 91,781 97,718
Source: Sacramento Area Council of Governments: Projections 1995-2020; California Department of Finance; National Decision Systems; David Taussig & Associates 06/30/98
Table C-2: Estimated Mean Household Income
Trade Areas 1995 2000 2005 2010 2015 2020
(In constant 1998 $) Town of Loomis $56,818 $59,717 $62,763 $65,964 $69,329 $72,866Loomis Rural Area $73,374 $77,117 $81,051 $85,185 $89,531 $94,098Granite Bay $93,846 $98,633 $103,664 $108,952 $114,509 $120,351Rocklin Area $63,469 $66,706 $70,109 $73,685 $77,444 $81,394Lincoln Area $44,780 $48,241 $51,969 $55,986 $60,313 $64,974Roseville Area $62,250 $65,426 $68,763 $72,271 $75,957 $79,832Mean Household Income $65,756 $69,307 $73,053 $77,007 $81,180 $85,586
Source: Sacramento Area Council of Governments: Projections 1995-2020; California Department of Finance; National Decision Systems; David Taussig & Associates 06/30/98
Table C-3: Estimated Total Income
Trade Areas 1995 2000 2005 2010 2015 2020
(In constant 1998 $) Town of Loomis $119,261,649 $139,159,638 $171,823,547 $217,594,248 $253,814,002 $278,735,319 Loomis Rural Area $216,087,386 $262,789,550 $342,223,927 $455,258,708 $543,361,334 $602,004,961 Granite Bay $513,053,633 $641,309,285 $747,831,181 $896,455,185 $1,013,866,298 $1,087,728,168 Rocklin Area $601,174,593 $883,322,680 $1,105,195,462 $1,355,142,232 $1,624,847,432 $1,926,599,891 Lincoln Area $181,136,390 $234,355,367 $343,049,932 $541,046,682 $719,167,404 $884,423,308 Roseville Area $1,479,567,065 $1,845,792,005 $2,264,714,299 $2,718,464,647 $3,060,471,344 $3,287,077,691 Total $3,110,280,717 $4,006,728,525 $4,974,838,347 $6,183,961,701 $7,215,527,813 $8,066,569,337
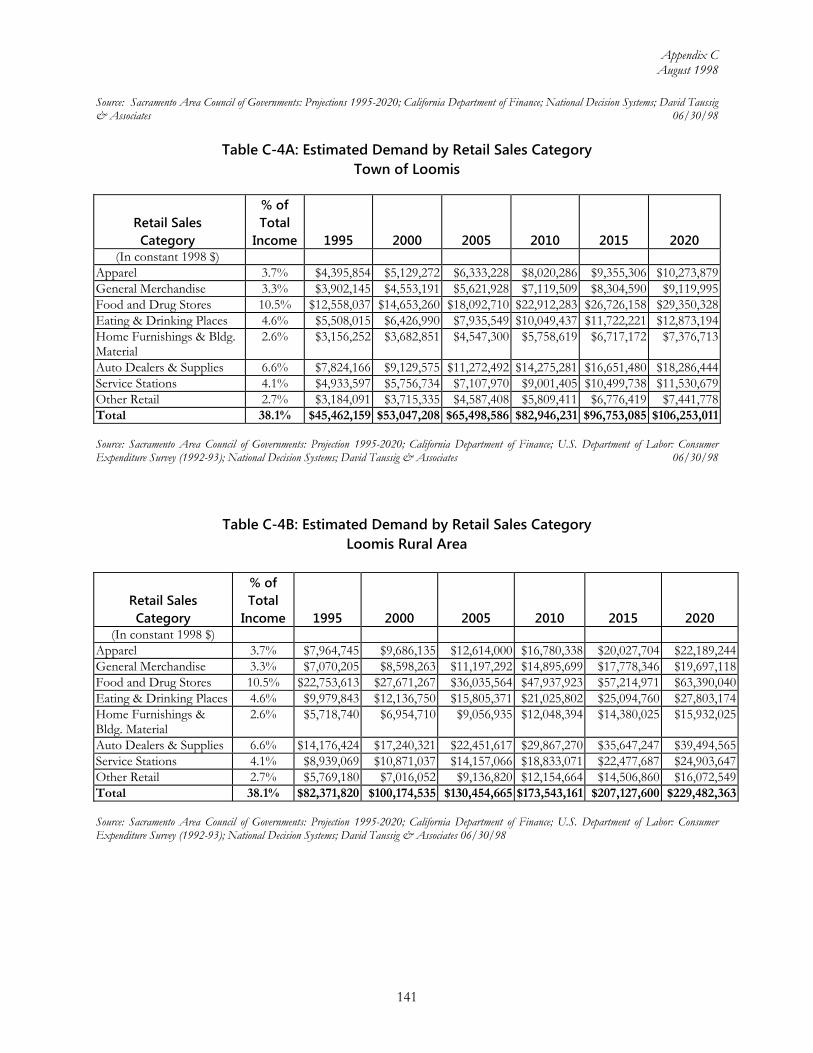
Appendix C August 1998
141
Source: Sacramento Area Council of Governments: Projections 1995-2020; California Department of Finance; National Decision Systems; David Taussig & Associates 06/30/98
Table C-4A: Estimated Demand by Retail Sales Category Town of Loomis
Retail Sales Category
% of Total
Income
1995
2000
2005
2010
2015
2020 (In constant 1998 $)
Apparel 3.7% $4,395,854 $5,129,272 $6,333,228 $8,020,286 $9,355,306 $10,273,879 General Merchandise 3.3% $3,902,145 $4,553,191 $5,621,928 $7,119,509 $8,304,590 $9,119,995 Food and Drug Stores 10.5% $12,558,037 $14,653,260 $18,092,710 $22,912,283 $26,726,158 $29,350,328 Eating & Drinking Places 4.6% $5,508,015 $6,426,990 $7,935,549 $10,049,437 $11,722,221 $12,873,194 Home Furnishings & Bldg. Material
2.6% $3,156,252 $3,682,851 $4,547,300 $5,758,619 $6,717,172 $7,376,713
Auto Dealers & Supplies 6.6% $7,824,166 $9,129,575 $11,272,492 $14,275,281 $16,651,480 $18,286,444 Service Stations 4.1% $4,933,597 $5,756,734 $7,107,970 $9,001,405 $10,499,738 $11,530,679 Other Retail 2.7% $3,184,091 $3,715,335 $4,587,408 $5,809,411 $6,776,419 $7,441,778 Total 38.1% $45,462,159 $53,047,208 $65,498,586 $82,946,231 $96,753,085 $106,253,011 Source: Sacramento Area Council of Governments: Projection 1995-2020; California Department of Finance; U.S. Department of Labor: Consumer Expenditure Survey (1992-93); National Decision Systems; David Taussig & Associates 06/30/98
Table C-4B: Estimated Demand by Retail Sales Category Loomis Rural Area
Retail Sales Category
% of Total
Income
1995
2000
2005
2010
2015
2020 (In constant 1998 $)
Apparel 3.7% $7,964,745 $9,686,135 $12,614,000 $16,780,338 $20,027,704 $22,189,244 General Merchandise 3.3% $7,070,205 $8,598,263 $11,197,292 $14,895,699 $17,778,346 $19,697,118 Food and Drug Stores 10.5% $22,753,613 $27,671,267 $36,035,564 $47,937,923 $57,214,971 $63,390,040 Eating & Drinking Places 4.6% $9,979,843 $12,136,750 $15,805,371 $21,025,802 $25,094,760 $27,803,174 Home Furnishings & Bldg. Material
2.6% $5,718,740 $6,954,710 $9,056,935 $12,048,394 $14,380,025 $15,932,025
Auto Dealers & Supplies 6.6% $14,176,424 $17,240,321 $22,451,617 $29,867,270 $35,647,247 $39,494,565 Service Stations 4.1% $8,939,069 $10,871,037 $14,157,066 $18,833,071 $22,477,687 $24,903,647 Other Retail 2.7% $5,769,180 $7,016,052 $9,136,820 $12,154,664 $14,506,860 $16,072,549 Total 38.1% $82,371,820 $100,174,535 $130,454,665 $173,543,161 $207,127,600 $229,482,363 Source: Sacramento Area Council of Governments: Projection 1995-2020; California Department of Finance; U.S. Department of Labor: Consumer Expenditure Survey (1992-93); National Decision Systems; David Taussig & Associates 06/30/98

Appendix C August 1998
142
Table C-4C: Estimated Demand by Retail Sales Category
Granite Bay
Retail Sales Category
% of Total
Income
1995
2000
2005
2010
2015
2020 (In constant 1998 $)
Apparel 3.7% $18,910,596 $23,637,959 $27,564,239 $33,042,358 $37,370,003 $40,092,470 General Merchandise 3.3% $16,786,702 $20,983,124 $24,468,435 $29,331,293 $33,172,890 $35,589,591Food and Drug Stores 10.5% $54,023,625 $67,528,714 $78,745,279 $94,395,119 $106,758,298 $114,535,820 Eating & Drinking Places 4.6% $23,695,020 $29,618,417 $34,538,056 $41,402,150 $46,824,700 $50,235,958 Home Furnishings & Bldg. Material
2.6% $13,577,933 $16,972,211 $19,791,307 $23,724,632 $26,831,910 $28,786,660
Auto Dealers & Supplies 6.6% $33,658,909 $42,073,127 $49,061,501 $58,811,986 $66,514,748 $71,360,460 Service Stations 4.1% $21,223,923 $26,529,583 $30,936,164 $37,084,418 $41,941,463 $44,996,969 Other Retail 2.7% $13,697,694 $17,121,910 $19,965,871 $23,933,889 $27,068,574 $29,040,565 Total 38.1% $195,574,402 $244,465,045 $285,070,851 $341,725,845 $386,482,585 $414,638,494
Source: Sacramento Area Council of Governments: Projection 1995-2020; California Department of Finance; U.S. Department of Labor: Consumer Expenditure Survey (1992-93); National Decision Systems; David Taussig & Associates 06/30/98
Table C-4D: Estimated Demand by Retail Sales Category Rocklin Area
Retail Sales Category
% of Total
Income
1995
2000
2005
2010
2015
2020 (In constant 1998 $)
Apparel 3.7% $22,158,638 $32,558,308 $40,736,296 $49,949,060 $59,890,099 $71,012,365 General Merchandise 3.3% $19,669,949 $28,901,608 $36,161,106 $44,339,164 $53,163,701 $63,036,799 Food and Drug Stores 10.5% $63,302,604 $93,012,290 $116,375,095 $142,694,040 $171,093,513 $202,867,504 Eating & Drinking Places 4.6% $27,764,824 $40,795,635 $51,042,673 $62,586,288 $75,042,432 $88,978,657 Home Furnishings & Bldg. Material
2.6% $15,910,049 $23,377,081 $29,248,931 $35,863,757 $43,001,489 $50,987,349
Auto Dealers & Supplies 6.6% $39,440,089 $57,950,428 $72,506,402 $88,904,172 $106,598,195 $126,394,680 Service Stations 4.1% $24,869,297 $36,541,155 $45,719,554 $56,059,313 $67,216,435 $79,699,284 Other Retail 2.7% $16,050,380 $23,583,273 $29,506,914 $36,180,084 $43,380,773 $51,437,070 Total 38.1% $229,165,829 $336,719,776 $421,296,970 $516,575,879 $619,386,637 $734,413,708 Source: Sacramento Area Council of Governments: Projection 1995-2020; California Department of Finance; U.S. Department of Labor: Consumer Expenditure Survey (1992-93); National Decision Systems; David Taussig & Associates 06/30/98

Appendix C August 1998
143
Table C-4E: Estimated Demand by Retail Sales Category
Lincoln Area
Retail Sales Category
% of Total Income
1995 2000 2005 2010 2015 2020
(In constant 1998 $) Apparel 3.7% $6,676,489 $8,638,082 $12,644,445 $19,942,389 $26,507,724 $32,598,876 General Merchandise
3.3% $5,926,637 $7,667,919 $11,224,318 $17,702,612 $23,530,579 $28,937,619
Food and Drug Stores
10.5% $19,073,336 $24,677,199 $36,122,541 $56,971,243 $75,727,034 $93,128,184
Eating & Drinking Places
4.6% $8,365,656 $10,823,537 $15,843,519 $24,987,859 $33,214,239 $40,846,467
Home Furnishings & Bldg. Material
2.6% $4,793,764 $6,202,201 $9,078,796 $14,318,768 $19,032,722 $23,406,209
Auto Dealers & Supplies
6.6% $11,883,462 $15,374,895 $22,505,808 $35,495,394 $47,181,013 $58,022,634
Service Stations 4.1% $7,493,222 $9,694,776 $14,191,236 $22,381,935 $29,750,405 $36,586,686 Other Retail 2.7% $4,836,046 $6,256,906 $9,158,873 $14,445,063 $19,200,595 $23,612,658 Total 38.1% $69,048,612 $89,335,515 $130,769,535 $206,245,262 $274,144,311 $337,139,332 Source: Sacramento Area Council of Governments: Projection 1995-2020; California Department of Finance; U.S. Department of Labor: Consumer Expenditure Survey (1992-93); National Decision Systems; David Taussig & Associates 06/30/98
Table C-4F: Estimated Demand by Retail Sales Category Roseville Area
Retail Sales Category
% of Total
Income
1995
2000
2005
2010
2015
2020 (In constant 1998 $)
Apparel 3.7% $54,535,224 $68,033,874 $83,474,892 $100,199,633 $112,805,626 $121,158,088 General Merchandise 3.3% $48,410,244 $60,392,830 $74,099,630 $88,945,976 $100,136,160 $107,550,538 Food and Drug Stores 10.5% $155,795,751 $194,358,579 $238,470,343 $286,249,439 $322,262,129 $346,123,370 Eating & Drinking Places 4.6% $68,332,761 $85,246,602 $104,594,232 $125,550,372 $141,345,710 $151,811,364 Home Furnishings & Bldg. Material
2.6% $39,156,653 $48,848,773 $59,935,527 $71,944,002 $80,995,188 $86,992,312
Auto Dealers & Supplies 6.6% $97,067,070 $121,093,275 $148,576,692 $178,345,006 $200,782,372 $215,648,893 Service Stations 4.1% $61,206,500 $76,356,436 $93,686,348 $112,457,022 $126,605,102 $135,979,318 Other Retail 2.7% $39,502,024 $49,279,632 $60,464,173 $72,578,566 $81,709,586 $87,759,605 Total 38.1% $564,006,226 $703,610,001 $863,301,837 $1,036,270,017 $1,166,641,874 $1,253,023,488 Source: Sacramento Area Council of Governments: Projection 1995-2020; California Department of Finance; U.S. Department of Labor: Consumer Expenditure Survey (1992-93); National Decision Systems; David Taussig & Associates 06/30/98

Appendix C August 1998
144
Table C-4G: Estimated Total Demand by Retail Sales Category
Retail Sales Category
1995
2000
2005
2010
2015
2020
(In constant 1998 $) Apparel $114,641,545 $147,683,631 $183,367,100 $227,934,064 $265,956,463 $297,324,922 General Merchandise $101,765,883 $131,096,934 $162,772,709 $202,334,252 $236,086,266 $263,931,660 Food and Drug Stores $327,506,966 $421,901,309 $523,841,532 $651,160,047 $759,782,103 $849,395,245 Eating & Drinking Places $143,646,121 $185,047,930 $229,759,399 $285,601,909 $333,244,062 $372,548,814 Home Furnishings & Bldg. Material
$82,313,391 $106,037,827 $131,658,795 $163,658,171 $190,958,506 $213,481,268
Auto Dealers & Supplies $204,050,119 $262,861,621 $326,374,513 $405,699,110 $473,375,055 $529,207,676 Service Stations $128,665,608 $165,749,721 $205,798,338 $255,817,164 $298,490,831 $333,696,584 Other Retail $83,039,415 $106,973,107 $132,820,058 $165,101,677 $192,642,807 $215,364,226 Total $1,185,629,048 $1,527,352,081 $1,896,392,445 $2,357,306,394 $2,750,536,093 $3,074,950,396 Source: Sacramento Area Council of Governments: Projection 1995-2020; California Department of Finance; U.S. Department of Labor: Consumer Expenditure Survey (1992-93); National Decision Systems; David Taussig & Associates 06/30/98
Table C-4H: Estimated Retail Demand by Trade Area - Year 1998
Retail Sales Category
Town of Loomis
Loomis Rural Area
Granite
Bay
Rocklin
Area
Lincoln
Area
Roseville
Area (In constant 1998 $)
Apparel $4,835,905 $8,997,579 $21,747,014 $28,398,440 $7,853,445 $62,634,414 General Merchandise $4,292,773 $7,987,040 $19,304,555 $25,208,944 $6,971,406 $55,599,795 Food and Drug Stores $13,815,171 $25,704,206 $62,126,679 $81,128,415 $22,435,654 $178,933,448 Eating & Drinking Places $6,059,400 $11,273,987 $27,249,058 $35,583,311 $9,840,385 $78,481,065 Home Furnishings & Bldg. Material
$3,472,212 $6,460,322 $15,614,500 $20,390,268 $5,638,826 $44,971,925
Auto Dealers & Supplies $8,607,411 $16,014,762 $38,707,440 $50,546,292 $13,978,322 $111,482,793 Service Stations $5,427,479 $10,098,250 $24,407,319 $31,872,412 $8,814,155 $70,296,462 Other Retail $3,502,838 $6,517,303 $15,752,224 $20,570,116 $5,688,562 $45,368,589 Total $50,013,188 $93,053,449 $224,908,788 $293,698,198 $81,220,754 $647,768,491 Percent of Total Demand 3.60% 6.69% 16.17% 21.12% 5.84% 46.58%
Source: Sacramento Area Council of Governments: Projection 1995-2020; California Department of Finance; U.S. Department of Labor: Consumer Expenditure Survey (1992-93); National Decision Systems; David Taussig & Associates 06/30/98

Appendix C August 1998
145
Table C-5: Estimated Retail Supply by Trade Area (Year 1998)
Retail Sales Category
Town of Loomis
Loomis Rural Area
Granite Bay Rocklin Area
Lincoln Area
Roseville Area
Total
(In constant 1998 $) Apparel $89,116 $0 $639,648 $466,796 $0 $28,283,594 $29,479,154 General Merchandise $0 $0 $0 $45,580,508 $442,275 $141,626,967 $187,649,750 Food and Drug Stores $19,594,847 $6,062,286 $84,872,000 $68,071,747 $19,452,215 $145,662,736 $343,715,830 Eating & Drinking Places
$4,774,050 $2,121,800 $6,365,400 $18,775,808 $4,832,400 $74,478,363 $111,347,820
Home Furnishings & Bldg. Material
$3,500,970 $7,426,300 $12,730,800 $21,749,511 $2,261,145 $109,757,531 $157,426,257
Auto Dealers & Supplies
$1,523,452 $1,060,900 $0 $3,628,278 $1,772,764 $522,173,919 $530,159,313
Service Stations $1,725,068 $1,060,900 $3,182,700 $21,062,048 $5,175,204 $49,336,094 $81,542,013 Other Retail $2,778,884 $3,182,700 $6,786,652 $22,070,198 $2,094,012 $119,423,391 $156,335,837 Total $33,986,386 $20,914,886 $114,577,200 $201,404,893 $36,030,014 $1,190,742,595 $1,597,655,974 Percent of Total Supply
2.13% 1.31% 7.17% 12.61% 2.26% 74.53% 100.00%
Source: California State Board of Equalization; National Decision Systems; David Taussig Associates 06/30/98
Table C-6A: Retail Market Estimated Supply vs. Estimated Demand Town of Loomis
Estimated Estimated Demand v. Estimated Demand v. Retail Sales Supply /1 Demand Supply Demand Supply Category 1998 1998 1998 2020 2020
(In constant 1998 $) Apparel $89,116 $4,835,905 ($4,746,789) $10,273,879 ($10,184,763)General Merchandise $0 $4,292,773 ($4,292,773) $9,119,995 ($9,119,995)Food and Drug Stores $19,594,847 $13,815,171 $5,779,676 $29,350,328 ($9,755,481)Eating & Drinking Places $4,774,050 $6,059,400 ($1,285,350) $12,873,194 ($8,099,144)Home Furnishings &Bldg. Material
$3,500,970 $3,472,212 $28,758 $7,376,713 ($3,875,743)
Auto Dealers & Supplies $1,523,452 $8,607,411 ($7,083,959) $18,286,444 ($16,762,992)Service Stations $1,725,068 $5,427,479 ($3,702,412) $11,530,679 ($9,805,611)Other Retail $2,778,884 $3,502,838 ($723,954) $7,441,778 ($4,662,894) $1,038,991 $14,337,694 $15,376,685Total $33,986,386 $50,013,188 ($16,026,802) $106,253,011 ($72,266,625)
1/ Supply is assumed to remain constant in comparison to both current and future demand. Source: Sacramento Council of Governments: Projection 1995-2020; U.S. Department of Labor: Consumer Expenditure Survey (1992-93); California State Board of Equalization; Town of Loomis; David Taussig & Associates 6/30/98

Appendix C August 1998
146
Table C-6B: Retail Market Estimated Supply vs. Estimated Demand Loomis Rural Area /2
Retail Sales Category
Estimated Supply /1
1998
Estimated Demand
1998
Demand v. Supply 1998
Estimated Demand
2020
Demand v. Supply 2020
(In constant 1998 $) Apparel $0 $8,997,579 ($8,997,579) $22,189,244 ($22,189,244)General Merchandise $0 $7,987,040 ($7,987,040) $19,697,118 ($19,697,118)Food and Drug Stores $6,062,286 $25,704,206 ($19,641,920) $63,390,040 ($57,327,754)Eating & Drinking Places $2,121,800 $11,273,987 ($9,152,187) $27,803,174 ($25,681,374)Home Furnishings & Bldg. Material
$7,426,300 $6,460,322 $965,978 $15,932,025 ($8,505,725)
Auto Dealers & Supplies $1,060,900 $16,014,762 ($14,953,862) $39,494,565 ($38,433,665)Service Stations $1,060,900 $10,098,250 ($9,037,350) $24,903,647 ($23,842,747)Other Retail $3,182,700 $6,517,303 ($3,334,603) $16,072,549 ($12,889,849) $1,897,886 Total $20,914,886 $93,053,449 ($72,138,563) $229,482,363 ($208,567,477)
1/ Supply is assumed to remain constant in comparison to both current and future demand. 2/ Loomis Rural Area is immediately outside the Loomis city limits, bounded by highway 193 to the north, Sierra College Boulevard to the west, Auburn - Folsom Road to the east, and Cavitt Stallman Road to the south. The area includes Penryn but excludes Newcastle. Source: Sacramento Council of Governments: Projection 1995-2020; U.S. Department of Labor: Consumer Expenditure Survey (1992-93); National Decision Systems; David Taussig & Associates 06/30/98
Table C-6C Retail Market Estimated Supply vs. Estimated Demand Granite Bay
Retail Sales Category
Estimated Supply /1
1998
Estimated Demand
1998
Demand v. Supply 1998
Estimated Demand
2020
Demand v. Supply 2020
(In constant 1998 $) Apparel $639,648 $21,747,014 ($21,107,366) $40,092,470 ($39,452,822)General Merchandise $0 $19,304,555 ($19,304,555) $35,589,591 ($35,589,591)Food and Drug Stores $84,872,000 $62,126,679 $22,745,321 $114,535,820 ($29,663,820)Eating & Drinking Places $6,365,400 $27,249,058 ($20,883,658) $50,235,958 ($43,870,558)Home Furnishings & Bldg. Material
$12,730,800 $15,614,500 ($2,883,700) $28,786,660 ($16,055,860)
Auto Dealers & Supplies $0 $38,707,440 ($38,707,440) $71,360,460 ($71,360,460)Service Stations $3,182,700 $24,407,319 ($21,224,619) $44,996,969 ($41,814,269)Other Retail $6,786,652 $15,752,224 ($8,965,572) $29,040,565 ($22,253,913)Total $114,577,200 $224,908,788 ($110,331,588) $414,638,494 ($300,061,294)
1/ Supply is assumed to remain constant in comparison to both current and future demand. Source: Sacramento Council of Governments: Projection 1995-2020; U.S. Department of Labor: Consumer Expenditure Survey (1992-93); National Decision Systems; David Taussig & Associates 06/30/98
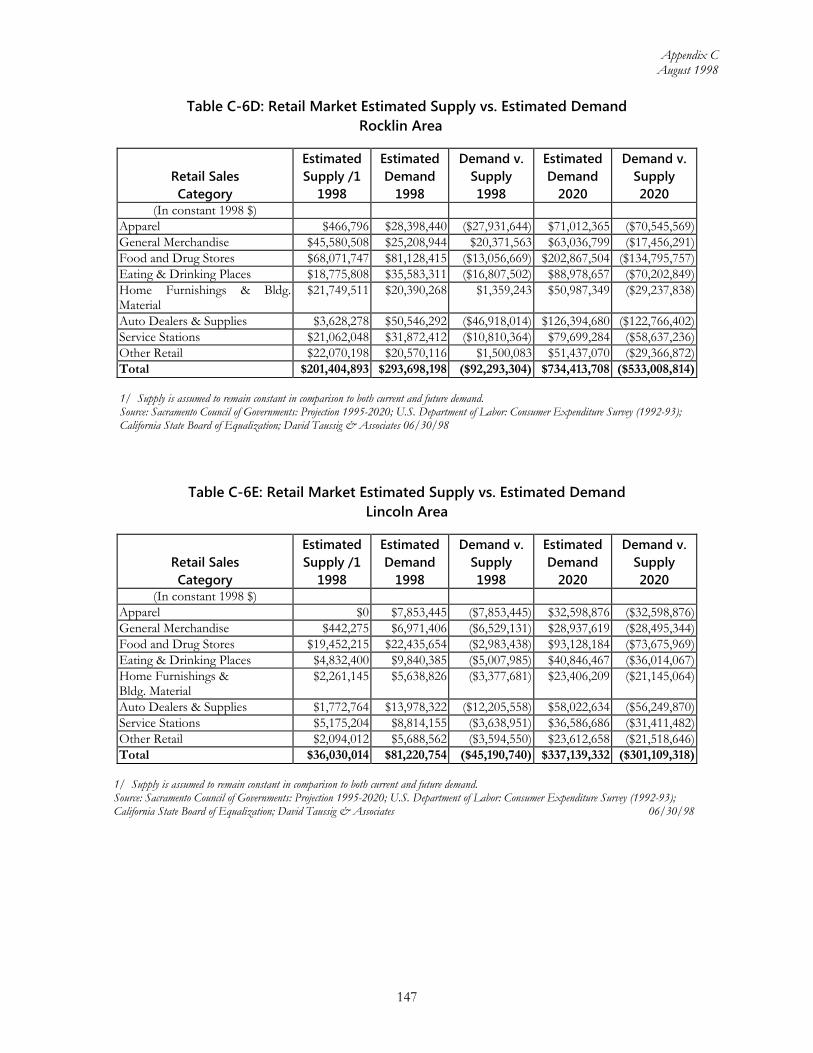
Appendix C August 1998
147
Table C-6D: Retail Market Estimated Supply vs. Estimated Demand Rocklin Area
Retail Sales Category
Estimated Supply /1
1998
Estimated Demand
1998
Demand v. Supply 1998
Estimated Demand
2020
Demand v. Supply 2020
(In constant 1998 $) Apparel $466,796 $28,398,440 ($27,931,644) $71,012,365 ($70,545,569)General Merchandise $45,580,508 $25,208,944 $20,371,563 $63,036,799 ($17,456,291)Food and Drug Stores $68,071,747 $81,128,415 ($13,056,669) $202,867,504 ($134,795,757)Eating & Drinking Places $18,775,808 $35,583,311 ($16,807,502) $88,978,657 ($70,202,849)Home Furnishings & Bldg. Material
$21,749,511 $20,390,268 $1,359,243 $50,987,349 ($29,237,838)
Auto Dealers & Supplies $3,628,278 $50,546,292 ($46,918,014) $126,394,680 ($122,766,402)Service Stations $21,062,048 $31,872,412 ($10,810,364) $79,699,284 ($58,637,236)Other Retail $22,070,198 $20,570,116 $1,500,083 $51,437,070 ($29,366,872)Total $201,404,893 $293,698,198 ($92,293,304) $734,413,708 ($533,008,814)
1/ Supply is assumed to remain constant in comparison to both current and future demand. Source: Sacramento Council of Governments: Projection 1995-2020; U.S. Department of Labor: Consumer Expenditure Survey (1992-93); California State Board of Equalization; David Taussig & Associates 06/30/98
Table C-6E: Retail Market Estimated Supply vs. Estimated Demand Lincoln Area
Retail Sales Category
Estimated Supply /1
1998
Estimated Demand
1998
Demand v. Supply 1998
Estimated Demand
2020
Demand v. Supply 2020
(In constant 1998 $) Apparel $0 $7,853,445 ($7,853,445) $32,598,876 ($32,598,876)General Merchandise $442,275 $6,971,406 ($6,529,131) $28,937,619 ($28,495,344)Food and Drug Stores $19,452,215 $22,435,654 ($2,983,438) $93,128,184 ($73,675,969)Eating & Drinking Places $4,832,400 $9,840,385 ($5,007,985) $40,846,467 ($36,014,067)Home Furnishings & Bldg. Material
$2,261,145 $5,638,826 ($3,377,681) $23,406,209 ($21,145,064)
Auto Dealers & Supplies $1,772,764 $13,978,322 ($12,205,558) $58,022,634 ($56,249,870)Service Stations $5,175,204 $8,814,155 ($3,638,951) $36,586,686 ($31,411,482)Other Retail $2,094,012 $5,688,562 ($3,594,550) $23,612,658 ($21,518,646)Total $36,030,014 $81,220,754 ($45,190,740) $337,139,332 ($301,109,318)
1/ Supply is assumed to remain constant in comparison to both current and future demand. Source: Sacramento Council of Governments: Projection 1995-2020; U.S. Department of Labor: Consumer Expenditure Survey (1992-93); California State Board of Equalization; David Taussig & Associates 06/30/98

Appendix C August 1998
148
Table C-6F: Retail Market Estimated Supply vs. Estimated Demand Roseville Area
Retail Sales Category
Estimated Supply /1
1998
Estimated Demand
1998
Demand v. Supply 1998
Estimated Demand
2020
Demand v. Supply 2020
(In constant 1998 $) Apparel $28,283,594 $62,634,414 ($34,350,820) $121,158,088 ($92,874,494)General Merchandise $141,626,967 $55,599,795 $86,027,172 $107,550,538 $34,076,429 Food and Drug Stores $145,662,736 $178,933,448 ($33,270,712) $346,123,370 ($200,460,634)Eating & Drinking Places $74,478,363 $78,481,065 ($4,002,703) $151,811,364 ($77,333,002)Home Furnishings & Bldg. Material
$109,757,531 $44,971,925 $64,785,606 $86,992,312 $22,765,220
Auto Dealers & Supplies $522,173,919 $111,482,793 $410,691,126 $215,648,893 $306,525,026 Service Stations $49,336,094 $70,296,462 ($20,960,368) $135,979,318 ($86,643,224)Other Retail $119,423,391 $45,368,589 $74,054,803 $87,759,605 $31,663,786 Total $1,190,742,595 $647,768,491 $542,974,104 $1,253,023,488 ($62,280,893)
1/ Supply is assumed to remain constant in comparison to both current and future demand. Source: Sacramento Council of Governments: Projection 1995-2020; U.S. Department of Labor: Consumer Expenditure Survey (1992-93); California State Board of Equalization; David Taussig & Associates 06/30/98
Table C-6G: Retail Market Estimated Supply vs. Estimated Demand Summary by Retail Sales Category
Retail Sales Category
Estimated Supply /1
1998
Estimated Demand
1998
Demand v. Supply 1998
Estimated Demand
2020
Demand v. Supply 2020
(In constant 1998 $) Apparel $29,479,154 $134,466,796 ($104,987,643) $297,324,922 ($267,845,769)General Merchandise $187,649,750 $119,364,514 $68,285,236 $263,931,660 ($76,281,910)Food and Drug Stores $343,715,830 $384,143,572 ($40,427,742) $849,395,245 ($505,679,415)Eating & Drinking Places $111,347,820 $168,487,206 ($57,139,386) $372,548,814 ($261,200,994)Home Furnishings & Bldg. Material
$157,426,257 $96,548,053 $60,878,204 $213,481,268 ($56,055,011)
Auto Dealers & Supplies $530,159,313 $239,337,020 $290,822,293 $529,207,676 $951,637Service Stations $81,542,013 $150,916,076 ($69,374,063) $333,696,584 ($252,154,571)Other Retail $156,335,837 $97,399,630 $58,936,206 $215,364,226 ($59,028,389)Total $1,597,655,974 $1,390,662,868 $206,993,107 $3,074,950,396 ($1,477,294,421)
1/ Supply is assumed to remain constant in comparison to both current and future demand. Source: Sacramento Council of Governments: Projection 1995-2020; U.S. Department of Labor: Consumer Expenditure Survey (1992-93); California State Board of Equalization; Town of Loomis; National Decision Systems; David Taussig & Associates 06/30/98

Appendix C August 1998
149
Table C-6H: Retail Market Estimated Supply vs. Estimated Demand Summary by Trade Area
Retail Sales Category
Estimated Supply /1
1998
Estimated Demand
1998
Demand v. Supply 1998
Estimated Demand
2020
Demand v. Supply 2020
(In constant 1998 $) Town of Loomis $33,986,386 $50,013,188 ($16,026,802) $106,253,011 ($72,266,625)Loomis Rural Area $20,914,886 $93,053,449 ($72,138,563) $229,482,363 ($208,567,477)Granite Bay $114,577,200 $224,908,788 ($110,331,588) $414,638,494 ($300,061,294)Rocklin Area $201,404,893 $293,698,198 ($92,293,304) $734,413,708 ($533,008,814)Lincoln Area $36,030,014 $81,220,754 ($45,190,740) $337,139,332 ($301,109,318)Roseville Area $1,190,742,595 $647,768,491 $542,974,104 $1,253,023,488 ($62,280,893)Total $1,597,655,974 $1,390,662,868 $206,993,107 $3,074,950,396 ($1,477,294,421)
1/ Supply is assumed to remain constant in comparison to both current and future demand. Source: Sacramento Council of Governments: Projection 1995-2020; U.S. Department of Labor: Consumer Expenditure Survey (1992-93); California State Board of Equalization; Town of Loomis; National Decision Systems; David Taussig & Associates 06/30/98
Table C-7: "Other Retail" Category
Subcategories in "Other Retail"
Examples
Gifts, Art Goods, and Novelties Hallmark; Z GalleryFlorists Relles Florists; 1-800 Flowers Photographic Equipment and Supplies Kits CamerasMusical Instruments Drum & Guitar CityStationery and Books Borders; Barnes & NobleJewelry Tiffany & Co; Cartier; Ben Bridges Office, Store and School Supplies Staples; OfficeMaxOther Specialties Aaron Brothers; GNCSecond-hand Merchandise Salvation Army; Pawn Shop Farm and Garden Supply Stores Payless NurseryFuel and Ice Dealers Propane storesMobile Homes, Trailers, and Campers Golden WestBoats, Motorcycle, and Plane Dealers Boat Emporium
Source: California State Board of Equalization; David Taussig & Associates 06/30/98

Appendix D August 1998
150
Appendix D. Absorption Analysis
Table D-1: Town of Loomis Retail Assumptions
Retail Assumptions Neighborhood Retail Other Retail % of Household Income Spent on Retail Category
16% 22%
Floor-to-Area Ratio (FAR) 0.25 0.25 Stabilized Vacancy Rate 10% 10% Retail Sales per SF $175 $225 Capture Rates: Town of Loomis 100% 75% Loomis Rural Area 0% 50% Granite Bay 0% 25% Lincoln Area 0% 5% Rocklin Area 0% 5% Land Uses: Neighborhood Commercial 100% 0%
Other Commercial 0% 100%
Source: US Dept of Labor Consumer Expenditure Survey; Urban Land Institute; Dollars & Cents of Shopping Centers; David Taussig & Associates 06/30/98
Table D-2: Town of Loomis - Future Retail Demand & Absorption
Future Retail Demand & Absorption
1998- 2000
2001- 2005
2006- 2010
2011- 2015
2016- 2020
Total
Total Demand for New Homes Town of Loomis 116 407 561 362 164 1,611Loomis Rural Area 231 815 1,122 725 329 3,221Granite Bay 518 712 1,014 626 184 3,054Lincoln Area 407 1,743 3,063 2,260 1,688 9,161Rocklin Area 1,885 2,522 2,627 2,590 2,689 12,313Total 3,156 6,199 8,387 6,563 5,054 29,359Average Household Income During Time Interval (1998$) Town of Loomis $58,267 $61,240 $64,364 $67,647 $71,097 Loomis Rural Area $75,246 $79,084 $83,118 $87,358 $91,814 Granite Bay $96,239 $101,148 $106,308 $111,731 $117,430 Lincoln Area $46,511 $50,105 $53,978 $58,149 $62,643 Rocklin Area $65,087 $68,407 $71,897 $75,564 $79,419 Total Demand for New Retail Space
Neighborhood Commercial (NC) 1 2 3 2 1 9
Other Commercial 3 8 12 8 4 35 Total Acres 4 10 15 10 5 44
Source: Sacramento Area Council of Governments: Projections 1995-2020; California Department of Finance;

Appendix D August 1998
151
National Decision Systems; David Taussig & Associates 06/30/98

Appendix D August 1998
152
Table D-3: Description of Employment Categories
Employment Category
Typical Use
Retail General merchandise; groceries; apparel and accessories; home furnishings and equipment; building materials, hardware, and garden supply; repair services; automotive dealers and service stations; restaurants; theaters and other forms of recreation/amusement; personal services (e.g., dry cleaners, hair stylists); hotels/motels
Education K-12 schools; junior colleges; technical institutes and vocational schools; libraries Office and Business Park
Finance, insurance, and real estate; business services; legal services; certain construction contractors and trade operators; engineering, accounting research, management, and related services; certain transportation, utilities, communications, and related services; City, County, and other public agency services
Medical Hospitals; HMOs; medical/dental clinics and labs; nursing and personal care facilities; specialty outpatient facilities
High-Tech Computer hardware/software research, development, production, and service/support; genetic engineering and R&D
Light Industrial
Warehousing and storage; packaging; distribution; industrial services; light manufacturing; certain transportation, utilities, communications, and related services
General Industrial
Manufacturing; heavy machinery and equipment; food processing; certain construction contractors and trade operators
Source: Standard Industrial Classification (SIC) Codes; David Taussig & Associates 06/30/98
Table D-4: Town of Loomis Job Distribution
Employment Category
General Land Use Categories
SF per Employee
Floor Area Ratio
Vacancy Rate
Jobs Per Acre
Estimated Job 1998
Distribution Retail1 Neighborhood
Commercial Other Commercial
400 0.25 10.0% 25 298 17.7%
Education1 Schools NAp NAp NAp NAp 282 16.8%Office / Business Park
Other Commercial (25%) Business Park (75%)
350 0.30 7.5% 35 564 33.6%
Medical Other Commercial 250 0.25 7.5% 40 29 1.7%High-tech Business Park 500 0.35 7.5% 28 0 0.0%Light Industrial Light Industrial 1,000 0.40 5.0% 17 292 17.4%General Industrial
General Industrial 750 0.40 5.0% 22 215 12.8%
Total 1,679 100.0% 1 Retail acreage calculated separately based on housing units; school acreage not determined as part of this analysis. Source: Sacramento Area Council of Governments; National Decision Systems; Bishop Hawk; Grubb & Ellis; David Taussig & Associates

Appendix D August 1998
153
Table D-5: Town of Loomis Future Office/Industrial Demand & Absorption
Future Office/Industrial Demand & Absorption
1998-2000
2001- 2005
2006- 2010
2011- 2015
2016- 2020
Total
Total Employment Growth 247 624 774 528 409 2,582 Distribution of Employment Growth As of 1998 As of 2020Retail 17.7% 40% 39% 47% 46% 30% 32.1%Education 16.8% 0% 4% 5% 0% 0% 8.1%Office / Business Park 33.6% 46% 26% 21% 14% 17% 26.9%Medical 1.7% 2% 2% 3% 4% 5% 2.6%High-tech 0.0% 0% 4% 5% 6% 7% 2.9%Light Industrial 17.4% 6% 20% 14% 24% 32% 18.7%General Industrial 12.8% 6% 5% 5% 6% 9% 8.6%Total 100% 100% 100% 100% 100% 100% 100% Total Demand for New Office and Industrial Space
Other Commercial 1 1 2 1 1 6Business Park 2 4 5 3 3 17Light Industrial 1 8 7 8 8 31General Industrial 1 1 2 1 2 7Total Acres 5 15 15 13 13 61
Source: Sacramento Area Council of Governments; National Decision Systems; David Taussig & Associates 06/30/98

Appendix D August 1998
154
Table D-6: Town of Loomis Estimated Demand for Non-Residential Acreage 1998-2020
Land Use Designations
Retail
Demand
Office
Demand
Light Industrial Demand
General Industrial Demand
Total
Demand Commercial Neighborhood Commercial 9 9Other Commercial 35 6 41Subtotal 44 6 0 0 50 Industrial Business Park 17 17Light Industrial 31 31General Industrial 7 7Subtotal 0 17 31 7 55 Total Acres 44 23 31 7 105
Source: David Taussig & Associates 06/30/98