acoustic teledetection of sea-bottom … · acoustic teledetection of sea-bottom structures in the...
TRANSCRIPT
Bulletin de la Société belge de Géologie
Bulletin van de Belgische Vereniging voor Geologie
pp. 199-210bh. 199-210
Bruxelles 1988
Brussel 1988
ACOUSTIC TELEDETECTION OF SEA-BOTTOMSTRUCTURES IN THE SOUTHERN BIGHT
by G. DE.MOOR& J. LANCKNEUS(0)
ABSTRACT - Tbe sea-bottom relief in the area of the Flemish Banks has been stu-
died with the help of a side-scan sonar. A description of all detected bedformsis given and an isometrie map of the recorded features is presented. Finallya residual sedimentdynamic analysis is made based on the geometrie characteris-tics of the sea-bottom structures.
RESUME - Le relief sous-marin des Bancs de Flandre a été étudié à l'aide d'un
sonar à balayage latéral. Une description morphologique des structures détec-
tées est donnée et une carte isométrique des formes enregistrées est présentée.
Une analyse de la dynamique sédimentaire résiduelle est faite basée sur les
caractéristiques géométriques des structures sous-marines.
SAMENVATTING - Het zeebodemreliëf van de Vlaamse Banken werd bestudeerd met
behulp van een side scan sonar. Een beschrijving van alle gedetecteerde re-
liëfsvormen wordt gegeven en een isometrische kaart van de geregistreerde struk-
turen wordt voorgesteld. Een residuele sediment dynamische analyse wordt ge-
maakt steunende op de geometrische karakteristieken van de zeebodemstrukturen.
KEY-WORDS - Flemish Banks, North Sea, side-scan sonar, sedimentdynamies, marine
geomorphology.
MOTS-CLES - Bancs de Flandre, Mer du Nord, sonar à balayage latéral, dynamiquedes sédiments, géomorphologie marine.
SLEUTELWOORDEN - Vlaamse Banken, Noordzee, side scan sonar, sedimentdynamiek,
mariene geomorfologie.
1. INTRODUCTION
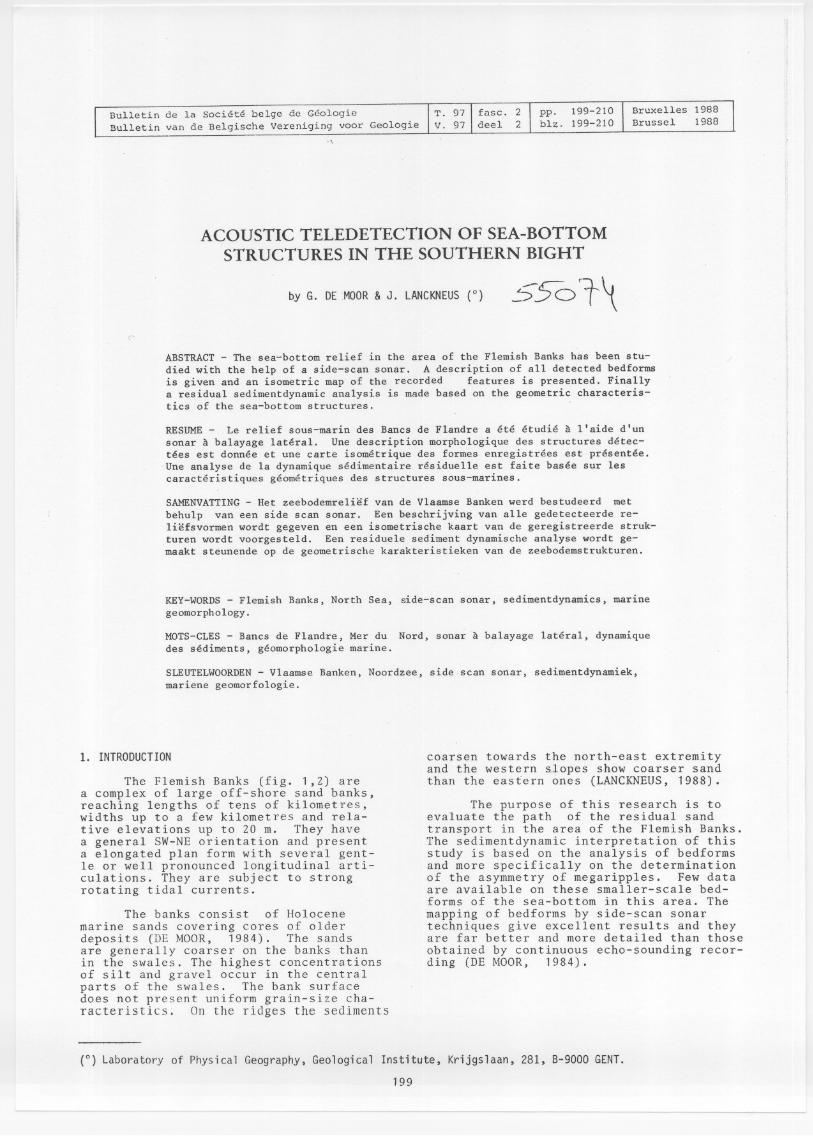
Thc Flemish Banks (fig. 1,2) area complex of large off-shore sand banks,reaching lengths of tens of kilometres,widths up to a few kilometres and rela-tive elevations up to 20 m. They havea general SW-NE orientation and presenta elongated plan form with several gent-le or weIl pronounced longitudinal arti-culations. They are subject to strongrotating tidal currents.
The banks consist of Holocenemarine sands covering cores of olderdeposits (DE MOOR, 1984). The sandsare generally coarser on the banks thanin the swales. The highest concentrationsof silt and gravel occur in the centra Iparts of the swales. The bank surfacedoes not present uniform grain-size cha-racteristics. On the ridges the sediments
coarsen towards the north-east extremityand the western slopes show coarser sandthan the eastern ones (LANCKNEUS,1988).
The purpose of this research is toevaluate the path of the residual sandtransport in the area of the Flemish Banks.The sedimentdynamic interpretation of thisstudy is based on the analysis of bedformsand more specifically on the determinationof the asymmetry of megaripples. Few dataare available on these smaller-scale bed-forms of the sea-bottom in this area. Themapping of bedforms by side-scan sonartechniques give excellent results and theyare far better and more detailed than thoseobtained by continuous echo-sounding recor-ding (DE MOOR, 1984).
(0) Laboratory of Physical Geography, Geological Institute, Krijgslaan, 281, 8-9000 GENT.
199
------
NORTH SEA
oGhent
oI
45km,
Fig. 1 - Situation of the Flemish Banks in the SouthernBight.
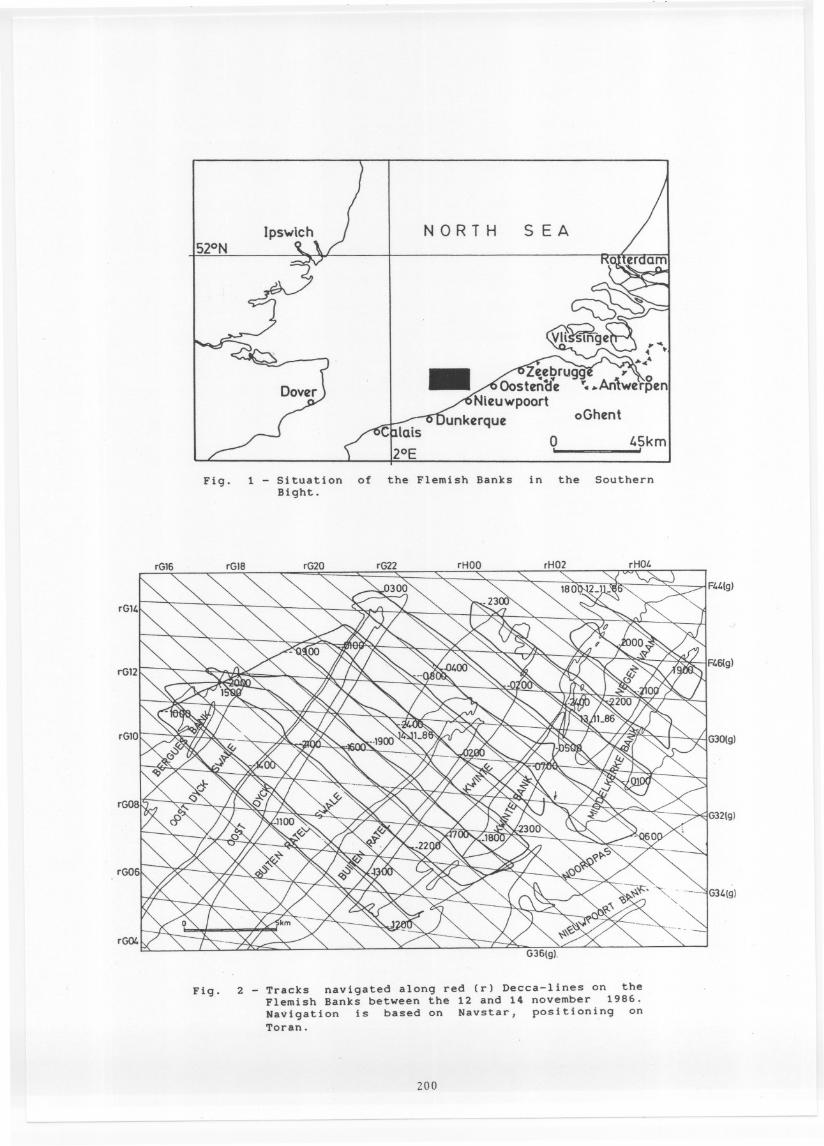
Fig. 2 - Tracks navigated along red (r) Decca-lines on theFlemish Banks between the 12 and 14 november 1986.Navigation is based on Navstar, positioning onToran.
200
2. PRINCIPLEOFTHESIDE-SCANSONAR
The side-scan sonar technique(LEENHARDT, 1974) can be consideredas an acoustic analog to aerial photo-graphy although there are marked dif-fences in information content. Theside-scan sonar registration allows todevelop a plan view of the relief of thesea-floor and to detect its texture-(BELDERSON et al., 1972).
Basically the side-scan sonarsystem consists of three units : atransducer which forms the underwaterunit (the tow-fish),a steel wire rein-forced cable acting as transmission andtow cable and a dual channel recorder.
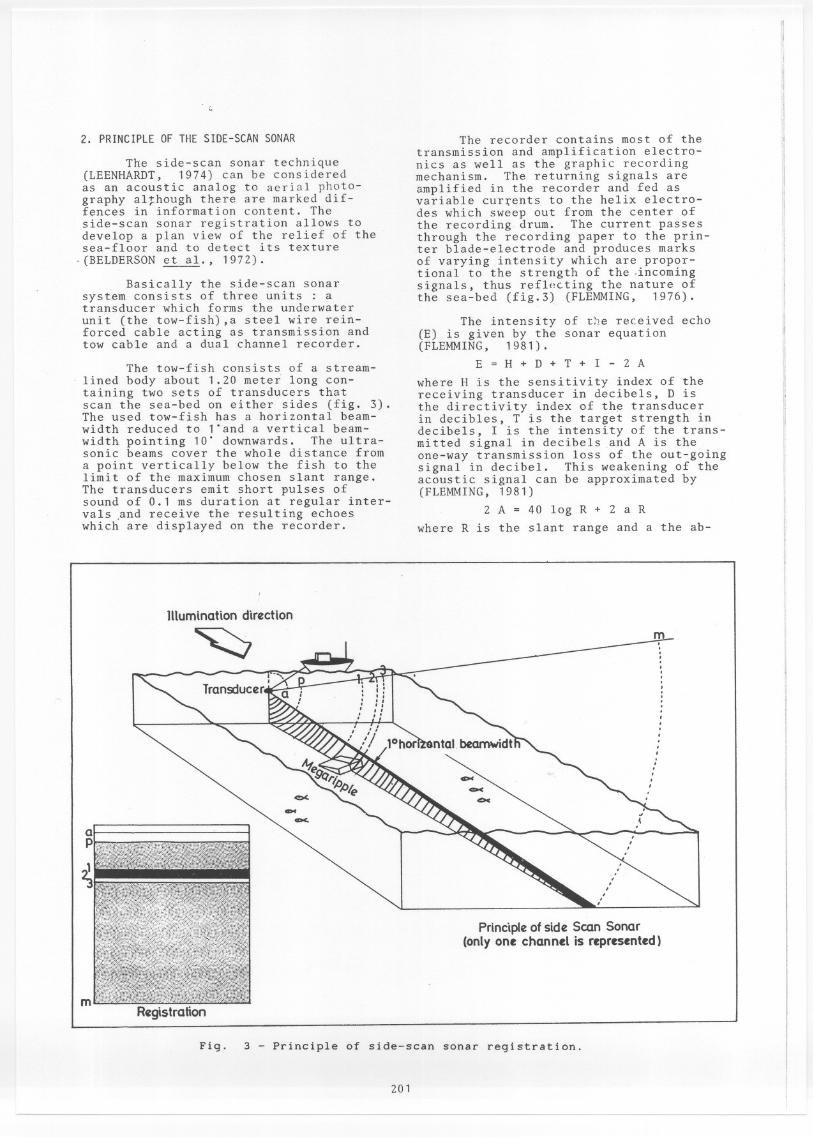
The tow-fish consists of a stream-lined body about 1.20 meter long con-taining two sets of transducers thatscan the sea-bed on either sides (fig. 3).The used tow-fish has a horizontal beam-width reduced to 1'and a vertical beam-width pointing 10' downwards. The ultra-sonic beams cover the whole distance froma point vertically below the fish to thelimit of the maximum chosen slant range.The transducers emit short pulses ofsound of 0.1 ms duration at regular inter-vals ~nd receive the resulting echoeswhich are displayed on the recorder.
JUumtnationdirect ton
The recorder contains most of thetransmission and amplification electro-nics as weIl as the graphic recordingmechanism. The returning signals areamplified in the recorder and fed asvariabie cur{ents to the helix electro-des which sweep out from the center ofthe recording drum. The current passesthrough the recording paper to the prin-ter blade-electrode and produces marksof varying intensity which are propor-tional to the strength of the .incomingsignais, thus reflncting the nature ofthe sea-bed (fig.3) (FLEMMING, 1976).
The intensity of the received echo(E) is given by the sonar equation(FLEMMING, 1981).
E = H + D + T + I - 2 A
where H is the sensitivity index of thereceiving transducer in decibels, D isthe directivity index of the transducerin decibles, T is the target strength indecibels, I is the intensity of the trans-mitted signal in decibelsand A is theone-way transmission 1055 of the out-goingsignal in decibel. This weakening of theacoustic signal can be approximated by(FLEMMING, 1981)
2 A = 40 log R + 2 a R
where R is the slant range and a the ab-
Registration
Principle of side Scan Sonar(only onc channcl is rcprcscntcd)
Fig. 3 - Principle of side-scan sonar registration.
--
201
----
," ,":'.., L' t l l \..it.. l.. ~ I:':'l ':l =L
J\S-:OESO 20 AZ. 1OO6T 100. ., " rt. ... .. ... "1(' , ..,
.; r~ , o.o.\." l-.:,;:t i ",,"!.' t..;. ...
~~ii=~~
::.:=:::::=:::::=:!:::~~::===:::=:::::::::::=:::::::,~ ; t~..
... .',
.~:::j::::::~::::::::::::::::E::::::::::::::::::::::::i~:::::::::::T::::::::::::::::::::::::::::::::::::::::::E:::::
~ 1' :: +.--.--..---..--.-....--.------.-...........-............--.-------.-----.-.----.---....-----.--......-......-......................--........
.
~ Olo" ,.:..:- '~."-~. '. - "
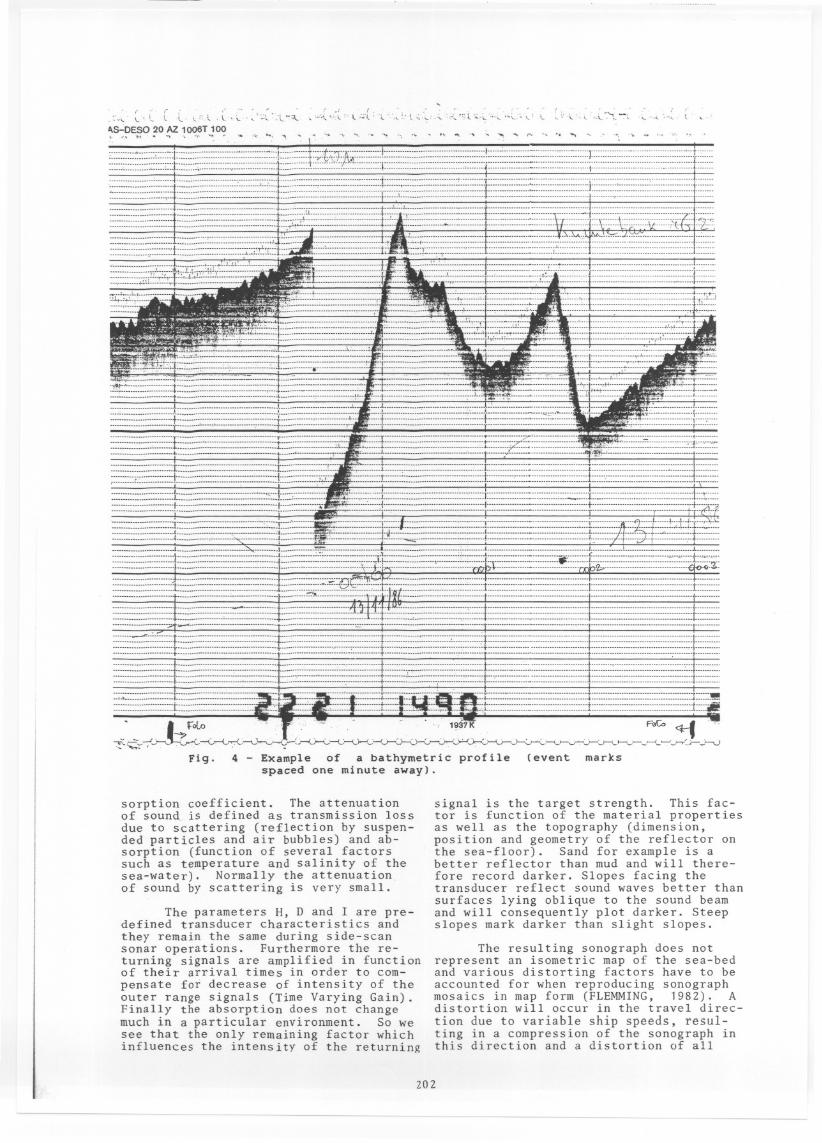
Fig. 4- Example of a bathymetric profilespa eed one minute away).
sorption coefficient. The attenuationof sound is defined as transmission lossdue to scattering (reflection by suspen-ded partieles and air bubbles) and ab-sorption (function of several factorssueh as temperature and salinity of thesea-water). Normally the attenuationof sound by scattering is very smal1.
The parameters H, D and I are pre-defined transducer characteristics andthey remain the same during side-scansonar operations. Furthermore the re-turning signals are amplified in functionof their arrival times in order to com-pensate for decrease of intensity of theouter range signals (Time Varying Gain).Finally the absorption does not changemuch in a particular environment. So wesee that the only remaining factor whichinfluences the intensity of the returninR
(event mar)cs
signal is the target strength. This fac-tor is function of the material propertiesas weIl as the topography (dimension,position and geometry of the reflector onthe sea-floor). Sand for example is abetter reflector than mud and will there-fore record darker. Slopes facing thetransducer reflect sound waves better thansurfaces lying oblique to the sound beamand will consequently plot darker. Steepslopes mark darker than slight slopes.
The resulting sonograph does notrepresent an isometrie map of the sea-bedand various distorting factors have to beaccounted for when reproducing sonographmosaics in map form (FLEMMING, 1982). Adistortion will occur in the travel direc-tion due to variabie ship speeds, resul-ting in a compression of the sonograph inthis direction and a distortion of all
Z02
linear displays. Furthermore due to thcobliquity of the sonar beam, equal truc-distance intervalIs will not follow alinear scale on the sonograph. The short-range intervals are compressed and thcfar-range intervals slightly stretched.
3. SIDE-SCAN SONAROPERATIONS
The sonographs of the Flemish Bankshere presented were obtained during asurvey in november 1986 with the oceano-graphic vessel Belgica. The superficialsea-bottom structures were recorded withthe help of a KLEIN two-channel side-scanrecorder (model 521 T) connectedwith a100 kHz transducer.Ouring the operationsa slant range of 100 m was continuouslyused. Event marks were spaced 1 minuteaway. The fish was towed on starboardand was lowered 5 meters under the water-surface. A ship speed of 4.5 knots wascontinuously maintained.
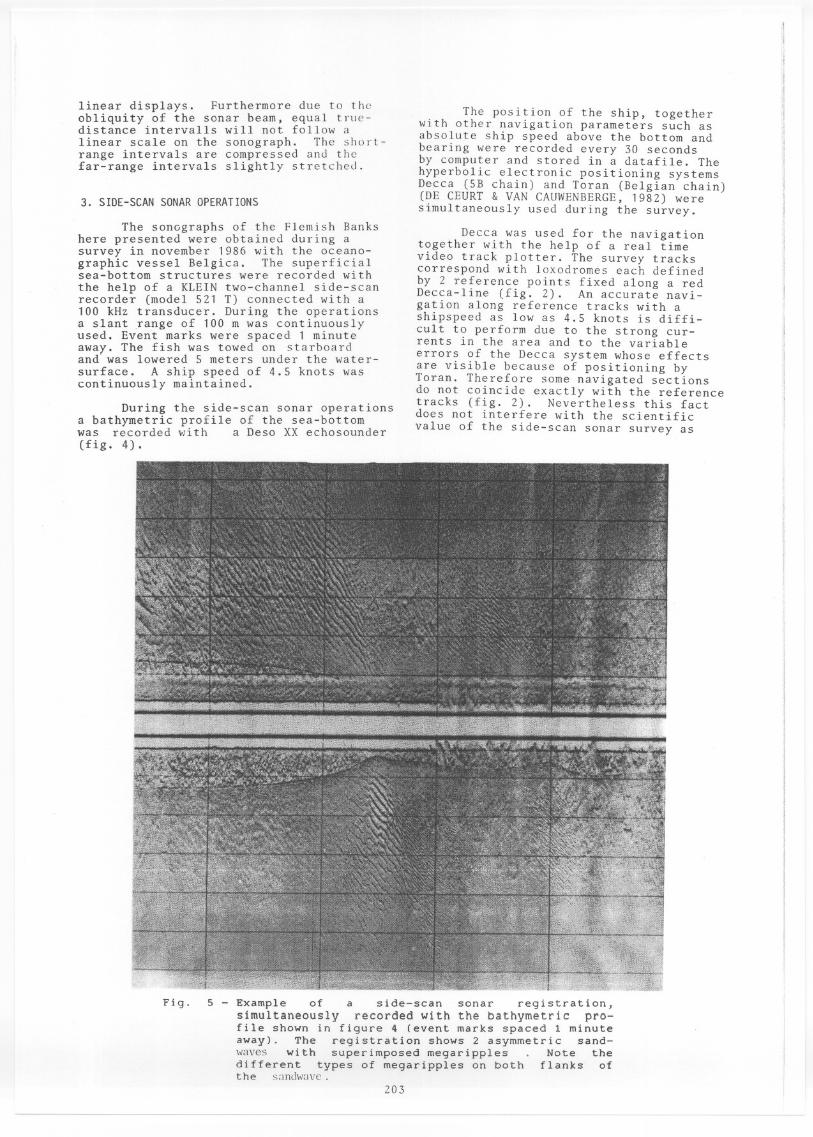
Ouring the side-scan sonar operationsa bathymetric profile of the sea-bottomwas recorded with a Oeso XX echosounder(fig. 4).
The position of the ship, togetherwith other navigation parameters such asabsolute ship speed above the bottom andbearing were recorded every 30 secondsby computer and stored in a datafile. Thehyperbolic electron ic positioning systemsOecca (SB chain) and Toran (Belgian chain)(OE CEURT & VAN CAUWENBERGE, 1982) weresimultaneously used during the survey.
Oecca was used for the navigationtogether with the help of a real timevideo track plotter. The survey trackscorrespond with loxodromes each definedby 2 reference points fixed along a redOecca-line (fig. 2). An accurate navi-gation along reference tracks with ashipspeed as low as 4.5 knots is diffi-cult to perform due to the strong cur-rents in the area and to the variabieerrors of the Oecca system whose effectsare visible because of positioning byToran. Therefore some navigated sectionsdo not coincide exactly with the referencetracks (fig. 2). Nevertheless this factdoes not interfere with the scientificvalue of the side-scan sonar survey as
Fig. 5 Example of a side-sean sonar registration,simultaneously recorded with the bathymetric pro-file shown in figure 4 (event marks spaeed 1 minuteawayJ. The registration shows 2 asymmetrie sand-waves with superimposed megaripples Note thedifferent types of megaripples on both flanks ofthe sandwave.
203
DECCA-NET: ENGLISH NET SB
SW-CORNER:(uTM31) [ 1175831N 5683546OR(6EO): N 51 18.10 E 02 39.20
PROJECTION: UTM
1.0 KMo
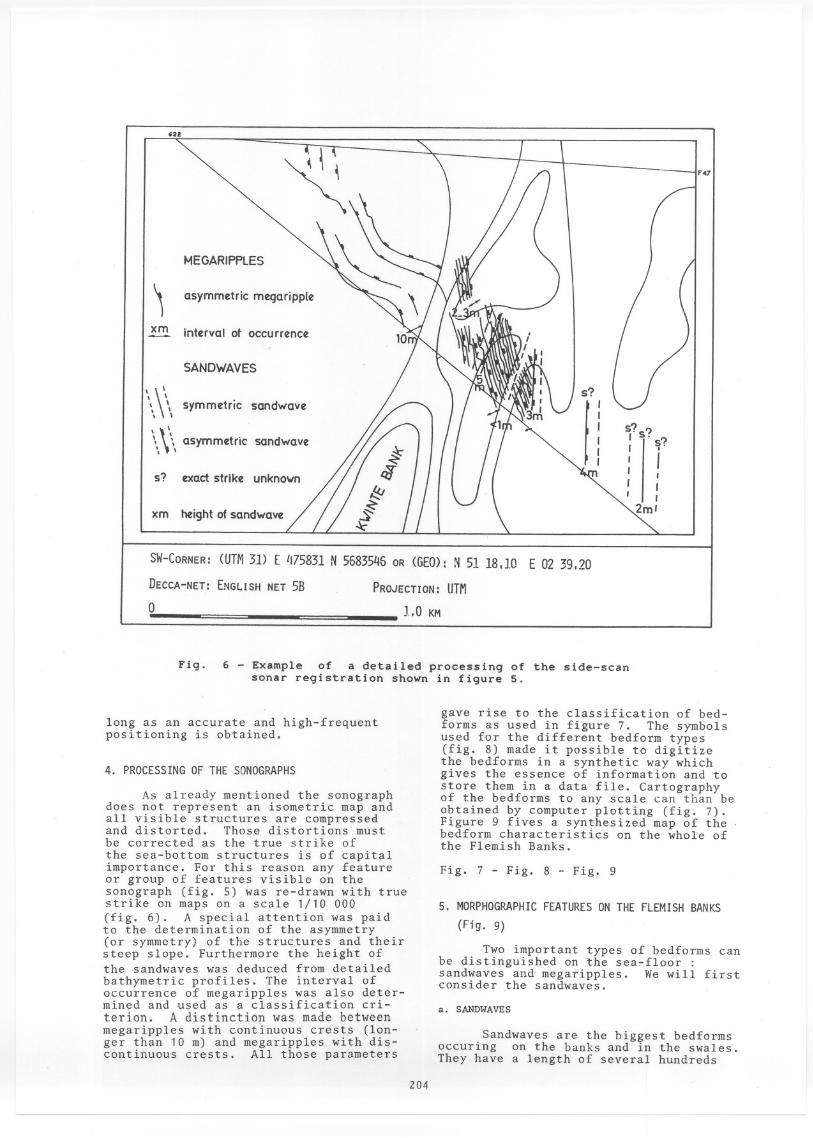
Fig. 6 - Example of a detailed processing of the side-scansonar registration shown in figure 5.
long as an accurate and high-frequentpositioning is obtained.
4. PROCESSINGOF THE SONOGRAPHS
As al ready mentioned the sonographdoes not represent an isometrie map andall visible structures are compressedand distorted. Those distortions mustbe corrected as the true strike ofthe sea-bottom structures is of capitalimportance. For this reason any featureor group of features visible on thesonograph (fig. 5) was re-drawn with truestrike on maps on ascale 1/10 000(fig. 6). A special at tent ion was paidto the determination of the asymmetry(or symmetry) of the structures and theirsteep slope. Furthermore the height ofthe sandwaves was deduced from detailedbathymetric profiles. The interval ofoccurrence of megaripples was also deter-mined and used as a classification cri-terion. A distinctionwas made between
megaripples with continuous crests (lon-ger than 10 m) and megaripples with dis-continuous crests. All those parameters
gave rise to the classificationof bed-forms as used in figure 7. The symbolsused for the different bedform types(fig. 8) made it possible to digitizethe bedforms in a synthetic way whichgives the essence of information and tostore them in a data file. Cartographyof the bedforms to any scale can than beobtained by computer plotting (fig. 7).Figure 9 fives a synthesizedmap of thebedform characteristicson the whole ofthe Flemish Banks.
Fig. 7 - Fig. 8 - Fig. 9
5. MORPHOGRAPHICFEATURESON THE FLEMISH BANKS
(Fig. 9)
Two important types of bedforms canbe distinguished on ~he sea-floor :
sandwaves and megaripples. We will firstconsider the sandwaves.
a. SANDWAVES
Sandwaves are the biggest bedformsoccuring on the banks and in the swales.They have a length of several hundreds
204
MEGARIPPlES
asymmetriemegaripple
xm interval ot oeeurrenee
SANDWAVES
'\' \
, '. symmetrie sandwave'. \
'\ #/:)1/1 /r t ;
S?s?\ ... asymmetrie sandwave
: r!f?\ ,
I Is? exact strike unknown //1 qj 1 1 1 1 I {
III
/ / / 1 1 I "-/ \ '"
xm height of sandwave
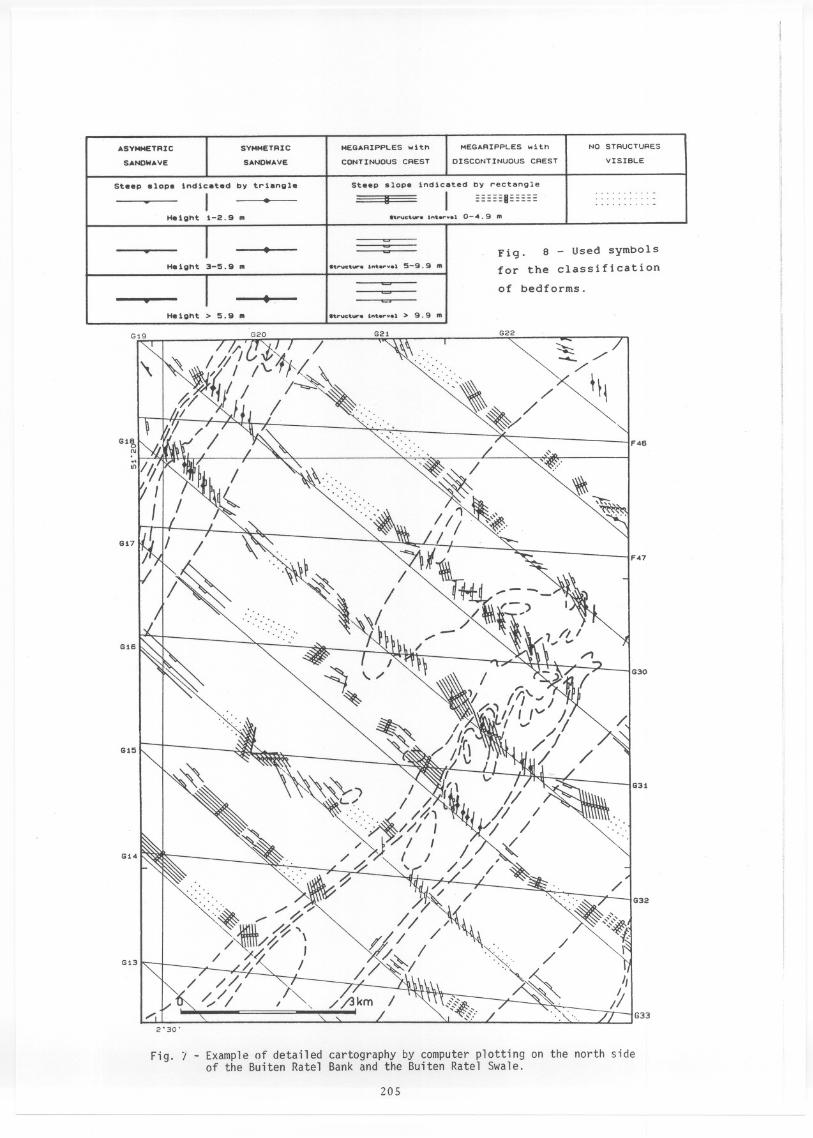
Fig. 'i - Exampleof detailed cartography by computer plotting on the north sideof the Buiten Ratel Bank and the Buiten Ratel Swale.
205
ASYMMETRIC SYMMETRIC MEGARIPPLES w1th MEGARIPPLES w1th NO STRUCTURES
SANOWAVE SANOWAVE CONTINUOUS CREST OlSCONTINUOUS CREST VISIBLE
St.." 810". 1nd1e.t.d Dy tr1.ngl. St.." 810". 1nd1e.ted Dy reetangle
I " I =====11=====.......... M
- 8 .......... -.......... .
H81ght 1-2.9 IR h"'ct..... '"'er"81 0-.. 9 m
I
-- . - Fig. 8 - Used symbols
H81ght 3-15.9 IR .YC''''''. 'n'.""".15-9.9 In for the classification
I
-of bedforms.-- .. -
H81ght > 15.9 IR .vuetw. 1"'.....,.1 > 9.9 rn
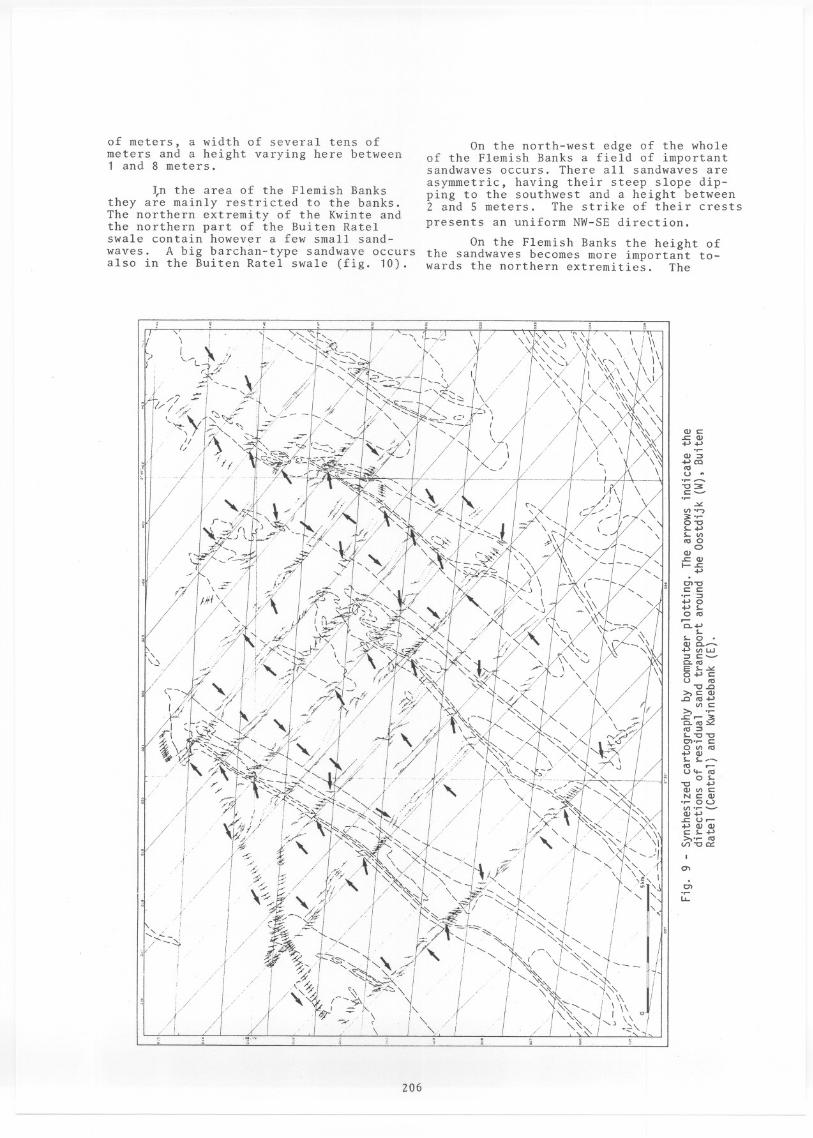
of meters, a width of several tens ofmeters and a height varying here between1 and 8 meters.
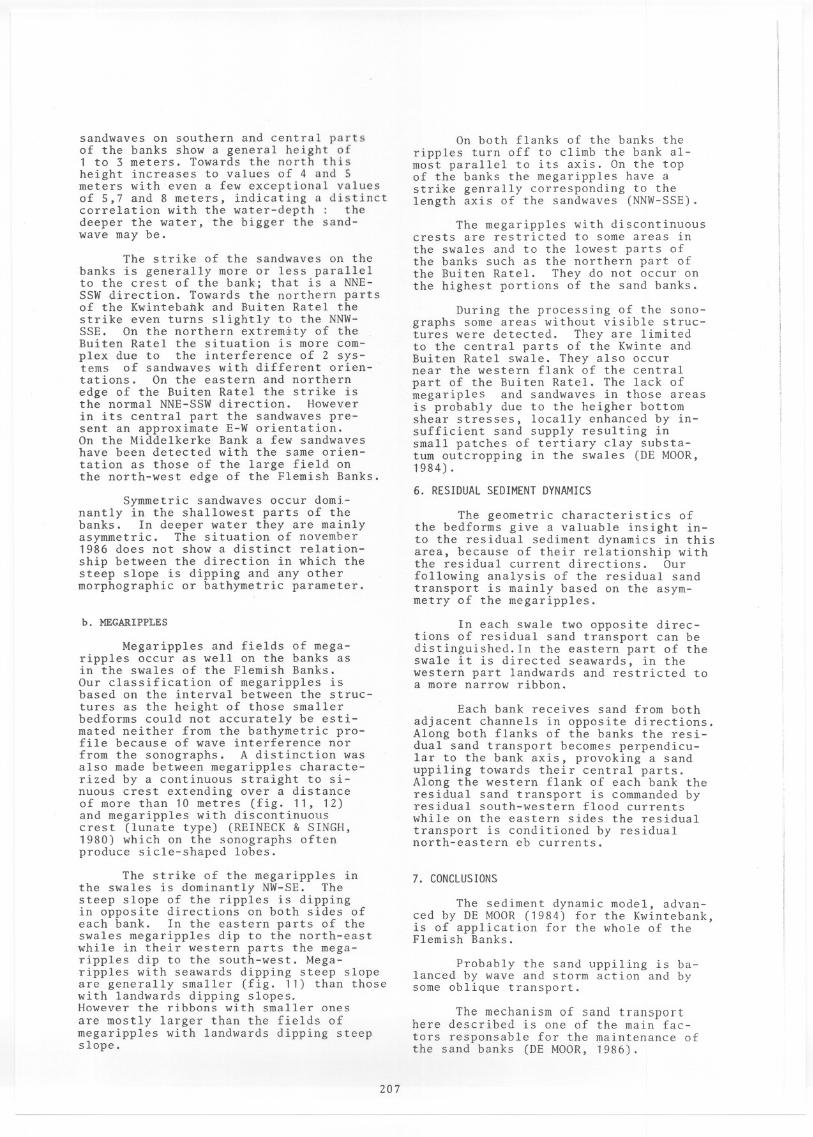
~n the area of the Flemish Banksthey are mainly restrieted to the banks.The northern extremity of the Kwinte andthe northern part of the Buiten Ratelswale eontain however a few small sand-waves. A big barehan-type sandwave oeeursalso in the Buiten Ratel swale (fig. 10).
On the north-west edge of the wholeof the Flemish Banks a field of importantsandwaves oeeurs. There all sandwaves areasymmetrie, having their steep slope dip-ping to the southwest and a height between2 and 5 meters. The strike of their erests
presents an uniform NW-SE direetion.
On the Flemish Banks the height ofthe sandwaves beeomes more important to-wards the northern extremities. The
QJS:::.s:::.QJ..........
"
t
'
l
/1
't l '
jLI
~/ ~~' /
~1
2!~.' " i _', \ ' \ '"
~ ./I
' /- -- --- - .~...:./ ' / I \ \ '"C::J:
I / .~""-'""'"
"'.....3:....O'"Cs.......
s..","'0o
QJ.s:::.QJ
I- .s:::.
.....
O>'"CS:::S:::
~0s..
0'"0......
s..
s..oQJ 0._
"'.....~s:::-e;,,,,es.."",
/j?
--'
.1:'; '.
;r' ,_F.. (/
~ "%.
~/-:
~'''~~'[' //
1
'--'
XI/I
'
i I
8 ~/ ,-_ l' '- '. '/ ~~_\ / .',s." ,-'/ \ / '"C.Q;0' ,"- / / ('_ ./ " _ c C1J
.r , V / / , -:,IJ _/r , , . .', ,. / .. /;C , / 1i '" .....
"'s:::>, ....
"É.';ö~"'~s..'"C'"C
O').r-c:::0"''''
QJs..s..-'" r-u<+-'"
os..'"C .....QJ",S:::
!t V ~j' f1f'?" ~ /1 ,U,'I /X.I""~ I 'J::.-.L II.~ §~U')-r--QJ......s:::.Ur-
QJQJs:::s.......
: 'f"// IK '/'>""'; ~: '1/
I1/'~ , J '\, 1/, \',11
>, '"1 -U. 1/' _ / "-,,, ; " 'V. y '" . .' k V')~o::
f '~ ~ /l~~/1r~'
I~~'"
~'~I//
. 1I
'''-'
{
I\)~ ~
II
~'
\-::;.~,/ IJ/' /'\~ . \ ~,,' I "~I'J.~
I
i ~~. '" ,,t- -- ,\"~-' \- ,/---":::-.", I, . ". LL.;; L
fI
'-" ;
), ~; ; ,I' ?(~, f~'~..J'\\ /f ... ! " [~\\..I, '~ 1 "- - IJ
, ,/ I J~' , ~~l--. y~ I I 1'<'~ J ,~{ ~i'IIf
o!/
/l /I /
.Qif":Ti
206
sandwaves on southern and central partsof the banks show a general height of1 to 3 meters. Towards the north thisheight increases to values of 4 and 5meters with even a few exceptional vnluesof 5,7 and 8 meters, indicating n distinctcorrelation with the water-depth: thedeeper the water, the bigger the sand-wave may beo
The strike of the sandwaves on thebanks is generally more or less parallelto the crest of the bank; that is a NNE-SSW direction. Towards the northern partsof the Kwintebank and Buiten Ratel thestrike even turns slightly to the NNW-SSE. On the northern extrem&ty of theBuiten Ratel the situation is more com-plex due to the interference of 2 sys-tems of sandwaves with different orien-tations. On the eastern and northernedge of the Buiten Ratel the strike isthe normal NNE-SSW direction. Howeverin its centra1 part the sandwaves pre-sent an approximate E-W orientation.On the Middelkerke Bank a few sandwaveshave been detected with the same orien-tation as those of the large f~eld onthe north-west edge of the Flemish Banks.
Symmetric sandwaves occur domi-nantly in the shallowest parts of thebanks. In deeper water they are mainlyasymmetric. The situation of november1986 does not show a distinct relation-ship between the direction in which thesteep slope is dipping and any othermorphographic or bathymetric parameter.
b. MEGARIPPLES
Megaripples and fields of mega-ripples occur as welIon the banks asin the swales of the Flemish Banks.Our classification of megaripples isbased on the interval between the struc-tures as the height of those smallerbedforms could not accurately be esti-mated neither from the bathymetric pro-file because of wave interference norfrom the sonographs. A distinction wasalso made between megaripples characte-rized by a continuous straight to si-nuous crest extending over a distanceof more than 10 metres (fig. 11, 12)and megaripples with discontinuouscrest (lunate type) (REINECK & SINGH,1980) which on the sonographs oftenproduce sicle-shaped lobes.
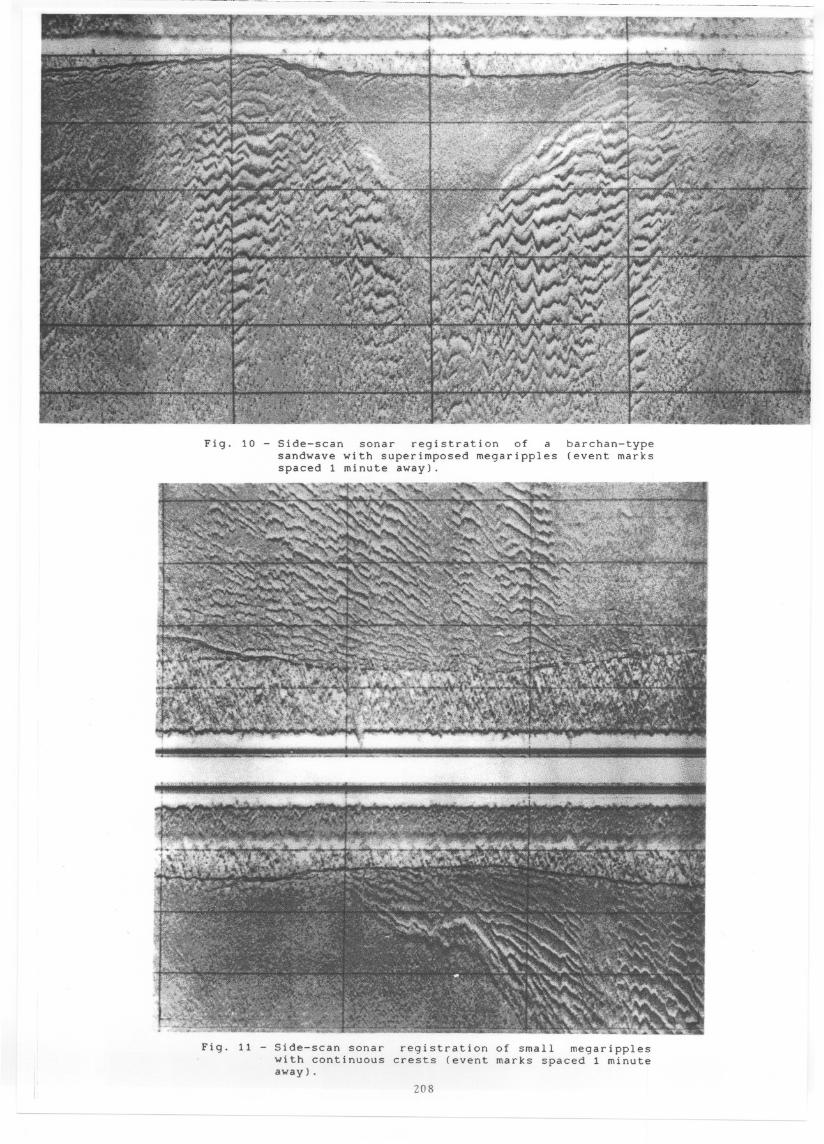
The strike of the megaripples inthe swales is dominantly NW-SE. Thesteep slope of the ripples is dippingin opposite directions on both sides ofeach bank. In the eastern parts of theswales megaripples dip to the north-eastwhile in their western parts the mega-ripples dip to the south-west. Mega-ripples with seawards dipping steep slopeare generally smaller (fig. 11) than thosewith landwards dipping slopes.However the ribbons with smaller onesare mostly larger than the fields ofmegaripples with landwards dipping steepslope.
On both flanks of the banks theripples turn off to climb the bank al-most parallel to its axis. On the topof the banks the megaripples have astrike genrally corresponding to thelength axis of the sandwaves (NNW-SSE).
The megaripples with discontinuouscrests are restricted to some areas inthe swales and to the lowest parts ofthe banks sueh as the northern part ofthe Buiten Ratel. They do not occur onthe highest portions of the sand banks.
During the processing of the sono-graphs some areas without visible struc-tures were detected. They are limitedto the central parts of the Kwinte andBuiten Ratel swale. They also occurnear the western flank of the centralpart of the Buiten Ratel. The lack ofmegariples and sandwaves in those areasis probably due to the heigher bottomshear stresses, locally enhanced by in-sufficient sand supply resulting insmall patches of tertiary clay substa-turnouteropping in the swales (DE MOOR,1984).
6. RESIDUALSEDIMENTDYNAMICS
The geometrie characteristics ofthe bedforms give a valuable insight in-to the residual sediment dynamics in thisarea, because of their relationship withthe residual current directions. Ourfollowing analysis of the residual sandtransport is mainly based on the asym-metry of the megaripples.
In each swale two opposite direc-tions of residual sand transport can bedistinguished.In the eastern part of theswale it is directed seawards, in thewestern part landwards and restricted toa more narrow ribbon.
Each bank receives sand from bothadjacent channels in opposite directions.Along both flanks of the banks the resi-dual sand transport becomes perpendicu-lar to the bank axis, provoking a sanduppiling towards their central parts.Along the western flank of each bank theresidual sand transport is commanded byresidual south-western flood currentswhile on the eastern sides the residualtransport is conditioned by residualnorth-eastern eb currents.
7. CONCLUSIONS
The sediment dynamic model, advan-eed by DE MOOR (1984) for the Kwintebank,is of application for the whole of theFlemish Banks.
Probably the sand uppiling is ba-lanced by wave and storm action and bysome oblique transport.
The mechanism of sand transporthere described is one of the main fac-tors responsabIe for the maintenance ofthe sand banks (DE MOOR, 1986).
207
..- .---.------------------ .r l.. 0l<' t, sh ~ ...'0_'
~..,.-_w
Fig. 10 - side-scan sonar registration of asandwave with superimposed megaripplesspaeed 1 minute away).
barchan-type(event marks
Fig. 11 - Side-scan sonarwith continuousaway) .
registration of smal1 megaripplescrests (event marks spaeed 1 minute
208

Fig. 12 - Side-scan sonar registration of large megarippleswith continuous crests (event marks spaeed 1 minuteaway).
Fig. 13 - Situation of the side-scan sonar registrations shownon fig. 5, 10, 11 and 12.
209

This cartographic synthesis ofsand transport paths suggest that twohigher level sand transport mechanismsare involved : a sand supply and reworkingmechanism bound to each of the banks and amore'regional sand transport mechanism pro-cessing sands arround the field of theFlemish Banks itself.
ACKNOWLEDGMENTS
This research has been supported bythe Belgian Ministry of Science Policy andby the Management Unit of the MathematicalModel North Sea. Logistic support of theNational Fund for Scientific Research isgratefully acknowledged. Finally the wri-ters wish to thank the whole crue of theoceanographic vessel Belgica for theirhelp during the campaigns.
REFERENCES
BELDERSON, R.H., KENYON,N.H., STRIDE, A.H. andSTUBBS,A.R. (1983) - Sonographs of the seafloor. A picture Atlas. Elsevier PublishingCompany, 185 p., 163 figs.
DE CEURT,F. en VANCAUWENBERGHE,c. (1982) -Het Radioplaatsbepalingsysteem Toran "Bel-gische Kust en aangrenzend gebied". Oostende,Dienst der Kust, Ministerie van OpenbareWerken, rapport nr. 25 van de HydrografischeDienst der Kust, 18 p.
DE MOOR,G. (1984) - Morfodynamiek en sediment-dynamiek rond de Kwintebank. Ministerie vanEconomische Zaken, Brussel, ~24 p., 4 vol.tab. en fig.
DE HOOR,G. (1985) - Shelfbank Horphology offthe Belgian coast. Recent methodological andscientific developments. - In : Van Holle,M. (ed.), Recent trends in physical Geogra-phy in Belgium. Liber Amicorum, L. PeetersV.U.B. Brussel. Study series of the VrijeUniversiteit Brussel, New Series nr. 20,149-184, 24 fig.
DEHOOR,G. (1985) - Present day morphodynamicson the Kwintebank and their meaning for theevolution of the Flemish Banks. - In : VanGrieken, R. and Wollast, R., Progress inBelgian Oceanographic Research. Brussel,Belgian Academy of Sciences, 102-113, 5 fig.
DE HOOR,G. (1986) - Geomorfologisch Onderzoekop het Belgisch Continentaal Plat. Tijdschriftvan de Belg. Ver. Aardr. Studies (BEVAS -SOBEG), 2, 133-174.
DE HOOR,G. (1987) - Numerical data about presentday sediment dynamics on the Flemish Banks(Southern Bight, North Sea). - Brussel, IFAC,Symposium on Applied Quaternary GeologyGEOBOUND.- In: Paepe, R. (ed.) SpecialPublication "Applied Quaternary Geology",15 p. (in press).
DE HOOR,G. (1987) - Maintenance on the FlemishBanks. - In : Henriet, J.P. and De Moor, G.(eds.) Tertiary and Quaternary Geology ofthe Southern Bight. Ghent, Renard CenterMarine Geology, 58 p. (in press).
FLEMHING, B.V. (1976) - Side-scan sonar : apractical guide. The International Hydro-graphic Review, vol. LIII, nr. I, 27 p.
FLEHHING, B.W. (1981) - Some implications ofvelocity variations and transmission lossesof underwater sound on image accuracy ofside-scan sQnar systems. Joint GeologicalSurvey, University of Cape Town, MarineGeoscience Unit, Technical Report nr. 12,153-159.
FLEMHING, B.W. (1982) - Causes and effects ofsonograph distortion and same graphicalmethods for their manual correction. - In :Russell-Cargill, W.G.A. (ed.), Recent de-velopments in side-scan sonar techniques(Chapter 5). Centra 1 Acoustics LaboratoryUniversity of Cape Town,l03-l38.
LANCKNEUS,J. (1988) - A comparative study ofsome charactersitics of superficial sedimentson the Flemish Banks. Int. Coll. Quat. Tert.Geology Southern Bight, Nörth Sea, Hay 1984,Geol. Instit., State University Ghent (inpress).
LEENHARDT,O. (1974) - Etude théorique du sonarlatéral. Revue Hydrographique Internationale,vol. 51 (1), 64-82.
REINECK,H.E. and SINGH, l.B. (1980) - Deposi-tional Sedimentary Environments. Sp~ingerVerlag, 549 p.
210