acwa annual conference · pdf fileacwa annual conference 2013 july 25th ... price...
TRANSCRIPT

ACWA Annual Conference 2013 July 25th
Mount Bachelor Village Resort, Bend Oregon
The Compelling Case for Natural Gas
Rick Wallace
Oregon Department of Energy Columbia Willamette Clean Cities Coalition

Columbia Willamette Clean Cities Coalition
• Public / Private Partnership • Contributes to the Environmental, Economic,
and Energy Security of the US • Dedicated to the Reduction of Petroleum
Consumption • Advance the use of: Alternative Fuels &
Vehicles, Idle Reduction & Hybrids • Over 90 Coalitions in the US

City of Beaverton NW Natural Gas City of Canby Oregon Department of Energy City of Eugene Oregon Department of Transportation City of Hillsboro Oregon Department of Environmental Quality City of Longview City Shop PAPE Kenworth City of Portland Port of Portland City of Salem Portland Community College Clark County Public Works Portland General Electric Coda Automotive Salem Keizer Transit CUB Policy Center Smokey’s CLN. NGV Tech Drive Oregon Springfield Utility Board Environmental Protection Agency Trans Energy Solutions Eugene Water & Electric Board Truck Modifications Systems EV 4 Oregon LLC Tualatin Hills Park & Recreation Gresham Sanitary Services Washington County Fleet Services Lane Transit District Western Bus Sales, Inc Linn Benton Community College Whole Energy Fuels McCoy Freightliner World CNG Metro Parks & Env. Services Art Ashton, Douglas Dunford, Northside Ford Truck Sales Chase Jackson, Dave Mayfield
Columbia-Willamette Clean Cities Coalition dues-paying members:

Oregon verse US Average Gas Prices for 2012

Why Alternatives • Oregon spent over $8 billion on gasoline and diesel
last year, over $6 billion of that money left our state. • In 2012 gasoline avg. $3.81/gal & diesel avg.
$4.11/gal • In 2000 the avg. OR household spent 3.31% of their
income on trans fuel, in 2012 they spent 7%. This continues to rise.
• Electricity, biofuels & natural gas are primarily domestic products, with a large share of electricity & biofuels produced in Oregon
• We need to diversify fuel sources in the transportation sector for our energy security
26%
19% 24%
31%
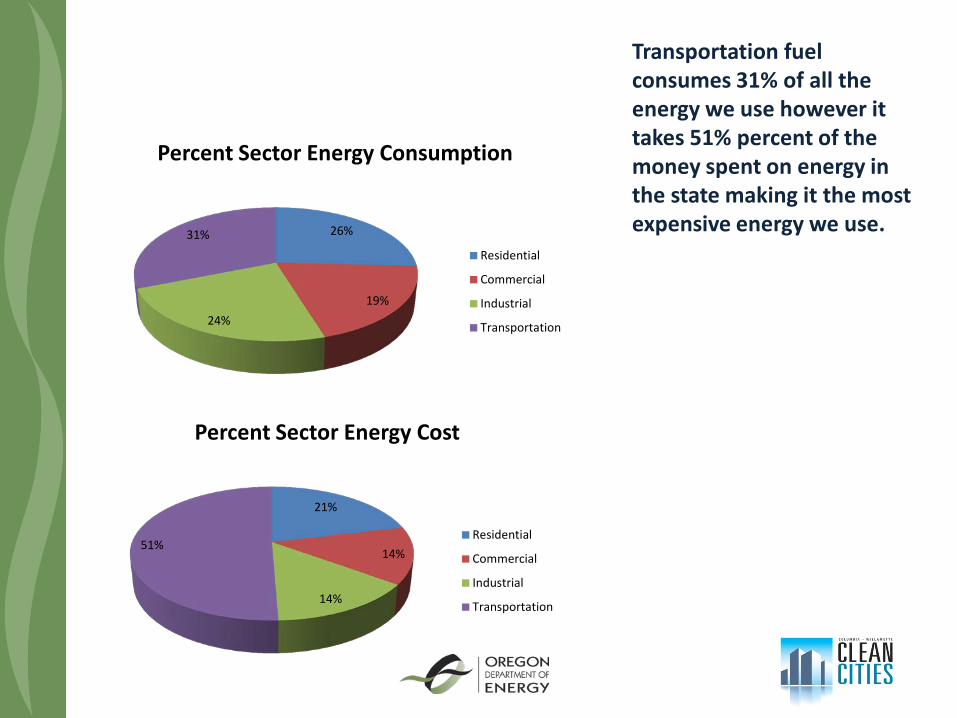
Percent Sector Energy Consumption
Residential
Commercial
Industrial
Transportation
21%
14%
14%
51%
Percent Sector Energy Cost
Residential
Commercial
Industrial
Transportation
Transportation fuel consumes 31% of all the energy we use however it takes 51% percent of the money spent on energy in the state making it the most expensive energy we use.

Consumption, Production & Imports
0
5
10
15
20
25
Mill
ions
of B
arre
ls p
er D
ay
US Petroleum
Liquid Fuels Consumed
Imports
U.S. Production
Expon. (Liquid Fuels Consumed)
Expon. (Imports)
Expon. (U.S. Production)
2005 2006 2007 2008 2009 2010 2011 2012 2013
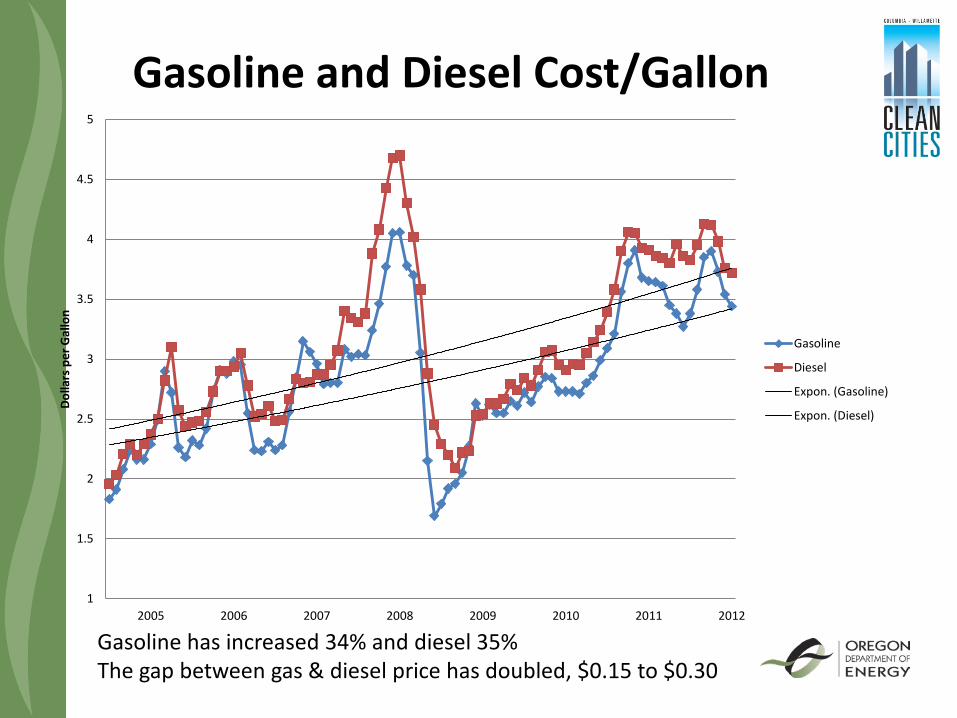
Gasoline has increased 34% and diesel 35% The gap between gas & diesel price has doubled, $0.15 to $0.30
1
1.5
2
2.5
3
3.5
4
4.5
5
2005 2006 2007 2008 2009 2010 2011 2012
Dolla
rs p
er G
allo
n Gasoline and Diesel Cost/Gallon
Gasoline
Diesel
Expon. (Gasoline)
Expon. (Diesel)
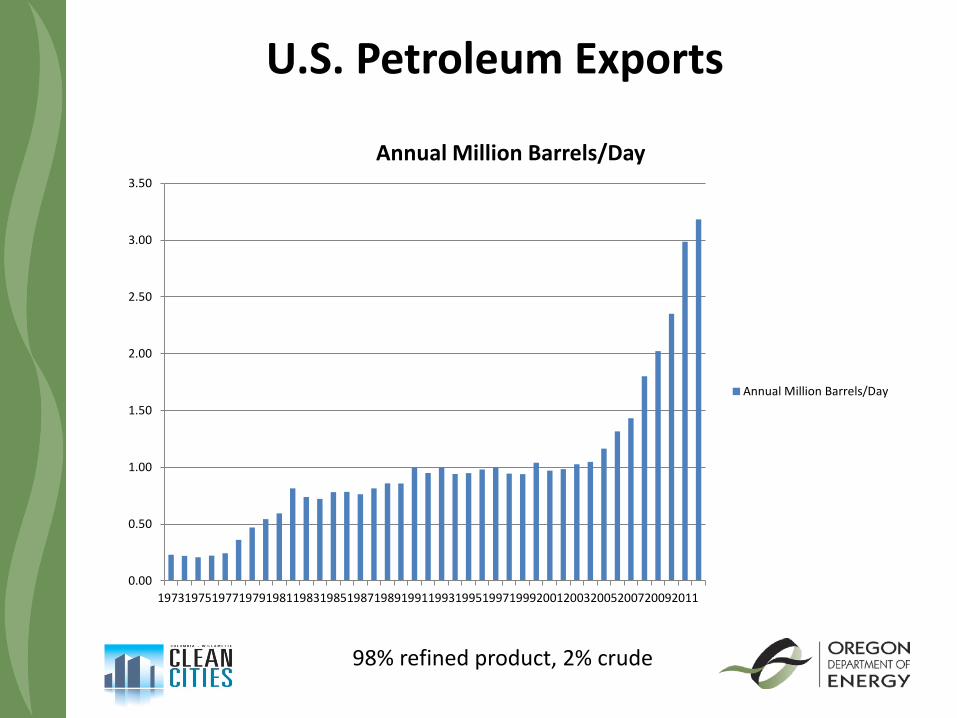
U.S. Petroleum Exports
98% refined product, 2% crude
0.00
0.50
1.00
1.50
2.00
2.50
3.00
3.50
19731975197719791981198319851987198919911993199519971999200120032005200720092011
Annual Million Barrels/Day
Annual Million Barrels/Day

World Supply & Demand Determine Price

Oregon Transportation Policy •Reduce Vehicle Miles Traveled - Land use, mass transit, bicycles, telework, carpooling, rail, combine trips •Vehicle Efficiency - ECO driving or driving efficiently - High mile per gallon vehicles (ie. hybrids) - Efficient Truck Technology (APU, Aero, Tires) reduce idling •Alternative Fuels - Electricity, Biodiesel, Ethanol, CNG, Propane etc.

Natural Gas • Worldwide 15.2 million vehicles, US 120,000
and Oregon about 1,600 vehicles • A plentiful domestic product, Est. 100 yr supply-
currently stranded in N. America • In the U.S., about 50 different manufacturers
produce 100 models of light-, medium-, and heavy-duty vehicles and engines.
• Ford, GM and Chrysler all make NG ready vehicles, conversion companies have worked with the OEM’s to avoid warranty issues

Natural Gas • Natural gas in the transportation sector is
used in two forms, CNG or Compressed Natural Gas (3,000 to 3,600 PSI) and LNG or Liquid Natural Gas (-261 F degrees)
• Clean fuel that can extend service life of the vehicle by 2 to 3 years with lower maintenance costs
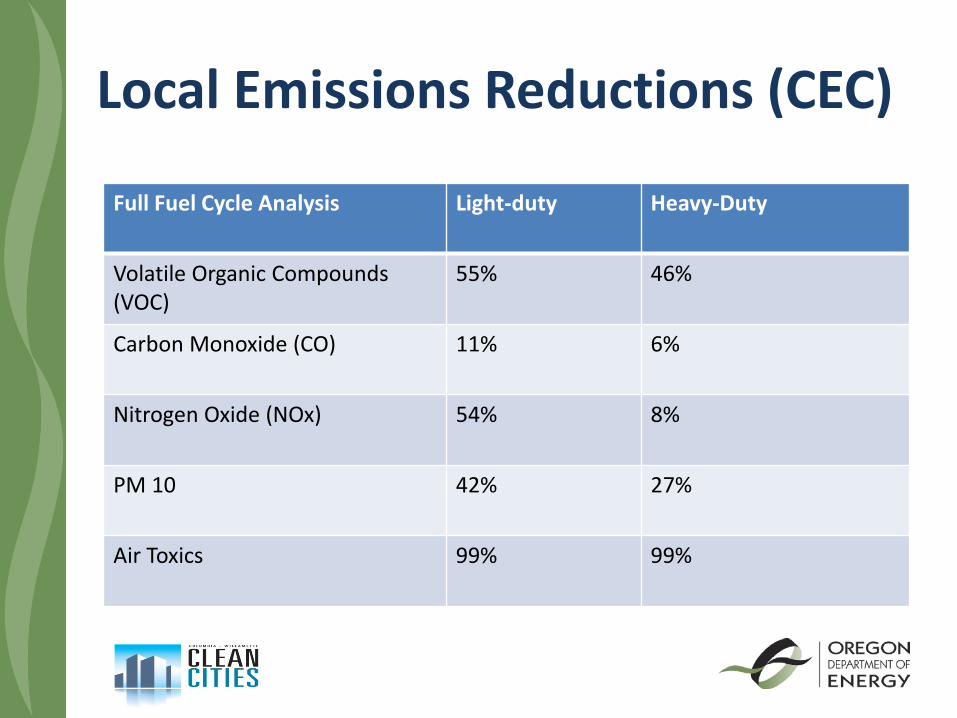
Local Emissions Reductions (CEC)
Full Fuel Cycle Analysis Light-duty Heavy-Duty
Volatile Organic Compounds (VOC)
55% 46%
Carbon Monoxide (CO) 11% 6%
Nitrogen Oxide (NOx) 54% 8%
PM 10 42% 27%
Air Toxics 99% 99%

Gasoline & Gasoline Substitutes
Carbon Intensity (gCO2e/MJ)
Diesel & Diesel Substitutes
Carbon Intensity (gCO2e/MJ)
Gasoline 92.34 Ultra Low Sulfur Diesel 91.53
Ethanol-MW production & corn
64.82 Biodiesel-MW production soy beans
21.66
Ethanol-NW production & MW corn
53.79 Biodiesel-NW canola 27.31
Sugarcane ethanol 26.44 Biodiesel-NW yellow grease
10.28
Cellulosic-Farmed trees 15.54 Pipeline NG in Oregon/CNG
74.70
Pipeline NG in Oregon/CNG
70.22 LNG 83.13
Electricity 37.80 RNG-Landfill RNG-Dairy
11.26 13.45
Global Emissions

Source Oregon Dept. of Energy
Cost to Travel 100 Miles/ Pickup Truck
Fuel Cost MPG Gal/100mi Cost Gasoline $3.81 16 6.25 $23.81 Diesel $4.11 21.2 4.72 $19.39 Biodiesel $3.99 21 4.76 $18.99 E85 $3.54 12 8.33 $29.50 LPG/Propane $2.35/
$1.75 14.16 7.062 $16.60
$12.35 CNG $2.10/
$1.30 15.5 6.45 $13.55
$8.39 Electricity $0.10kWh/
$3.81 2mi/kWh/ 22
20 kWh/ 2.73/60mi
$2.00 $10.40

Source Oregon Dept. of Energy
Fuel Cost/mi
Fuel Cost Difference
Conversion or up Cost
Miles to ROI
Gasoline $0.238 Diesel $0.194 $0.044 $3,500 79,545 Biodiesel $0.190 $0.048 $3,500 72,917 E85 $0.295 -$0.057 $ 125 LPG/Propane $0.166/
$0.124 $0.072/ $0.114
$6,000 83,333/ 52,632
CNG $0.136/ $0.084
$0.102/ $0.154
$9,750 95,588/ 63,312
Electricity/Gas $0.124 $0.114 $8,880 with
incentive
77,895
ROI for Pickups

Estimated Simple Payback of a Large CNG Pickup Truck at $10,000 Incremental Cost
Miles Per Year
Price Differential between a DGE of CNG and a Gallon of Diesel
$1.50 $2.00 $2.50
Annual Savings
Payback in Years
Annual Savings
Payback in Years
Annual Savings
Payback in Years
10,000 $ 1,019 9.8 $ 1,481 6.8 $ 2,083 4.8
15,000 $ 1,528 6.5 $ 2,222 4.5 $ 3,125 3.2
20,000 $ 2,037 4.9 $ 2,963 3.4 $ 4,167 2.4
25,000 $ 2,546 3.9 $ 3,704 2.7 $ 5,208 1.9
Miles to ROI
98,182
67,500
48,000
Gallons of CNG to ROI
9,091
6,250
4,444
Assumptions CNG DGE MPG = 10.8 Diesel MPG = 12

Estimated Simple Payback of a Class 3-6 CNG Truck at $30,000 Incremental Cost
Miles Per Year
Price Differential between a DGE of CNG and a Gallon of Diesel $1.50 $2.00 $2.50
Annual Savings
Payback in Years
Annual Savings
Payback in Years
Annual Savings
Payback in Years
10,000 $ 1,746 17.2 $ 2,540 11.8 $ 3,333 9.0
15,000 $ 2,619 11.5 $ 3,810 7.9 $ 5,000 6.0
20,000 $ 3,492 8.6 $ 5,079 5.9 $ 6,667 4.5
25,000 $ 4,365 6.9 $ 6,349 4.7 $ 8,333 3.6
Miles to ROI 171,818 118,125 90,000
Gallons of CNG to ROI 27,273 18,750 14,286
Assumptions CNG DGE MPG = 10.8 Diesel MPG = 12

Estimated Simple Payback of a Class 7&8 CNG Truck at $35,000 Incremental Cost
Miles Per Year
Price Differential between a DGE of CNG and a Gallon of Diesel $1.50 $2.00 $2.50
Annual Savings
Payback in Years
Annual Savings
Payback in Years
Annual Savings
Payback in Years
20,000 $ 5,432 6.4 $ 7,901 4.4 $ 10,370 3.4
25,000 $ 6,790 5.2 $ 9,877 3.5 $ 12,963 2.7
30,000 $ 8,148 4.3 $ 11,852 3.0 $ 15,556 2.3
35,000 $ 9,506 3.7 $ 13,827 2.5 $ 18,148 1.9
Miles to ROI 128,864 88,594 67,500
Gallons of CNG to ROI 31,818 21,875 16,667
Assumptions CNG DGE MPG = 4.05 Diesel MPG = 4.5

Refueling System Incentives
• Federal Credit • Business Credit is 30 percent of the cost up to $30,000 • Personal Credit is 30 percent of the cost up to $1,000 • Use IRS Form 8911 • If the purchaser is a tax exempt organization,
government unit or a foreign person the seller can take the credit

Refueling System Incentives
• Oregon State Credit • Business Credit is 35 percent of the cost http://www.oregon.gov/energy/BUSINESS/Incentives/Pages/EIP-
Trans.aspx
• Personal Credit is 25 percent of the cost up to $750 http://www.oregon.gov/energy/TRANS/Pages/hybridcr.aspx

Programs Coming
• SB 583 • Alternative Fuel Vehicle Revolving fund for
public and tribal entities Conversions & incremental cost of new Create loan packages that payback the loan
based on fuel cost savings • Allows the Oregon Department of Energy’s
Transportation Energy Incentive Program to include alternative fuel vehicles in their eligible projects for tax incentives after January 1, 2015

Questions? Rick Wallace 503-378-3265 [email protected]