ad-a238 315 - defense technical information center · ad-a238 315 us depaortment of transportation...
TRANSCRIPT

AD-A238 315US Depaortmentof Transportation
Federal AviationAdministration
Office of Aviation Policy and Plans
Washington, D.C. 20591
Establishment Criteria ForIntegrated Wind Shear Detection Systems:
Low-Level Wind Shear Alert System (LLWAS),Terminal Doppler Weather Radar (TDWR), andModified Airport Surveillance Radar
DTICELECTE
- ~~~U 15
.J ,,D-- mL_
Ap~aved kw " -'-Me"
FAA-APO-90-13 December 1990
91-0468411111 I I II IIil Illlll 91 7 10 155
Technical Report Documentation Page
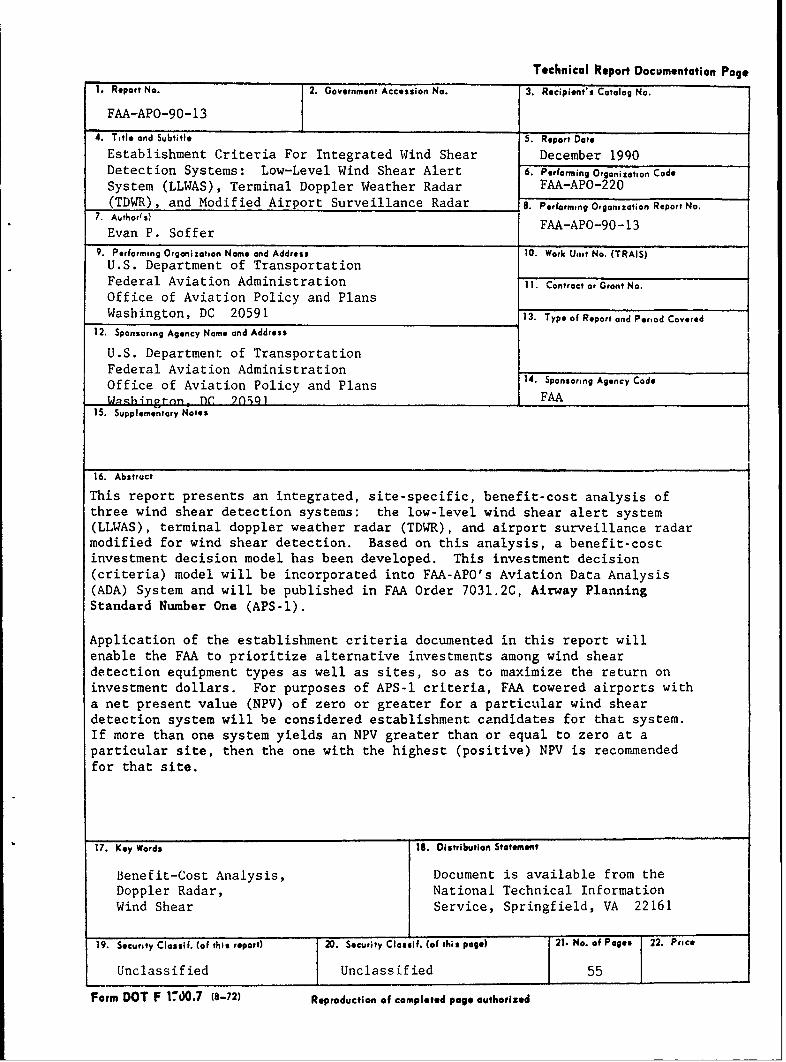
1. Report No. 2. Government Accession No. 3. Recipient's Catalog No.
FAA-APO-90-13
4. Title and Subtitle 5. Report Date
Establishment Criteria For Integrated Wind Shear December 1990Detection Systems: Low-Level Wind Shear Alert 6. Performing Organization Code
System (LLWAS), Terminal Doppler Weather Radar FAA-APO-220(TDWR), and Modified Airport Surveillance Radar 8. Performing Organization Report No.
7. Authorts) FAA-APO-90-13Evan P. Soffer
9. Performing Organization Name and Address to. Work Unit No. (TRAIS)U.S. Department of TransportationFederal Aviation Administration 11. Contract or Gront No.
Office of Aviation Policy and PlansWashington, DC 20591 13. Type of Report and Period Covered
12. Sponsoring Agency Name and Address
U.S. Department of TransportationFederal Aviation AdministrationOffice of Aviation Policy and Plans 14 Sponsoring Agency Code
Washinat-on IC 2OSQ1 FAA15. Supplementary Notes
16. Abstruct
This report presents an integrated, site-specific, benefit-cost analysis ofthree wind shear detection systems: the low-level wind shear alert system(LLWAS), terminal doppler weather radar (TDWR), and airport surveillance radarmodified for wind shear detection. Based on this analysis, a benefit-costinvestment decision model has been developed. This investment decision(criteria) model will be incorporated into FAA-APO's Aviation Data Analysis(ADA) System and will be published in FAA Order 7031.2C, Airway PlanningStandard Number One (APS-I).
Application of the establishment criteria documented in this report willenable the FAA to prioritize alternative investments among wind sheardetection equipment types as well as sites, so as to maximize the return oninvestment dollars. For purposes of APS-I criteria, FAA towered airports witha net present value (NPV) of zero or greater for a particular wind sheardetection system will be considered establishment candidates for that system.If more than one system yields an NPV greater than or equal to zero at aparticular site, then the one with the highest (positive) NPV is recommendedfor that site.
17. Key Words 18. Distribution Statement
Benefit-Cost Analysis, Document is available from theDoppler Radar, National Technical InformationWind Shear Service, Springfield, VA 22161
19. Security Classif. (of this report) 20. Security Classif. (of this page) 21. No. of Pages 22. Price
Unclassified Unclassified 55
Form DOT F 1700.7 (8-72) Reproduction of completed page authorized

EXECUTIVE SUMHARY
This report presents an integrated, site-specific, benefit-cost analysis ofthree wind shear detection systems: the low-level wind shear alert system(LLWAS), terminal doppler weather radar (TDWR), and airport surveillance radar(ASR) modified for wind shear detection. Net present value (NPV), or benefitsless costs, is the analytical tool used to rank order competing wind sheardetection systems. Based on the analysis, a benefit-cost investment decisionmodel has been developed. This investment decision (criteria) model will bepublished in FAA Order 7031.2C, Airway Planning Standard Number One (APS-I).APS-I is a working order which contains the policy and summarizes the criteriaused in determining eligibility of terminal locations for establishment,discontinuance, and improvements of specified types of air navigationfacilities and air traffic control services under the FAA's Facilities andEquipment Appropriation. ADA, a computer system developed and maintained bythe Office of Aviation Policy and rlans, facilitates APS-I processing throughits benefit/cost subroutines and supporting 4,000-plus airport database ofdescriptive as well as historical and forecast aviation activity data. Theestablishment criteria developed in this report also fulfill correspondingrequirements for such criteria by the Integrated FAA Wind Shear Program Plan.
The primary benefit of LLWAS, TDWR, and modified airport surveillance radar isreduced risk and expected incidence of wind shear-related accidents. Windshear poses an infrequent but highly significant hazard to aircraft duringtakeoff and landing. The need for effective wind shear detection andreporting is evident from NTSB accident records. From 1964 through 1985,wind shear was identified as a cause or contributing factor in 80 accidents atFAA towered airports in which 576 lives were lost. Of these, 49 accidents and434 fatalities occurred from 1975 through 1985. A secondary benefit affordedby wind shear detection systems is more effective planning of airportoperations, by providing gust front and wind shift information to air trafficcontrol personnel.
For purposes of APS-I criteria, FAA towered airports with a net present value(NPV) of zero or greater for a particular wind shear detection system will beconsidered establishment candidates for that system. If more than one systemyields an NPV greater than or equal to zero at a particular site, then the onewith the highest (positive) NPV is recommended for that site.
Aooession ForNTIS GRA&IDTIC TAB0Unannounced 0Justification.
By,Distribution/
Availability Codesi va an
1 ~Dist Specil]

TABLE OF CONTENTS
CHAPTER PAGE
EXECUTIVE SUMMARY............................................. i
LIST OF TABLES............................................... v
LIST OF FIGURES............................................ vii
I. INTRODUCTION................................................. 1
A. Overview................................................. 1B. Organization~ of Report...................................1IC. The Natux'e of Low-Altitude Wind Shear.....................2
1. The Hazard Posed by Low-Altitude Wind Shear............22. Sources of Low-Altitude Wind Shear......................5
a. Introduction...................................... 5b. Convective Outflows/Microbursts.....................5c. Gust Fronts....................................... 5d. Air Mass Fronts................................... 7e. Sea Breeze Fronts................................. 7f. Terrain-ndu- ed Wind Shear..........................7g. Low-Level Jet Streams...............................8h. High-Speed Atmospheric Vortices.....................8
D. Wir... r Programs, Systems, and Services ................. 9
1. Overviev . ......................................... 92. Programs, Syr!ems, and Services ........................ 11
a. National Weather Service...........................11b. PIREPs......... .................................. 12c. Education, Trainin&, and Operating Procedures .. 12d. Airborne Systems .............. ................... 12e. Basic LLWAS.................. .................... 13f. Six Sensor Improvement LLWAS and
Expanded Network LLWAS ........................... 13g. TDWR ............................................ 14h. ASR-9...................... I..................... 15i. Integrated Systems ............................... 15
II. ESTABLISHMENT CRITERIA ...................................... 17
A. Overview ................................................ 17
B, Criteria Logic........................................... 17
iii

TLBLE OF CONTENTS (Continued)
CHAPTER PAGE
III. LIFE-CYCLE BENEFITS . ......................................... 19
A . Overview . ................................................ 19B. Safety Benefits Algorithm . ............ .................. 19
]. Historic Accident Rates .............................. 192. Forecasted Annual Aircraft Operations ............... 223. Safety Weather Exposure Factor ....................... 224. System Safety Effectiveness: Fraction of
A7,oidable Accidents .................................. 225. Expected Cost of a Wind Shear Accident ............... 24
C. Efficiency Benefits ..................................... 26
1. Overview ...... ...................................... 262. The Microburst Advisory Service Project ............. 263. Efficiency Benefits Algorithm ...................... 28
a. Forecasted Annual Aircraft Operations ........... 28b. Average Time Spent In Queue per Aircraft
During Wind-Related Runway Shifts ............... 28c. Average Delay per Aircraft Operation ............ 28d. aircraft Variable Operating Costs ............... 28e. Value of Passengers' and Occupants' Time ........ 31f. Delay Weather Exposure Factor ................... 31g. System Delay Effectiveness: Fraction of
Avertible Runway Shifts ......................... 31
D. Life-Cycle Benefits Summary ............................ 33
IV. LIFE-CYCLE COSTS ............................................ 35
V. RESULTS ............................................ ........ 37
A. Assumptions and Ground Rules ............................ 37
B. Criteria Results ........................................ 38
1. Results With Airborne Systems ....................... 382. Results Without Airborne Systems .................... 38
REFERENCES .................................................. 43
APPENDIX A Aircraft Accidents and Incidents Pt FAA ToweredAirports Related to Low-Altitude Wind Shear ............... A-1
APPENDIX B Effectivity Regions for States and Territories ............ B-1
iv

LIST OF TABLES
TABLE PAGE
I-i FAA Towered Airport Wind Shear Accident Data, 1975-1985 .... 3
1-2 Sources of Wind Shear in Wind Shear-Related Accidents/Incidents at FAA Towered Airports Involving ScheduledCommercial Aircraft, 1964-1985 ............................. 6
III-i Summarv of Historic FAA Towered Airport Wind Shear-Related Accidents and Rates ................................ 21
111-2 Wind Shear System Safety Effectivities ..................... 23
111-3 Potential Annual Benefits of a Doppler Radar RunwayManagement Product at Denver Stapleton Airport ............. 29
111-4 Wind Shear System Delay Effectivities ...................... 32
IV-I Life-Cycle Costs ........................................... 36
V-1 Results With Airborne Systems .............................. 39
V-lA Results With Airborne Systems (High Effectivity Scenario) .. 40
V-lB Results With Airborne Systems (Low Effectivity Scenario) ... 41
V-2 Results Without Airborne Systems ........................... 42
APPENDIX A Aircraft Accidents and Incidents at FAA Towered Airports
Related to Low-Altitude Wind Shear ........................ A-1
APPENDIX B Effectivity Regions for States and Territories ............ B-1
v

LIST OF FIGURES
FIGURE PAGE
I-i Mean Number of Days per Year with Thunderstorms andGeographic Distribution of Wind Shear Accidents at FAATowered Airports, 1975-1985 ................................. 4
1-2 Data Sources for Wind Shear Information--Current and
Future ..................................................... 1 0
III-1 Site-Specific Safety Benefits Algorithm .................... 20
111-2 Site-Specific Efficiency Benefits Algorithm ................ 30
vii
CHAPTER I - INTRODUCTION
A. Overview
Effective management and decisionmaking of capital investments in the NationalAirspace System requires, among other considerations, analysis and comparisonof benefits and costs. FAA evaluates many of its investments in terminalnavigation aids, communication aids, and air traffic control services byapplying standard establishment and discontinuance "criteria." These criteriaare summarized in FAA Order 7031.2C, Airway Planning Standard Number One -Terminal Air Navigation Facilities and Air Traffic Control Services (APS-l)(Reference 1). APS-1 iL a working order which contains the policy andsummarizes the criteria used in determining eligibility of terminal locationsfor establishment, discontinuance, and improvements of specified types of airnavigation facilities and air traffic control services under the FAA'sFacilities and Equipment Appropriation. For less expensive facilities ande-,uipment, the criteria are normally expressed in terms of simple trafficactivity thresholds. More expensive facilities and equipment are normallysupported by investment criteria based on more complex benefit versus costconsiderations. A complete discussion of benefit/cost analysis, as applied toFAA investment and regulatory analyses, may be found in Economic Analysis ofInvestment and Regulatory Decisions - A Guide (Reference 2).
This report presents an integrated, site-specific, benefit-cost analysis ofthree wind shear detection systems: the low-level wind shear alert system(LLWAS), terminal doppler weather radar (TDWR), and airport surveillance radar(ASR) modified for wind shear detection. Net present value (NPV), or benefitsless costs, is the analytical tool used to rank order competing wind sheardetection systems. Based on the analysis, a benefit-cost investment decisionmodel has been developed. This investment decision (criteria) model will bepublished in APS-I and incorporated into the Aviation Data Analysis (ADA)System. ADA is a computer system developed and maintained by the Office ofAviation Policy and Plans which facilitates APS-I processing through itsbenefit/cost subroutines and supporting 4,000-plus airport database ofdescriptive as well as historical and forecast aviation activity data. Theestablishment criteria developed in this report also fulfill correspondingrequirements for such criteria by the Integrated FAA Wind Shear Program Plan.
B. Organization of Report
The remainder of this chapter reviews the nature of low-altitude wind shear
(including its hazard to aviation), the sources of wind shear, and FAA windshear programs, systems, and services. This background provides a basis forunderstanding and appreciating the benefits provided by wind shear detectionequipment. Chapter II gives an overview of the establishment criteria logic.Chapter III delineates the algorithms used to quantify site specific safetyand efficiency benefits for LLWAS, TDWR, and modified ASR, and Chapter IVsummarizes the life cycle costs of these systems. The results of applying thecriteria to all FAA towered airports are pcesented in Chapter V.
I

C. The Nature of Low-Altitude Wind Shear
1. The Hazard Posed by Low-Altitude Wind Shear
Wind shear, any rapid change in wind direction or speed over a relativelyshort distance, has historically been a problem for aviation. Abrupt changesin wind direction or speed can cause sudden changes in the flow oL air over anaircraft's wings and other lifting surfaces. These changes can affect anaircraft's flight characteristics so quickly and drastically that anaircraft's pilot may not be able to respond in time to prevent an accident. ifthese changes occur close to the ground. Thus, wind shear poses a significanthazard to aviation, particularly in the lowest 1,000 feet of the atmosphere,the zone that an aircraft must penetrate while landing or taking off.
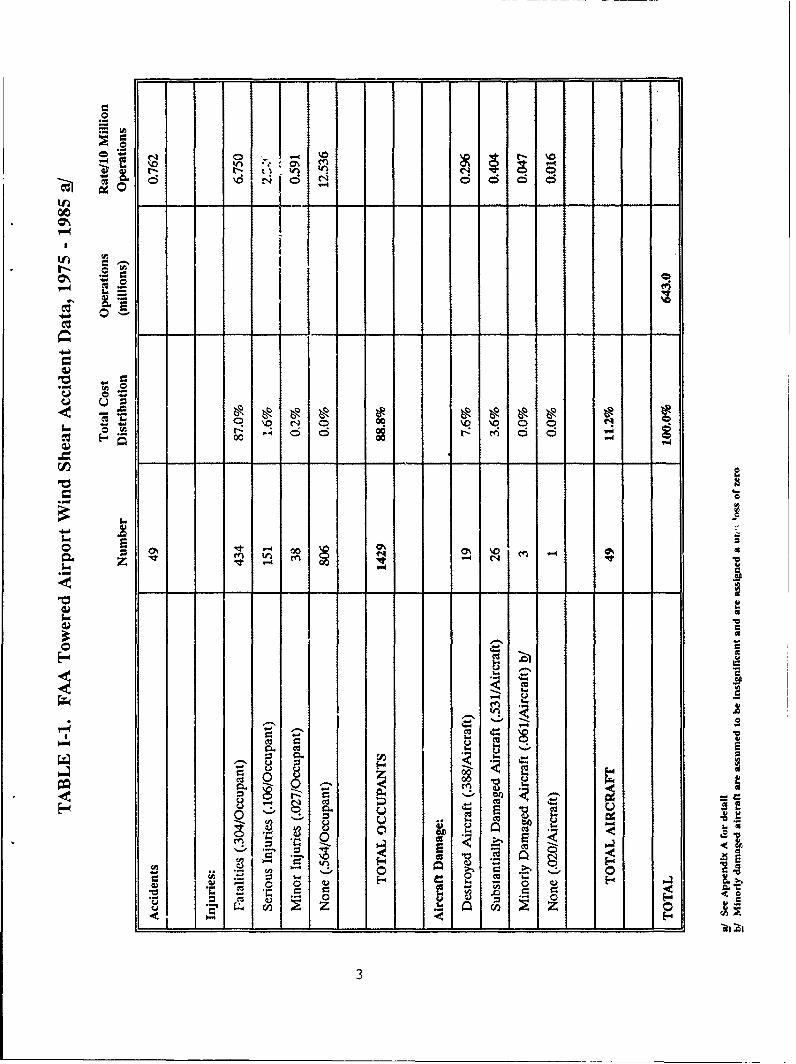
Aircraft accidents resulting from wind shear during takeoffs and landings havebecome a major source of concern in aircraft safety. The need for effectivewind shear warning and detection and avoidance systems is evident fromNational Transportation Safety Board (NTSB) accident records. Table I-1provides summary data of wind shear-related accidentn involving scheduledcommercial aircraft at FAA towered airports from 1975 through 1985. Duringthis period, wind shear was identified as a cause or contributing factor in 49accidents which resulted in 434 fatalities, 189 injuries, and 45 destroyed orsubstantially damaged aircraft. Disaggregate data on these accidents arepresented in the Appendix.
Figure I-1 displays a ge.graphic distribution of wind shear accidents as wellas the mean number of days per year with thunderstorms, on a U.S. regionalbasis. Thunderstorms represent the closest form of recorded severe weatheractivity that is correlated with the presence of wind shear and therefore area significant determinant in wind shear-related accidents. Since higheractivity levels expose more aircraft to wind shear events, wind shear-relztedaccidents are also correlated with traffic activity levels. Given theprojected growth in future air traffic activity, the probability of a windshear induced accident can be expected to increase in the future in theabsence of improved wind shear detection and avoidance measures.
2
.2n
- ~t I
\ 0 NO0 \0 \0 00 eq
C7 0\0\
'0t m
ZO- 00eqO '0 ( 4
otCl$
04 0
- ~2 2

003
to o
H - -w4
LO N -H 14 a
14'-IUVN
>4 0
r..
~U)
0041~9 C,-1-4 .,40 it~34 ~ U
Ci C%
ocCo go
4.10
4-

2. Sources of Low-Altitude Wind Shear
a. Introduction
The primary sources of low-altitude wind shear include: outflows (includingmicrobursts) associated with thunderstorms and other convective clouds, gustfronts, and air mass fronts. Other sources of wind shear include: sea breezefronts, terrain-induced wind shear, low-level jet streams, and high-speedatmospheric vortices. Table 1-2 categorizes 30 of the 36 scheduled commercialwind shear-related accidents/incidents that occurred from 1964 through 1985 atFAA towered airports by wind shear source. As shown in the table, a majorityof these accidents were caused by convective outflows (thunderstorms, ordinaryshowers, and microbursts).
b. Convective Outflows/Microbursts
Thunderstorms and other convective clouds are the most significant sources oflow-altitude wind shear. These weather phenomena may produce strongdowndrafts which transport air downward and induce outbursts of damaging windsat or near ground level. An estimated 90 percent of significant operationallow-altitude wind shears are convectively induced (Reference 3). Asillustrated in Figure I-1, thunderstorms occur most frequently in Florida,along the Gulf of Mexico coast, and over the central regions of the UnitedStates.
A convective microburst is a small downburst less than 2.5 miles in outflowsize, which may reach the ground or dissipate in midair, with peak windslasting two to five minutes. Based on the FAA's participation in the JointAirport Weather Study (JAWS) and the FAA-sponsored Classify, Locate, and AvoidWind Shear (CLAWS) projects (1982-1984), and other wind shear research,microbursts are believed to pose the most serious form of wind shear hazard toaviation safety. During the past several years, the .viation and scientificcommunities have gained considerable knowledge about microbursts.Nevertheless, fully understanding the nature of microbursts, explaining theforces that create microbursts in some thunderstorms but not in others,predicting their occurrence and location, and detailing appropriate pilotstrategies when encountering a microburst, is still subject to futureresearch.
c. Gust Fronts
While microbursts and other convective outflows are believed to pose the mostserious wind shear hazard to aviation, gust fronts are also significanthazards. A gust front is the leading edge of a mass of cool air that hasrecently descended from a thunderstorm or convective cloud. Cool air near thegust front, which may be up to one mile in depth, is characterized by strongturbulent winds. The cool air sinks, while the warm air rises. The depth ofthe gust front and its speed of advance over the ground depend on the natureof the parent cloud and the wind distribution through the layer in which thecloud is embedded. When the winds are light and change little with altitude,
5

ar m- -n maD c 0
I an aU In
Ina
Pa. a
y) *0 a"i a 0 a1
*0 ac 0.- xN N 0 a~0
ao an 'N x - -atlIxl
r S I I~flC
* l a* a a a
0 ao 01 I4
x C, a
x a a n-
V) x.t X .0 0 -1
ca x a 3 u-(D Itaa
'U Cl.4 C^ x 00 -iemma a
x a x coa 0-Lo a n; N4x4 X a0
a MPs a CDin au aq au
r- N0 cm 40..)aT (NJ aan Co x 0
2 W Xa0-Vx a Ncm a
.N0.NO X
cc Xm o DX
N Z8
AA a A a L.4a414
a0- a0 c- a
a at) aCo w X aOEL~
o1 a1-a a L --I- al aIt-
aN. ~ 0 X 4j.a -- Nac04aX '0i
4.cor- 0EU a a a
the gust front is almost symmetrical around the storm that produced it. Bythe time the storm has dissipated, the gust front may have moved miles awayfrom the parent storm and weakened substantially. When there is strongvertical wind shear through the atmosphere and a severe long-lastingconvective storm, the associated gust front tends to be maintained at theleading edge of the parent storm. The pattern of its advance can be veryasymmetric with strong outward-blowing winds in those centers coinciding indirection with the strongest winds aloft in the cloud layer.
d. Air Mass Fronts
Separate air masses do not mix readily when they come into contact if theyhave different temperatures a... humidities. Instead, the colder, more denseair mass passes under the warmer, less-dense air mass. The zone of transitionbetween the two air masses is called a front. When the cold air advances,forcing the warm air to retreat and pass over the wedge of cold air, it iscalled a cold front. When the warm air advances, the frontal boundary movestoward the cold air and a warm front is said to exist. There usually is asharp change of wind velocity across fronts and all fronts have some degree ofwind shear across the zone of transition between the air masses.
Frontal conditions and the accompanying wind shears occur in all regions ofthe United States, but they occur most frequently over the middle latitudesduring the colder months of the year. While Hawaii averages about two shearsper winter, the central and northwest regions of the United States averagefour to five per month during the fall, winter and spring. The southernstates and those east of the Rocky Mountains average one significant frontalpassage per month during the same seasons.
e. Sea Breeze Fronts
A sea breeze is a local wind that blows from sea to land. It is caused by thetemperature differences that occur daily between the sea surface and theadjacent land. Often, the onset of a sea breeze occurs suddenly as a seabreeze front, separating the cool air from the warm air, moves inland. Seabreeze fronts cause a sudden change in wind velocity, from near calm to abrisk cool breeze. Wind shear associated with sea breezes can be hazardous atairports located along coastlines.
f. Terrain-Induced Wind Shear
Mountainous terrain can cause significant low-altitude wind variability byinducing high-amplitude undulations or waves in air currents flowing over it.Airports located close to mountains, near breaks in mountain ranges, or onhills with sharp dropoffs near the ends of runways are subject to steady-statewinds that often break down into constantly changing gusts. The presence ofsevere turbulence caused by mountain waves can compound the problem ofoperating aircraft in and out of these airports. Their influence can extend
7

from ground level to very high altitudes. It is not unusual to have gustvelocities that double steady wind speeds. In extreme cases these gustvelocities can exceed 100 knots. Wind shear induced by terrain occurs mostoften in the non-summer months. However, mountain waves have been observedduring every month of the year in Alaska and in the western mountainousregions of the United States and Canada. In an average year, to the lee ofthe Rocky Mountains, in Montana and southern Canada, there are 15 wave days amonth. In Colorado and in southern states there is an annual average of 7wave days a month. The mountains in the eastern United States usually do notproduce strong downdraft winds because their lee slopes are not particularlysteep.
g. Low-Level Jet Streams
The strength of the wind near ground level is closely linked to diurnalprocesses on the lower atmosphere. During daytime the earth's surface isheated by the sun, and the planetary boundary layer is marked by vertical airmotions. This process causes the frictional influence of the ground on thewind to be transmitted through a deep layer of air. Thus, wind velocitiesnear the ground tend to be relatively high in the form of a concentratedcurrent called a low-level jet stream. The formation of such a jet streamdepends also on the distributions of heating and cooling and their dailyvariations over sloping terrains.
In a typical low-altitude jet stream situated over an airport, the wind at thesurface tends to be light and to come from the same direction as the strongerflow immediately above the airport. Consequently, an aircraft that is landingwill typically approach the runway into the jet stream wind. As the aircraftdescends below the jet stream, headwinds decrease, often substantially, as theaircraft nears touchdown. The sudden loss of headwind can be a seriousproblem if the pilot is unaware of the situation. A typical low-altitude jetstream event often occurs in clear air but at night, when the visualperspective of a pilot may be inhibited.
h. High-Speed Atmospheric Vortices
No discussion of low-altitude wind shear would be complete without at least amention of high-speed atmospheric vortices such as tornadoes, waterspouts anddust devils. Of these phenomena, tornadoes are associated with the strongestwind shears.
8

D. FAA Wind Shear Programs, Systems, and Services
1. Overview
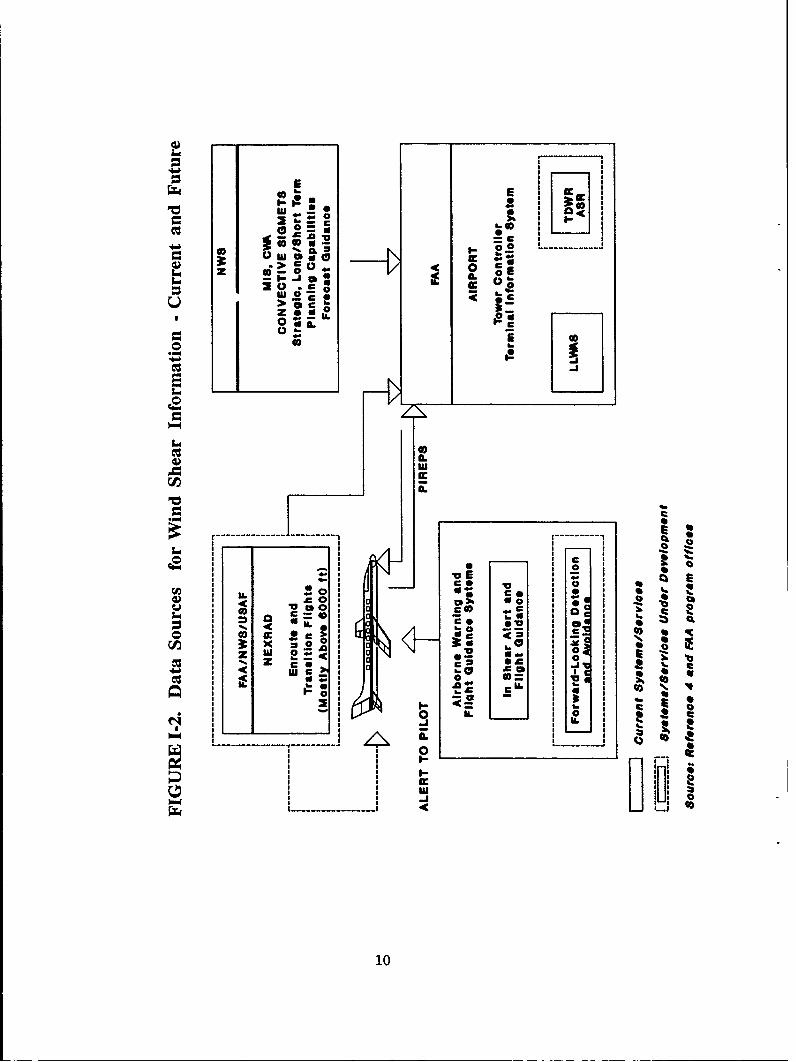
Each element of the Integrated FAA Wind Shear Program will contribute to the
overall safety of the National Airspace System.!' Operational information on
wind shear can currently be obtained from meteorological forecasts, pilot
reports, and LLWAS (the latter exists at 110 airport sites). National Weather
Service (NWS) products provide short and long-term planning capabilities and
forecast guidance for many airports, including thunderstorm and other
convective weather information. This information is supplemented by voluntary
pilot report (PIREPS) of hazardous weather encountered in flight. Where
available, LLWAS is used continuously to provide airport wind conditions.
These sources of wind information are broadcast to all pilots in the area. In
the future, information provided by LLWAS will be augmented by TDWR and
modified ASR. In addition, some aircraft will be equipped with on-board
present-position wind shear warning and guidance and control systems. If an
aircraft has on-board sensors that detect hazardous wind shear, then an
approach or departure will be aborted if the on-board detector sounds an
alarm. If an equipped aircraft encounters a wind shear, then the on-board
guidance and control systems (along with approved flight procedures) will
provide flight crew with the best information to recover from the encounter.
In this case, wind shear training will augment the flight crew's ability to
escape a wind shear encounter. Further in the future, on-board
"forward-looking" sensors will provide additional wind shear avoidance
capabilities. Although outside the scope of low-altitude wind shear
detection, next generation weather radar (NEXRAD) will be used to monitor
weather conditions along flight routes.
By design, there is deliberate redundancy and complementarity among Integrated
Wind Shear Program elements. Some degree of redundancy is essential to
effectively deal with the multifaceted nature of the wind shear phenomenon.
As discussed in the previous section, low-altitude wind shear can originate
from a variety of sources and is often unpredictable. Redundancy of program
elements helps insure against technical and schedule risks as well as
operational failure of individual program elements. Data sources for wind
shear information and the relationships between current and future FAA wind
shear programs, systems, and services, are illustrated in Figure 1-2.
!'The Integrated FAA Wind Shear Program (Reference 4) is a five-elerent plan
comprised of: (1) ground-based detection equipment; (2) aircraft-mounted
warning, detection, and avoidance equipment; (3) education, training and
operating procedures; (4) terminal information systems for communicating wind
shear information to pilots; and (5) further research into the nature of windshear.
9
3-1:-"
a a
a O
O 0 2.24.) ZL 0-0 L ------
w0. > gZ 0
OEIL
.22 02 IL
0 __ LIi
0)
'0 V
4 1 I L I -0S
I - I cc zA03: x -. 0
3- 0 0 0*a 0 5 I-.
.
A. U.
IL : 1 0. :
100

2. Programs, Systems, and Services
a. National Weather Service
The National Weather Service (NWS) offers a wide variety of meteorologicalservices, including forecasts and advisories provided to the FAA and theaviation community. The existing NWS network of weather radars detect rain,showers, thunderstorms, and other phenomena often associated with wind shear.The turbulence portion of the Aviation Area Forecast, prepared three timeseach day by the National Aviation Weather Advisory Unit in Kansas City, MO,indicates the likelihood of low-altitude wind shear. In addition, 52 WeatherService Forecast offices issue, at the same frequency, site-specific terminalforecasts, including the likelihood of low-altitude wind shear. Theseaviation weather notices are transmitted to FAA and NWS facilities as well asother facilities in the aviation community that have appropriatecommunications equipment. Currently, major airport traffic control towersreceive briefings, forecasts, and nowcasts (conditions currently in existenceor beginning within two hours) from Center Weather Service Units (CWSU) intheir cognizant Air Route Traffic Control Centers (ARTCC), based on CWSUanalysis and interpretation of NWS products. Scheduled and as-requiredbriefings generally consist of a forecast of weather conditions pertinent tothe ARTCC area during a specified period, plus an extended outlook.
Meteorological Impact Statements (MISs) give long range (4-12 hour) forecastcapabilities for many major airports. Significant Meteorological InformationAdvisories (SIGMETS) are severe weather advisories issued in hourly andspecial bulletins. Convective SIGMETs are warnings of the most severe weatherconditions. They are issued for tornadoes and very severe thunderstorms.SIGMETs are also issued for severe and extreme turbulence, icing, andwidespread obstructions to visibility such as dust and sand. Airman'sMeteorological Information Advisories (AIRMETs) are less extreme potentialhazards to aircraft such as moderate icing conditions. Center WeatherAdvisories (CWAs) are unscheduled severe weather advisories. They aredeveloped by Center Weather Service Unit meteorologists at FAA ARTCC's throughanalysis and interpretation of area forecasts, terminal forecasts, SIGMETs,pilot reports, and other sources of available weather information. CWAs mayalso supplement or redefine existing SIGMETs.
While the services discussed above have a positive impact on the overallweather information system, they do not satisfy all wind shear informationrequirements at the local airport level. Meteorological forecasts are oflimited usefulness for predicting downbursts due to their short lifetime andrandom occurrence. At best, these foreca-" 3 warn flight crews andcontrollers of conditions conducive to get..rating downbursts and wind shearactivity. Investigations in the Joint Airport Weather Study (JAWS) andanalyses of the 1982 Pan American Airlines crash in New Orleans havedemonstrated that accidents can occur in storms that are not consideredsevere. Despite their lack of small-scale detail, NWS information does alertpilots to the possibility of a wind shear encounter, reducing theirrecognition and reaction times should a wind shear event occur,
11

b. PIREPs
PIREPs are voluntary pilot reports of meteorological phenomena encountered inflight. They are an important source of information on immediate weatherconditions along the approach and departure corridors, for both controllersand pilots. The reliability of this information is limited, however, becausenot all pilots provide PIREP data. Nonetheless, PIREPs ,-f wind shearencounters are currently the only primary source of wind sLear information forairports not equipped with LLWAS.
c. Education, Training, and Operating Procedures
This element of the Integrated FAA Wind Shear Program is an ongoing effortbetween industry, the academic and scientific communities, and the FAA. Thiswill provide aviation users with appropriate education, training aids, andoperating procedures for recognizing, avoiding, and recovering from hazardouswind shear conditions. Historically, a lack of definition in basic wind sheartraining objectives had caused widespread confusion and a certain degree ofreluctance by man,, air carriers to adopt any formal wind shear trainingprogram. In an effort to fill this void, the FAA awarded a contract to theBoeing Company t' develop a Wind Shear Training Aid. The basic trainingpackage, consisting of two volumes, 90 35 mm slides, and two videotapes, wasdelivered to the FAA in February 1987. The FAA has, in turn, provided copiesof the Wind Shear Training Aid to several hundred airlines and relatedorganizations for incorporation into their respective training programs.
d. Airborne Systems
In September 1988, the FAA issued a Final Rule which amended the FederalAviation Regulations (FARs) Parts 121 and 135, by requiring that: (1) certainturbine powered airplanes operated under Part 121 be equipped with an approvedairborne wind shear warning with flight guidance system; (2) all Part 121operators conduct approved low-altitude wind shear flight training in asimulator; and (3) Part 121 and 135 certificate holders' training programsinclude flight crew on recognition of and escape from hazardous wind shearconditions (Reference 11).
There are two generic types uf such systems: (1) present-position systems,which warn the flight crew that the aircraft is currently in or entering awind shear condition and that recovery maneuvers must be initiated; and (2)forward-looking or predictive systems, which look ahead of the aircraft toprovide the flight crew with wind shear avoidance capability. The FAA hasalready approved a number of present-position systems that constantly monitorvarious flight parameters to alert flight crews about wind shear encounters.Use of present-position sensors i's becoming more widespread. Forward-lookingsystems are still undergoing development. The FAA has entered into afive-year cooperative agreement with the National Aeronautics and SpaceAdministration (NASA) to develop the system requirements for present-positiondevices. Started in October 1986, this effort will continue through September1991 and will rely on cooperation with industry to transfer the requisitetechnology. A certifiable forward-looking system is not currently envisionedbefore the mid-1990's.
12

e. Basic LLWAS
Originally developed in 1976 to detect large-scale events conducive to windshear (such as those discussed in Section 2), the low-level wind shear alertsystem (LLWAS) is currently the only operational ground-based wind sheardetection system in use by the FAA.
The system is a real-time, computer-controlled, surface wind sensor systemwhich uses telemetry as a communications link and minicomputer processing to
evaluate wind speed and direction from sensors on the airport periphery withcenterfield wind data. "Basic LLWAS" consists of a six-station sensor arrayof wind speed and direction sensors with one station located at center fieldon the airport and the other five sensors nominally located around theperiphery of the airport. The sensors are propeller vanes or anemometers
mounted on poles that are sited to provide the best coverage of runwaycorridors with minimal interference from terrain and other wind obstructions.The center field site is considered a reference site for which a two-minuterunning average of wind velocity is maintained. Each site has a collateralRemote Wind Unit which maintains the wind data for the site and transmits itto the central processor when polled. The remote sites are polled at
ten-second intervals by a central processor which compares the wind v,-locity
at each of the five peripheral sites with the two-minute running average windvelocity at the centerfield site. Whenever the magnitude of the vector
difference between the cencer field average wind and one or more of theperipheral sensors exceeds a specified threshold, visual and audible alarms
are signaled in the airport traffic control tower. The wind velocities atcenter field and at the alarming sensor(s) are presented on the towercontroller's display. During the time that the alert is posted, controllersprovide wind shear advisories to all arriving and departing aircraft.
Basic LLWAS was installed at 110 FAA towered airports. Since this system wasdesigned prior to the discovery of microbursts, it performs poorly atdetecting this primary source of wind shear. Moreover, Basic LLWAS provides
alert information in a form that is not optimal for pilot use (i.e., the pilot
needs measurements of actual wind shear along approach/departure flight
paths). Due to these system limitations as well as technological advances,the Basic LLWAS systems are being upgraded and or replaced by the FAA in two
phases. First, all 110 systems will be upgraded to the Six Sensor ImprovementLLWAS. The next phase will replace an existing LLWAS system with the Expanded
Network LLWAS, for those sites where the benefits of such replacement exceed
the costs.
f. Six Sensor Improvement LLWAS and Expanded Network LLWAS
The Six Sensor Improvement LLWAS (hereafter referred to as LLWAS-6) includes
the basic system, with the following enhancements: high-capacity computers and
advanced algorithms to improve the probability of wind shear detection; windshear/microburst detection capability at centerfield; and data recorders tostore wind data. The FAA began upgfading the Basic LLWAS systems to LLWAS-6in 1988 and expects to complete this process in 1991.
13

LLWAS-6 has several limitations. While it exhibits reduced false alarm ratesrelative to the besic system, LLWAS-6 is, nevertheless, prone to false alarms.In addition, sparse station spacing may permit small-scale microbursts to goundetected by LLWAS-6.
Starting in 1995, FAA will replace LLWAS-6 systems with the Expanded NetworkLLWAS (hereafter referred to as LLWAS-EN), at sites where replacement is costbeneficial. The LLWAS-EN upgrades LLWAS-6 by adding up to 32 stations.Improved features of LLWAS-EN relative to LLWAS-6 include: 1. increasedsensor density, allowing finer area resolution for microburst detection; 2.improved detection algorithms; 3. improved controller displays which provideimproved transfer of alert information; 4. runway orientation informationformat; and 5. improved siting criteria and taller sensor poles to reduce windsheltering. nuring the interim period, seven LLWAS Network Expansion systemswill be instalLed at major hub airports to supplement the prototype NetworkExpansion systems already installed at Denver and New Orleans. These sevensystems are scheduled to be installed in 1992.
g. TDWR
Recent advances in Doppler radar technology and algorithms for identifying andcharacterizing wind shear have demonstrated the potential of Doppler radar asthe basis for a terminal wind shear and wind turbulence detection system.These advances have culminated in the scheduled implementation of the TerminalDoppler Weather Radar (TDWR) system by the FAA. TDWR will detect wind shearand turbulence associated with outflows, gust fronts, cold fronts, and otherwind discontinuities in precipitation and in clear air. In addition, it isexpected to detect weather phenomena or generate weather products such asprecipitation intensity, movement of weather phenomena (e.g., windshiftprediction and wind profiles).
The TDWR Project provides for the design, procurement, installation andimplementation of 47 C-band frequency units - 44 operational units at or nearhigh-activity airports that are most vulnerable to wind shear and supportsystems at the FAA Aeronautical Center, the FAA Technical Center, and AndrewsAFB, respective]y. Implementation is planned over the early-1992 - 1995 timeframe. When wind shear conditions are present in the terminal coverage area,the TDWR System will generate information on the location and characteristicsof the wind shear, and transmit this information via land line to the airporttraffic control tower, In the tower, the information will be shown on twodisplays: (1) an alphanumeric display for use by air traffic controllers; and(2) a graphical situation display for use by air traffic control supervisorypersonnel.
On the controller display, the wind shear alert information will appear as atext message that can be quickly and easily read to aircraft pilots. As aresult of the TDWR information, pilots can take precautionary measures toavoid areas where wind shear conditions exist. TDWR will also provide warningof sustained wind shifts and hazardous weather to air traffic control,upervisory personnel to allow for improved planning of airport operation
(e.g., runway shifts).
14

During the TDWR's initial operating phase, the controller will relay wind
shear information verbally to pilots. Once the TDWR is operating in anend-state condition, the system will interface with the Terminal ControlComputer Complex (TCCC) and the Area Control Computer Complex (ACCC), andhazardous weather information will be transmitted to pilots via data uplinkusing the Mode-S System.
During fall 1988, the TDWR prototype completed an operational test at Denverwith very encouraging resultz. TDWR will provide coverage for detectingmicrobursts up to 1500 feet above ground level at a distance of six nauticalmiles (nnmi) from the airport. Coverage for detecting gust fronts extends to40 nmi from the airport. Whereas LLWAS systems measure winds in real time,TDWR is designed to provide a warning to pilots one rainute prior toencountering a hazardous wind shear event (Reference 6).
h. ASR-9
Airport Surveillance Radar (ASR), a surveillance radar primarily tasked todetect aircraft in terminal areas, collects data that identifies aircraftlocation, altitude, airspeed, and flight nunber and displays the data on thecontroller's screen. The display is the controller's primary means of"seeing" and separating aircraft. In 1989, the FAA began replacing existingASRs with ASR-9's (Ninth Generation), the latest state-of-the-art surveillanceradars. In addition to improving surveillance, ASR has near real-time weatherprocessing capabilities on an independent weather channel.
The Massachusetts Institute of Technology's Lincoln laboratory has conductedextensive research concluding that with certain modification, ASR-9 would bean effective wind shear detector. These modifications would take place afterinitial production and installation of the ASR-9. The fast scan rate of 4.8seconds per revolution provides timely data for detection processing. Sincean ASR-9 is located on the airport, it may provide a better runway estimate ofa wind shear than the off-airport TDWR. ASR-9 detection of microbursts andother hazardous wind shear events covers an area within 6.5 nmi of the radar
(Reference 6).
i. Integrated Systems
Technology for complex data level integration of two or more wind sheardetection systems is currently under development. In the complex data levelintegration, wind field data from LLWAS-EN would be interfaced in real time tothe TDWR radar products group (RPG) for direct incorporation into the windshear detection processing algorithms. Although integration of LLWAS-EN withTDWR is being actively pursued, LLWAS-EN integration efforts are not currentlyunderway with ASR-9. For the dual-Doppler (TDWR-ASR-9) case, ASR-9measurements would be sent, in real time, to the TDWR RPG for directapplication in the wind shear processing algorithms.
15
Radar-LLWAS-EN combinations offer a variety of capabilities, including:protection against both clear air and high reflectivity wind shear phenomena,discrimination of microbursts occurring on the edge of the LLWAS-EN system,.alidation of possible false alarms, and providing airport runway-orientedwind information.
Dual-Doppler combinations provide complementary look angles for protectionagainst asymmetrical microbursts and validation of possible false alarms.Better estimates of runway-oriented wind loss/gain information can be achievedwith a dual-Doppler than with a single radar system.
The final configuration involves integrating all three wind shear systems. Inthis case, the dual-Doppler configuration would be established and theninterfaced with LLWAS-EN. This configuration offers the collectivecapabilities of the radar-LLWAS-EN combination and the dual-Dopplercombination.
Note: For ease of presentation in this report, system integration is denotedby a "+." For example, an LLWAS-EN integrated with a TDWR ispresented as LLWAS-EN+TDWR.
16

CHAPTER II - ESTABLISHMENT CRITERIA
A. Overview
As stated earlier, effective management and decisionmaking of capitalinvestments in the National Airspace System requires an analysis andcomparison of relevant benefits and costs. FAA evaluates many of itsinvestments in terminal navigation aids, communication aids, and air trafficcontrol services by applying standard establishment and discontinuance"criteria." For less exrnensive facilities and equipment, the criteria arenormally expressed in :erms of simple traffic activity thresholds. Moreexpensive facilities and equipment are normally supported by investmentcriteria based on more complex benefit versus cost considerations. Thefollowing Section describes the general criteria logic for candidate windshear detection systems. The algorithms for estimating site-specific safetyand efficiency benefits of the candidate wind shear detection systems arediscussed in detail in Chapter III, while the costs associated with thesesystems are delineated in Chapter IV.
B. Criteria Logic
The criteria for wind shear detection systems are based on a comparison of thepresent value of the quantified benefits with the present value of quantifiedcosts. Net present value (NPV), or benefits less costs, is the analyticaltool used to rank order competing ind shear detection systems at a givenairport site. For purposes of APS-l criteria, FAA towered airports with anNPV greater than or equal to zero will be considered establishment candidates,i.e.,
NPV - BPV - CPV > 0,
where:
NPV = net present value of candidate systemBPV = present value of life-cycle benefits ol candidate systemCPV = present value of life-cycle costs of candidate system
Both BPV and CPV are denominated in constant dollars. In addition, bothbenefits and costs are calculated incrementally to a "reference system." Thereference system at an airport consists of the wind shear equipment already inplace or contractually obligated at that site.
17

CHAPTER III - LIFE-CYCLE BENEFITS
A. Overview
FA.'s investment criteria for wind shear detection equipment are based on twocategories of benefits, described below:
* Safety benefits are derived from investments that reduce accidents oraccident risk. Safety is the primary benefit provided by wind sheardetection systems. Low-altitude wind shear presents an infrequent buthighly significant hazard to aircraft on takeoff or landing and poses ahazard to all aircraft types - from small general aviation aircraft towide-body jets. Effective detection and warning of wind shear conditionsin terminal areas should result in the reduction of low-altitude windshear accidents, and consequent reductions in fatalities, injuries, andproperty damage.
* Delay (efficiency) benefits, in the form of reduced aircraft variableoperating costs and passenger time savings, are realized when aninvestment reduces flight delays, diversions, cancellations andoverflights. Advance knowledge of wind shear conditions facilitatesplanning for efficient runway shifts which, in turn, promotes moreefficient airport operation.
Note that for this study, benefits are calculated incrementally to a"reference system." The reference system at an airport consists of the windshear equipment already in place or contractually obligated at that site.
B. Safety Benefits Algorithm
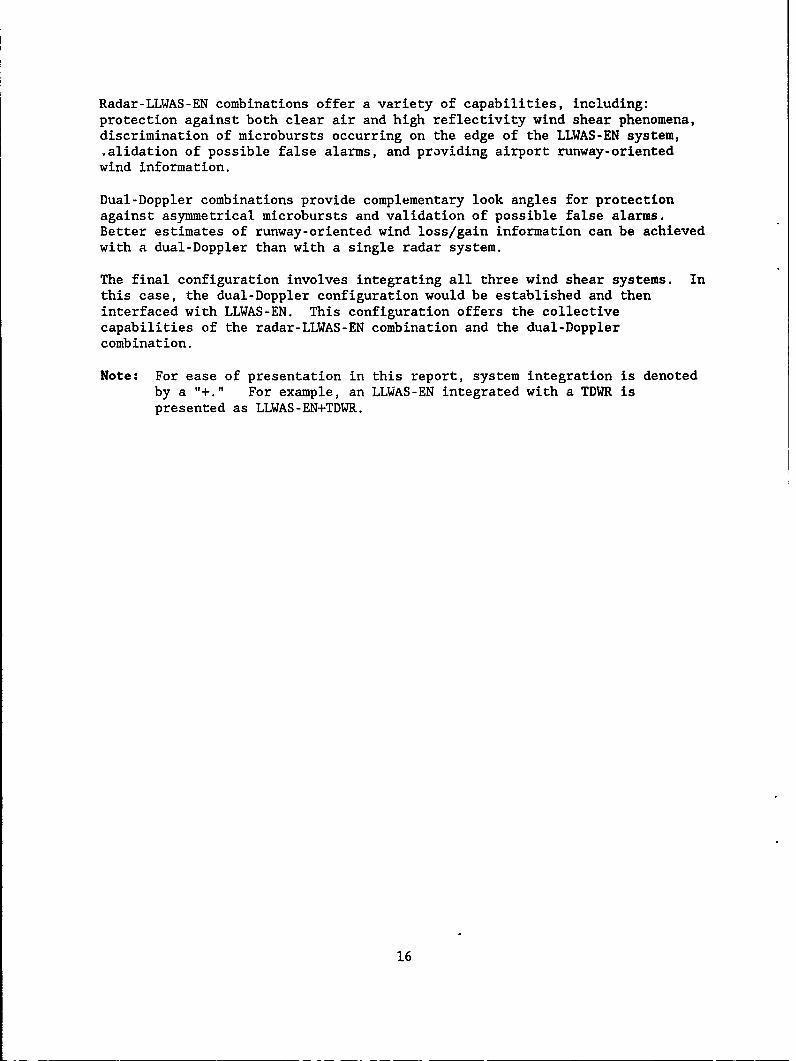
The algorithm used to estimate site-specific safety benefits as well asmnemonic definitions are presented in Figure III-1. Descriptions of keyvariable inputs to the safety benefits algorithm are discussed below.
1. Historic Accident Rates (ACRATE,
A variety of studies of aircraft accidents and incidents related tolow-altitude wind shear have been conducted to date (References 3, and 7through 13). Table III-1 summarizes the historical data on wind shear-relatedaccidents from 16 4 through 1985. For the present study, the 1975-1985 periodwas used to develop values for ACRATE, accident rates by user class, Duringthis period, wind shear-related accident rates are 1.228 x 10⁻⁷, 1.292 x 10⁻⁷,and 0.601 x 10', for the scheduled commercial, non-scheduled commercial, andnon-commercial user classes, respectively. Appendix A gives a more detailedpresentation of the wind shear-related accidents that occurred from 1964through 1985 at FAA towered airports.
19
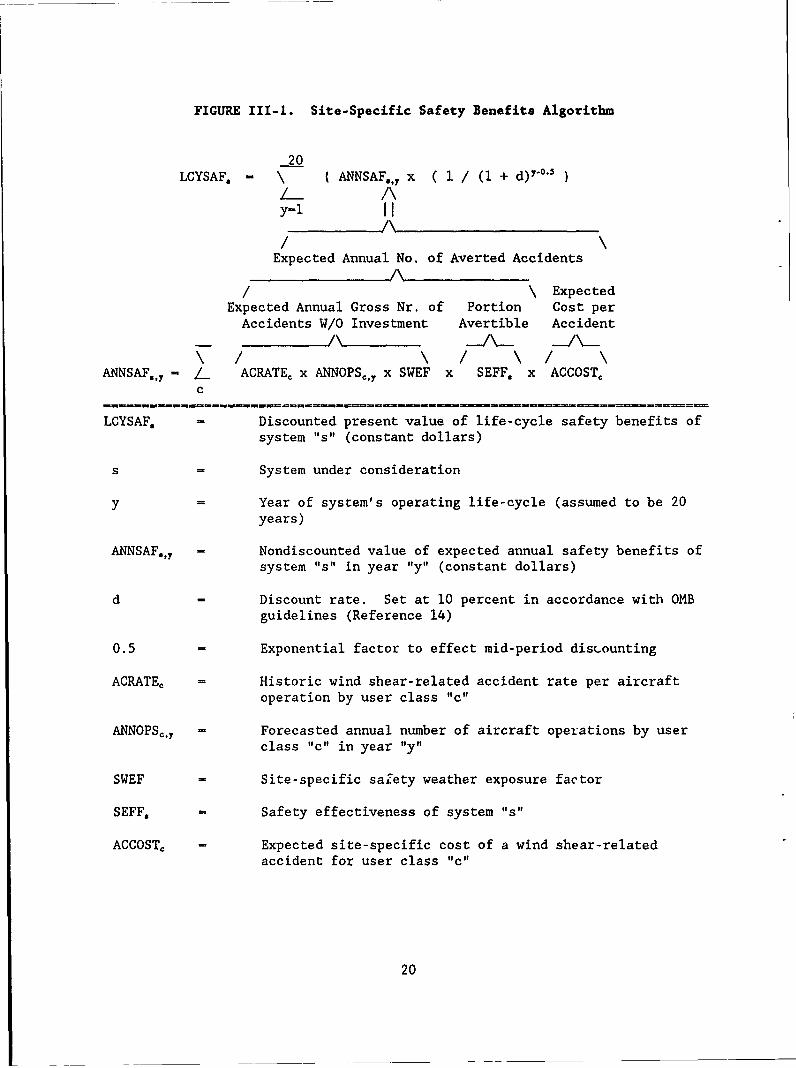
FIGURE IllI-. Site-Specific Safety Benefits Algorithm
20LCYSAF. - ( ANNSAF,,, x ( I / (1 + d)y-0.5
y-1 II//
Expected Annual No. of Averted Accidents
/ \ ExpectedExpected Annual Gross Nr. of Portion Cost perAccidents W/O Investment Avertible Accident
t- / \ / \ / \ANNSAF,, - / ACRATE x ANNOPS,y x SWEF x SEFF, x ACCOST,
c
LCYSAF. - Discounted present value of life-cycle safety benefits ofsystem "s" (constant dollars)
s = System under consideration
y Year of system's operating life-cycle (assumed to be 20years)
ANNSAF,, - Nondiscounted value of expected annual safety benefits ofsystem "s" in year "y" (constant dollars)
d - Discount rate. Set at 10 percent in accordance with OMB
guidelines (Reference 14)
0.5 = Exponential factor to effect mid-period discounting
ACRATEC Historic wind shear-related accident rate per aircraftoperation by user class "c"
ANNOPSy Forecasted annual number of aircraft operations by userclass "c" in year "y"
SWEF - Site-specific safety weather exposure factor
SEFF. - Safety effectiveness of system "s"
ACCOSTc = Expected site-specific cost of a wind shear-relatedaccident for user class "c"
20

IABLE III-I. Summary of Historic FAA Towered Airport Wind Shear-Related Accidents and Rates
Nr of Civil Aircraft Low-Level Wind Shear
Number of Low-Level Opns at FAA Towered Accident Rate per
Wind Shear Accidents 11 Airports (Hill) 2/ 10 Million Operations
Schd Nonschd Schd Nonschd Schd Nonschd
Year Comm Corm Noncon Total Cor Corn Noncomr Total Comm Comm Noncomm Total
1964 2 0 0 2 7.4 0.7 20.9 29.1 2.7 0.0 0.0 0.7
1965 1 0 1 2 7.5 0.9 23.6 31.9 1.3 0.0 0.4 0.6
1966 2 0 3 5 8.2 1.0 28.7 37.9 2.4 0.0 1.0 1.3
1967 0 1 0 1 8.6 1.3 34.5 44.3 0.0 8.0 0.0 0.2
1968 1 0 2 3 9.9 1.4 38.4 49.6 1.0 0.0 0.5 0.6
1969 0 0 2 2 10.7 1.5 40.3 52.5 0.0 0.0 0.5 0.4
1970 1 0 1 2 10.8 1.5 40.5 52.8 0.9 0.0 0.2 0.4
1971 1 0 0 1 10.1 1.3 39.4 50.7 1.0 0.0 0.0 0.2
1972 3 0 2 5 9.7 2.0 38.4 50.1 3.1 0.0 0.5 1.0
1973 6 0 0 6 9.8 2.1 38.8 50.7 6.1 0.0 0.0 1.2
1974 2 0 0 2 9.5 2.4 42.2 54.0 2.1 0.0 0.0 0.4
1975 5 0 4 9 9.4 2.7 44.2 56.2 5.3 0.0 0.9 1.6
1976 1 0 1 2 9.3 2.9 47.6 59.8 1.1 0.0 0.2 0.3
1977 1 0 1 2 9.8 3.3 51.0 64.0 1.0 0.0 0.2 0.3
1978 0 1 3 4 10.1 3.8 50.8 64.6 0.0 2.7 0.6 0.6
1979 0 1 3 4 10.4 4.4 51.7 66.5 0.0 2.3 0.6 0.6
1980 0 1 3 4 10.7 4.1 49.0 63.7 0.0 2.5 0.6 0.6
1981 0 1 4 5 10.1 4.3 44.6 59.0 0.0 2.3 0.9 0.8
1982 3 2 2 7 9.6 4.5 34.1 48.3 3., 4.4 0.6 1.4
1983 1 0 4 5 10.7 4.8 35.3 50.9 0.9 0.0 1.1 1.0
1984 2 0 3 5 11.8 5.7 3.0 54.5 1.7 0.0 0.8 0.9
1985 1 0 1 2 12.1 6.1 37.2 55.4 0.8 0.0 0.3 0.4
Total, 64-85 33 7 40 80 216.2 62.3 868.2 1146.7
Total, 75-85 14 6 29 49 114.0 46.4 482.5 643.0
Mean, 64-85 1.5 0.3 1.8 3.6 9.8 2.8 39.5 52.1 1.527 1.123 0.461 0.698
Mean, 75-85 1.3 0.5 2.6 4.5 10.4 4.2 43.9 58.5 1.228 1.292 0.601 0.762
1/ See Appendix A
2/ Source: Reference 19 (adjusted by APO-220 for recategorization by user class)
21

2. Forecasted Annual Aircraft Operations (ANNOPSc,)
Air traffic activity, as measured by aircraft operations is one of twoaccident exposure factors used to quantify site-specific safety benefits.Site-specific activity forecast inputs have been developed by APO's ForecastBranch (Reference 15). These annual activity projections are considered overthe assumed 20 year life-cycle of the candidate wind shear detection systems.
3. Safety Weather Exposure Factor (SWEF)
The discussion in Chapter I suggests that a strong relationship exists betweenthe presence of microbursts and wind shear. Consequently, weather(specifically microbursts) is the second exposure factor used to quantifysite-specific safety benefits. This safety weather exposure factor is definedas:
SWEF = Site-Specific Annual MicroburstsNational Average Annual Microbursts Per Site
Estimates of the number of microbursts have been developed for all FAA-toweredsites based on the relationship between microbursts and thunderstorm days at agiven site. These estimates, as well as site-specific safety weather exposurefactors, have been developed under the System Engineering and IntegrationContract (SEIC) for FAA's System Engineering Service (Reference 6).
4. System Safety Effectiveness: Fraction of Avoidable Accidents (SEFF,)
The fraction of accidents that are avoidable by a wind shear detection systemis the system's safety effectiveness. Specifically, safety effectiveness isdefined as the system's ability to detect hazardous wind shear phenomena andprovide sufficient warning of such weather phenomena to pilots to prevent awind shear accident.
Four atttibutes have been used to develop a system safety effectivenessmetric:
0 Detection - the ability to correctly identify terminal area wind shear
phenomena.
* Timeliness of detection and warning with respect to the occurrence of awind shear event.
0 Intensity - the ability to provide accurate information on the strength ormagnitude of the wind shear relative to operational runways.
* Location - the ability to accurately report wind shear phenomena'sposition with respect to its impact on terminal airspace.
System safety effectivities have been developed under the SEIC for FAA'sSystem Engineering Service, and are presented in Table 111-2, on a regionalbasis (Reference 6). Effectivity regions are defined in Appendix B.
22

TABLE 111-2. Wind Shear System Safety Effectivities(Fraction of Avoidable Accidents by System)
Region
System E/NE SE U LSW R/H WC/T
Airborne* 0.55 0.55 0.55 0.55 0.55
LLWAS-6 0.10 0.10 0.10 0.10 0.10
LLWAS-EN 0.49 0.48 0.49 0.48 0.48
TDWR 0.79 0.80 0.78 0.76 0.80
ASR 0.55 0.63 0.51 0.47 0.63
TDWR+LLWAS-EN 0.84 0.85 0.84 0.84 0.85
ASR+LLWAS-EN 0.71 0.74 0.69 0.69 0.74
TDWR+ASR 0.83 0.86 0.81 0.79 0.86
TDWR+ASR+LLWAS-EN 0.89 0.90 0.88 0.86 0.90
Regions
E/NE East/NortheastSE SoutheastM/SW Midwest/SouthwestR/H Rocky Mountain/High PlainsWC/T West Coast/Tropical (Hawaii, Caribbean)
*See Chapter V for sensitivity analysis
Source: Reference 6
23

5. Expected Cost of a Wind Shear Accident (ACCOST)
The estimated cost of a wind shear accident is a function of the number andvalue of human injury (both fatal and nonfatal) and aircraft damage associatedwith the accident. ACCOST,, the expected site-specific cost of a wind shearaccident by user class (c), is derived below.
ACCOST, -
Personal Injuries (Fatal, Serious, Minor)/(OCC, x ((PFATxVLIF) + (PSINJxCSINJ) + (PMINJxCMINJ)))
+
Aircraft Damage/\
((PDESTxCDEST) + (PSDAMxCSDAM) + (PMDAMxCMDAM,))
CDEST: DEFINITION: Replacement cost of a destroyed aircraft by user
class "c"
VALUE: Varies
SOURCE: Reference 16 and ADA Critical Value file
CMDAM: DEFINITION: Restoration cost of a minorly-damaged aircraft byuser class "c"
VALUE: None (due to relative insignificance)
CMINJ: DEFINITION: Cost of a minor injury
VALUE: $2,300
SOURCE: Reference 16
CSDAMc: DEFINITION: Restoration cost of a substantially-damagedaircraft by user class "c"
VALUE: Varies
SOURCE: Reference 16 and ADA Critical Value file
CSINJ: DEFINITION: Cost of a serious injury
VALUE: $640,000
SOURCE: APO-220 based on Reference 17
OCC: DEFINITION: Number of occupants by user class "c"
24

VALUE: Varies
SOURCE: ADA Critical Value File
PDEST,: DEFINITION: Probability of an aircraft being destroyed in a
wind shear accident by user class "c"
VALUE: Varies
SOURCE: Appendix
PFAT,: DEFINITION: Probability of a fatality per occupant in a wind
shear accident by user class "c"
VALUE: Varies
SOURCE: Appendix
PMDAM,: DEFINITION: Probability of an aircraft being minorly-damagedin a wind shear accident by user class "c"
VALUE: Varies
SOURCE: Appendix
PMINJc: DEFINITION: Probability of a minor injury per occupant in awind shear accident by user class "c"
VALUE: Varies
SOURCE: Appendix
PSDAM,: DEFINITION: Probability of an aircraft being substantially
damaged in a wind shear accident by user class "c"
VALUE: Varies
SOURCE: Appendix
PSINJc: DEFINITION: Probability of a serious injury per occupant in a
wind shear accident by user class "c"
VALUE: Varies
SOURCE: Appendix
VLIF: DEFINITION: Value of a statistical life
VALUE: $1,500,000
SOURCE: Reference 17
25
C. Efficiency Benefits
1. Overview
Wind shift lines can make it necessary to shift runways in operation so that
landing and departing aircraft can continue to operate into the wind with
acceptable crosswinds. Airport traffic control tower (ATCT) watch supervisors
are responsible for dlanning and timing these runway changes. Currently,LLWAS-6, PIREPs, and weather reports are the information sources for runway
shifts. Although these sources of information are valuable, they provide a
limited "picture" of the wind features in the vicinity of the airport. At therequest of the FAA, a Doppler radar research project was conducted at DenverStapleton International Airport by the National Center for AtmosphericResearch (NCAR) during the summer of 1984. Findings of this researchindicated that Doppler radar-generated gust front advisories can make planningfor runway changes much more efficient. The documented results of thisresearch project provide a point of departure for quantifying the efficiencybenefits provided by the wind shear detection systems considered in thecurrent effort.
2. The Microburst Advisory Service Project
On May 31, 1984, a Boeing 727 aircraft encountered a wind shear on takeoffroll and lift-off from Stapleton International Airport that resulted in theaircraft striking an instrument landing system antenna approximately 1100 feetbeyond the end of the runway. The aircraft returned safely to the airport andwas found to have two gashes in its fuselage. NCAR, which at times operatesone or more Doppler weather radar units in the vicinity of Stapleton formeteorological research, verified that the aircraft had encountered a
microburst. Basee nn this incident and the results of the 1982 NCAR JointAviation Weather z udy (JAWS) Project, which showed microbursts to be a commonfeature in the Denver area during the thunderstorm season, the FAA requestedthat NCAR use one of its Doppler weather radars to set up and operate a
microburst advisory service for the Stapleton control tower during the 1984
thunderstorm season. NCAR had the service in operation by early July. Theservice was named Classify, Locate, and Avoid Wind Shear (CLAWS). The serviceremained in operation for a six-week period during the peak of Denver's 1984thunderstorm season.
During the course of the project, microburst advisories were issued to pilotson final approach, awaiting takeoff clearance, and on initial takeoff climb.
In addition to microbursts, NCAR found another low-altitude wind shearphenomenon of operational significance to aviation and air traffic control -
the wind shift line (e.g., gust front).
Early in the six week operating period, NCAR radar meteorologists noticed that
they coula clearly see gust fronts and other wind shift lines approaching andpassing over Stapleton. After some experimentation, NCAR initiated an
informal "gust front" advisory service for these wind shift lines. NCAR wouldverbally advise the ATCT watch supervisor of the expected time of arrival ofthe wind st..ft line at the Stapleton LLWAS centerfield sensor and itsestimated maximum strength and direction. These advisories were informal in
26
that each watch supervisor was free to ignore, test, or use the advisories.After a confidence-building period in which the advisories were informallyevaluated by the watch supervisors, the advisories began to be usedoperationally. The use of these advisories were solely for runway managementpurposes. They were not used to advise landing and departing pilots ofpotential wind shear encounters, which was beyond the resources of theproject.
NCAR issued advisories for nearly 30 of the 32 wind shift lines observednearing Stapleton over the six-week period. An unknown number of theseadvisories were used in support of operations. The watch supervisors foundthat the gust front advisories provided a relatively clear, accurate, timely,and reliable picture of approaching wind lines. The data set collected forthese advisories indicated the following:
* Advisory lead times ranged from 3 to 50 minutes and averaged 17 minutes,consistent with Air Traffic's request for 20 minute lead times. NCARpersonnel felt that they had the capability of providing significantlylonger lead times.
* Estimated time of arrival accuracy ranged from perfect to as much as 10minutes off with an average error of 4 minutes.
* Estimated maximum wind strength accuracy ranged from perfect to as much as19 knots off with an average error of 7 knots.
Based on these results and consensus opinion of the watch supervisors, it wasconcluded that the -idvisories greatly enhanced both the planning and timing ofrunway shifts (i.e., selecting the new r:Lwav configuration and deter-niningwhen the shift should be started). These advisories enabled the watchsupervisors to:
* Move traffic into place on the new runway configuration in anticipation ofthe arrival of a wind shift line, reducing traffic disruption andincreasing runway utilization;
* Reduce/eliminate the need for a second runway shift due to the incorrectselection of the appropriate runway configuration the first time(operationally called "chasing the winds"); and
0 Reduce/eliminate unnecessary runway shifts where the watch supervisorfinds out after the fact that the actual wind conditions did not warrant arunway change (e.g., the anticipated wind strength that led to the runwayshift either did not occur or was of such short duration that it had nooperational impacts).
Elimination of these three problems translates into potential efficiencybenefits that can be attributed to a Doppler-based runway management product.In an attempt to quantify these potential benefits, follow-up interviews wereconducted with the three Stapleton watch supervisors. Based on thesediscussions, a methodology was hypothesized for estimating the potentialannual efficiency benefits and first-cut delay estimates were calculated for
27

Stapleton for 1984. The methodology and estimates are outlined inTable 111-3. Except for delay costs per minute, all values presented in thetable are averages of estimates given by the three Scapleton watchsupervisors.
As illustrated in Table 111-3, the annual delay benefits are expressed as theproduct of the potential cost avoidance per affected runway shift (Columns Bthrough L) for each of the three runway shift problems and the estimatednumber of times each type of shift occurs during the course of a year (ColumnsM thirugh 0). The potential cost avoidance per affected runway shift (ColumnsJ through L) is expressed as the product of the typical demand (number ofdepartures/arrivals in queue) (Columns B and C), times delay per aircraftoperation (Columns D through G), and the cost per aircraft delay minute(excluding value of passengers' time). Based on the expected annual frequencyof each of these three problems, the estimated annual number of runway shifts,and the potential cost avoidance per affected runway shift, annual delay costavoidance at Stapleton during 1984 was approximately $877,000.
3. Efficiency Benefits Algorithm
The methodology described above has been used as a foundation for quantifyingefficiency benefits provided by candidate wind shear detection systems. Thealgorithm used to estimate site-specific efficiency benefits as well asmnemonic definitions are presented in Figure 111-2. Descriptions of keyvariable inputs to the efficiency benefits algorithm are discussed below.
a. Forecasted Annual Aircraft Operations (ANNOPS,70}
Similar to the safety benefits, air traffic activity (measured by aircraftoperations) is one of two exposure factors used to quantify site-specificefficiency benefits. Site-specific activity forecast inputs have beendeveloped by APO's Forecast Branch (Reference 15). These annual activityprojections are considered over the assumed 20 year life-cycle of thecandidate wind shear detection systems.
b. Average Time Spent In Queue per Aircraft During Wind-RelatedRunway Shifts (QTM)
QTM, the average time spent by aircraft in queue during wind-related runwayshifts, is projected to be 30 minutes for scheduled commercial users and 20minutes for other users. These figures are based on average flightcharacteristics.
c. Average Delay per Aircraft Operation (DLOP)
DLOP, the average number of minutes of delay per aircraft operation duringwind-related runway shifts, is estimated to be 5.0 minutes for all aircrafttypes and user classes, based on a weighted average of the correspondingvalues in Table 111-3.
28

0 O
00) 40 1- 00 IS V>1
4
0 0P41 1 .0
4.44 %n o
CO W c%3 '. 4
344' al 014
VS 14 M 43
44 44
4. 00 01 00 r08 1 00 00i
.2401 0- In tn NO in 304o 0.) 1 C4 3C C D o. -0443
P4 01 .4 00 043.
.014 ' .0I 3 - 00 00 000 $
L) I r.l1 Iv 4'0c
.2 caI. ~ 0 00 00 4340
,41
0.: 5.4 - ~ 0 0 0 0 0A. 020
0) 43 1113 .14 0o~ 2) 1.000000
0 45 04 C I4
.2I 21414r>2 '. I : .2 54 0I 0 I 0Pr0 444 0 , :3 >.N42J-Z0
.0 44 4 8a1 c 4'- . 0144 1 ' to40
43 4 14V I.4aIW
34 013 .4 0 141 I)W n- i-44 >5 0 0I4 14 I0
V 42,a r. 14 44
02 v . G
94 0 C 2 C2 b43L)4 4 0, 14 I) V) mD 0 nC. o00
0 43~ 4 :
01 4) I 1 0u.02 4 .1 to2a I.4.V
11.4 01 .24 -. I800 0410 141
'.4~~~$ I $42-'315
114 * m 14 0 0-4
0w 0 0r* 0 X -~:1 61 -4 W2( I2 4
8 H 0 I 8 0 .- 432IN 0N N . 20I $44 2 .0r 1 0~ E o4.4l~ I 144 >1
4)4.514 I 4 :O 001 cor 0. 22
02114. > ~ +4a:1t9I2 Iq 6u a1- r 2
$44 0 0 0 1
0 I .4 430143 00 14
14 .14 :-l w 3 cI 0 0 OD2.
D. -1 a) ca 1 00 &
2 0 I .1. 4
04144) M) 1 03 C40 0I 14lE- 03 4)~ '0 0
:18
1 1I I I4 IS~ 4 .1 .14
cc) 41 Sa-I I 0 0I 0 C.)J 0 14
Iu 1- IN BN ItI .-I A r.-N
0 ~ JI 0 11 00 01 I04 I 14 - 1
IL :.1- 0 3
to 00 10
I 0V
1 2 9
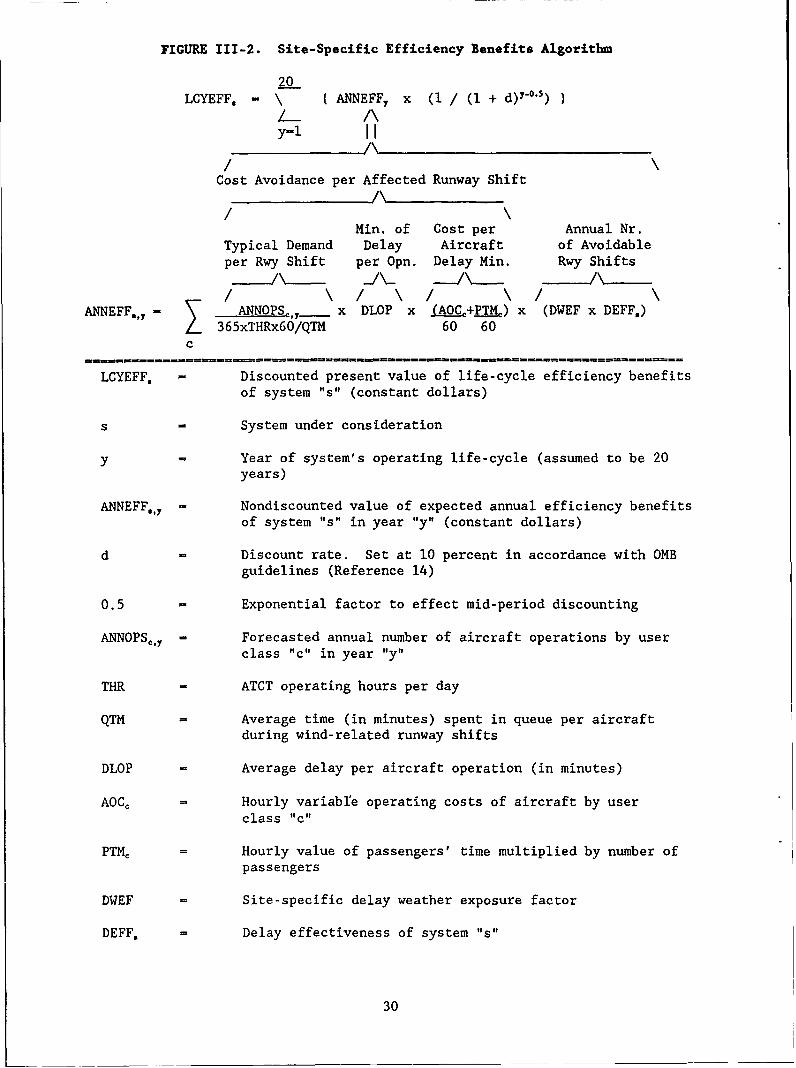
FIGURE 111-2. Site-Specific Efficiency Benefits Algorithm
20LCYEFF. - \ ANNEFF7 x (I / (1 + d)'0 5)
y-1 IIA
Cost Avoidance per Affected Runway Shift
A
Min. of Cost per Annual Nr.Typical Demand Delay Aircraft of Avoidableper Rwy Shift per Opn. Delay Min. Rwy Shifts
/ \/I \/I\ANNEFF,,y - . ANNOPS,,_ x DLOP x A0+PTM) x (DWEF x DEFF.)
L_ 365xTHRx6O/QTM 60 60c
LCYEFF. - Discounted present value of life-cycle efficiency benefitsof system "s" (constant dollars)
s = System under consideration
y Year of system's operating life-cycle (assumed to be 20years)
ANNEFF,, - Nondiscounted value of expected annual efficiency benefitsof system "s" in year "y" (constant dollars)
d - Discount rate. Set at 10 percent in accordance with OMBguidelines (Reference 14)
0.5 - Exponential factor to effect mid-period discounting
ANNOPS,, - Forecasted annual number of aircraft operations by userclass "c" in year "y"
THR = ATCT operating hours per day
QTM Average time (in minutes) spent in queue per aircraft
during wind-related runway shifts
DLOP Average delay per aircraft operation (in minutes)
AOCc Hourly variabe operating costs of aircraft by userclass "c"
PTM= Hourly value of passengers' time multiplied by number ofpassengers
DWEF = Site-specific delay weather exposure factor
DEFFo Delay effectiveness of system "s"
30

d. Aircraft Variable Operating Costs (AOC)
Aircraft variable operating costs by user class (Reference 16).
e. Value of Passengers' and Occupants Time (PTL)
Hourly value of passengers' time multiplied by number of passengers forcommercial users and multiplied by the number of occupants for noncommercialusers. A distinction between passengers and occupants is made for thiscalculation, since crew aie included in aircraft operating costs forcommercial users and are excluded for noncommercial users (Reference 16).
f. Delay Weather Exposure Factor (DWEF)
The overview to the section on efficiency benefits suggests that arelationship exists between the number of gust fronts and the number of runwayshifts at an airport. Consequently, weather (specifically gust fronts) is thesecond exposure factor used to quantify site-specific delay benefits. Thisdelay weather exposure factor is defined as:
DWEF - Site-Specific Annual Gust Fronts x Runway ShiftsGust Front
Estimates of the number of gust fronts have been developed for all FAA-toweredsites based on the relationship between gust fronts and thunderstorm days at agiven site. These estimates, as well as site-specific delay weather exposurefactors, have been developed under the SEIC for FAA's System EngineeringService (Reference 6).
g. System Delay Effectiveness: Fraction of Avertible Runway Shifts(DEFF.)
The fraction of runway shifts that are avertible by a wind shear detectionsystem is the system's delay effectiveness. Specifically, delay effectivenessis defined as the system's capability to detect meteorological conditionsrequiring change of active runway or terminal area approach/departurepatterns, and to provide timely warning of such weather phenomena to airtraffic controllers before it arrives at the airport. As with safetyeffectivities, four attributes have been used to develop a delay effectivenessmetric: detection, timeliness, intensity, and location.
System delay effectivities have been developed under the SEIC for FAA's SystemEngineering Service, and are presented on a regional basis in Table 111-4(Reference 6). Note that airborne systems do not exhibit any delayeffectiveness, so that this system type does not appear in Table 111-4.
31

TABLE 111-4. Wind Shear System Delay Effectivities
(Fraction of Avoidable Runway Shifts by System)
Region
System E/NE SE M/S R/H WC/T
LLWAS-6 0.08 0.07 0.09 0.08 0.08
LLWAS-EN 0.26 0.24 0.28 0.26 0.26
TDWR 0.72 0.78 0.66 0.59 0.66
ASR 0.49 0.56 0.42 0.35 0.44
TDWR+LLWAS-EN 0.75 0.80 0.70 0.64 0.70
ASR+LLWAS-EN 0.56 0.59 0.53 0.46 0.52
TDWR+ASR 0.75 0.80 0.70 0.64 0.70
TDWR+ASR+LLWAS-EN 0.78 0.82 0.74 0.69 0.74
Regions
E/NE East/NortheastSE SoutheastM/SW Midwest/SouthwestR/H Rocky Mountain/High PlainsWC/T West Coast/Tropical (Hawaii, Caribbean)
Source: Reference 6
32

D. Life-Cycle Benefits Summary
Life-cycle benefits are derived by first calculating a system's safety andefficiency benefit, respectively, for each year of the system's economic life(20 years), then discounting to present value, and summing. For estimatingbenefits, all factors other than annual aircraft activity are assumed toremain constant throughout the 20-year system life-cycle. Present valuelife-cycle benefits (BPV) of a wind shear system can be expressed as:
20
BPV, - ___ (ANNSAF,, + ANNEFF,,)/((1 + d) Y'° ' )
y-i
where "y" is each year of an assumed 20 year economic life, "ANNSAF, 7y" is thesafety benefit for system "s" in year "y", "ANNEFF.,,' is the efficiencybenefit of system "s" in year "y", "d" is the OMB-prescribed discount rate(10) percent, and 0.5 is the exponential factors to effect mid-perioddiscounting.
33

CHAPTER IV - LIFE-CYCLE COSTS
Two types of costs are relevant to the analysis--nonrecurring costs andrecurring costs. Each of these cost categories is described below:
0 Nonrecurring costs are one-time expenditures associated with theacquisition of a system. These include the costs of designing,manufacturing, installing and planning for the operation and support of awind shear system. Nonrecurring costs are comprised of research &development (R&D) and facilities & equipment (F&E) expenditures. Within
this category, only F&E wind shear system costs are considered inChapter V - Results.
* Recurring costs are expenditures for operations and maintenance during a
system's life cycle (assumed to be 20 years for wind shear systems).Recurring costs are comprised of operations and maintenance (O&M)expenditures.
Table IV-I presents average unit 20-year-life-cycle costs for the wind sheardetection systems evaluated in this report. These include F&E costs as well
as O&M costs for each candidate system. T1ie top half of the table presentsrespective cost figures for the candidate wind shear systems on a "stand-alone" basis, while the bottom half of the table presents cost figures forsystem integratio- The cost of an integrated system is equal to the sum ofthe respective component system costs and integration costs.
35

TABLE IV-1. Life-Cycle Costs
Average Unit Life Cycle CostsSystem (000's of Nondiscounted 1989 $)
LLWAS-EN
F&E 557O&M 330
TDWR
F&E 4,000O&M 6,142
ASR (Modification)
F&E 293O&M 95
System Integration
TDWR+LLWAS - EN
F&E 217O&M 65
ASR+LLWAS-EN
F&E 2400&M 55
TDWR+ASR
F&E 490O&M 209
TDWR+ASR+LLWAS - EN
F&E 708O&M 2715
Source: Reference 6 and FAA program offices
36

CHAPTER V - RESULTS
A. Assumptions and Ground Rules
Several assumptions and ground rules (in addition to those presented inChapter III) have been developed for applying the wind shear criteria to FAAtowered sites. These assumptions and ground rules are highlighted below:
* Candidate airports for LLWAS-EN, TDWR, and LLWAS-EN+TDWR are all FAAtowered sites.
* The criteria does not apply to the establishment of an ASR-9 site, butrather to wind shear modification of an existing (or planned) ASR-9. Atotal of 103 sites already scheduled to receive an ASR-9 are consideredcandidates for wind shear modification. Twenty-one ASR-9's have not beenconsidered for modification for one or more of the following reasons: 1)the ASR-9 is for military use, 2) there are two ASR-9's at an airport, and3) there are coverage gaps caused by obstacles or distance of the ASR froman airport.
* The LLWAS-6 is not considered as a candidate system at airports where ithas not already been sited.
0 No additional wind shear-related benefits are achieved by integrating anLLWAS-6 with a TDWR or modified ASR-9. Consequently, a site may have a"stand-alone" LLWAS-6 with a TDWR or modified ASR-9.
* For a site to receive more than one system (LLWAS-EN, TDWR, or modifiedASR-9) only integrated systems are considered - no "side-by-side" systemsare considered for-these three wind shear system types.
* TDWR is considered part of the reference system at 44 sites undercontract. TDWR's at three support sites are excluded from the analysis:the FAA Technical Center, the FAA Academy, and Andrews AFB.
0 Where applicable, LLWAS-EN and TDWR are considered part of the referencesystem for ASR-9 modification sites. In other words, LLWAS-EN, TDWR, andLLWAS-EN integrated with TDWR are considered establishment candidates atASR-9 sites first. Then wind shear modification of the ASR-9 isconsidered. This assumption is based on the later implementation schedulefor ASR-9 modification relative to the implementation schedules forLLWAS-EN and TDWR.
0 The analysis is conducted both including and excluding airborne systems.When included, airborne systems are considered part of the referencesystem.
37
* The system safety effectiveness of the airborne system is 55% (see resultsfor sensitivity of this assumption). This level of safety effectivenessfor airborne systems is required for benefits associated with thesesystems to exceed their costs (Reference 5). As stated in Chapter III,airborne systems do not have any system efficiency effectiveness.
0 F&E costs associated with a reference system are considered "sunk" (zero).
0 Average unit life-cycle O&M costs for the LLWAS-6 is $180,000 (non-discounted 1989 dollars) (Reference 20).
* All systems are evaluated over the 1990-2009 interval.
B. Criteria Results
The establishment criteria for wind shear detection systems have been appliedto all FAA towered sites, in accordance with the assumptions and ground rulesdiscussed above. Due to the uncertainty of the effectiveness of the airbornesystem, the criteria application has been applied both with and without theairborne system as a candidate system for wind shear detection.
1. Results With Airborne Systems
Tables V-l, V-lA, and V-lB present the results of the criteria applicationwhen airborne systems are included in the analysis. Each table considers theairborne system at a different level of safety effectiveness--55%, 82.5%, and27.5X, respectively. These tables illustrate the relationship between thesafety effectiveness of the airborne system and the total number of systemsthat result from the criteria application. In general, a higher airbornesystem safety effectiveness results in fewer total wind shear systems whenapplying the criteria. This is intuitive since the LLWAS-EN, TDWR, andmodified ASR-9 systems are competing for the same set of benefits as theairborne systems. In this regard, introducing the airborne system at anyaccepted level of safety effectiveness will diminish the number of sites thatqualify for competing systems as well as the total number of competing systemsthat result from criteria application.
2. Results Without Airborne Systems
Table V-2 presents the results of the criteria application when airbornesystems are excluded from the analysis. The first part of the table displaysthe number of sites for each optimal wind shear system configuration. A totalof 121 sites qualify-for one or more wind shear detection systems under thisscenario.
The second part of the table presents the total number of systems (eitherstand-alone or integrated) that result from the criteria application. A totalof 179 systems result from application of the criteria without consideringairborne systems.
38

TABLE V-1. Results With Airborne Systems*
Optimal System Configuration Number of Sites
LLWAS-EN 3TDWR 19ASR 33TDWR+LLWAS - EN 21
ASR+LLWAS-EN 5TDWR+ASR 0TDWR+ASR+LLWAS-EN 6
Site Total 87
Summary
System Configuration Total Number of Systems
LLWAS-EN 36TDWTR 46AS. 44
System Total 126
*Airborne System Safety Effectivity = 55%
39

TABLE V-lA. Results With Airborne Systems (High Effectivity Scenario)*
Optimal System Configuration Numnber of Sites
LLWAS-EN 1TDWR 18ASR 18TDWR+LLWAS -EN 20ASR+LLWAS-EN 2TDWR+ASR 0TDWR+ASR+LLWAS -EN 6
Site Total 65
Summary
System Configuration Total Number of Systems
LLWAS-EN 30TDWR 44ASR 26
System Total 100
*Airborne System Safety Effectivity - 82.5%
40

TABLE V-lB. Results With Airborne Systems (Low Effectivity Scenario)
Optimal System Configuration Number of Sites
LLWAS-EN 22TDWR 19ASR 16TDWR+LLWAS -EN 21ASR+LLWAS -EN 23TDWR+ASR 0TDWR+ASR+LLWAS -EN 6
Site Total 107
Summa~ry
Sys tern Configuration Total Number of Systems
LLWAS-EN 72TDWR 46ASR 45
System Total 163
*Airborne System Safety Effectivity - 27.5%
41

TABLE V-2. Results Without Airborne Systems
Optimal Systeai Configuration Number of Sites
LLWAS -EN 38TDWR 19ASR 12TDWR+LLWAS -EN 21ASR+LLWAS-EN 25TDWR+ASR 0TDWR+ASR+LLWAS -EN 6
Site Total 121
Summary
System Configuration Total Number of Systems
LLWAS-EN 90TDWR 46ASR 43
System Total 179
42

REFERENCES
1. FAA Order 7031.2C, Airway Planning Standard Number One, Terminal AirNavigation Facilities and Air Traffic Control Services (APS-l).
2. Economic Analysis of Investment and Regulatory Decisions - A Guide, ReportNumber FAA-APO-82-1, January 1982.
3. Low Altitude Wind Shear and Its Hazard to Aviation, Report of theCommittee on Low-Altitude Wind Shear and Its Hazard to Aviation, NationalResearch Council, 1983,
4. Integrated FAA Wind Shear Program Plan, April 1987.
5. Final Rule, Airborne Low-Altitude Wind Shear Equipment and TrainingRequirements, September 1988.
6. Integrated Wind Shear System Deployment Study, December 1989, MartinMarietta Corporation, System Engineering and Integration Contract ForImplementation of the National Airspace System Plan,Contract DTFA01-84-C-00017
7. Cost-Benefit Analysis for Low-Level Wind Shear Alert System ((LLWAS)Enhancement Program, October 1986, Martin Marietta Corporation, SystemEngineering and Integration Contract for Implementation of Lhe NationalAirspace System Plan, Contract DTFAO-84-C-00017.
8. Life-Cycle Cost-Benefit Analysis for Terminal Doppler Weather Radar (TDWR)Project, July 1987, Martin Marietta Corporation, System Engineering andIntegration Contract for Implementation of the National Airspace SystemPlan, Contract Number DTFA01-84-C-00017.
9. "Thunderstorm Climatology," Thunderstorm Morphology and Dynamics, NationalOceanographic and Atmospheric Administration, February 1982, as cited inReference 3.
10. The Downburst, T. Theodore Fujita, University of Chicago, 1985.
11. Shrager, Jack J., The Analysis of National Transportation Safety BoardLarge Fixed-Wing Aircraft Accident/Incident Reports for the PotentialPresence of Low-Level Wind Shear, conducted by the FAA National AviationFacilities Experimental Center under contract with the FAA SystemsResearch and Development Service, Report Number FAA-RD-77-169, December1977.
12. Shrager, Jack J., The Analysis of National Transportation Safety Board
Small Multi-Engine Fixed-Wing Aircraft Accident/Incident Reports for thePotential Presence of Low-Level Wind Shear, conducted by the FAA NationalAviation Facilities Experimental Center under contract with the FAASystems Research and Development Service, Report Number FAA-RD-78-55, June
1978.
43
REFERENCES (Continued)
13. Shrager, Jack J., The Analysis of National Transportation Safety BoardSmall Single-Engine Fixed-Wing Aircraft Accident/Incident Reports for thePotential Presence of Low-Level Wind Shear, conducted by the FAA NationalAviation Facilities Experimental Center under contract with the FAASystems Research and Development Service, Report Number FAA-RD-79-3, May1979.
14. Discount Rates to be Used in Evaluating Time-Distributed Costs andBenefits, Circular A-94 (Revised), Office of Management and Budget, March27, 1972.
15. FAA Aviation Forecasts, 1990-2001, Report Number FAA-APO-90-1, March 1990,Office of Aviation Policy and Plans, Planning Analysis Division, ForecastBranch, APO-IIO.
16. Economic Values for Evaluation of Federal Aviation AdministrationInvestment and Regulatory Programs, Report Number FAA-APO-89-10, October1989.
17. Memoranda, General Counsel of the Office of the Secretary ofTransportation, June 22, 1990, Treatment of Value of Life in EconomicEvaluations.
18. The Stapleton Microburst Advisory Service Project: An OperationalViewpoint, Lloyd Stevenson, Transportation Systems Center, Cambridge, MA,Reports Number DOT/FAA/PM-85/21 and DOT/TSC-FAA-85-8, September 1985.
19. FAA Air Traffic Activity, FAA-AMS-400, various annual editions.
20. FAA Weather Sensor Branch, ANW-140.
44

I i O
44 154 1
0 0 1
4 1to4 Im 0 C'4 iin
01 C) CfI 0) IDa IDIDrlD 0 (q
I7 W 0 0 N 0 m 0 0
4) to
V1 0 4 0a 10 0 .40 03 m .4 1 0aaQ 0 m Q 0 m 0 Q 014.
S410 I 01 a0 0 0 0aW 0 0 0 7C 0 a0 0 N NOOO 0 H 0 70 0.4 .4M0 0.a
0 ) I aD .4 03 CO0 .4 ID Q- 0 10a 0 1 00 0 Q 30 to 0
I3 1
$41
141 Z 4(.
&4 v3
430
0
.4143
444
r1 0 1$4 .4m<11 i
m1 " E I
43 NIANm* Hc14 N u wwl 3
go 01mr o0mg ' g L
140ti0 4 Z000 4 H .
141
140 433V
43 L) r L 100 00a w0' ) o w 1 U
II x0 0D 0 0 3- x 4 ) ).40 0 t
0 .4 ' I441r 0 :2 r 4 44)'4 U 0 4 3 :r :0.4 .0 0 0 b
14 14 w lo4 ID 0:. q ' > '0 .~ . N . . . . .4 .41
-z %n m 0.7N113I-s1N3< 0oWNN iN.4 NU N WON " N H'M. Or N %43 N NONIDOI r4D W 0 .- N I7 I "WCO03N CM0NID C 430N.0 N 0
ra00 0 a N4 I3 U .N < C -Z00 -10. 0 7 00000 0000
H I I 1D D D I I IUD O .. 0I U .I I 0 .I 0I I I
41 02'0
1A-

44 4
En 00 02 Nta W 4 W-~- C/2fO 00- to0 0O w- N 00)0 V) o o c nN In
-44-
0I
M 47 14 -7 0 N -0l r
'A I
*N I NO OO OO OC40 ON O7100000-210700 N000 12000
IA
Ci xxxxx xxx x x~ x x x4x> 4 x x xx x x xXX
--4,
00 0 0 0 0 0 0
.00 (
00 ho 0 w wwowwww w0 0ww t 0
.4 . 4 . *0* A ~ 0 A. 4 3.
N >OD 0)
S4 I 0) CD l o I I o 1 l i I '01 0043 .0Jt 001 04 '-4 V)f. 4 0 04020U 'I E0
I~ ~ 1 J4 N C0 Iq 0 0 0 00 0..4 0..4 0 0 .4 -0 .. 0 0 0 1 N..4N-i
wr
00 00 54 U. 0 0M )z U L4 0 .2.9 L) m 044 L) 'u4 u2 04
0I . 0 00 U .- 4 0 0 0 C
.1 4- A 0 0.'4 0 3 0> 00 0 L) P,4 4 0 0443 4 40000.4 400 :s .0.0 1 0 UA0r4 0 g 0 P 4 49r
r01w 4 - 2 2 2 > 0 0 0 2 0 A . - 0 3 4
. . . 2 2 0A . 4 3 U
N, -40 r, N N r N, N r4 N N4 N 0, N -4-4W-W-4-4-4 0 0 N0 O 0 N (0 DCD
0 0 - 02 N .~ .4 '(0 0 to) 1 :3 4 02 4 0 - -I 0 - N 02 . 4 )2 . 0 N 1 I 4 .I 4 ' 01 -, INC . I N C 2 .04 0 .7 0 .~00 0 7. . . , 01 7 0 T4
1400o01C Y . m o - 0)00-3 000m 00 N 0No 0l10 m n r, NN . 0N -4 4 0 0 04O~ 00 0 4 N -0 NM NOO O- 0H'2-OfN N H 0 -400 00 41 4N00 NCN C . - 10 /N 0 M
N 4M2 Nqr
AA-2

*44*
44 4 to~4 -4 vi
04
0 fa f4
a)' V) U) 0)))U U f00 r0
'o I4 f,4 -NW40 V n d44(j
4 (U
4 * W 0 0)
434
a Q 0 4 0 03 C QaC
4 4
to 4414
14~ 0-. eq .1- 40'4 (1 (1)n04
4l In C-
1U4
44
to OD C) Lr' 4
43-44
t, NN
to I 4 4 4
.44 *4 OD 4
C13 CIV ' -
04 40
401 0 to- 0 .-. m N4, e0a 0 N
0 biP. N 0 N H U)0. arU)0)4 4r ' 404-)
CO(U L)P4C A .(u a,. I I
>44
03
43 ) W4WN
o .a 0N .- 4o 0 4 1 0 4 0 4w4 m. 4,0 ( (
44 A ( 0 (U -: 4 3C0 0'( 444lt m~ (U 4- ON
pl C3~If-4 444. z .c4 i ) lz
.C.
0 4 00
(uS 0 0(U 0. 44 0 4
C HN4 ' O M H O N4 4- .440I .4
* 0 NU In0 m 44. U (U 0.m N0 co4 m3 a)8 r4 n -n M .co
In 4 N-444 44 m 3. N ' r 4- cn to 4'.
0 0 0~ U 0
A-33

APPENDIX B. Effectivity Regions for States and Territories
Effectivity Effectivity Effectivity
State/Territory Region State/Territory Region State/Territory Region
Alabama S Kentucky S Ohio M
Alaska W Louisiana S Oklahoma M
American Samoa W Maine I Oregon W
Arizona H Maryland E Pennsylvania E
Arkansas S Massachusetts E Puerto Rico W
California W Michigan M Rhode Island E
Colorado H Minnesota M South Carolina S
Connecticut E Mississippi S South Dakota M
Delaware E Missouri M Tennessee S
District of Columbia E Montana H Texas (see below) H,M,S
Florida S Nebraska M Trust Territories W
Georgia S Nevada a Utah H
Guam W New Hampshire E Vermont E
Hawaii W New Jersey E Virginia E
Idaho H New Mexico H Virgin Islands W
Illinois M New York E Washington W
Indiana M North Carolina S West Virginia S
Iowa M North Dakota H Wisconsin M
Kansas M Norther Mariana Is. W Wyoming H
Texas Texas Texas
ELP a ABI M AUS S
ACT M BPT S
ADS M BRO S
AMA M CLL S
DAL M CRP S
DFW M DWH S
FTW M CGC S
LBB M HOU S
MAF M HRL S
RBD M IAH S
SJT M MFE S
TYR M SAT S
SSF S
Effectivity Regions
E - East/Northeast
S - Southeast
M - Midwest/Southwest
H - Rocky Mountain/High Plains
W - West Coast/Tropical
B-1