adaptive nonlinear analysis as applied to …erolkalkan.com/ppts/p20.pdfdr. e. kalkan csus, math...
TRANSCRIPT

Adaptive Nonlinear Analysis as Applied to Performance based Earthquake Engineering
Erol Kalkan, PhD CSUS, Feb. 28, 2008

Dr. E. Kalkan CSUS, Math Colloquium Slide: 2/53
Ad
apti
ve N
onlin
ear
An
alys
is a
s A
pp
lied
to
Per
form
ance
bas
ed E
q.
Eng
.
This study is based on a paper published in Journal of Structural Engineering,
and winner of 2008 ASCE Raymond Reese Research
Award

Dr. E. Kalkan CSUS, Math Colloquium Slide: 3/53
Ad
apti
ve N
onlin
ear
An
alys
is a
s A
pp
lied
to
Per
form
ance
bas
ed E
q.
Eng
.
Outline
• Seismic Analysis Methods of Structures • Performance Based Earthquake Engineering
(Why and When) • Nonlinear Static Analysis
– Fundamental Theory – Conventional Methods (FEMA and ATC) – Limitations
• Adaptive Nonlinear Static Analysis – Methodology Developed – Comparative Results
• Summary & Conclusions

Dr. E. Kalkan CSUS, Math Colloquium Slide: 4/53
Ad
apti
ve N
onlin
ear
An
alys
is a
s A
pp
lied
to
Per
form
ance
bas
ed E
q.
Eng
.
• Linear static procedures • Equivalent static analysis
• Linear dynamic procedures • Modal analysis • Direct time-history analysis
• Nonlinear static analysis - Nonlinear static procedures (NSPs)
• Capacity spectrum analysis (ATC-40, FEMA-440) • Displacement coefficients method (FEMA-273-274,356,440)
- Improved NSPs • Modal pushover analysis (MPA) (Chopra & Goel, 2002) • Adaptive Modal Combination (AMC) (Kalkan & Kunnath, 2006)
• Nonlinear dynamic analysis
Seismic Analysis Methods of Structures
Most common in routine applications

Dr. E. Kalkan CSUS, Math Colloquium Slide: 5/55
Ad
apti
ve N
onlin
ear
An
alys
is a
s A
pp
lied
to
Per
form
ance
bas
ed E
q.
Eng
.
-2.0
-1.0
0.0
1.0
2.0
Acc
eler
atio
n (g
)
1994 Northridge, California EarthquakePacoima Dam - Upper Left Abutment
-2.0
-1.0
0.0
1.0
2.0
Acc
eler
atio
n (g
)
-2.0
-1.0
0.0
1.0
2.0
0 5 10 15 20Time (s)
Acc
eler
atio
n (g
)
210o Component
120o Component
Up Component

Dr. E. Kalkan CSUS, Math Colloquium Slide: 6/55
Ad
apti
ve N
onlin
ear
An
alys
is a
s A
pp
lied
to
Per
form
ance
bas
ed E
q.
Eng
.
0( )G gmu cu k k u mu+ + − = −&& & &&
c
k
m
φ l
u u+ug
mg mg
gmu− &&
gu
Equation of Motion

Dr. E. Kalkan CSUS, Math Colloquium Slide: 7/53
Ad
apti
ve N
onlin
ear
An
alys
is a
s A
pp
lied
to
Per
form
ance
bas
ed E
q.
Eng
.
SPECTRUM – A plot of the maximum response, as a function of oscillator frequency, of an array of single-degree-of-freedom (SDF) damped oscillators subjected to the same base excitation.
0 1 2 3 4 50
0.5
1
1.5
2
2.5
Period (s), Tn
Spec
tral A
cc. (
g)
0 1 2 3 4 50
0.5
1
1.5
2
2.5
Period (s), Tn
Spec
tral A
cc. (
g)
Median SpectrumDesign Spectrum
Terminology

Dr. E. Kalkan CSUS, Math Colloquium Slide: 8/53
Ad
apti
ve N
onlin
ear
An
alys
is a
s A
pp
lied
to
Per
form
ance
bas
ed E
q.
Eng
.
Terminology
ELASTIC vs. INELASTIC (NONLINEAR) SDF Oscillator
u
f
Elastic SDF System
u
f
Inelastic SDF System

Dr. E. Kalkan CSUS, Math Colloquium Slide: 9/53
Ad
apti
ve N
onlin
ear
An
alys
is a
s A
pp
lied
to
Per
form
ance
bas
ed E
q.
Eng
.
Major challenge in structural engineering is to develop simple, yet accurate, methods for estimating force demands on structures to predict their performance
level with confidence.

Dr. E. Kalkan CSUS, Math Colloquium Slide: 10/53
Ad
apti
ve N
onlin
ear
An
alys
is a
s A
pp
lied
to
Per
form
ance
bas
ed E
q.
Eng
.
Unlike elastic analysis methods (used commonly), nonlinear analysis helps us to identify sequence and magnitudes of yielding (damage) of structural components, internal forces, deformations,
and failure mechanism
Why Performance-based Earthquake Engineering Need Nonlinear Analysis?

Dr. E. Kalkan CSUS, Math Colloquium Slide: 11/53
Ad
apti
ve N
onlin
ear
An
alys
is a
s A
pp
lied
to
Per
form
ance
bas
ed E
q.
Eng
.
Nonlinear Static Analysis
Fundamental Theory &
Current Practice

Dr. E. Kalkan CSUS, Math Colloquium Slide: 12/55
Ad
apti
ve N
onlin
ear
An
alys
is a
s A
pp
lied
to
Per
form
ance
bas
ed E
q.
Eng
. Multi-degree-of-freedom (MDF) system seismic behavior can be approximated
with certain accuracy by
equivalent SDF systems.
Equivalent SDF (ESDF) systems’ properties are computed by conducting
pushover analyses…
Dr. E. Kalkan CSUS, Math Colloquium Slide: 13/53
Ad
apti
ve N
onlin
ear
An
alys
is a
s A
pp
lied
to
Per
form
ance
bas
ed E
q.
Eng
.
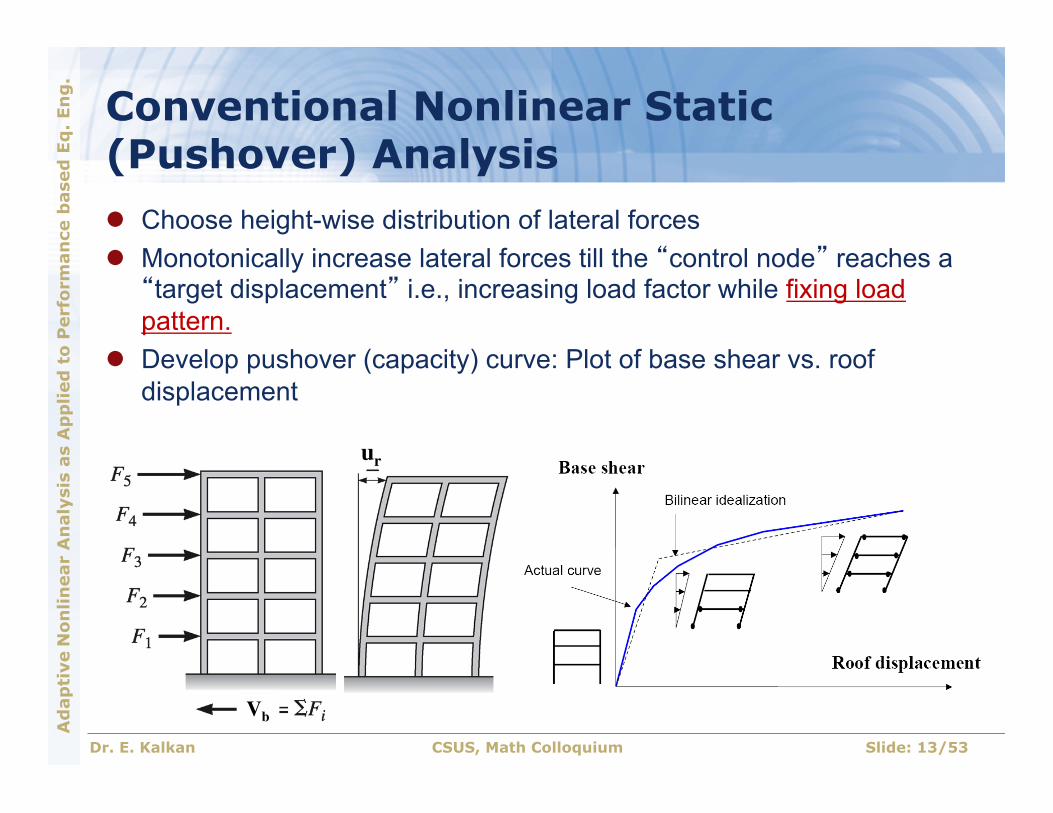
Conventional Nonlinear Static (Pushover) Analysis l Choose height-wise distribution of lateral forces l Monotonically increase lateral forces till the “control node” reaches a “target displacement” i.e., increasing load factor while fixing load pattern.
l Develop pushover (capacity) curve: Plot of base shear vs. roof displacement
ur
Vb

Dr. E. Kalkan CSUS, Math Colloquium Slide: 14/55
Ad
apti
ve N
onlin
ear
An
alys
is a
s A
pp
lied
to
Per
form
ance
bas
ed E
q.
Eng
. Summary of Nonlinear Static Analysis
V
D
D
V
InelasticSDF System
Target Displacementof MDF System ut
ut
uj
dj
Capacity estimation at target displacement
Pushover Analysis
Participation Factor, Gn
Dn
Fsn/Ln
ESD System Backbone Curve

Dr. E. Kalkan CSUS, Math Colloquium Slide: 15/53
Ad
apti
ve N
onlin
ear
An
alys
is a
s A
pp
lied
to
Per
form
ance
bas
ed E
q.
Eng
.
Assumptions: • The response of the multi-degree-of-freedom
(MDF) structure can be related to the response of an equivalent SDF system, implying that the response is controlled by a single mode and this mode shape remains unchanged even after yielding occurs.
• The invariant lateral force distribution can represent and bound the distribution of inertia forces during an earthquake.
• Modal responses are assumed to be uncoupled similar to elastic case.
Dr. E. Kalkan CSUS, Math Colloquium Slide: 16/55
Ad
apti
ve N
onlin
ear
An
alys
is a
s A
pp
lied
to
Per
form
ance
bas
ed E
q.
Eng
.
Two Important Components of Nonlinear Static Analysis
• Construct loading vector shape • Determine target roof displacement

Dr. E. Kalkan CSUS, Math Colloquium Slide: 17/55
Ad
apti
ve N
onlin
ear
An
alys
is a
s A
pp
lied
to
Per
form
ance
bas
ed E
q.
Eng
.
( )φ
=
=
= =
=
*
*1
*
*
Uniform:
First Mode :
ELF : 1 2
SRSS : from story shears
j j
j j j
kj j j
j
s m
s m
s m h k to
s
ELF and SRSS distributions intended to consider higher mode responses
Height-wise Distribution of Lateral Forces: FEMA Recommendations

Dr. E. Kalkan CSUS, Math Colloquium Slide: 18/53
Ad
apti
ve N
onlin
ear
An
alys
is a
s A
pp
lied
to
Per
form
ance
bas
ed E
q.
Eng
.
FEMA Recommended Force Distributions
Each force distribution pushes all floors in same direction

Dr. E. Kalkan CSUS, Math Colloquium Slide: 19/55
Ad
apti
ve N
onlin
ear
An
alys
is a
s A
pp
lied
to
Per
form
ance
bas
ed E
q.
Eng
.
Two Important Components of Nonlinear Static Analysis
• Construct loading vector shape • Determine target roof displacement

Dr. E. Kalkan CSUS, Math Colloquium Slide: 20/53
Ad
apti
ve N
onlin
ear
An
alys
is a
s A
pp
lied
to
Per
form
ance
bas
ed E
q.
Eng
. Target Displacement Estimation (Displacement Coefficient Method)
π⎞⎛
= ⎟⎜⎝ ⎠
2
0 24e
t inel ATu C C S u
f
Elastic SDF System
u
f
Inelastic SDF System
u
f
Inelastic MDF System
C0 = Constant to relate elastic deformation of SDF and MDF system

Ad
apti
ve N
onlin
ear
An
alys
is a
s A
pp
lied
to
Per
form
ance
bas
ed E
q.
Eng
.
Dr. E. Kalkan CSUS, Math Colloquium Slide: 21/55
Displacement Coefficient Method
FEMA-356: Cinel =C1C2C3 • C1 = Ratio of inelastic and
elastic SDF systems • C2 = Constant to account for
effects of pinching, stiffness degradation, and strength deterioration
• C3 = Constant to account for P-Delta effects
ASCE-41: Cinel = C1C2 • C1 = Ratio of inelastic and
elastic SDF systems • C2 = Constant to account for
cyclic degradation of stiffness and strength
• Upper limit on R to avoid dynamic instability

Dr. E. Kalkan CSUS, Math Colloquium Slide: 22/53
Ad
apti
ve N
onlin
ear
An
alys
is a
s A
pp
lied
to
Per
form
ance
bas
ed E
q.
Eng
. Capacity Spectrum Method
ξ= 0 ( , )t D eq equ C S T
u
f
Inelastic MDF System
u
f
Equivalent Linear Elastic SDF System
Teq, zeq
u
f
Inelastic SDF System

Dr. E. Kalkan CSUS, Math Colloquium Slide: 23/55
Ad
apti
ve N
onlin
ear
An
alys
is a
s A
pp
lied
to
Per
form
ance
bas
ed E
q.
Eng
.
Capacity Spectrum Method – Equivalent Damping Concept
( )( )( )
µαµ α
µ αζ κ
π µ αµ α
=+ −
− −= +
+ −
1
1 110.051
eq o
eq
T T
For bilinear systems
Requires iterations to compute Teq and zeqbecause of unknown ductility (uinel / uelas)
10.054
Deq
So
EE
ξπ
= + Teq= Tsec
Sd
Sa
ESo
ED
Dr. E. Kalkan CSUS, Math Colloquium Slide: 24/53
Ad
apti
ve N
onlin
ear
An
alys
is a
s A
pp
lied
to
Per
form
ance
bas
ed E
q.
Eng
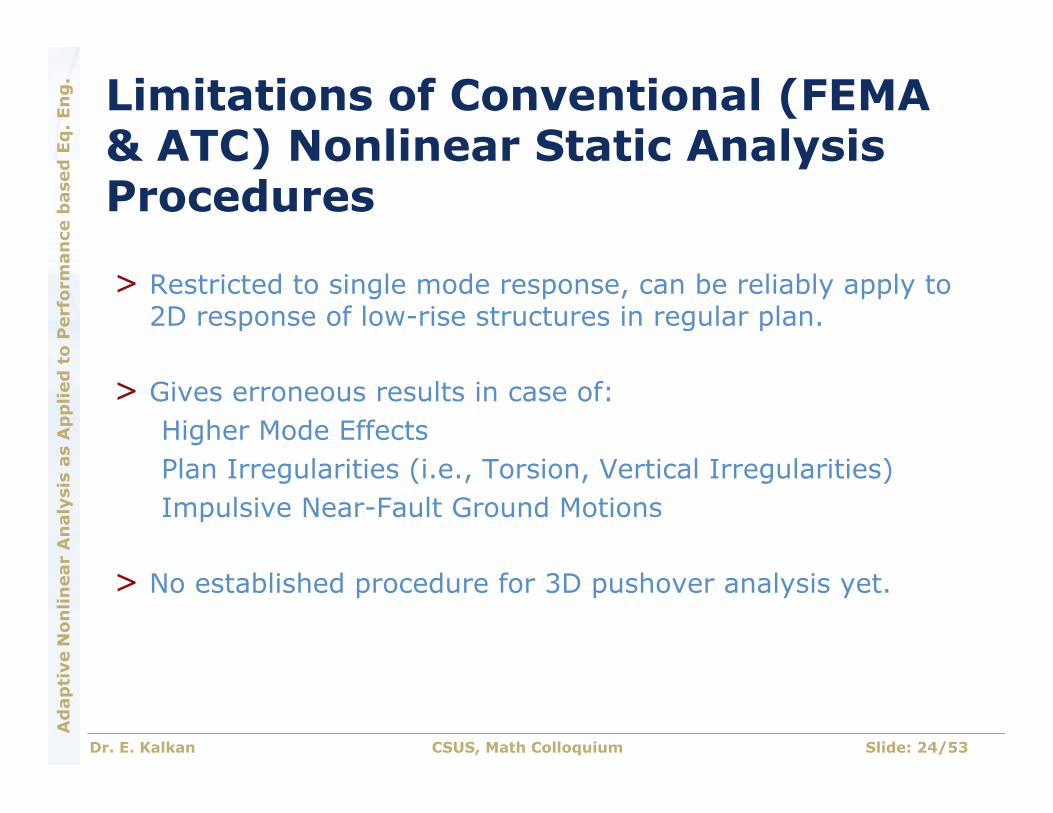
. Limitations of Conventional (FEMA & ATC) Nonlinear Static Analysis Procedures
> Restricted to single mode response, can be reliably apply to 2D response of low-rise structures in regular plan.
> Gives erroneous results in case of: Higher Mode Effects Plan Irregularities (i.e., Torsion, Vertical Irregularities) Impulsive Near-Fault Ground Motions
> No established procedure for 3D pushover analysis yet.

Adaptive Nonlinear Analysis

Dr. E. Kalkan CSUS, Math Colloquium Slide: 26/53
Ad
apti
ve N
onlin
ear
An
alys
is a
s A
pp
lied
to
Per
form
ance
bas
ed E
q.
Eng
.
Adaptive Pushover – Basic Concept

Dr. E. Kalkan CSUS, Math Colloquium Slide: 27/53
Ad
apti
ve N
onlin
ear
An
alys
is a
s A
pp
lied
to
Per
form
ance
bas
ed E
q.
Eng
.
0
1
2
3
4
5
6
Stor
y Le
vel
ElasticSt-1St-2St-3St-4,5St-6
Mode-1 Mode-2 Mode-3
Progressive Change in Modal Shapes
Dr. E. Kalkan CSUS, Math Colloquium Slide: 28/53
Ad
apti
ve N
onlin
ear
An
alys
is a
s A
pp
lied
to
Per
form
ance
bas
ed E
q.
Eng
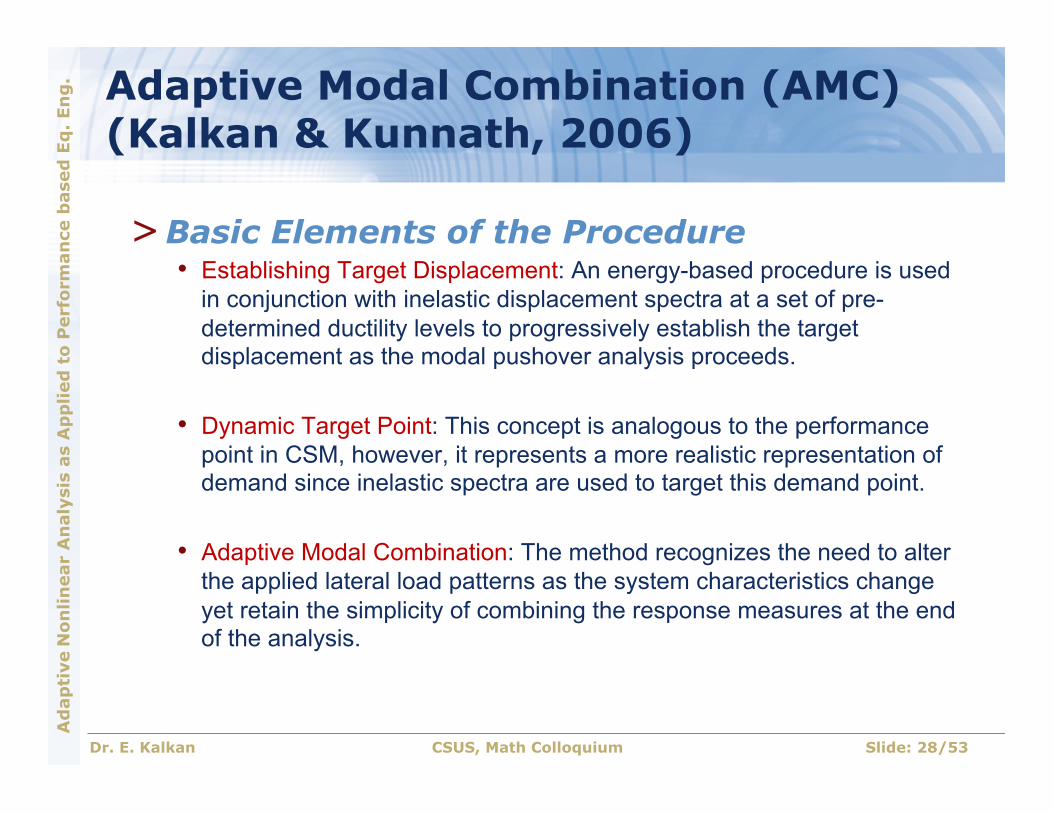
. Adaptive Modal Combination (AMC) (Kalkan & Kunnath, 2006)
> Basic Elements of the Procedure • Establishing Target Displacement: An energy-based procedure is used
in conjunction with inelastic displacement spectra at a set of pre-determined ductility levels to progressively establish the target displacement as the modal pushover analysis proceeds.
• Dynamic Target Point: This concept is analogous to the performance point in CSM, however, it represents a more realistic representation of demand since inelastic spectra are used to target this demand point.
• Adaptive Modal Combination: The method recognizes the need to alter the applied lateral load patterns as the system characteristics change yet retain the simplicity of combining the response measures at the end of the analysis.

Dr. E. Kalkan CSUS, Math Colloquium Slide: 29/53
Ad
apti
ve N
onlin
ear
An
alys
is a
s A
pp
lied
to
Per
form
ance
bas
ed E
q.
Eng
.
Energy-based ESDF system representation of nth-mode MDF system capacity curve���
Roof Displacement, u r,n
Bas
e She
ar, V
b,n
F 1(i)
F 2(i)
F 3(i)
Δd 3(i)
Δd 2(i)
Δd 1(i)
Forces (sn
(i))
( ) ( ) ( ) ( ), , , ,
1,3 1,3( ) / ( )i i i i
d n n n j n j n jj j
S D F d F= =
⎛ ⎞⎛ ⎞ ⎛ ⎞= Δ = Δ⎜ ⎟⎜ ⎟ ⎜ ⎟⎜ ⎟⎝ ⎠ ⎝ ⎠⎝ ⎠∑ ∑ ∑ ∑
Δd 3(i)
Capacitycurve
(i-1)
(i)
(i)(i-1)
ur,n(i)ur,n(i-1)S pectral Displacement, S d,n
Spe
ctral A
cceleration, S a,n
ΔD n(i)
ωn(i)
ζn(i)
,,
b na n
n
VS
Wα=
ΔD n(i)
Τn(elas tic )
(ωn(i)) 2
Capacity spectrum
MDF Level
SDF Level

Dr. E. Kalkan CSUS, Math Colloquium Slide: 30/53
Ad
apti
ve N
onlin
ear
An
alys
is a
s A
pp
lied
to
Per
form
ance
bas
ed E
q.
Eng
.
Performance point evaluation using system ductility through a set of inelastic spectra
S pectral Dis placement, S d,n
Spe
ctral A
cceleration, S a
,n
ωn(i)
ζn(i)
(ωn(ip )) 2
Global Yield
( ),yieldd nS ( )
,ipd nS
With computed system ductility, ( )ipnµ
Τn(elas tic )
Τn(ip )
( ),( )( ),
ipd nip
n yieldd n
SS
µ =
S pec tral Dis placement, S d,n
Spe
ctral A
cceleration, S a
,n
( )ipnµ
Dynamic Target Point
Inelastic phase, period elongation
Τn(elas tic )
Τn(ip )
Inelastic Demand Spectra plotted at different ductility levels
M odal CapacityCurve
Capacity Side
DemandSide

Dr. E. Kalkan CSUS, Math Colloquium Slide: 31/53
Ad
apti
ve N
onlin
ear
An
alys
is a
s A
pp
lied
to
Per
form
ance
bas
ed E
q.
Eng
.
Validation Studies
> Several regular and irregular building frames of varying height were developed used for validation studies.
> Different suite of records were compiled from near-fault forward directivity, near-fault fling and far-fault recordings.
> Each building model was also subjected to a series of ground motions to generate benchmark results.
> Engineering demand parameters considered are roof drift ratio, inter-story drift ratio in global level and member plastic rotations and story ductility in local level for cross comparisons.

Dr. E. Kalkan CSUS, Math Colloquium Slide: 32/53
Ad
apti
ve N
onlin
ear
An
alys
is a
s A
pp
lied
to
Per
form
ance
bas
ed E
q.
Eng
.
> The structural system is essentially symmetrical. > Moment continuity of each of the perimeter frames is interrupted at
the ends where a simple shear connection is used to connect to the weak column axis.
4
7
6
5
3
2
1BA
m
DC E GF
[email protected] m 6@ 6.1m
5@4m
5.3m
3rdFloor
2ndFloor
1st Floor
4th Floor
5th Floor
Roof
W14
x176
W14
x90
W14
x132
W24x68
W24x84
W24x68
W24x68
W27x102
W30x116
A C E F GDB
Moment resisting connection
Moment resisting connection Simple hinge connection
Structural Details of 6-story Building

Ad
apti
ve N
onlin
ear
An
alys
is a
s A
pp
lied
to
Per
form
ance
bas
ed E
arth
qu
ake
Structural Details of 13-story Building
> The exterior frames of the building are the moment resisting frames and interior frames are for load bearing.
> The foundation consists of piles, pile caps and grade beams. > The corner columns of outer frames are composed of box sections.
[email protected] = 48.8 m
5
E
F
G
C
D
B4
5@9.
76 =
48.
8 m
86 7 9
Moment resisting connection
(a) Plan view of perimeter frames
(b) Elevation
W33x118
W27x84
W33x141
W33x130
W33x130
W33x152
W33x152
W33x152
W33x141
W33x118
W36x230
W33x152
W33x152
W33x194
W14
x314
W14
x426
W14
x500
W14
x398
W14
x246
W14
x287
W14
x167
6th Floor
5th Floor
1st Floor
2nd Floor
3rd Floor
Plaza Level
4th Floor
12th Floor
Roof
9th Floor
10th Floor
11th Floor
7th Floor
8th Floor12
@4.
013
= 48
.2 m
4.88
4.42
[email protected] = 48.8 m
Moment resisting connectionSimple hinge connection

Dr. E. Kalkan CSUS, Math Colloquium Slide: 34/53
Ad
apti
ve N
onlin
ear
An
alys
is a
s A
pp
lied
to
Per
form
ance
bas
ed E
q.
Eng
. Analytical Modeling in OpenSEES (Open source Finite Element Software)
q One half of the total building mass was
applied to the frame distributed proportionally to the floor nodes.
q The simulation of special features such as local connection fracture did not accounted for; consequently, the modeling of the members and connections was based on the assumption of stable hysteresis derived from a bilinear stress-strain model.
q The columns were assumed to be fixed at the base level (No SSI).
q Centerline dimensions were used in the element modeling. q A force-based nonlinear beam-column element that utilizes a
layered ‘fiber’ section is utilized to model all components

Dr. E. Kalkan CSUS, Math Colloquium Slide: 35/53
Ad
apti
ve N
onlin
ear
An
alys
is a
s A
pp
lied
to
Per
form
ance
bas
ed E
q.
Eng
.
0
1
2
3
4
5
6
0.00 0.02 0.04 0.06Inters tory Drift Ratio
Story Lev
el JMAMode-‐1MMPAAMC
0
1
2
3
4
5
6
0.00 0.01 0.02 0.03Roof Drift Ratio
Target Drift
0
1
2
3
4
5
6
0.00 0.02 0.04 0.06Inters tory Drift Ratio
Story Lev
el LGPCMMPAMode-‐1AMC
0
1
2
3
4
5
6
0.00 0.01 0.02 0.03Roof Drift Ratio
Target Drift
0
2
4
6
8
10
12
14
0.00 0.01 0.02 0.03 0.04Inters tory Drift Ratio
Story Lev
el JMAMMPAMode-‐1AMC
0
2
4
6
8
10
12
14
0.00 0.01 0.01 0.02Roof Drift Ratio
Target Drift
0
2
4
6
8
10
12
14
0.00 0.02 0.04 0.06Inters tory Drift Ratio
Story Lev
el
R inaldiMMPAMode-‐1AMC
0
2
4
6
8
10
12
14
0.00 0.01 0.02Roof Drift Ratio
Target Drift
Comparison of Results: Impulsive Near-Fault Records

Dr. E. Kalkan CSUS, Math Colloquium Slide: 36/53
Ad
apti
ve N
onlin
ear
An
alys
is a
s A
pp
lied
to
Per
form
ance
bas
ed E
q.
Eng
.
0
1
2
3
4
5
6
0.00 0.02 0.04 0.06Inters tory Drift Ratio
Story Lev
el TaftMMPAMode-‐1AMC
0
1
2
3
4
5
6
0.00 0.01 0.02 0.03Roof Drift Ratio
Target Drift
0
1
2
3
4
5
6
0.00 0.02 0.04 0.06Inters tory Drift Ratio
Story Lev
el
Desert H.MMPAMode-‐1AMC
0
1
2
3
4
5
6
0.00 0.01 0.02 0.03Roof Drift Ratio
Target Drift
Comparison of Results: Scaled Far-Fault Records
0
2
4
6
8
10
12
14
0.00 0.01 0.02 0.03 0.04Inters tory Drift Ratio
Story Lev
el
Desert H.MMPAMode-‐1AMC
0
2
4
6
8
10
12
14
0.000 0.005 0.010 0.015Roof Drift Ratio
Target Drift
0
2
4
6
8
10
12
14
0.00 0.01 0.02 0.03Inters tory Drift Ratio
Story Lev
elMoorparkMMPAMode-‐1AMC
0
2
4
6
8
10
12
14
0.000 0.005 0.010 0.015Roof Drift Ratio
Target Drift

Dr. E. Kalkan CSUS, Math Colloquium Slide: 37/53
Ad
apti
ve N
onlin
ear
An
alys
is a
s A
pp
lied
to
Per
form
ance
bas
ed E
q.
Eng
.
0
1
2
3
4
5
6
0.00 0.02 0.04 0.06Inters tory Drift Ratio
Story Lev
el
NTH Mean
AMC Mean
0
1
2
3
4
5
6
0.00 0.01 0.02Roof Drift Ratio
Statistics of Results
0
2
4
6
8
10
12
14
0.00 0.01 0.02 0.03 0.04Inters tory Drift Ratio
Story Lev
el
NTH Mean
AMC Mean
0
2
4
6
8
10
12
14
0.00 0.01 0.02
Roof Drift Ratio
Dr. E. Kalkan CSUS, Math Colloquium Slide: 38/53
Ad
apti
ve N
onlin
ear
An
alys
is a
s A
pp
lied
to
Per
form
ance
bas
ed E
q.
Eng
.
Summary & Conclusions
> Developed AMC offers a direct multi-mode technique to estimate seismic demands and integrates concepts incorporated in:
• Capacity spectrum method recommended in 3 ATC-40 (1996)
• Direct adaptive method originally proposed by Gupta and Kunnath (2000)
• Modal pushover analysis advocated by Chopra and Goel (2002)
> AMC procedure accounts for higher mode effects by
combining the response of individual modal pushover analyses and incorporates the effects of varying dynamic characteristics during the inelastic response via its adaptive feature

Dr. E. Kalkan CSUS, Math Colloquium Slide: 39/53
Ad
apti
ve N
onlin
ear
An
alys
is a
s A
pp
lied
to
Per
form
ance
bas
ed E
q.
Eng
.
Summary (cont.)
> A novel feature of the procedure is that the target displacement is estimated and updated dynamically during the analysis by incorporating energy based modal capacity curves in conjunction with constant-ductility capacity spectra.
> AMC method has shown promise in predicting inelastic displacement demands for a range of regular and irregular buildings.
> Validation studies under 3D models (including torsion) are currently underway.

Dr. E. Kalkan CSUS, Math Colloquium Slide: 40/55
Ad
apti
ve N
onlin
ear
An
alys
is a
s A
pp
lied
to
Per
form
ance
bas
ed E
q.
Eng
.
Thank You