addressing green infrastructure design challenges in … · addressing green infrastructure design...
TRANSCRIPT

Addressing Green Infrastructure Design Challenges in the Pittsburgh Region Abundant and Frequent Rainfall
2012 GREEN INFRASTRUCTURE TECHNICAL ASSISTANCE PROGRAM Pittsburgh UNITED
Pittsburgh, Pennsylvania
Photo: Rain Garden at Biddle Building Source: Nine Mile Run Watershed Association
January 2014 EPA 800-R-14-003

About the Green Infrastructure Technical Assistance Program
Stormwater runoff is a major cause of water pollution in urban areas. When rain falls in undeveloped areas, the water is absorbed and filtered by soil and plants. When rain falls on our roofs, streets, and parking lots, however, the water cannot soak into the ground. In most urban areas, stormwater is drained through engineered collection systems and discharged into nearby waterbodies. The stormwater carries trash, bacteria, heavy metals, and other pollutants from the urban landscape, polluting the receiving waters. Higher flows also can cause erosion and flooding in urban streams, damaging habitat, property, and infrastructure.
Green infrastructure uses vegetation, soils, and natural processes to manage water and create healthier urban environments. At the scale of a city or county, green infrastructure refers to the patchwork of natural areas that provides habitat, flood protection, cleaner air, and cleaner water. At the scale of a neighborhood or site, green infrastructure refers to stormwater management systems that mimic nature by soaking up and storing water. These neighborhood or site-scale green infrastructure approaches are often referred to as low impact development.
EPA encourages the use of green infrastructure to help manage stormwater runoff. In April 2011, EPA renewed its commitment to green infrastructure with the release of the Strategic Agenda to Protect Waters and Build More Livable Communities through Green Infrastructure. The agenda identifies technical assistance as a key activity that EPA will pursue to accelerate the implementation of green infrastructure.
In February 2012, EPA announced the availability of $950,000 in technical assistance to communities working to overcome common barriers to green infrastructure. EPA received letters of interest from over 150 communities across the country, and selected 17 of these communities to receive technical assistance. Selected communities received assistance with a range of projects aimed at addressing common barriers to green infrastructure, including code review, green infrastructure design, and cost-benefit assessments. Pittsburgh UNITED was selected to receive assistance developing fact sheets and technical papers to provide solutions for site conditions that are perceived to limit green infrastructure applicability.
For more information, visit http://water.epa.gov/infrastructure/greeninfrastructure/gi_support.cfm.
ii

Acknowledgements
Principal EPA Staff Kenneth Hendrickson, USEPA Region 3 Dominique Lueckenhoff, USEPA Region 3 Christopher Kloss, USEPA Tamara Mittman, USEPA Community Team Jennifer Rafanan Kennedy, Clean Rivers Campaign Sara Powell, Nine Mile Run Watershed Association Consultant Team Dan Christian, Tetra Tech Valerie Novaes, Tetra Tech Anne Thomas, Tetra Tech Technical Review Team Beth Dutton, 3 Rivers Wet Weather Kari Mackenbach, URS Corporation Jim Pillsbury, Westmoreland Conservation District This report was developed under EPA Contract No. EP-C-11-009 as part of the 2012 EPA Green Infrastructure Technical Assistance Program.
iii

Contents Introduction .................................................................................................................................................. 1
Rainfall and Stormwater Management Overview ........................................................................................ 1
Stormwater Design Criteria ...................................................................................................................... 2
Rainfall-Runoff Definitions ........................................................................................................................ 3
Rainfall in the Greater Pittsburgh Area ......................................................................................................... 4
Methods to Address Abundant and Frequent Rainfall ................................................................................. 8
Design for Specific Criteria ........................................................................................................................ 8
1. Overflow and Bypass Systems ........................................................................................................ 9 2. Underdrains .................................................................................................................................. 10 3. Soil Investigation .......................................................................................................................... 12
Modeling Tools........................................................................................................................................ 12
Examples of Implemented Projects ............................................................................................................ 13
Sterncrest Drive Bioswale and Rain Gardens, built 2007, Cuyahoga County, OH (Darner and Dumouchelle, 2011) ................................................................................................................................ 13
1. Design Summary ........................................................................................................................... 13 2. Results Summary .......................................................................................................................... 15 3. Lessons Learned ........................................................................................................................... 15
Michigan Avenue Bioretention Facilities, Lansing, MI ............................................................................ 16
1. Design Summary ........................................................................................................................... 16 2. Results Summary .......................................................................................................................... 17 3. Lessons Learned ........................................................................................................................... 18
References .................................................................................................................................................. 19
Manuals, Articles, and Books .................................................................................................................. 19
Websites ................................................................................................................................................. 20
iv

Tables Table 1. Design Storm Event Depths (inches) for Pittsburgh, PA.................................................................. 7
Figures Figure 1. Dimensionless Unit Hydrograph and Equivalent Triangular Hydrograph ...................................... 4
Figure 2. Average Annual Precipitation in Pennsylvania .............................................................................. 5
Figure 3. Southwest Pennsylvania Annual Rainfall Grouped by Storm Depth ............................................. 5
Figure 4. Distribution of Total Annual Precipitation by Month for Pittsburgh, PA ....................................... 6
Figure 5. Average Annual Precipitation Depths for the United States ......................................................... 6
Figure 6. Rainfall Depth Comparisons for Four Storm Events in Selected Cities .......................................... 7
Figure 7. Off-Line and On-Line Bioretention Systems ................................................................................... 9
Figure 8. Example Bioretention System with an Elevated Underdrain ....................................................... 10
Figure 9. Typical Cross-Sections of Permeable Paver System with Underdrains ........................................ 11
Figure 10. Roadside Rain Garden in Cuyahoga County ............................................................................... 13
Figure 11. Rain Garden and Bioswale Typical Cross-Sections ..................................................................... 14
Figure 12. Typical Bioretention Cross-Section on Michigan Avenue .......................................................... 16
Figure 13. Photo Sequence of Bioretention on Michigan Avenue .............................................................. 17
Figure 14. Runoff Comparison 1-year 1-hour ............................................................................................. 18
v
Introduction
In many areas of the United States, urban stormwater impacts are largely driven by the small, frequent storms that account for most of the annual precipitation. While these storms generate little runoff in natural areas, they generate significant runoff in urban environments, where paved surfaces and dense drainage networks prevent water from following natural pathways. Stormwater generated by these small storm events carries the first flush of pollutants into local waterbodies and leads to higher flows in local streams. The cumulative impact of these frequent events can drive many of the physical, chemical, and biological impacts of urban stormwater on local waterbodies.
Green infrastructure is the practice of mimicking and restoring natural hydrologic processes within the built environment to mitigate the impacts of urban stormwater. Green infrastructure is an important design strategy for protecting water quality while also providing multiple community benefits. Common green infrastructure practices include permeable pavement, bioretention facilities, rain barrels, tree boxes, and green roofs. These practices can complement conventional stormwater management practices by enhancing infiltration, storage, and evapotranspiration and managing runoff at its source.
This paper will address the concern that green infrastructure is not appropriate for the Pittsburgh area’s humid climate, which is characterized by abundant rainfall and frequent storm events. The paper will analyze the greater Pittsburgh area’s typical rainfall pattern; provide design guidance to help size effective green infrastructure practices; and describe effective projects from areas around the country with similar rainfall patterns. The goal of this paper is to provide recommendations for green infrastructure design that are based on facts, research, and engineering in order to help practitioners make informed decisions regarding the use of green infrastructure to manage stormwater in areas with abundant rainfall.
Rainfall and Stormwater Management Overview
Among the impacts of urban stormwater in the greater Pittsburgh area are increased flooding and combined sewer overflows (CSOs). Pennsylvania is one of the most flood-prone states in the country (PA SW BMP Manual, 2006). The state experiences flooding problems not only from large tropical storms but from smaller storms as well. These flooding problems are exacerbated by stormwater runoff from urban areas, where large amounts of impervious cover generate increased runoff volumes and rates. Urban stormwater also contributes to CSOs. The greater Pittsburgh area is served by a combined sewer system that carries both sewerage and stormwater to wastewater treatment plants. When too much stormwater enters the system, the wastewater treatment plants cannot treat all of the flow, and some untreated wastewater must be diverted into local waterbodies.
Green infrastructure can help mitigate these urban stormwater impacts by managing small storms on site. Retaining small events on site reduces runoff volumes and rates, protects stream channels, and effectively adds capacity to combined sewer systems. Many communities across the country are integrating green infrastructure into their CSO control programs, including Chicago, IL; Kansas City, MO; New York City, NY; Philadelphia, PA; Syracuse, NY; Portland, OR; and Milwaukee, WI. These communities are using green infrastructure to supplement the storage and treatment capacity provided by more traditional, “gray infrastructure” approaches.
1

One of the challenges to the use of green infrastructure in the greater Pittsburgh area is the perception that the humid climate, characterized by abundant and frequent rainfall, is inappropriate for green infrastructure. Some stormwater professionals express concern that large rainfall events or smaller, more frequent events will overwhelm green infrastructure systems. Experience demonstrates, however, that even in areas with abundant rainfall, green infrastructure can consistently retain design storms on site, preventing a significant portion of the annual runoff from entering the sewer system. The design of effective green infrastructure practices requires that practices are sized to manage the runoff volume from a range of design storm events. Once the appropriate sizing is determined, simple design features can be incorporated to optimize system performance, including overflow structures and underdrain pipes. Overflow structures provide a pathway for runoff volumes that exceed the design capacity of the green infrastructure practice, while underdrain pipes allow the green infrastructure practice to dewater in time for the next storm event.
Additional design considerations include landscape water requirements and scouring. Thought must be given to vegetated systems to ensure that plants are provided a suitable amount of water to survive - not too much and not too little. In addition, inflow velocities and energy dissipation at the inlet must be considered to prevent scour of the soil.
Stormwater Design Criteria
Stormwater design criteria typically require the management of a range of design storm events to mitigate a range of receiving water impacts. Management of larger storm events is required to mitigate flooding, while management of smaller storm events is required to mitigate channel erosion and water quality degradation. Green infrastructure practices are generally designed to meet water quality criteria and to help meet channel protection criteria. Specific design criteria vary for each municipality across the country, but some general patterns may be observed.
For water quality criteria, common requirements include treatment or retention of a certain volume of runoff. Many water quality criteria address small storm events that are exceeded once to several times per year. For example, Nashville, TN requires treatment of the runoff from the first 1.1 inches of rainfall to remove 80 percent of total suspended solids, while Albany, NY requires treatment of 90 percent of the average annual runoff volume.
For channel protection and flood mitigation criteria, common requirements include control of the post-development peak runoff rate to match the pre-development peak runoff rate, and control of the post-development runoff volume to match the pre-development runoff volume. Many channel protection criteria address the one- to two-year 24-hour storm events while flood mitigation criteria commonly address the 10- to 100-year 24-hour storm events. For example, Washington, DC requires post-development control of both the peak runoff rate and runoff volume to match pre-development conditions for the 1-, 2-, 10-, and 100-year, 24-hour storm events.
2
Green Infrastructure Performance under Extreme Conditions – An instrumented bioretention practice installed in Cambria, Queens provided the opportunity to assess system performance during Superstorm Sandy (October 2012) and Hurricane Irene (August 2011). Analysis of the data collected indicated that the practice retained most of the runoff from its drainage area during both extreme events. The practice retained 79% of the of the 6.4 inches of rainfall associated with Hurricane Irene, and 100% of the 1.3 inches of rainfall associated with Superstorm Sandy. (Montalto et al., 2013)

Rainfall-Runoff Definitions
The following are important definitions related to rainfall and stormwater runoff.
Contributing Drainage Area (CDA) – The drainage area that contributes to a green infrastructure practice.
Depth-Duration-Frequency Curve – Describes rainfall depth as a function of duration for given return periods.
Inter-Event Time – The minimum number of dry hours between separate storm events. Typically values ranging from 3 to 30 hours are used to separate rainfall events. A 6-hour inter-event time is commonly assumed. This is used when evaluating the rainfall statistics of an area. For example, the annual 90th percentile non-exceedance rainfall event will depend on the inter-event time.
Peak Discharge Rate – The maximum instantaneous rate of flow (volume of water passing a given point over a specific duration, such as cubic feet per second) during a storm, usually in reference to a specific design storm event.
Rainfall Intensity – A measure of the amount of rain that falls over a given time period.
Rainfall Duration – The amount of time over which a rainfall event occurs. Typically presented from 30 minutes to 24 hours.
Rainfall Distribution – The variation of rainfall intensity over time. An SCS Type II rainfall distribution is commonly used for the greater Pittsburgh area. It is also referred to as a rainfall hyetograph.
Runoff Coefficient – A dimensionless coefficient relating the amount of runoff to the amount of precipitation. The value is higher for areas with low infiltration (pavement, steep gradients) and lower for permeable, well vegetated areas.
Runoff Hydrograph – A plot of discharge versus time. The area under the hydrograph represents volume of water. Figure 1 shows a unit hydrograph.
Stormwater - Water consisting of precipitation runoff or snowmelt.
Stormwater Pollutants – Typical stormwater pollutants include sediment, nutrients, temperature, bacteria, trash/debris, and toxic contaminants/heavy metals. The specific pollutants generated will vary depending on the land use.
Storm Recurrence Interval – The probability that a give storm event will be equaled or exceeded in any given year. For example, a two-year storm event occurs on average once every two years or statistically has a 50 percent change of occurring in a given year. Green infrastructure practices are sized for specific storm recurrence intervals.
Unit Hydrograph – Defined as the runoff hydrograph that results from 1 inch of effective rainfall generated uniformly over a watershed, at a constant rate, and over a specified period of time. Figure 1 shows a dimensionless unit hydrograph and its components.
3

Source: NEH, Chapter 16
Figure 1. Dimensionless Unit Hydrograph and Equivalent Triangular Hydrograph
Rainfall in the Greater Pittsburgh Area
The distribution of rainfall events in the Pittsburgh area is well-suited to green infrastructure practices. The National Oceanic and Atmospheric Association (NOAA) records and publishes long term precipitation data for the 50 contiguous states. In Pennsylvania, the average annual precipitation amount ranges from 37 inches to more than 45 inches per year (Figure 2), with nearly all of the annual rainfall occurring in small storm events. Precipitation of an inch or less is the most common rainfall event in southwest Pennsylvania and accounts for approximately 75% of annual storm events (Figure 3). These precipitation events are also distributed evenly throughout the year (Figure 4). As little as one-tenth of an inch of rain or snowmelt can cause sewage to overflow into Pittsburgh’s rivers and streams (3 Rivers Wet Weather, 2013). Since green infrastructure practices are designed to manage small storms on site, these rainfall characteristics are well-suited to green infrastructure controls.
When compared to other regions of the United States, annual precipitation and design storm depths in the Pittsburgh area are similar to those observed in many areas east of the Mississippi. Figure 5 shows average annual precipitation values for the contiguous United States. Pittsburgh is not unique in the amount of annual precipitation it receives, with much of the area east of the Mississippi receiving at least as much precipitation as Pittsburgh.
4

Source: NOAA National Weather Service
Figure 2. Average Annual Precipitation in Pennsylvania
Adapted from Westmoreland Conservation District, 2013
Figure 3. Southwest Pennsylvania Annual Rainfall Grouped by Storm Depth
5

0
0.5
1
1.5
2
2.5
3
3.5
4
4.5Pr
ecip
itatio
n (in
ches
)
Month
Precipitation by Month for Pittsburgh, PA
Source: NOAA
Figure 4. Distribution of Total Annual Precipitation by Month for Pittsburgh, PA
Source: Oregon State University
Figure 5. Average Annual Precipitation Depths for the United States
6

Design storms are generally described in terms of depth, duration and frequency (presented in depth-duration-frequency curves). Design storm depths for much of the United States can be obtained from NOAA Atlas 14, which provides precipitation frequency estimates for 5-minute through 60-day durations at average recurrence intervals of 1-year through 1,000-year. Precipitation depths in the Pittsburgh area are based upon statistical analyses of precipitation data collected at a gauge near the Pittsburgh International Airport (Table 1). Comparing the magnitude of four common design storms for several cities in the eastern United States demonstrates that design storm depths in Pittsburgh are typical of design storm depths in much of the eastern United States (Figure 6). Indeed, Pittsburgh is observed to have the smallest design storm depths of all the cities sampled.
Table 1. Design Storm Event Depths (inches) for Pittsburgh, PA
Avg. Recurrence Interval
Rainfall Depth (inches) for Recurrence Intervals
30-min 60-min 2-hour 3-hour 6-hour 12-hour 24-hour
1-year 0.79 0.97 1.11 1.17 1.41 1.67 1.96
2-year 0.96 1.18 1.34 1.42 1.70 1.99 2.33
5-year 1.19 1.49 1.69 1.78 2.12 2.46 2.85
10-year 1.36 1.73 1.96 2.07 2.46 2.84 3.27 Source: NOAA Atlas 14
0
1
2
3
4
5
6
1y 2y 5y 10y
Rain
fall
Dept
h (in
ches
)
Storm Event (24-hour duration)
Rainfall Depth Comparison for Selected Cities (24-hour Duration Storm Event)
DC, Washington
MD, Baltimore
NY, New York City
OH, Cincinnati
OH, Cleveland
PA, Philadelphia
PA, Pittsburgh
VA, Richmond
Figure 6. Rainfall Depth Comparisons for Four Storm Events in Selected Cities
7
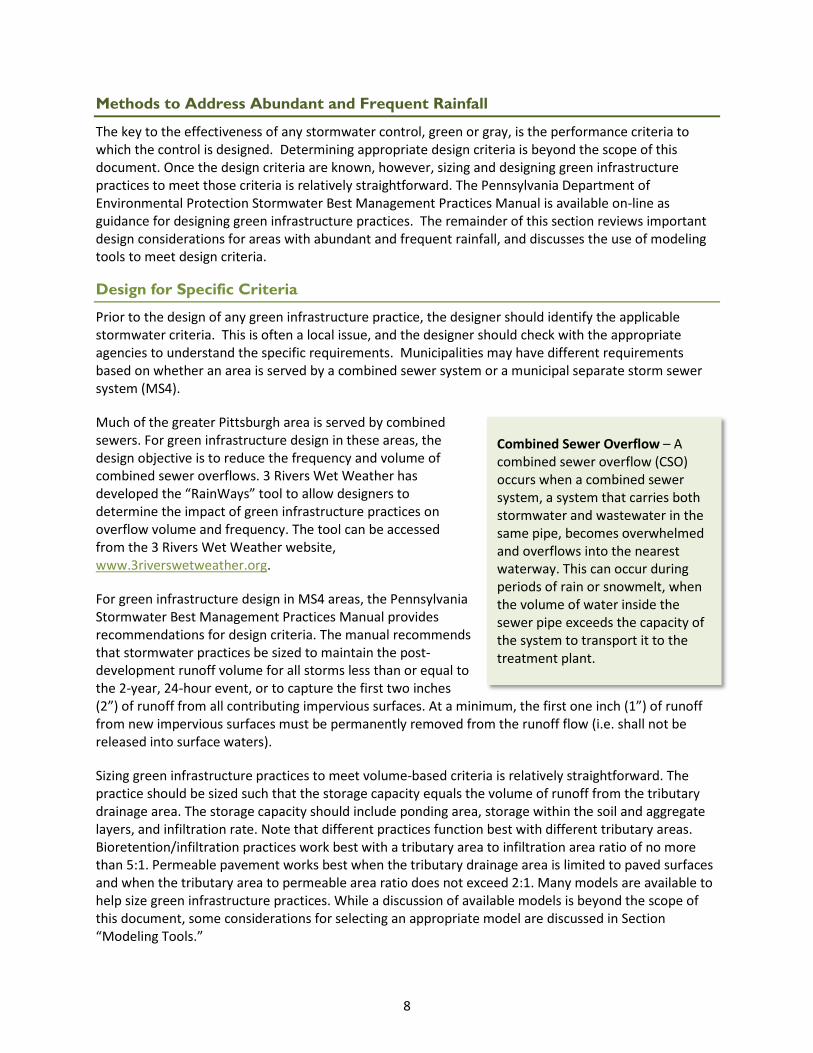
Methods to Address Abundant and Frequent Rainfall
The key to the effectiveness of any stormwater control, green or gray, is the performance criteria to which the control is designed. Determining appropriate design criteria is beyond the scope of this document. Once the design criteria are known, however, sizing and designing green infrastructure practices to meet those criteria is relatively straightforward. The Pennsylvania Department of Environmental Protection Stormwater Best Management Practices Manual is available on-line as guidance for designing green infrastructure practices. The remainder of this section reviews important design considerations for areas with abundant and frequent rainfall, and discusses the use of modeling tools to meet design criteria.
Design for Specific Criteria
Prior to the design of any green infrastructure practice, the designer should identify the applicable stormwater criteria. This is often a local issue, and the designer should check with the appropriate agencies to understand the specific requirements. Municipalities may have different requirements based on whether an area is served by a combined sewer system or a municipal separate storm sewer system (MS4).
Much of the greater Pittsburgh area is served by combined sewers. For green infrastructure design in these areas, the design objective is to reduce the frequency and volume of combined sewer overflows. 3 Rivers Wet Weather has developed the “RainWays” tool to allow designers to determine the impact of green infrastructure practices on overflow volume and frequency. The tool can be accessed from the 3 Rivers Wet Weather website, www.3riverswetweather.org.
For green infrastructure design in MS4 areas, the Pennsylvania Stormwater Best Management Practices Manual provides recommendations for design criteria. The manual recommends that stormwater practices be sized to maintain the post-development runoff volume for all storms less than or equal to the 2-year, 24-hour event, or to capture the first two inches (2”) of runoff from all contributing impervious surfaces. At a minimum, the first one inch (1”) of runoff from new impervious surfaces must be permanently removed from the runoff flow (i.e. shall not be released into surface waters).
Sizing green infrastructure practices to meet volume-based criteria is relatively straightforward. The practice should be sized such that the storage capacity equals the volume of runoff from the tributary drainage area. The storage capacity should include ponding area, storage within the soil and aggregate layers, and infiltration rate. Note that different practices function best with different tributary areas. Bioretention/infiltration practices work best with a tributary area to infiltration area ratio of no more than 5:1. Permeable pavement works best when the tributary drainage area is limited to paved surfaces and when the tributary area to permeable area ratio does not exceed 2:1. Many models are available to help size green infrastructure practices. While a discussion of available models is beyond the scope of this document, some considerations for selecting an appropriate model are discussed in Section “Modeling Tools.”
Combined Sewer Overflow – A combined sewer overflow (CSO) occurs when a combined sewer system, a system that carries both stormwater and wastewater in the same pipe, becomes overwhelmed and overflows into the nearest waterway. This can occur during periods of rain or snowmelt, when the volume of water inside the sewer pipe exceeds the capacity of the system to transport it to the treatment plant.
8

1. Overflow and Bypass Systems
Green infrastructure practices should always be designed with an overflow or bypass system, regardless of the specific design criteria used for sizing the facility. These systems provide a pathway for runoff volumes that exceed the design capacity of the green infrastructure practice, maintaining the practice integrity and preventing excess ponding. This is particularly important in areas with frequent rainfall to ensure that stormwater is redirected safely if the green infrastructure practice has not completely drained from a previous rainfall event.
The type of system selected depends on whether the practice is on-line or off-line. On-line practices provide stormwater control within the runoff flowpath, and receive runoff from all storms. Off-line practices, in contrast, provide stormwater control away from the runoff flowpath, and only receive runoff until their design capacity is exceeded (Figure 7). Overflow systems are included in on-line practices, while bypass systems are included in off-line practices. Note that off-line practices are better protected than on-line practices from erosive velocities and water damage caused by larger storm events. On-line practices can also work very well, however, care must be taken to minimize the risk of excessive velocities and transport of mulch downstream.
To ensure that the overflow or bypass system protects property and maintains safety, the full build-out 100-year, 24-hour design storm should be routed through the green infrastructure practice and the effects on the system, adjacent property, and downstream areas should be assessed. Even though the green infrastructure practice may be designed for a smaller storm event, the overall site should be designed to safely pass the flows resulting from the full build-out 100-year storm event as much as practicable. Refer to local standards for variations in this standard.
Figure 7. Off-Line and On-Line Bioretention Systems
Source: Tetra Tech Off-Line System
Water enters the bioretention area from a curb cut. Once the ponding area is full to the level of the gutter, stormwater will not enter the area but will be conveyed down the gutter to a catch basin.
9
Source: Tetra Tech On-Line System
Water enters the bioretention area from a curb cut. An overflow structure is placed within the bioretention area to convey flows in excess of the design flow.

2. Underdrains
In addition to an overflow or bypass system, installation of an underdrain can be important to meeting acceptable dewatering times and in preparing for the next storm event. Underdrains may be necessary if the measured permeability of the underlying soils is less than 0.5 inches/hour, particularly in areas subject to frequent storm events. For a green infrastructure practice to be successful in treating stormwater there must be capacity for runoff from the next storm event. When designing a green infrastructure practice, designers should verify soil permeability (see “Soil Investigation” section below). The underdrain may outlet to a suitable location such as a common space area, stream valley, drainage swale, roadside open channel, or an existing enclosed drainage system. Typically a 4-inch or 6-inch perforated underdrain is placed at an elevation to ensure the required dewater time is met while still promoting infiltration through the bottom of the system. Figure 8 shows an elevated underdrain pipe configuration in a bioretention system and Figure 9 shows permeable paver designs with an underdrain.
Source: Draft District of Columbia Stormwater Management Guidebook
Figure 8. Example Bioretention System with an Elevated Underdrain
Dewater Time – The dewater time is defined as the time it takes to drain the practice. It can be divided into surface dewater time and complete cross-section dewater time. Refer to the PA BMP Manual for recommendations on dewatering times.
10

11
Source: Pennsylvania Stormwater BMP Manual, Chapter 6.4.1 BMP Pervious Pavement with Infiltration Bed, and Virginia DCR Stormwater Design Specification No. 7 Permeable Pavement
Figure 9. Typical Cross-Sections of Permeable Paver System with Underdrains

3. Soil Investigation
Site evaluation and soil infiltration testing should be completed early in the site planning and design process. Prescreening may be conducted to identify preliminary sites for green infrastructure practices. Once preliminary sites are proposed, further investigation at the location of each proposed practice is recommended. Even if the soil is expected to have a low capacity for infiltration, accounting for the removal of runoff through infiltration may decrease the required size of the practice. Suggested methods to obtain information include conducting test pits and soil infiltration tests per Appendix C of the Pennsylvania Stormwater Best Management Practices Manual.
Modeling Tools
A range of models are available to assess the water quality and water quantity impacts of green infrastructure practices. Models range from very simple tools with minimal data input required, to more complex tools that require expertise and time. In general, complex models have many variables and parameters that need to be defined.
Models are a simulation of a real or theoretical situation which has parameters a user can alter. Modeling can simulate scenarios to predict outcomes of different design conditions. In the context of green infrastructure practice design, models can calculate the expected runoff from a user input rainfall record and compare results before and after construction of green infrastructure.
It is important to choose the simplest model that will satisfy the project/design objectives. Some models perform calculations only for discrete storm events and others allow for continuous long-term simulations. Continuous long-term simulations allow the designer to account for the effects of back to back storm events (antecedent conditions) on the green infrastructure practice and evaluate long term conditions. Discrete storm event simulations, in contrast, model one event and do not account for changes in soil moisture at the start of an event.
Some considerations when choosing a model include:
• Scale of project (e.g. site-level, neighborhood, community, watershed)
• Design criteria (e.g. peak flow attenuation and/or volume reduction)
• Availability of various model input parameters for a project (inflow hydrograph, soil type, topographic info.)
• Desired outputs (outflow hydrograph, volume reduction, pollutant removal, evapotranspiration loss, infiltration loss)
• Level of expertise required to perform modeling
Refer to the US EPA’s website for more information on modeling tools available, http://water.epa.gov/infrastructure/greeninfrastructure/gi_modelingtools.cfm.
12

Examples of Implemented Projects
Sterncrest Drive Bioswale and Rain Gardens, built 2007, Cuyahoga County, OH (Darner and Dumouchelle, 2011)
In 2007, the Chagrin River Watershed Partners with a grant from the U.S. EPA replaced 1,400 feet of roadside ditch with grassed bioswale and nine rain gardens on Sterncrest Drive near Cleveland, Ohio to alleviate flooding problems in the road and yards. The U. S. Geological Survey (USGS) then monitored the site from 2008-2010 to better define the effect of green infrastructure on stormwater runoff. This project demonstrates the ability of green infrastructure to retain stormwater in an area with rainfall patterns similar to Pittsburgh’s.
1. Design Summary
To address historical flooding at the site, the ditch was replaced with a series of bioswales interspersed with rain gardens (Figure 10) and overflow structures. The bioswale and rain garden system was designed to capture the runoff from the drainage area for a 0.75-inch rainfall event. The drainage area is made up of roadway and a single-family residential area, which discharges directly to the on-line green infrastructure system.
The soil at the Sterncrest Drive site is predominately a clay-rich till with low permeability. The water table is near the ground surface during wet periods of the year. With clay soil and a high water table, the soil provides little capacity to store infiltrated water so overflow structures and perforated underdrains were included in the design. The underdrains and overflow structures discharge to a downstream stormwater pipe. Both the bioswale and rain gardens were excavated and backfilled with a gravel storage layer and engineered soil mixture for better performance (Figure 11).
13
Source: Darner and Dumouchelle, 2011
Figure 10. Roadside Rain Garden in Cuyahoga County

Figure 11. Rain Garden and Bioswale Typical Cross-Sections
14

2. Results Summary
Rainfall and runoff data were collected along with overflow data to determine the frequency of overflows for rainfall events exceeding the design storm depth of 0.75-inch.
• Numerous rainfall events greater than 0.75-inch were retained and infiltrated by the bioswales and rain gardens.
• Over the three years of monitoring, the system only overflowed 22 times. Of the 22 recorded overflow events, 13 occurred when rainfall in the previous 24 hours exceeded the design storm depth, seven occurred when there was rainfall within the previous 96 hours, and two were unexplained overflow events occurring six hours apart.
• The bioswales and rain gardens performed better than expected in that there were more rainfall events greater than 0.75-inch that did not cause an overflow than events that caused an overflow.
3. Lessons Learned
Although the project site near Cleveland, Ohio was subject to abundant and frequent rainfall similar to that in the Pittsburgh area, the performance of a green infrastructure system within a road right-of-way out-performed its design capacity. This was likely due to the conservative assumptions on the storage and infiltration capabilities of the existing soil.
15

Michigan Avenue Bioretention Facilities, Lansing, MI
The Michigan Avenue Bioretention project in Lansing, Michigan was completed in 2007 and is an example of an off-line planter box style bioretention system in an ultra-urban environment. The system was designed for abundant and frequent rainfall typical of Lansing. Similar to Pittsburgh, most of its rainfall events are 1 inch or less. The project encompasses four blocks along a very busy five-lane street with parallel parking and extra wide sidewalks lined with stores, restaurants, and other businesses.
1. Design Summary
The project includes approximately 20 individual planter box-style bioretention cells dispersed behind the curb along four city blocks. The primary design goal was to include bioretention wherever possible along the project corridor resulting in a different treatment capacity for each of the four blocks. On average, the bioretention cells treat nearly 1 inch of rainfall that drains from the adjacent road and sidewalk. One of the blocks is capable of treating nearly 4 inches of rainfall from its drainage area.
Figure 12. Typical Bioretention Cross-Section on Michigan Avenue
Stormwater enters the bioretention cells from the road through curb cuts. The curb cuts direct runoff to a sediment forebay before spilling into the bioretention cells (Figure 12). Characteristic of an off-line system, once the cell has reached capacity the water backs up onto the road and continues along the curb line until reaching a catch basin or another bioretention cell. Captured stormwater moves through the soil matrix and leaves the cell either through a perforated underdrain or through infiltration. The existing soils are slowly-permeable so an underdrain was provided to help dewater the system within 24 hours and prepare for the next storm event.
Specifically chosen trees and native plantings within the bioretention cells provide water uptake and also aid infiltration with their root system while offering natural beauty (Figure 13). To determine
16

project effectiveness, monitoring was performed including infiltration testing, flow monitoring, plant health assessment, and porosity and field capacity testing.
Photos: Top left: 600 Block Michigan Avenue Before. This corridor was 100% impervious, receiving runoff from the roadway, sidewalk and buildings. Bottom left: during construction. Right: A 1,300-square-foot rain garden was installed with trees, perennial plants, and grasses to capture and treat stormwater runoff.
Figure 13. Photo Sequence of Bioretention on Michigan Avenue
2. Results Summary
Pre-construction flow monitoring was conducted to gather hydrologic characteristics of the site prior to installation of the bioretention cells. Post-construction flow monitoring efforts looked at the inflow and outflow hydrographs from an individual bioretention cell. The infiltration rate of the engineered soil, field capacity, porosity, and an assessment of overall plant health were also monitored. The monitoring information was then used to calibrate a system-wide model using US-EPA SWMM v 5.0.021. With the calibrated model, discrete design storms were simulated to analyze the effect of the entire project on the hydrology of the corridor.
17

Results showed that the bioretention system was able to remove a greater volume of stormwater than expected, likely due to the storage capacity of the engineered soil and the robust vegetation. For a 1-year, 1-hour design storm, overall volume is reduced by 46%, peak flow rate is reduced by 66%, and time to peak is reduced by 33% (Figure 14). A long-term continuous simulation using approximately 50 years of data indicated an average annual reduction of runoff volume of approximately 75%.
The function of the curb cut inlets and gutter bypass are working as an off-line system as anticipated. The underdrains are working to dewater the system within 24 hours as designed.
Figure 14. Runoff Comparison 1-year 1-hour
3. Lessons Learned
Based on modeling results, the bioretention system is performing better than expected with peak flow, volume, and time-to-peak reductions. The off-line design ensures excess stormwater bypasses the system and the underdrain ensures an acceptable dewater time. Lansing’s abundant and frequent rainfall is not a barrier; rather it was addressed as part of the design process.
18

References
Manuals, Articles, and Books 3 Rivers Wet Weather. 2013. Report on the 3 Rivers Wet Weather Project for Municipal Area-Wide
Assessment of the Feasibility of Green Infrastructure.
Burgess & Niple, Limited. June 1989. City of Cincinnati Stormwater Management Rules and Regulations, Part 1, Technical Reference Manual.
Darner, R.A., and Dumouchelle, D. H. 2011. Hydraulic characteristics of low-impact development practices in northeastern Ohio, 2008-2010: U.S. Geological Survey Scientific Investigations Report 2011-5165, 19 p.
Draft District of Columbia Stormwater Management Guidebook.
FISRWG. October 1998. Stream Corridor Restoration: Principles, Processes, and Practices. By the Federal Interagency Stream Restoration Working Group. Chapter 2: Stream Corridor Processes, Characteristics, and Functions.
Lukes, R., Kloss, C. 2008. Managing Wet Weather with Green Infrastructure, Municipal Handbook, Green Streets. Low Impact Development Center. Environmental Protection Agency.
Montalto, F., Smalls-Mantey, L., DiGiovanni, K., Gunther, B., Compton, N. , and Shetty N. 2013. The Performance of Green Infrastructure Under Extreme Climate Conditions. Drexel/CCRUN, NYC Department of Parks & Recreation.
Pennsylvania Department of Environmental Protection (PADEP). 2006. Pennsylvania Stormwater Best Management Practices Manual.
Prince George’s County, Maryland. Bioretention Design Specifications and Criteria.
U.S. Department of Agriculture. March 2007. Natural Resources Conservation Service. Part 630 Hydrology National Engineering Handbook. Chapter 16 Hydrographs.
U.S. Department of Commerce. National Oceanic and Atmospheric Administration. National Weather Service. 2006. NOAA Atlas 14 Precipitation-Frequency Atlas of the United States, Volume 2, Version 3.
U.S. Department of Commerce. Weather Bureau. 1961. Technical Paper No. 40 Rainfall Frequency Atlas of the United States.
U.S. Army Corps of Engineers Hydrologic Engineering Center. March 1979. Flood Hydrograph and Peak Flow Frequency Analysis.
Virginia DCR Stormwater Design Specification No. 7 Permeable Pavement. Version 1.8. March 2011
Westmoreland Conservation District. 2013. Primer on Stormwater Management: Bioretention in Clay Soils, 3rd Edition. www.wcdpa.com Last Accessed September 2013.
19

Websites 3 Rivers Wet Weather http://www.3riverswetweather.org/about-wet-weather-issue. Last accessed September 2013.
Clean Rivers Campaign http://cleanriverscampaign.org/green-solutions/. Last accessed March 2013.
New York State Department of Environmental Conservation http://www.dec.ny.gov/lands/58930.html. Last accessed March 2013.
NOAA National Weather Service http://www.erh.noaa.gov/ctp/hydro/index.php?tab=precip#picture. Last accessed March 2013.
Oregon State University http://prism.oregonstate.edu/. Last accessed March 2013.
Penn State Climatological Office http://www.stateclimate.org/state.php?state_id=PA. Last accessed March 2013.
Philadelphia Water Department http://www.phillywatersheds.org/what_were_doing/green_infrastructure/tools. Last accessed March 2013.
Sustainable City Network http://www.sustainablecitynetwork.com/topic_channels/water/article_44044ddc-e499-11e0-81d1-0019bb30f31a.html. Last accessed March 2013.
US EPA Website http://water.epa.gov/infrastructure/greeninfrastructure/gi_design.cfm. Last Accessed March 2013. http://water.epa.gov/infrastructure/greeninfrastructure/gi_modelingtools.cfm. Last accessed March 2013.
Yakima County Regional Stormwater Management Program http://www.yakimacounty.us/stormwater/lid/overview.htm. Last accessed March 2013.
20