advances in airborne wind energy and wind drones · abstract among novel technologies for producing...
TRANSCRIPT

Scuola Superiore Sant’AnnaTecip Institute, via Moruzzi 1, Pisa, Italy
PhD Thesis in Emerging Digital Technologies
Advances in Airborne Wind
Energy and Wind Drones
Antonello Cherubini
Tutor:Prof. Marco Fontana

Reviewers:Prof. Roland SchmehlProf. Philip Bechtle
2

Preface andAcknowledgements
When I first started my PhD program at Scuola Superiore Sant’Annain Pisa I never imagined the vibrant, educational, constructive andinspiring environment that I found. I still don’t know what makesthis place so good for research, it might be the balance between sunnysummers and rainy winters, or the left-wing, dirty and warm city, orthe amount of artists and philosophers outside the laboratory, orsimply a strong tradition of science and engineering. After all, thisis where Galileo was from. In Pisa it is easy to meet new people andshare your thoughts with them, I will always remember some of thebest conversations of my life during random nights with people whosename I can hardly remember. It seems that good brainstorming,creative thinking, games and art are rooted deep inside this place.
Scuola Sant’Anna is a tiny and beautiful university in Pisa, born30 years ago, and now in the top ten world ranking of the young uni-versities. Few people outside Italy know it, but whoever has knownSant’Anna has good words for it. I am glad and proud to have beenpart of it and I hope that this thesis and my publications will be asmall piece of the big puzzle of innovation that mankind needs in aworld where resources are always less and demand is always more.
The list of people that I should thank is fairly long and it goesmore or less like this. First, I wish to thank my supervisor, Prof.Marco Fontana, the kindest of all bosses and a really really brightmind. Thank you Marco, you are a master to me. Special thanks tomy colleagues Giacomo and Gastone for their deep daily conversa-tions in our tasty and lovely canteen and their constructive attitude.Thanks also to: Prof. Roland Schmehl for trusting me, Pietro Fag-
3

giani and Eduardo Terzedis for their pasta-time in the Dutch days,Prof. Philip Bechtle for making me feel an important guest by let-ting an engineer teach physics in a physics department, Ing. FabioCalamita, Nicola Giulietti and Marco Marzot for their patience inreading some of my works, Ing. Basilio Lenzo for sharing with memany dance floors and nights, Marcello Corongiu for being an inspi-ration, Aldo Cattano for asking me to join his team. Many thanksthe numerous players in the Airborne Wind Energy field who gaveme their feedbacks and comments. Thanks to Mr. Riccardo Renna,former administrator in the Kitegen team, for his support and hisability to look deep inside people and a final big thank you to myparents and my girlfriend for never having asked that silly question‘When are you going to find a real job?’
Hoping that the reader of this thesis will find this work useful, Iwish to add that the footer of this thesis contains a flipbook animationwhere the reader can already see a dual drone system taking off!
4

Abstract
Among novel technologies for producing electricity from renewableresources, a new class of wind energy converters has been conceivedunder the name of Airborne Wind Energy Systems (AWESs) or WindDrones (WDs). This new generation of systems employs flying teth-ered wings or aircraft in order to reach winds blowing at atmospherelayers that are inaccessible by traditional wind turbines.
The economics of AWESs is very promising for mainly two rea-sons. First, winds high above ground level are steadier and typ-ically much more powerful, persistent and globally available thanthose closer to the ground, and second, the structure of AWESs isexpected to be orders of magnitude lighter than conventional windturbines.These plants are therefore interesting for their potential highpower density, i.e. ratio between nominal power and weight of re-quired constructions, that makes it possible to forecast a low LevelizedCost of Energy (LCOE) for the produced electricity.
Despite this interesting potential, two important issues might bea major limitation to AWESs development. First, the large require-ment in terms of airspace and the related safety issues, and second,the power dissipation through the aerodynamic cable drag. In ascenario where AWESs beat conventional wind turbines in terms ofLCOE, the large airspace requirement is a logistic constraint thatmight slow down the economic development of AWESs, but the rela-tively small size/weight of AWESs foundations might be a key factorthat enables the development of inexpensive floating offshore plat-forms thus solving the airspace limitations thanks to practically un-limited sea area. A significant part of this thesis investigates theperformance of floating offshore AWESs by means of dynamic mod-els, first with a single Degree of Freedom (D.o.F.) of the floatingplatform, then with a more complex multi D.o.F. model.
The second issue, the aerodynamic cable drag, is a physical con-straint that is already limiting the potential of AWESs. In short,in order to reach higher altitudes, current AWESs must increasethe cable length, but the power that would be dissipated by sweep-ing a longer cable through the air exceeds the power that would begained from stronger winds at higher altitudes. This prevents currentAWESs from working at very high altitudes where the jet streamscarry up to 15.5 kW/m2 of wind power density.
A possible solution to this second problem is represented by a
5

dual Wind Drone architecture in which two aircrafts, with on-boardgenerators, are connected to the ground with a ‘Y’ shaped tether-ing; a concept that was first envisioned in 1976. At that time it washard to envision a real operation of this system but recent studiesare starting to investigate this concept in more detail. The last twochapters contain an attempt to estimate the power output of a largescale dual Wind Drone system and a proposal for a novel take-offmethod that might enable a first implementation of the dual WindDrone system. It is first introduced a power model that capturesthe most significant real-world issues such as the effect of the weightof airborne components, the limits of structural/electrical elements,and considers take-off constraints. A numerical case study is analyzedconsidering a large scale system in Saudi Arabia. For such a device,the power curve is computed and, using real wind data, a nominalpower output of approximately 15 MW with 30% capacity factor isestimated. Finally an experimental campaign that was carried out inTU Delft is described. In that campaign a take-off system for dualdrones inspired to the so called ‘control line flight’ was investigated.The passive flight stability of a single wind drone in axi-symmetricconfiguration is a positive experimental evidence that encourages fur-ther research in dual drone systems.
6

Contents
Introduction 13
1 Airborne Wind Energy: state of the art and literaturereview 17
1.1 Availability of Airborne Wind Energy . . . . . . . . . 18
1.2 Classifications of Airborne Wind Energy Systems . . . 19
1.3 Ground-Gen Airborne Wind Energy Systems . . . . . 20
1.3.1 Ground-Gen systems architectures and aircraft 23
1.3.2 Fixed-ground-station systems under development 26
1.3.3 Moving-ground-station systems under develop-ment . . . . . . . . . . . . . . . . . . . . . . . . 34
1.4 Fly-Gen Airborne Wind Energy Systems . . . . . . . . 35
1.4.1 Aircraft in Fly-Gen systems . . . . . . . . . . . 35
1.4.2 Fly-Gen systems under development . . . . . . 38
1.5 Crosswind flight: the key to large scale deployment . . 40
1.5.1 Crosswind GG-AWESs . . . . . . . . . . . . . . 42
1.5.2 Crosswind FG-AWESs . . . . . . . . . . . . . . 44
1.6 Discussion . . . . . . . . . . . . . . . . . . . . . . . . . 46
1.6.1 Effect of flying mass . . . . . . . . . . . . . . . 46
1.6.2 Rigid vs Soft Wings . . . . . . . . . . . . . . . 46
1.6.3 Take-off and landing challenge . . . . . . . . . 46
1.6.4 Optimal altitude . . . . . . . . . . . . . . . . . 47
1.6.5 Angle of attack control . . . . . . . . . . . . . . 47
1.6.6 Cables . . . . . . . . . . . . . . . . . . . . . . . 48
1.6.7 Business opportunities . . . . . . . . . . . . . . 50
1.7 Conclusions . . . . . . . . . . . . . . . . . . . . . . . . 50
7

CONTENTS
2 Simplified model of offshore airborne wind energy con-verters 532.1 Offshore AWES . . . . . . . . . . . . . . . . . . . . . . 542.2 Model . . . . . . . . . . . . . . . . . . . . . . . . . . . 56
2.2.1 Hydrodynamic model . . . . . . . . . . . . . . 572.2.2 Aerodynamic model . . . . . . . . . . . . . . . 592.2.3 Integrated model . . . . . . . . . . . . . . . . . 612.2.4 Control . . . . . . . . . . . . . . . . . . . . . . 622.2.5 Combined wind-wave power output . . . . . . . 63
2.3 Case study . . . . . . . . . . . . . . . . . . . . . . . . 652.3.1 Geometry . . . . . . . . . . . . . . . . . . . . . 652.3.2 Computation of the hydrodynamic coefficients 672.3.3 Results . . . . . . . . . . . . . . . . . . . . . . 672.3.4 Small aircraft - Small platform . . . . . . . . . 692.3.5 Small aircraft - Medium platform . . . . . . . . 692.3.6 Small aircraft - Big platform . . . . . . . . . . 692.3.7 Big aircraft . . . . . . . . . . . . . . . . . . . . 692.3.8 Discussion . . . . . . . . . . . . . . . . . . . . . 702.3.9 Transient behaviour . . . . . . . . . . . . . . . 702.3.10 Applicability of the results . . . . . . . . . . . 73
2.4 Conclusions . . . . . . . . . . . . . . . . . . . . . . . . 73
3 Dynamic model of floating offshore airborne wind en-ergy systems 753.1 Model . . . . . . . . . . . . . . . . . . . . . . . . . . . 76
3.1.1 Floating platform dynamic model . . . . . . . . 783.1.2 Mooring lines model . . . . . . . . . . . . . . . 813.1.3 Kite model . . . . . . . . . . . . . . . . . . . . 83
3.2 Case study . . . . . . . . . . . . . . . . . . . . . . . . 863.2.1 Simulator . . . . . . . . . . . . . . . . . . . . . 873.2.2 Platform and mooring . . . . . . . . . . . . . . 893.2.3 Kite and controller . . . . . . . . . . . . . . . . 913.2.4 Simulation results . . . . . . . . . . . . . . . . 93
3.3 Discussion . . . . . . . . . . . . . . . . . . . . . . . . . 973.4 Conclusions . . . . . . . . . . . . . . . . . . . . . . . . 102
4 Assessment of high altitude dual wind energy dronegenerators 1034.1 Jet stream altitude wind drone system . . . . . . . . . 1044.2 Model . . . . . . . . . . . . . . . . . . . . . . . . . . . 108
8

CONTENTS
4.2.1 Model hypotheses . . . . . . . . . . . . . . . . 1084.2.2 Geometrical relations . . . . . . . . . . . . . . 1094.2.3 Distributed drag on fixed cable . . . . . . . . . 1094.2.4 Crosswind Fly-Gen flight and drone mass . . . 1104.2.5 Structural equations of dancing cables . . . . . 1134.2.6 Electrical equations . . . . . . . . . . . . . . . 1134.2.7 Fixed cable mass and shape . . . . . . . . . . . 1144.2.8 Power output . . . . . . . . . . . . . . . . . . . 115
4.3 Power curves of a dual wind drone system . . . . . . . 1154.3.1 Power coefficient of the high altitude wind drone
system . . . . . . . . . . . . . . . . . . . . . . . 1204.4 Future works . . . . . . . . . . . . . . . . . . . . . . . 1204.5 Conclusions . . . . . . . . . . . . . . . . . . . . . . . . 125
5 Automatic ‘control-line flight’ for high altitude windenergy drones 1275.1 Dynamic model of take off and landing of a single drone129
5.1.1 Position . . . . . . . . . . . . . . . . . . . . . . 1305.1.2 Attitude . . . . . . . . . . . . . . . . . . . . . . 1315.1.3 Kinematics . . . . . . . . . . . . . . . . . . . . 1315.1.4 Force balance . . . . . . . . . . . . . . . . . . . 1335.1.5 Relative wind velocity and angles of attack . . 1335.1.6 Aerodynamic coefficients and forces . . . . . . 1345.1.7 Pitch motion dynamics . . . . . . . . . . . . . 1355.1.8 Horizontal steady-state flight . . . . . . . . . . 1365.1.9 Pitch stability . . . . . . . . . . . . . . . . . . . 1365.1.10 Altitude stability . . . . . . . . . . . . . . . . . 1375.1.11 Faster than real time integration . . . . . . . . 137
5.2 Test setup . . . . . . . . . . . . . . . . . . . . . . . . . 1375.3 Automatic flight results . . . . . . . . . . . . . . . . . 1395.4 Conclusions . . . . . . . . . . . . . . . . . . . . . . . . 144
A How to use the open source multi d.o.f floating off-shore AWE simulator 149A.1 Step by step guide . . . . . . . . . . . . . . . . . . . . 149A.2 Hydrodynamic preprocessing . . . . . . . . . . . . . . 151A.3 Input simulation options . . . . . . . . . . . . . . . . . 151A.4 Input platform and mooring data . . . . . . . . . . . . 153A.5 Input kite data . . . . . . . . . . . . . . . . . . . . . . 154A.6 Simulation results . . . . . . . . . . . . . . . . . . . . 155
9

CONTENTS
B Cables for Airborne Wind Energy 159B.1 Cable sag 2D steady state model . . . . . . . . . . . . 159
B.1.1 Differential steady state model at constant ten-sion . . . . . . . . . . . . . . . . . . . . . . . . 160
B.1.2 Without gravity, constant ρ . . . . . . . . . . . 161B.1.3 Without gravity, variable ρ . . . . . . . . . . . 162B.1.4 With gravity, constant ρ . . . . . . . . . . . . . 163B.1.5 Numerical results . . . . . . . . . . . . . . . . . 163
B.2 Partitioned tether fairing . . . . . . . . . . . . . . . . 165B.2.1 Concept . . . . . . . . . . . . . . . . . . . . . . 165B.2.2 Experimental procedure . . . . . . . . . . . . . 167
C Fast solver based on non-linear iterative nested loops171C.1 Pre-processing wind data analysis . . . . . . . . . . . . 171C.2 Solver processing . . . . . . . . . . . . . . . . . . . . . 172C.3 Post-processing and hovering constraint . . . . . . . . 173
D Technical drawings of the wind drone experimentalsetup 177
Bibliography 217
10

List of Acronyms
AWE Airborne Wind Energy
AWES Airborne Wind Energy System
AWT Airborne Wind Turbine
BEM Boundary Element Method
CF Capacity Factor
CFD Computational Fluid Dynamic
DoF Degree of Freedom
EU European Union
FEG Flying Electric Generator
FG Fly-Gen
FG-AWES Fly-Gen Airborne Wind Energy System
GG Ground-Gen
GG-AWES Ground-Gen Airborne Wind Energy System
ISA International Standard Atmosphere
LEI Leading Edge Inflatable
KGR KiteGen Research
LCOE Levelized Cost of Energy
NIMBY Not In My Back-Yard
11

CONTENTS
PTO Power Take Off
PPM Pulse Position Modulation
TLP Tension Leg Platform
UHMWPE Ultra High Molecular Weight Polyethylene
VIV Vortex-Induced Vibration
WEC Wave Energy Converter
WED Wind Energy Drone
WD Wind Drone
12

Introduction
Advancement of societies, and in particular in their ability to sustainlarger populations, are closely related to changes in the amount andtype of energy available to satisfy human needs for nourishment andto perform work [1]. Low access to energy is an aspect of poverty. En-ergy, and in particular electrical energy, is indeed crucial to provideadequate services such as water, food, healthcare, education, employ-ment and communication. To date, the majority of energy consumedby our societies has come from fossil and nuclear fuels, which are nowfacing severe issues such as security of supply, economic affordability,environmental sustainability and disaster risks.
To address these problems, major countries are enacting energypolicies focused on the increase in the deployment of renewable energytechnologies. In particular:
• since 1992, to prevent the most severe impacts of climate change,the United Nations member states are committed to a drasticreduction in greenhouse gas emissions below the 1990 levels;
• in September 2009, both European Union and G8 leaders agreedthat carbon dioxide emissions should be cut by 80% before2050 [2].
In the European Union (EU), compulsory implementation of sucha commitment is occurring via the Kyoto Protocol, which bounded15 EU members to reduce their collective emissions by 8% in the2008-2012 period, and the ‘Climate Energy Package (the 20-20-20targets)’, which obliges EU to cut its own emissions by at least 20%by 2020.
In this context, in the last decades there has been a fast growthand spread of renewable energy plants. Among them, wind genera-tors are the most widespread type of intermittent renewable energy
13

INTRODUCTION
harvesters with their 318 GW of cumulative installed power at theend of 2013 [3]. Wind capacity, i.e. total installed power, is keepinga positive trend with an increment of 35.47 GW in 2013, howeverthe growth rate slightly decreased due to saturation of in-land windyareas that are suitable for installations. For this reason, current re-search programs are oriented to the improvement of power capacityper unit of land area. This translates to the global industrial trend ofdeveloping single wind turbines with increased nominal power (up to5 MW) that feature high-length blades (to increase the swept area)and high-height turbine axis (to reach stronger winds at higher alti-tudes) [4].
More recently, because of market reasons, capacity factors areincreasing, reaching values up to 50% [5].
In parallel, since the beginning of 2000s, industrial research isinvesting on offshore installations. In locations that are far enoughfrom the coast, wind resources are generally greater than those onland, with the winds being stronger and more regular, allowing a moreconstant usage rate and accurate production planning, and providingmore power available for conversions. The foreseen growth rate ofoffshore installations is promising; if this exponential growth rate iscontinued [6], the worldwide installed offshore power is envisaged inthe order of 45 GW in 2020.
In this framework, a completely new renewable energy sector,Airborne Wind Energy (AWE), emerged in the scientific commu-nity. AWE aims at capturing wind energy at significantly increasedaltitudes. Machines that harvest this kind of energy can be referredto as AWESs. The high level and the persistence of the energy car-ried by high-altitude winds, that blow in the range of 200 m - 10 kmfrom the ground surface, has attracted the attention of several re-search communities since the beginning of the eighties. The basicprinciple was introduced by the seminal work of Loyd [7] in whichhe analyzed the maximum energy that can be theoretically extractedwith AWESs based on tethered wings. During the nineties, the re-search on AWESs was practically abandoned; but in the last decade,the sector has experienced an extremely rapid acceleration. Severalcompanies have entered the business of high-altitude wind energy,registering hundreds of patents and developing a number of proto-types and demonstrators. More and more research teams all over theworld are currently working on different aspects of the technologyincluding control, electronics and mechanical design. Figs. 1 and 2
14

INTRODUCTION
show the current trends in published knowledge in AWE for the caseof industrial patents and academic publications, respectively.
Figure 1: AWE patent application trend Number of patents as a function of yearof first application. Non-cumulative results searching for: (airborne wind energy)OR (high altitude wind energy) OR (kite power). Orbit-Questel database, Apr2017.
Figure 2: AWE academic publication trend Google Scholar search results. Non-cumulative number of items searching for: ‘airborne wind energy’ OR ‘high alti-tude wind energy’ OR ‘kite power’ -patent.
This thesis is divided into five chapters, Chapter 1 is very usefulto the first-time reader and to those who want to know more aboutAWE and Wind Drones in general. The content is mainly taken froma review paper that we published after the Airborne Wind EnergyConference of 2015 in TU Delft [8]. It is now on the top 20 of themost downloaded papers of all times of the journal ‘Renewable andSustainable Energy Reviews’.
Marine applications of AWE are envisaged to be particularly promis-ing thanks to the potential ability to overcome important constraintssuch as airspace, safety and Not In My Back-Yard (NIMBY) effect.The most interesting case is represented by floating platforms in deep
15

INTRODUCTION
water locations, that are the most abundantly available and wherethe airspace is practically unlimited. In order to properly address theproblem of design and verification of such a kind of system, modelsthat are able to describe the dynamic response of floating platformsto combined kite forces and wave loads have to be developed. Forthis reason, two dynamic models for Offshore Airborne Wind En-ergy Systems are presented in this thesis in two chapters. Chap-ter 2 introduces a basic model for floating offshore AWESs. Someof its content is taken from one of our publications in ‘RenewableEnergy’ [9]. Chapter 3 explains a more advanced model for floatingoffshore AWESs. Its contents were published in the book ‘AirborneWind Energy’ [10]. An open source simulator for offshore AWESs wasreleased [11] and its first user-manual is also included in Appendix A.
Together with offshore AWESs, this thesis also deals with anotherimportant topic for the long term development of AWE, the reduc-tion of the cable aerodynamic drag by means of multiple wind dronesystems. Reaching higher altitudes is desirable because of the higherwind power density, however In order to reach higher altitudes, alonger cable is of course needed. However this means sweeping alonger cable though the air and the gain in power provided by thestrength of winds at higher altitude is not enough to compensate theloss in power, through cables drag, that increases with the cable’slength. Chapter 4 is about a theoretical assessment of a system oftwo drones that is potentially able to overcome the problem of thecable aerodynamic drag and finally unleash the tremendous power ofjet-streams. Chapter 5 provides an insight about the experimentalflight dynamics of a single tethered wind drone in axi-symmetric con-figuration in laboratory conditions that provides an understanding ofthe flight dynamics of a low-drag multiple wind drone system. Ap-pendix B provides further important details about cables for AWE.Being the cable arguably one of the most important subsystems andalso a major physical limitation of AWE generators, I decided to in-clude this appendix. Finally, Appendix C describes the architectureof a fast iterative solver for the model proposed in Chapter 4 and Ap-pendix D contains the technical drawing of the experimental setupdescribed in Chapter 5.
16

Chapter 1
Airborne Wind Energy:state of the art andliterature review
This chapter provides an overview of the different AWES conceptsfocusing on devices that have been practically demonstrated withprototypes. The chapter is structured as follows. Section 1.1 pro-vides a brief description of the energy resource of high altitude winds.Section 1.2 provides a unified and comprehensive classification of dif-ferent AWES concepts, which tries to merge previously proposed tax-onomies. In sections 1.3 and 1.4, an up to date overview of differentdevices and concepts is provided. Section 1.5 explains why AWE isso attractive thanks to some simple and well-known models. Finally,section 1.6 presents some key techno-economic issues basing on thestate of the art and trends of academic and private research. Differ-ently from other previously published reviews, this chapter deals withaspects that concern architectural choices and mechanical design ofAWESs. We made our best in collecting comprehensive informationfrom literature, patents and also by direct contacts with some of themajor industrial and academic actors.
17

CHAPTER 1. AIRBORNE WIND ENERGY: STATE OF THEART AND LITERATURE REVIEW
1.1 Availability of Airborne Wind Energy
High-altitude winds have been studied since decades by meteorolo-gists, climatologists and by researchers in the field of environmentalscience even though many questions are still unsolved [12]. The firstwork aimed at evaluating the potential of AWE as a renewable energyresource has been presented by Archer and Caldeira [13]. Their pa-per introduces a study that assesses a huge worldwide availability ofkinetic energy of wind at altitudes, between 0.5 km and 12 km abovethe ground, providing clear geographical distribution and persistencymaps of wind power density at different ranges of altitude. This pre-liminary analysis does not take into account the consequences on windand climate of a possible extraction of kinetic energy from winds.However, the conclusions of these researchers already raised the at-tention of many researchers and engineers suggesting great promisesfor technologies able to harvest energy from high altitude winds.
More in depth studies have been conducted employing complexclimate models, which predict consequences associated with the in-troduction of wind energy harvesters (near surface and at high alti-tude), that exerts distributed drag forces against wind flows. Marvelet al. [14] estimate a maximum of 400 TW and 1800 TW of kineticpower that could be extracted from winds that blows respectivelynear-surface (harvested with traditional wind turbines) and throughthe whole atmospheric layer (harvested with both traditional tur-bines and high altitude wind energy converters). Even if in the caseof such a massive extraction severe/undesirable changes could affectthe global climate, the authors show that the extraction of ‘only’18 TW (i.e. a quantity comparable with the actual world power de-mand) does not produce significant effects at global scale. This meansthat, from the geophysical point of view, very large quantity of powercan be extracted from wind at different altitudes.
A more skeptical view on high altitude winds is provided in Milleret al. [15] who evaluated in 7.5 TW the maximum sustainable globalpower extraction. But their analysis is solely focused on jet streamwinds (i.e. only at very high altitude between 6 km - 15 km abovethe ground).
Despite the large variability and the level of uncertainty of theseresults and forecasts, it is possible to conclude that an importantshare of the worldwide primary energy could be potentially extractedfrom high altitude winds. This makes it possible to envisage great
18

CHAPTER 1. AIRBORNE WIND ENERGY: STATE OF THEART AND LITERATURE REVIEW
business and research opportunities for the next years in the field ofAirborne Wind Energy.
1.2 Classifications of Airborne Wind En-ergy Systems
In this chapter, the term AWES is used to identify the whole electro-mechanical machine that transforms the kinetic energy of wind intoelectrical energy. AWESs are generally made of two main compo-nents, a ground system and at least one aircraft that are mechani-cally connected (in some cases also electrically connected) by ropes(often referred to as tethers). Among the different AWES concepts,we can distinguish Ground-Gen systems in which the conversion ofmechanical energy into electrical energy takes place on the groundand Fly-Gen systems in which such conversion is done on the air-craft [16] (Fig. 1.1).
Figure 1.1: AWESs. Example of Ground-Gen (a) and Fly-Gen (b) AWESs.
In a Ground-Gen Airborne Wind Energy System (GG-AWES),electrical energy is produced on the ground by mechanical work doneby traction force, transmitted from the aircraft to the ground sys-tem through one or more ropes, which produce the motion of anelectrical generator. Among GG-AWESs we can distinguish betweenfixed-ground-station devices, where the ground station is fixed to theground and moving-ground-station systems, where the ground stationis a moving vehicle.
19

CHAPTER 1. AIRBORNE WIND ENERGY: STATE OF THEART AND LITERATURE REVIEW
In a Fly-Gen Airborne Wind Energy System (FG-AWES), elec-trical energy is produced on the aircraft and it is transmitted to theground via a special rope which carries electrical cables. In this case,electrical energy conversion is generally achieved using wind turbines.FG-AWESs produce electric power continuously while in operationexcept during take-off and landing maneuvers in which energy is con-sumed. Among FG-AWESs it is possible to find crosswind systemsand non-crosswind systems depending on how they generate energy.
1.3 Ground-Gen Airborne Wind EnergySystems
In GG-AWESs electrical energy is produced exploiting aerodynamicforces that are transmitted from the aircraft to the ground throughropes. As previously anticipated, GG-AWESs can be distinguishedin devices with fixed or moving-ground-station.
Fixed-ground-station GG-AWESs (or Pumping Kite Generators)are among the most exhaustively studied by private companies andacademic research laboratories. Energy conversion is achieved with atwo-phase cycle composed by a generation phase, in which electricalenergy is produced, and a recovery phase, in which a smaller amountof energy is consumed (Fig. 1.2). In these systems, the ropes, whichare subjected to traction forces, are wound on winches that, in turn,are connected to motor-generators axes. During the generation phase,aircraft are driven in a way to produce a lift force and consequentlya traction (unwinding) force on the ropes that induces the rotationof the electrical generators. For the generation phase, the most usedmode of flight is the crosswind flight (Fig. 1.2.a) with circular or socalled eight-shaped paths. As compared to a non-crosswind flight(with the aircraft in a static angular position in the sky), this modeinduces a stronger apparent wind on the aircraft that increases thepulling force acting on the rope. In the recovery phase (Fig. 1.2.b)motors rewind the ropes bringing the aircraft back to its originalposition from the ground. In order to have a positive balance, thenet energy produced in the generation phase has to be larger thanthe energy spent in the recovery phase. This is guaranteed by acontrol system that adjusts the aerodynamic characteristics of theaircraft [17] and/or controls its flight path [18] in a way to maximizethe energy produced in the generation phase and to minimize the
20

CHAPTER 1. AIRBORNE WIND ENERGY: STATE OF THEART AND LITERATURE REVIEW
energy consumed in the recovery phase.
Figure 1.2: Scheme of the two-phase discontinuous energy production forGG-AWESs. a) The energy generation phase occurs during the unwinding ofthe ropes as the aircraft performs a crosswind flight. b) The recovery phase isperformed in order to minimize the energy consumed for the recovery.
Pumping kite generators present a highly discontinuous poweroutput, with long alternating time-periods (in the order of tens ofseconds) of energy generation and consumption. Such an unattractivefeature makes it necessary to resort to electrical rectification meanslike batteries or large capacitors. The deployment of multiple AWESsin large high-altitude wind energy farms could significantly reduce thesize of electrical storage needed.
Moving-ground-station GG-AWESs are generally more complexsystems that aim at providing an always positive power flow whichmakes it possible to simplify their connection to the grid. There aredifferent concepts of moving-ground-station GG-AWESs (Fig. 1.3)but no working prototype has been developed up to date and only oneprototype is currently under development (see paragraph 1.3.3). Dif-ferently from the pumping generator, for moving-ground-station sys-tems, the rope winding and unwinding is not producing/consumingsignificant power but is eventually used only to control the aircrafttrajectory. The generation takes place thanks to the traction force ofropes that induces the rotation (or linear motion) of a generator thatexploits the ground station movement rather than the rope windingmechanism.
Basically, there are two kinds of moving-ground-station GG-AWES:
• ‘Vertical axis generator’ (Fig. 1.3.a) where ground stations are
21

CHAPTER 1. AIRBORNE WIND ENERGY: STATE OF THEART AND LITERATURE REVIEW
Figure 1.3: Scheme of three different concepts of moving-ground-stationGG-AWES. a) Vertical axis generator: ground stations are fixed on the peripheryof the rotor of a vertical axis generator; b) Closed loop rail: ground stations arefixed on trolleys that move along a closed loop rail; c) Open loop rail: groundstations are fixed on trolleys that move along a open loop rail.
22
CHAPTER 1. AIRBORNE WIND ENERGY: STATE OF THEART AND LITERATURE REVIEW
fixed on the periphery of the rotor of a large electric generatorwith vertical axis. In this case, the aircraft forces make theground stations rotate together with the rotor, which in turntransmits torque to the generator.
• ‘Rail generators’ (closed loop rail (Fig. 1.3.b) or open loop rail(Fig. 1.3.c)) where ground stations are integrated on rail vehi-cles and electric energy is generated from vehicle motion. Inthese systems, energy generation looks like a reverse operationof an electric train.
The following subsections provide an overview of the most relevantprototypes of GG-AWESs under development in the industry and theacademy.
1.3.1 Ground-Gen systems architectures and air-craft
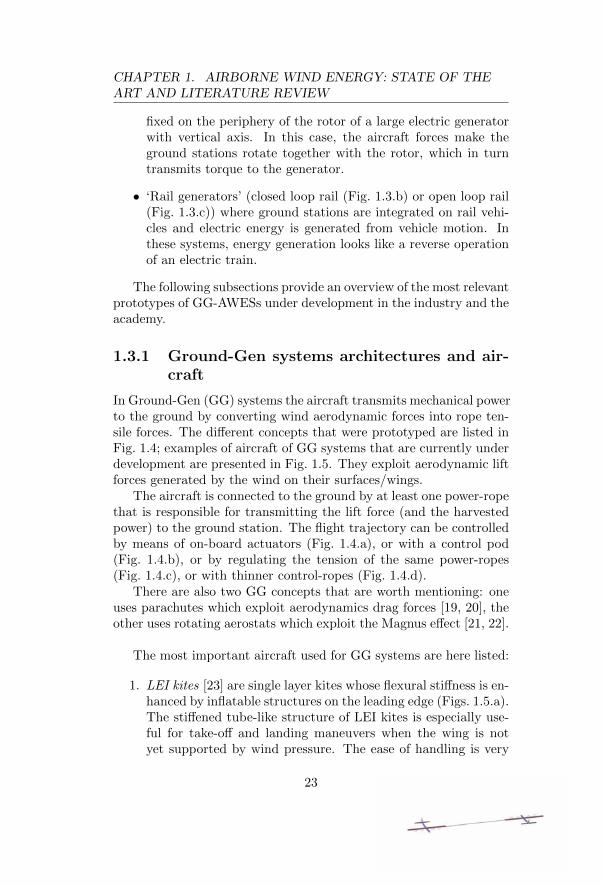
In Ground-Gen (GG) systems the aircraft transmits mechanical powerto the ground by converting wind aerodynamic forces into rope ten-sile forces. The different concepts that were prototyped are listed inFig. 1.4; examples of aircraft of GG systems that are currently underdevelopment are presented in Fig. 1.5. They exploit aerodynamic liftforces generated by the wind on their surfaces/wings.
The aircraft is connected to the ground by at least one power-ropethat is responsible for transmitting the lift force (and the harvestedpower) to the ground station. The flight trajectory can be controlledby means of on-board actuators (Fig. 1.4.a), or with a control pod(Fig. 1.4.b), or by regulating the tension of the same power-ropes(Fig. 1.4.c), or with thinner control-ropes (Fig. 1.4.d).
There are also two GG concepts that are worth mentioning: oneuses parachutes which exploit aerodynamics drag forces [19, 20], theother uses rotating aerostats which exploit the Magnus effect [21, 22].
The most important aircraft used for GG systems are here listed:
1. LEI kites [23] are single layer kites whose flexural stiffness is en-hanced by inflatable structures on the leading edge (Figs. 1.5.a).The stiffened tube-like structure of LEI kites is especially use-ful for take-off and landing maneuvers when the wing is notyet supported by wind pressure. The ease of handling is very
23

CHAPTER 1. AIRBORNE WIND ENERGY: STATE OF THEART AND LITERATURE REVIEW
Figure 1.4: Control layout of crosswind GG-AWESs. (a) with on-board controlactuators; (b) with flying control pod; (c) control through power ropes; (d) withadditional control rope.
Figure 1.5: Different types of aircraft in Ground-Gen systems. a) LEI Kite; c) FoilKite, design from Skysails; (d) Glider, design from Ampyx Power; e) Swept rigidwing, design from Enerkite; f) Semi-rigid wing, design from Kitegen.
24

CHAPTER 1. AIRBORNE WIND ENERGY: STATE OF THEART AND LITERATURE REVIEW
appreciated also during small-scale prototyping and subsystemtesting. However LEI kites have severe scalability issues as thetube diameter needs to be oversized in case of large wings.
2. Foil kites (also called ram-air kites) are derived from parafoils [24].These double-layer kites are made of canopy cells which runfrom the leading edge to the trailing edge (Figs. 1.5.c and 1.6.b).Cells (some or all) are open on the leading edge in a way thatthe air inflates all cells during the flight and gives the kite thenecessary stiffness. Bridles are grouped in different lines, fre-quently three: one central and two laterals. With respect toLEI kites, foil wings have a better aerodynamic efficiency de-spite the higher number of bridles and can be one order ofmagnitude larger in size.
Figure 1.6: Control of bridles tension. a) Control bridles are attached to theleading and trailing edges of a LEI kite; b) a control pod can be used to controlthe flight trajectory and angle of attack.
3. Delta kites are similar to hang glider wings. They are madeby a single layer of fabric material reinforced by a rigid frame.Compared with LEI or foil kites, this kind of aircraft has abetter aerodynamic efficiency which in turn results in a higherefficiency of wind power extraction (as discussed in section 1.6).On the other hand, their rigid frame has to resist to mechani-cal bending stresses which, in case of high aerodynamic forces,make it necessary to use thick and strong spars which increasethe aircraft weight, cost and minimum take-off wind speed.
Durability for fabric wings such as LEI, foil and delta kites,is an issue. Performance is compromised soon and lifetime isusually around several hundred hours [25].
25

CHAPTER 1. AIRBORNE WIND ENERGY: STATE OF THEART AND LITERATURE REVIEW
4. Gliders (Fig 1.5.d) can also be used as GG aircraft. Like deltakites, their wings are subject to bending moment during thetethered flight. Gliders, and more generally rigid wings, haveexcellent aerodynamic performance, although they are heavierand more expensive. Lifetime with regular maintenance is sev-eral decades.
5. Swept rigid wings are gliders without fuselage and tail con-trol surfaces (Fig 1.5.e). Flight stability is most likely achievedthanks to the bridle system and the sweep angle.
6. Semi-rigid wings are also under investigation by the Italiancompany Kitegen Research. They are composed of multipleshort rigid modules that are hinged to each other (Fig 1.5.f).The resulting structure is lighter than straight rigid wings andmore aerodynamically efficient and durable than fabric kites.
7. Special design kites. Kiteplanes [26] and Tensairity Kites [27]are projects developed by TUDelft (The Netherlands) and EMPA(Research Center for Synergetic Structures, ETH Zurich), thataim at increasing the aerodynamic efficiency of arch kites with-out using rigid spars.
1.3.2 Fixed-ground-station systems under devel-opment
This subsection provides a list of fixed-ground-station GG-AWESswhich are summarized in Figs. 1.7 and 1.10.
TU Delft
At Delft University of Technology, the first research in AirborneWind Energy was started by the former astronaut, Prof. Ockels,in 1996 [28]. A dedicated research group was initiated by Ockels in2004 with the aim to advance the technology to the prototype stage.
Delft University of Technology and Karlsruhe University of Ap-plied Sciences have initiated a joint project to continue the devel-opment and testing of a mobile 20 kW experimental pumping kitegenerator [29]. A main objective of this project is to improve the re-liability and robustness of the technology and to demonstrate in thenext months a continuous operation of 24 hours. At present, they
26

CHAPTER 1. AIRBORNE WIND ENERGY: STATE OF THEART AND LITERATURE REVIEW
use the third version of a special design LEI kite, co-developed withGenetrix / Martial Camblong, of 25 m2 wing surface area. Togetherwith an automatic launch setup [30], the wing demonstrated fullyautomatic operation of their 20 kW system in 2012 [29]. The TuDelft Spin-Off company ‘Kite Power’ (also known as Enevate B.V.)is now developing a 100 kW system in the framework of the REACHproject [31]. This prototype is based on a single tether and an air-borne control pod (Fig. 1.4.b) but they also control the angle of attackfor powering and depowering the wing during production and recov-ery phase, respectively. An automatic launch and retrieval systemfor 100 m2 LEI kites is also under development [32].
In the past, the research group tested several kinds of wings suchas foil kites and kiteplanes. TU Delft also tested an alternative devicefor controlling the kite: a cart-and-rail system attached to the tipsof a ram-air wing and used to shift the attachment point of the twobridle lines. By that system, the wing could be steered and depoweredwith a minimal investment of energy. Ultimately, the concept was toocomplex and too sensitive to deviations from nominal operation [33].
TU Delft is also the main reference point of the AWE academiccommunity by means of several publications and projects, the last ofwhich, the doctoral training network AWESCO, is now home to 14PhD students in Airborne Wind Energy [34].
Ampyx Power
The first company that developed a pumping glider generator is theDutch Ampyx Power [35, 36]. After several prototypes, they are cur-rently developing and testing two 5.5 m ‘PowerPlanes’ the AP-2A1and the AP-2A2 [37]. They are two officially registered aircraft thatare automatically controlled with state of the art avionics. They areconstructed with a carbon fiber body and a carbon backbone trusswhich houses onboard electronics with sensors and actuators. On-board actuators can drive a rudder, an elevator and four flaperons.One rope connects the glider to a single winch in the ground stationon the ground (Fig. 1.4.a). Ampyx Power is actually one of the fewcompanies which has already developed an AWES [38] that is able toautomatically perform the sequence of glider take-off, pumping cyclesand landing. Take-off maneuver sees the glider lying on the groundfacing the ground station at some meters of distance. As the winchstarts exerting traction force on the rope, the glider moves on the
27

CHAPTER 1. AIRBORNE WIND ENERGY: STATE OF THEART AND LITERATURE REVIEW
ground and, as soon as the lift forces exceed the weight forces, theglider takes off. They also installed a catapult for take-off and theyhave a propulsion system to climb up. The glider flight is fully au-tonomous during normal operations even though, for safety reasons,it can be occasionally controlled wirelessly from the ground thanksto a backup autopilot. The pumping cycles are similar to those ofa kite. Glider landing is similar to that of an airplane and is beingequipped with an arresting line so as to stop the glider in a right po-sition for a new take-off. During a test campaign in November 2012,the system demonstrated an average power production of 6 kW withpeaks of over 15 kW (earlier tests showed peak in power production of30 kW). Ampyx has started the design of its first commercial product:a 35 m wingspan AP-4 PowerPlane with a ‘wind turbine equivalent’power of 2 MW. The company now employs 45 people [38].
Kite Power Solutions
The UK company KPS was founded in 2011 and is now developinga ground-gen pumping kite generator. Similarly to TU Delft’s con-cept, their prototype uses a soft kite and a control pod. Their kitealso features embedded robotic actuation. The company recently re-ceived a joint 5 million GBP investment from three energy firms,E.on, Schlumberger and Shell. The start-up’s plan is to build one ofthe world’s first kite power stations using technology it believes couldgenerate hundreds of megawatts of energy by 2030 [39].
EnerKite
The German company EnerKite [40] developed a portable pumpingkite generator with rated continuous power of 30 kW. The groundstation is installed on a truck through a pivotal joint which allowsazimuthal rotations. EnerKite demonstrator uses mainly a foil kite,but a delta kite and a swept rigid wing are also under investigationand testing. The aircraft does not have on-board sensors and is con-trolled from the ground with three ropes according to the scheme ofFig. 1.4.d. EnerKite is now developing an autonomous launch andlanding system for semi-rigid wings [41]. The company plans to pro-duce a 100 kW and a 500 kW system [42].
28

CHAPTER 1. AIRBORNE WIND ENERGY: STATE OF THEART AND LITERATURE REVIEW
KiteGen Research
The company KiteGen Research (KGR) was one of the first to test aprototype of Ground-Gen AWES [43]. KGR technology is based on aC-Kite integrating on board electronics with sensor and is controlledby two power-ropes [44] from a control station on the ground [45](Fig. 1.4.c). The first prototype, named KSU1 (acronym for KiteSteering Unit) [44, 46] was successfully demonstrated in 2006. Af-ter a few years of tests, the company focused on the developmentof a new generator, named ‘KiteGen Stem’ [47]. In this system, theropes are wound on special winches [48] and are driven by a pulleysystem through a 20 m flexible rod called ‘stem’ to an arch-kite or asemi-rigid wing. The stem is linked to the top of the control stationthrough a pivot joint with horizontal axis. The most important func-tions of the stem are: (1) supporting and holding the kite and (2)damping peak forces in the rope that arise during wind-gusts. Theentire control station can make azimuthal rotations so the stem hastwo degrees of freedom relative to the ground. The ‘Stem’ conceptwas first patented in 2008 [49] and is now used by more and morecompanies and universities.
At the beginning of the take-off maneuvers, the kite is hangedupside down at the end of the stem. Once the kite has taken off, theproduction phase starts: the automatic control drives the kite actingon the two ropes, the kite makes a crosswind flight with ‘eight shape’paths; at the same time ropes are unwound causing the winches to ro-tate; the motor-generators transform mechanical power into electricpower. The company aims at retracting the cables with minimumenergy consumption thanks to a special maneuver called ‘side-slip’or ‘flagging’ [25]. Side-slip is a different flight mode where the kiteaerodynamic lift force is cleared by rewinding at first one rope be-fore the other, which makes the kite lose lift and ‘stall’ and then,once fully stalled, both ropes are rewound at the same speed andthe kite precipitates flying sideways. This maneuver can be donewith flexible foil kites or semi-rigid wings. In this phase, the powerabsorbed by motor-generators is given by rope rewind speed multi-plied by the resulting aerodynamic drag force of the side-slip flyingmode. This power consumption would be a small percentage of thepower produced in the production phase. After rewinding a certainlength of the ropes (less than the total rope length in order to exploitonly the highest winds) another special maneuver restores the gliding
29

CHAPTER 1. AIRBORNE WIND ENERGY: STATE OF THEART AND LITERATURE REVIEW
flight and the aerodynamic lift force on the kite. At this point onepumping cycle ends and a new production phase starts.
KGR patented and plans to develop special aerodynamic ropes [50]in order to increase their endurance and to increase system perfor-mances. KGR also plans to use the Kitegen Stem technology to pro-duce an offshore AWES [51] since offshore AWESs are very promis-ing [52, 9, 10].
Kitenergy
Another Italian company, Kitenergy, was founded by a former Kite-Gen partner and is also developing a similar concept by controllinga foil kite with two ropes [53, 54]. The prototype of the companyfeatures 60 kW of rated power [55]. Kitenergy submitted also a dif-ferent GG-AWES patent [56] that consists in a system based on asingle motor-generator which controls winding and unwinding of two(or more) cables and another actuator that introduce a differentialcontrol action of the employed cables. Another prototype developedby its co-founder, Lorenzo Fagiano, achieved four hours of consec-utive autonomous flight with no power production at University ofCalifornia at Santa Barbara in 2012 [57].
SkySails
The German company SkySails GmbH developed a wind propulsionsystem for cargo vessels based on kites [58]. A few years ago a newdivision of the company ‘SkySails Power’ has been created to de-velop GG-AWES [59] based on the technology used in SkySails vesselpropulsion system. Two products are under development: a mobileAWES having a capacity between 250 kW and 1 MW, and an off-shore AWES with a capacity from 1 to 3.5 MW. SkySails’ AWESis based on a foil kite controlled with one rope and a control pod(Fig. 1.4.b) which controls the lengths of kite bridles for steering thekite and changes its angle of attack [60]. Control pod power andcommunication with the ground station is provided via electric ca-bles embedded in the rope. SkySails also has a patented launch andrecovery system [61] designed for packing the kite in a storage com-partment. It is composed by a telescopic mast with a special deviceon its top that is able to grab, keep and release the central point ofthe kite leading edge. When the system is off, the mast is compactedin the storage compartment with the kite deflated. At the beginning
30

CHAPTER 1. AIRBORNE WIND ENERGY: STATE OF THEART AND LITERATURE REVIEW
of the launching operation, the mast extends out vertically bringingthe deflated kite some meters above the ground (or the sea level).The kite is then inflated to have appropriate shape and stiffness forthe production phase. Kite take-off exploits only the natural windlift force on the kite: the system at the top of the mast releases thekite leading edge, the pod starts to control the flight and the winchreleases the rope letting the kite reach the operating altitude. Whilethe energy production phase is similar to that of the KGR generator,SkySails has a different recovery phase. Specifically, SkySails useshigh speed winching during reel-in while the kite is kept at the edgeof the wind window. The kite is then winched directly against thewind without changing the kite angle of attack. Though it mightseem counter-intuitive at first, this kind of recovery phase has provento be competitive [62].
Unfortunately, in March 2016 SkySails GmbH had to file for in-solvency and it has now closed [63].
TwingTec
The Swiss company Twingtec is developing a 100 kW GG-AWES. Af-ter having tried several concepts including soft wings and rigid wings,the team is now tackling the problem of automating take-off and land-ing with the following concept: a glider with embedded rotors havingrotational axis perpendicular to the wing plane. The rotors are usedduring take-off and landing. The company plans to have the genera-tor and power conversion hardware inside a standard 20-foot shippingcontainer in order to easily target off-grid and remote markets. TheAWES will supply continuous and reliable electrical power thanks tothe integration with conventional diesel generators [64, 65].
Kitemill
Based in Norway, Kitemill started the development of a GG-AWES.The company already switched early on to a 1-cable rigid wing systemwith on-board actuators (Fig. 1.4.a) after having faced controllabilityand durability issues with soft materials [66], and most recently thecompany switched to a 1-cable rigid drone with vertical take-off ca-pabilities, similar to TwingTec’s concept. The company was recentlyfunded with 6.5 million Norwegian crowns.
31

CHAPTER 1. AIRBORNE WIND ENERGY: STATE OF THEART AND LITERATURE REVIEW
e-Kite
e-Kite was founded in 2013 in the Netherlands and developed a 50 kWGG-AWES (Fig. 1.4.c) based on a direct drive generator. After hav-ing investigated several layouts, the company is now focusing on a1-rope rigid wing with vertical take-off capabilities that will fly atlow altitude [67, 68].
Windlift
The US Company Windlift [69] has shifted from a concept similar tothat of Enerkite (Fig. 1.4.d) i.e. a 12 kW prototype with LEI kites,to a rigid wing with vertical take-off capabilities. They aim at sellingtheir product to the military and to off-grid locations.
eWind
eWind solutions is a US company that is developing an unconven-tional, low altitude, rigid wing GG-AWES [70]. The company wasrecently awarded a 600 k$ research grant from the US Departmentof Agriculture.
Skypull
SkyPull is a Swiss startup that is developing a ground-gen double-decker drone with vertical take-off capabilities, in between Joby’s andKiteMill’s concept [71]. SkyPull won the IMD startup competitionin 2016.
KU Leuven
KU Leuven has been actively doing research in AWESs since 2006.After significant theoretical contributions, the team developed a testbench to launch a tethered glider with a novel procedure [72]. Beforetake-off, the glider is held at the end of a rotating arm. When the armstarts rotating, the glider is brought to flying speed and the tetheris released allowing the glider to gain altitude. They are currentlydeveloping a larger experimental test set-up, 2 m long with a 10 kWwinch. The KU Leuven AWE team, lead by Prof. Moritz Diehl, hasrecently moved to University of Frieburg [73].
32

CHAPTER 1. AIRBORNE WIND ENERGY: STATE OF THEART AND LITERATURE REVIEW
SwissKitePower
SwissKitePower is a collaborative research and development projectstarted in Switzerland in 2009. It involves four laboratories of differ-ent Swiss universities: FHNW, EMPA (Swiss Federal Laboratoriesfor Materials Science and Technology), ETH (Federal Politechniqueof Zurich) and EPFL (Ecole Polytechnique Federale de Lausanne).The first prototypes, tested between 2009 and 2011, were based on aC-kite controlled by one rope and a control pod. The initial systemworked according to the scheme of Fig. 1.4.b, similarly to KitePowerand SkySails prototypes. In 2012, SwissKitePower developed a newground station with three winches that can be used to test kites with1, 2 or 3 lines [74]. They also test LEI kites and tensairity kites. Theproject ended in 2013 and since then FHNW is working in collabo-ration with the company TwingTec.
NASA Langley
At Langley Research Center, the US space agency NASA conducteda study about wind energy harvesting from airborne platforms afterwhich they developed an AWES demonstrator based on a kite con-trolled by two ropes and having a vision-based system and sensorslocated on the ground [75].
Others
In addition to the main prototypes listed above, there are severalother systems that have been built.
• Wind tunnel tests of small scale non-crosswind generation, andoutdoor crosswind generation tests with a LEI kite [76, 77] ofGIPSA-lab/CNRS, University of Grenoble.
• Kite control project [78] of CCNR at Sussex University, UK,
• Electricity from High Altitude Wind with Kites (EHAWK) project[79] of dept. of Mechanical Engineering of Rowan University,
• Kite powered water pump [80] of Worcester Polytechnic Insti-tute.
33

CHAPTER 1. AIRBORNE WIND ENERGY: STATE OF THEART AND LITERATURE REVIEW
1.3.3 Moving-ground-station systems under devel-opment
In addition to pumping systems, a number of AWES concepts withmoving-ground-station have been proposed. Their main advantageis the ability to produce energy continuously or nearly continuously.However, only a few companies are working on AWESs with moving-ground-station and there are more patents and studies than proto-types under development. This subsection provides a list of moving-ground-station GG-AWESs which are summarized in Figs. 1.7 and 1.10
KiteGen Research
The first moving-ground-station architecture which is based on a ver-tical axis generator has been proposed back in 2004 by Sequoia Au-tomation and acquired by KGR [81]. This AWES concept is basedon the architecture described in Fig. 1.3.a. During operations, liftforces are transmitted to a rotating frame inducing a torque aroundthe main vertical axis. Torque and rotation are converted into elec-tricity by the electric generator. This system can be seen as a verticalaxis wind turbine driven by forces which come from tethered aircraft.There is no prototype under development, but the concept has beenstudied in a simulation [18] showing that 100 kites with 500 m2 areacould generate 1000 MW of average power in a wind with speed of12 m/s. The considered generator would have a 1500 m radius, occu-pying a territory about 50 times smaller and costing about 30 timesless than a farm of wind turbines with the same nominal power.
NTS Energie
An alternative system based on ground stations that moves on closedtrack circuits is proposed by KGR [82] and by the German companyNTS Energie und Transportsysteme [83, 84]. Starting from Septem-ber 2011, NTS tested a prototype where 4-rope kites are controlledby a vehicle which moves on a 400 m flat-bed straight railway track.They are able to produce up to 1 kW per m2 of wing area and theytested kites up to 40 m2 [85]. The final product should have a closedloop railway where more vehicles run independently.
34

CHAPTER 1. AIRBORNE WIND ENERGY: STATE OF THEART AND LITERATURE REVIEW
Kitenergy
Another rail concept is proposed by Kitenergy [86] and it is basedon ideas published in 2004 in Drachen Foundation journal [87]. Theconcept is based on a straight linear rail fixed on the ground witha pivotal joint. The rail direction is then adjusted perpendicular tothe main direction of the wind. The ground station of the system ismounted on a wheeled vehicle which moves along the straight rail, un-der the kite traction forces, back and forth from one side to the other.The power is extracted from electromagnetic rotational generators onthe wheels of the vehicle or from linear electromagnetic generators onthe rail. The power production is not fully continuous because duringthe inversion of vehicle direction the power production will not onlydecrease to zero, but it could also be slightly negative. Neverthelessthe kite inversion maneuver could be theoretically performed withoutthe need of power consumption.
Laddermill
Although it cannot be considered a moving-ground-station device,it is important to mention that the first concept of continuous en-ergy production AWES was the Laddermill concept envisaged by theformer astronaut, Prof. Ockels in 1996 [28].
1.4 Fly-Gen Airborne Wind Energy Sys-tems
In Fly-Gen AWESs, electric energy is produced onboard of the air-craft during its flight and it is transmitted to the ground trough onespecial rope which integrates electric cables. Electrical energy conver-sion in FG-AWESs is achieved using one or more specially designedwind turbines.
A general classification of these systems is provided in this section.
1.4.1 Aircraft in Fly-Gen systems
Besides the general classification between crosswind and non-crosswindmode proposed in Fig. 1.10, FG-AWESs can also be distinguishedbasing on their flying principles that are:
35

CHAPTER 1. AIRBORNE WIND ENERGY: STATE OF THEART AND LITERATURE REVIEW
Figure 1.7: Groud-Gen AWESs. Summary of GG-AWESs.
36

CHAPTER 1. AIRBORNE WIND ENERGY: STATE OF THEART AND LITERATURE REVIEW
• Wings lift: achieved with a tethered flight of special gliders(Fig. 1.8.a) or frames with multiple wings (Fig. 1.8.b).
• Buoyancy and static lift: achieved with aerodynamically shapedaerostats filled with lighter-than-air gas (Fig. 1.8.c).
• Rotor thrust: achieved with the same turbines used for electri-cal power generation (Fig. 1.8.d).
Aircraft in Figs. 1.8.a and 1.8.b fly crosswind and harvest therelative wind, while those in Figs. 1.8.c and 1.8.d fly non-crosswindand harvest the absolute wind.
There is also one Fly-Gen (FG) concept that aims at exploitinghigh altitude wind energy not by using aerodynamic lift. It usesinstead a rotating aerostat which exploits the Magnus effect [88, 89].
Figure 1.8: Different types of aircraft in Fly-Gen systems. (a) Plane with fourturbines, design by Makani Power; (b) Aircraft composed by a frame of wings andturbines, design by Joby Energy; (c) Toroidal lifting aerostat with a wind turbinein the center, design by Altaeros Energies; (d) Static suspension quadrotor inautorotation, design by Sky WindPower.
37

CHAPTER 1. AIRBORNE WIND ENERGY: STATE OF THEART AND LITERATURE REVIEW
1.4.2 Fly-Gen systems under development
This subsection provides a list of FG-AWESs which are summarizedin Figs. 1.9 and 1.10.
Loyd’s first mechanical concept
One of the most famous and old idea of exploiting wind energy usingturbines on a kite, belongs to Loyd [7] who calculated that windturbines installed on a crosswind flying kite could be able to generateup to 5 times the power produced by equivalent turbines installed onthe ground. He also patented his idea in 1978 [90]. Loyd’s conceptforesees a reciprocating wind driven apparatus, similar to a multipropeller plane, with a plurality of ropes linking the aircraft to aground station.
Makani Power
After about twenty-five years from Loyd’s work, Makani Power Inc. [91]has started the development of its Airborne Wind Turbine (AWT)prototypes (as in Fig. 1.8.a). In nine years, Makani tested severalAWESs concepts including Ground-Gen, single rope, multiple rope,movable ground station on rails, soft wings and rigid wings [92]. Dur-ing these years, the company filed several patents where an electricand modern version of Loyd’s idea has been enriched with a tethertension sensor [93], an aerodynamic cable [94], a bimodal flight [95], aradiator to cool the motors [96], an electromechanical joint [97] thathas been invented to solve take-off and energy production issues. Inthe bimodal flight the AWT takes off with the wing plane in a verticalposition, driven by propellers thrust. This flight mode is similar toa quadcopter flight and rotors on AWT are used as engines. Onceall the rope length has been unwound, the AWT changes flight modebecoming a tethered flight airplane. In this second flight mode a cir-cular flight path is powered by the wind itself and rotors on AWT areused as generators [98] to convert power from the wind. During thisphase the cable length is fixed. In order to land, a new change of flightmode is performed, and the AWT lands as a quadcopter. Makani hasdeveloped and tested its 8 m, 20 kW demonstrator, called ‘Wing 7’that showed the capability of fully automatic operations and powerproduction. After these results, in early 2013 Makani was acquiredby Google. Makani is currently developing a 600 kW prototype, ‘the
38

CHAPTER 1. AIRBORNE WIND ENERGY: STATE OF THEART AND LITERATURE REVIEW
M600’. The M600 AWT has eight turbines, each with five propellerblades, and has a wingspan of 28 m. The prototype is now under-going testing [99]. After M600, Makani plans to produce an offshorecommercial version of AWT with a nominal power of 5 MW featuring6 turbines and a wingspan of 65 m.
Sant’Anna University
A novel fly-gen concept has recently been proposed by Scuola Superi-ore Sant’Anna of Pisa and University of Trento [100]. In this concepttwo fly-gen drones are tethered to each other at the wing-tip andfollow each other in a circular path. This concept will be thoroughlyexplained in Chapters 4 and 5 of this thesis.
Joby Energy
Founded in 2008, Joby Energy Inc. [101] is another US companywhich is developing a FG-AWES similar to Makani. The main differ-ence between Joby and Makani is that the tethered airborne vehicleis a multi-frame structure with embedded airfoils. Turbines are in-stalled in the joints of the frame (as in Fig. 1.8.b). In Joby’s concept,the system could be adapted to be assembled with modular compo-nents, constructed from multiple similar frames with turbines. Thepower generation method and the take-off and landing maneuvers aresimilar to those of Makani concept [102, 103]. Joby also patented anaerodynamic rope for its system [104]. Joby tested different smallscale prototypes.
Altaeros Energies
Another project based on flying wind turbines in a stationary posi-tion has been developed by Altaeros Energies, a Massachusetts-basedbusiness led by MIT and Harvard alumni [105, 106, 107]. In this case,instead of using wings lift to fly, they use a ring shaped aerostat witha wind turbine installed in its interior (as in Fig. 1.8.c). The wholegenerator is lighter than the air, so the take-off and landing maneu-vers are simplified, and the only remaining issue is the stabilizationof the generator in the right position relative to the wind [108]. Theaerostat is aerodynamically shaped so that the absolute wind gener-ates lift that helps keeping a high angle of altitude together with thebuoyancy force. After their energy production tests in 2012, Altaeros
39

CHAPTER 1. AIRBORNE WIND ENERGY: STATE OF THEART AND LITERATURE REVIEW
is additionally working on multiple rotor generators with differentlighter-than-air craft configurations.
Sky Windpower
Sky Windpower Inc. [109] proposed a different kind of tethered craftcalled Flying Electric Generator (FEG) (as in Fig. 1.8.d) which is sim-ilar to a large quadrotor with at least three identical rotors mountedon an airframe that is linked to a ground station with a rope havinginner electrical cables [110, 111, 112, 113]. Their concept was thefirst AWES to be tested in 1986 at University of Sidney [16, 114].Take-off and landing maneuvers are similar to those of Makani’s andJoby’s generators, but FEG operation as generator is different. Onceit reaches the operational altitude, the frame is inclined at an ad-justable controllable angle relative to the wind (up to 50 deg) andthe rotors switch the functioning mode from motor to generator. Atthis inclined position, the rotors receive from their lower side a pro-jection of the natural wind parallel to their axes. This projection ofwind allows autorotation, thus generating both electricity and thrust.Electricity flows to and from the FEG through the cable. Sky Wind-power tested two FEG prototypes. They claimed that a typical min-imum wind speed for autorotation and energy generation is around10 m/s at an operational altitude of 4600 m [115]. Unfortunately thecompany went out of business.
1.5 Crosswind flight: the key to large scaledeployment
One of the most important reasons why AWESs are so attractiveis their theoretical capability of achieving the megawatt scale witha single plant. For example in [16] a 34 MW plant is envisagedwith a tethered Airbus A380, and many other publications presenttheoretical analyses with MW scale AWESs [116, 7, 52, 117]. Thisscalability feature is rare in renewable energies and is the key tosuccessful commercial development.
With reference to the extraction principles explained in sections1.3 and 1.4, this section gives an introduction to the modelling ofcrosswind flight, the most used flight mode in AWE. Modelling theprinciple of crosswind flight is a first necessary step towards the
40

CHAPTER 1. AIRBORNE WIND ENERGY: STATE OF THEART AND LITERATURE REVIEW
Figure 1.9: Fly-Gen AWESs. Summary of FG-AWESs.
Figure 1.10: Classification of AWESs. The different AWESs concepts are listedhere as explained in section 1.2.
41

CHAPTER 1. AIRBORNE WIND ENERGY: STATE OF THEART AND LITERATURE REVIEW
understanding of AWESs and their potential. A well known basicmodel is explained for the case of Ground-Gen and Fly-Gen cross-wind AWESs.
Only crosswind generation is analyzed because it was demon-strated that it can provide a power one or two orders of magnitudehigher than non-crosswind generation [7]. AWESs concepts that ex-ploit crosswind power have therefore a strong competitive advantageover non-crosswind concepts in terms of available power and, there-fore, in the economics of the whole system.
1.5.1 Crosswind GG-AWESs
This section explains how to compute the power output of a fixed-ground-station crosswind GG-AWES (Fig. 1.1.a) during the reel-outphase (Fig. 1.2.a). As already introduced in section 1.3, in GG-AWESs, the recovery phase (Fig. 1.2.b) represents an important fac-tor in the computation of the average power output but, for simplic-ity, it is not considered in the following model. The expression ofthe maximum power, P , for crosswind Ground-Gen AWESs can bederived following the analytical optimization on the reel-out speedfrom [7] with the integrations from [118] and [119]. The hypothesesare: high equivalent aerodynamic efficiency, steady-state crosswindflight at zero azimuth angle from the wind direction, negligible iner-tia and gravity loads with respect to the aerodynamic forces.
With reference to Fig. 1.11, the velocities are sketched in blueand the forces are sketched in red. The velocity triangle at the kite iscomposed by the three components Vk, Va and V ∗w : the aircraft speed,the apparent wind speed at the aircraft and the wind speed felt bythe aircraft, respectively. Vr is the reel-out velocity (i.e. the velocityof the cable in the direction of its own axis) and Vw is the actualwind speed. V ∗w is defined as V ∗w = Vw cos θ− Vr where θ is the anglebetween tether and wind direction (that corresponds to the angle ofaltitude in case of horizontal wind speed and aircraft at zero azimuth).Tk is the tether tension, L is the wing lifting force, D is the drag force(i.e. the drag force of the aircraft Dw plus the equivalent cable dragforce Dce). Notice that the velocity triangle and the force triangle aresimilar because of the force equilibrium at the aircraft, and thereforeVk = V ∗w G, where G is the equivalent aerodynamic efficiency [118],G = L/D that is further explained in Eq. 1.2. Assuming Va ∼= Vk(valid thanks to the hypothesis of high aerodynamic efficiency) and
42

CHAPTER 1. AIRBORNE WIND ENERGY: STATE OF THEART AND LITERATURE REVIEW
Figure 1.11: Basic crosswind model. A simple and well known model for assessingthe power output of a crosswind Ground-Gen AWES [7, 118, 119].
43

CHAPTER 1. AIRBORNE WIND ENERGY: STATE OF THEART AND LITERATURE REVIEW
imposing the equilibrium at the aircraft, the tether tension is Tk =12ρV
∗w2G2CLA, where ρ is the air density. The power output can
then be computed as Pk = TkVr = 12ρ(Vw cos θ − Vr)
2VrG2CLA.
This expression can be optimized [7] in order to choose the reel-outspeed that maximizes the power output, by setting dPk/dVr = 0.This simple optimization leads to the choice of optimal reel-out speedVro = 1/3 Vw cos θ, and to the optimal power output, P
P =1
2ρ(Vw cos θ)3
4
27G2CLA (1.1)
where A is the area of the kite and G is the equivalent aerodynamicefficiency, that is:
G =L
D=
CLCDw
+ CDce
(1.2)
where CL and CDware the wing lift and drag coefficients and CDce
is equivalent cable drag coefficient. The expression of CDcecan be
computed by equating the energy dissipated by the distributed cabledrag force to the energy that would be dissipated by a concentratedequivalent drag force located at the top end of the cable. This leads to∫ r0nDc(x)Vc(x) dx = DceVk where n is the number of cables, r is the
length of each cable, Vc(x) is the velocity in every point of the cable,Vc = Vk x/r, and Dc is the distributed cable drag, Dc = 1
2ρV2c dC⊥
where d is the cable diameter and C⊥ is the perpendicular cable dragcoefficient. The expression for the equivalent cable drag coefficient istherefore:
CDce=
12ρV
2k
14C⊥nrd
12ρV
2k A
=C⊥nrd
4A(1.3)
1.5.2 Crosswind FG-AWESs
This section explains how to compute the power output of a cross-wind FG-AWES (Fig. 1.1.b) during the generation phase. As alreadyintroduced in section 1.4, unlike crosswind GG-AWESs, crosswindFG-AWESs have the advantage of being able to produce power with-out the need of a duty cycle for the recovery phase.
Similarly to what has already been done in section 1.5.1, the ex-pression of the available crosswind power, P , for Fly-Gen AWESscan be derived following the analytical optimization on the flyinggenerator drag from [7] with the integrations from [118] and [119].
44

CHAPTER 1. AIRBORNE WIND ENERGY: STATE OF THEART AND LITERATURE REVIEW
Figure 1.12: Basic crosswind model. A simple and well known model for assessingthe power output of a crosswind Fly-Gen AWES [7, 118, 119].
With reference to Fig. 1.12, using the assumptions and the sym-bols defined in section 1.5.1, it is possible to compute the maximumpower, P , for crosswind Fly-Gen AWESs by combining three expres-sions: the drag force from the flying generators Dg = 1
2ρV2a CDg
A,the apparent wind velocity Va = (Vw cos θ)CL/(CD + CDg
) whereCD = CDw + CDce , and the generators power Pg = DgVa. There-fore Pg = 1
2ρV3wA(C3
LCDg )/(CD + CDg )3. A simple optimizationdPg/dCDg
= 0 leads to the maximum value of power:
P =1
2ρ(Vw cos θ)3
4
27G2CLA (1.4)
that is the same of the Ground-Gen case and occurs when the dragof the flying generators is chosen to be CDg = CD/2. It is worthnoticing that the maximum power expressed in Eq. 1.4 does not takeinto account the conservation of momentum and a more rigorousprocedure would yield a slightly lower value of P [120]. However,Eq. 1.4 correctly defines the upper bound for the maximum powerand is useful for first assessments.
45

CHAPTER 1. AIRBORNE WIND ENERGY: STATE OF THEART AND LITERATURE REVIEW
1.6 Discussion
This section provides a brief discussion on some techno-economic is-sues and topics that are considered relevant with respect to the cur-rent development, trends, and future roadmap of AWESs.
1.6.1 Effect of flying mass
In all AWESs, increasing the flying mass decreases the tension of thecables. Since Ground-Gen systems rely on cable tension to gener-ate electricity, a higher mass of the aircraft and/or cables decreasesthe energy production [119] and should not be neglected when mod-elling [121]. On the contrary, increasing the flying mass in Fly-Gensystems does not affect the energy production even though it stillreduces the tension of the cable. Indeed, as a first approximation,the basic equations of Fly-Gen power production do not change ifthe aircraft/cable mass is included and this is also supported by ex-perimental data [120].
1.6.2 Rigid vs Soft Wings
A question faced by many companies and research groups is whetherrigid wings are better or worse than soft wings. On the plus sidefor soft wings there are: crash-free tests and lower weight (there-fore higher power) because of the inherent tensile structure. Con-versely, rigid wings have better aerodynamic efficiency (thereforehigher power) and they do not share the durability issues of softwings mentioned in section 1.3. It is unclear whether one of the twosolutions will win over the other, but a trend is clearly visible inthe AWE community: even though a lot of academic research is stillbeing carried out on soft wings [34], more and more companies areswitching from soft to rigid wings [122] (see Fig. 1.10).
1.6.3 Take-off and landing challenge
Starting and stopping energy production requires special take-off andlanding maneuvers as explained in sections 1.3 and 1.4. These arethe most difficult to automate and are requiring a lot of research inprivate companies and academic laboratories [32, 40, 72].
46

CHAPTER 1. AIRBORNE WIND ENERGY: STATE OF THEART AND LITERATURE REVIEW
1.6.4 Optimal altitude
Another interesting question is how much is the optimal flight alti-tude, i.e. how much are the optimal cable length and elevation anglethat maximize the power output. Increasing the altitude allows toreach more powerful winds, but, at the same time, increasing the ca-ble length or the elevation angle reduces the power output accordingto Eqs. 1.1-1.4. Considering a standard wind shear profile, the op-timal flight altitude is found to be the minimum that is practicallyachievable [120, 123]. However, results greatly change depending onthe hypotheses and, for example, a reduction in cables drag mightlead to optimal flight altitudes around 1000 meters [123]. More de-tailed and location-specific analyses could be therefore useful to de-fine an optimal flight altitude. Nowadays, many AWE companies areaiming at exploiting low altitude winds with the minimum flight al-titude set by safety concerns. Only a few companies and academicinstitutions are still trying to reach high altitudes.
1.6.5 Angle of attack control
As shown in Eq. 1.1, the aerodynamics of the system is very importantto the power production. A first aerodynamic design should maximizethe value G2CL.
A bridle system might be used to fix an incidence angle so thatG2CL is fixed at an optimal angle of attack. But it is easy to showthat an active control of the angle of attack is essential during theproduction phase of Ground-Gen or Fly-Gen devices.
A variation of the angle of attack can be induced by a change inthe tether sag or in the velocity triangle. As for the tether sag, itis possible to compute the variation of the nominal angle of attackthanks to the model provided in [124]. Depending on the value of thedesign parameters, the model would give a numerical value between7 deg and 11 deg for a large scale AWES. As regards the velocitytriangle, assuming controlled constant tether force (a common con-straint in a real power curve [120, 33]) and computing the effect ofa different absolute wind speed on the angle of attack with a sim-ple velocity triangle, a variation of about 3.5 deg or 4 deg can bereasonably obtained.
Such variations of the angle of attack can decrease substantiallythe power output or even make the flight impossible. For example,using the values of the aerodynamic coefficients for an airfoil specifi-
47

CHAPTER 1. AIRBORNE WIND ENERGY: STATE OF THEART AND LITERATURE REVIEW
cally optimized for AWESs [125], a steady state variation in the angleof attack of just ±2 deg can lead to a decrease in power output be-tween 5% and 42% with respect to the optimal angle of attack. Realtime control of the angle of attack in current AWESs prototypes fromAmpyx and Makani [36, 120] limits the angle of attack variation to±2 deg in a real flight time history.
1.6.6 Cables
Cables for AWESs are usually made of Ultra High Molecular WeightPolyethylene (UHMWPE), a relatively low-cost material with excel-lent mechanical properties [126] even though many different materialsare being used and studied [127]. The cables can be 1, 2 or 3 and insome concepts they carry electricity for power generation or just foron-board actuation. Each of these choices has advantages and dis-advantages, and, at the present time, any prediction about the besttethering system would be highly speculative. The tethers also rep-resent a known issue in the AWE community [128] because of wear,maintenance and aerodynamic drag.
Polynomial curvature
It is worth noticing that section 1.5 describes a steady state flightwith straight cables under known tension, but for very long cablesthis model is not accurate. For example, removing the straight cablehypothesis gives a fourth order polynomial shape function [124] forcables in steady state flight. The curvature is acceptable for shortround cables (C⊥ = 1 and r up to 1 km), while it is highly undesir-able with extremely long round cables (e.g. r = 10 km). Reducingthe cable aerodynamic drag to 0.2 allows reasonable curvatures withlengths of several kilometers (e.g. r = 5 km).
Unsteady analysis
Very long cables should be studied removing also the steady statehypothesis in order to consider the fact that, in unsteady flight, thelower part of the cables could reasonably move less than in steadystate flight, thus dissipating less energy.
48

CHAPTER 1. AIRBORNE WIND ENERGY: STATE OF THEART AND LITERATURE REVIEW
Tethers electrostatic behavior
Some concerns have been raised regarding the behavior of tethersin atmospheric environment [129]. An analysis performed on dryand wet polyethylene ropes without inner conductors [19] shows thatnon-conductive tethers will not trigger a flashover in typical staticelectric fields of thunder clouds, however non-conductive tethers arevery likely to trigger a flashover when subjected to impulsive electricfields produced by lightnings. It is reasonable to say that AWESs willnot work during thunderstorms and that lightnings should not be anissue. However, an analysis regarding the electrical atmospheric be-havior of tethers with inner conductors could be useful to understandthe worst atmospheric conditions to which conductive tethers mightbe exposed.
Aerodynamic drag opportunities
A reduction in the cable drag coefficient would likely lead to anincrease in power output by two or three times thanks to betteraerodynamic efficiency, increased flight speed and higher operationalaltitude [123]. Several patents have been filed to address this is-sue [94, 104, 50] even though the reduction of cable drag by meansof e.g. fairing or streamlined cross-sections has not been experimen-tally demonstrated yet. Because of the potential advantages, fundingopportunities might be available for concepts in aerodynamic dragreduction [130].
Nearly zero cable drag
As regards the aerodynamic cable drag, two patented concepts mightprovide an important improvement in the long term by setting tozero the aerodynamic drag for the majority of the length. Theyare worth being mentioned even though no prototype already existsfor both of them. The first appeared in the very first patent abouthigh altitude wind energy in 1976 [131] and described the so called‘dancing planes’ concepts. Two Fly-Gen turbines are held by a singlecable, the top part of which splits into two. Each turbine is tetheredto one of these ends and follows a circular trajectory so that onlythe two top parts of the cable fly crosswind through the air and themain single cable stands still under balanced tensions. Several studiesalready exist for this promising concept [132, 133]. The second [134]
49

CHAPTER 1. AIRBORNE WIND ENERGY: STATE OF THEART AND LITERATURE REVIEW
describes a ‘multi-tether’ AWES where three cables are deployed fromthree different ground stations and are eventually connected to eachother in their top end. A single tether connects the top end of thethree cables to one kite that is then geometrically free to fly crosswindwithin a certain solid angle without moving the three lower cables butonly changing their inner tension. The further the ground stationsare spaced apart, the larger is the allowable solid angle. For both ofthese concepts the result is the same: high altitude crosswind flight isachieved with the longest part of the cables completely fixed in space,thus allowing to reach winds at very high altitude with a relativelyshort dissipative cable length.
1.6.7 Business opportunities
To date, several tens of millions dollars have been spent for the de-velopment of AWESs, which is a relatively low amount of money,especially if one considers the scale of the potential market and thephysical fundamentals of AWE technology. The major financial con-tributions came, so far, by big companies usually involved in theenergy market [130]. The community is growing both in terms ofpatents and in terms of scientific research [135]. But still, there isno product to sell and the majority of the companies that are tryingto find a market fit are now focusing on off-grid markets and remotelocations where satisfying a market need can be easier at first [122].
1.7 Conclusions
High altitude wind energy is currently a very promising resourcefor the sustainable production of electrical energy. The amount ofpower and the large availability of winds that blow between 300 and10000 meters from the ground suggest that AWESs represent an im-portant emerging renewable energy technology. In the last decade,several companies entered in the business of AWESs, patenting di-verse principles and technical solutions for their implementation. Inthis extremely various scenario, this chapter attempts to give a pic-ture of the current status of the developed technologies in terms ofdifferent concepts, systems and trends. In particular, all existingAWESs have been briefly presented and classified. The basic gener-ation principles have been explained, together with very basic theo-retical estimations of power production that could provide the reader
50

CHAPTER 1. AIRBORNE WIND ENERGY: STATE OF THEART AND LITERATURE REVIEW
with a perception on which and how crucial parameters influence theperformance of an AWES. In the next years, a rapid acceleration ofresearch and development is expected in the airborne wind energysector. Several prototypes that are currently under investigation willbe completed and tested.
51

CHAPTER 1. AIRBORNE WIND ENERGY: STATE OF THEART AND LITERATURE REVIEW
52

Chapter 2
Simplified model ofoffshore airborne windenergy converters
As introduced in Chapter 1, at several thousand meters above sealevel, jet streams currents can reach power densities as high as 15 kW/m2
(i. e. from 50 to 100 times more powerful than at 100 m altitude) withtypical availability of more than 30%.
AWESs appear exceptionally promising from the point of viewof: 1) increased power production, because of the high power densityand high capacity factors and 2) reduced structural mass (10 to 50times lighter than conventional wind turbines), thanks to the tensileloading conditions.
On the downside, current AWESs require large airspace, they canraise safety issues, and might face NIMBY effect. For these rea-sons, deep-offshore floating AWESs may take advantage of both thelightweight design of AWESs and the huge availability of low-costsites for the installation of floating structures. This chapter presentsa preliminary investigation on the feasibility and on fundamental de-sign issues of offshore AWESs. The dynamics of an offshore floatingAWES has been investigated with a model that couples the aircraftsteady state crosswind model with 1 degree of freedom hydrodynam-ics of a floating platform held in place by a catenary mooring line.The possibility of extracting combined wind-wave power has been
53

CHAPTER 2. SIMPLIFIED MODEL OF OFFSHOREAIRBORNE WIND ENERGY CONVERTERS
investigated.Section 2.1 is an introduction to modelling of offshore AWESs.
Section 2.2 introduces a simple dynamic model for an offshore pump-ing AWES with catenary mooring. In Section 2.3, a case study isanalysed in order to address first design issues and to estimate theadvantage that an offshore AWES could obtain by exploiting theavailable wave energy in addition to that of wind.
2.1 Offshore AWES
The study and development of offshore AWESs combine differentfields of engineering. They are composed of a flying wing (or kite)linked with a tether to a floating platform, which in turn is anchoredto the seabed by a mooring system as shown in Fig. 2.1. All thesesubsystems involve complex dynamics and can be studied with dif-ferent degrees of accuracy.
Figure 2.1: Schematic layout of an offshore Airborne Wind Energy ConverterThe four subsystems composing an offshore AWES are shown, i.e. wing, tether,floating platform and mooring system. The forces transmitted among the chainof components are indicated in the block diagram.
54

CHAPTER 2. SIMPLIFIED MODEL OF OFFSHOREAIRBORNE WIND ENERGY CONVERTERS
Depending on where the generators are placed, two types of AWESscan be envisioned:
• ‘Float-gen’ (floating equivalent of ground-gen) in case the gen-erators are placed on the floating platform.
• ‘Fly-gen’ in case the generators are placed on board the wing.
In float-gen systems, the generation type is traction based and theaircraft performs the pumping cycle. Electricity is generated duringthe reel-out phase of the cycle when the aircraft generates significantpull and the cables are reeled out from the drums on which they arewound. Then comes the reel-in phase in which the aircraft is con-trolled in order to generate less tension and the cables are reeled backin. Reeling-in of cables is achieved with the aircraft in a depoweredconfiguration. For current experimental systems, the reel-in phaserequires nearly one third of the power produced during the reel-outphase [62, 136] but there are several concepts that aim at reducingsubstantially this power requirement [137].
On the other hand, fly-gen systems extract electricity from onboard wind turbines which rotate fast and continuously. With respectto float-gen systems, they can have higher global electrical efficienciesand 100% duty-cycle efficiency (they are not subjected to reel-outreel-in cycles). However, the transmission of electricity from the wingto the floating platform adds a lot more complexity and requireslarger-sized cables, thus increasing the aerodynamic drag, which hasa detrimental effect on crosswind power output [16]. In this workfloat-gen systems are analysed.
The aerodynamics of the AWES can be investigated through dif-ferent models; for example it can be described by a simple algebraicformula for quick power assessment [119], or can be modelled with afirst order non linear dynamic system for controller design [138], orcan be thoroughly simulated to investigate how a kite deforms duringflight manoeuvres [139]. Also the cable dynamics can be taken intoaccount when modelling the aircraft forces [140, 124].
In order to model the displacement of the floating platform andto estimate its effect on the energy production, it is necessary toinvestigate the hydrodynamics of the system. The hydrodynamics offloating bodies involve highly non-linear phenomena and turbulentflows. Reasonable predictions and simulations can be obtained bymeans of computationally intensive Computational Fluid Dynamic
55

CHAPTER 2. SIMPLIFIED MODEL OF OFFSHOREAIRBORNE WIND ENERGY CONVERTERS
(CFD) analyses. However, several simplified methods are commonlyemployed in marine engineering to efficiently perform preliminarydesign iterations [141, 142, 143].
The mooring system cannot be neglected when modelling an off-shore AWES, even though it is only needed to hold the generator inplace. Several kinds of mooring systems are available and extensiveliterature, patents and regulations exist for oil drilling platforms andnaval engineering [144, 145]. Mooring systems are known to be dif-ficult to model due to their inherent non-linearity and sophisticatedfluid structure interaction. For example, simple slack mooring sys-tems have a non linear stiffness that changes significantly with theapplied load and other design criteria [146]. In offshore oil platforms,their dynamics are usually deemed to be negligible for non-extremeevents. However, it is important to notice that mooring equipmentcould be the most costly subsystem of a floating platform and couldaffect substantially the global business plan [147].
In this chapter, a preliminary study of offshore AWESs is per-formed thanks to a simplified model with minimum complexity thatallows analysis of the coupling of two main systems, namely a mooredfloating platform and an airborne device. This model has the impor-tant advantage of being computationally fast and easy to use. It istherefore suitable for qualitative analyses and first design iterations.In particular, the next section proposes a model of a 1 Degree ofFreedom (DoF) heaving platform coupled with a steady state aero-dynamic model of a generic wing flying in the crosswind direction.
The study only focuses on an AWES in operational conditions,during energy production phase. Although relevant, other aspectsand operating modes, such as launching/landing/emergency manoeu-vres, optimal control, etc. are not discussed [8].
2.2 Model
This section describes the simple model shown in Fig. 2.1 that hasbeen taken as reference for the numerical study provided in the fol-lowing section.
56

CHAPTER 2. SIMPLIFIED MODEL OF OFFSHOREAIRBORNE WIND ENERGY CONVERTERS
2.2.1 Hydrodynamic model
The offshore floating platform is modelled as a heaving rigid bodyhaving only 1 DoF. This approximation, often assumed in the prelim-inary design phases of buoy-like Wave Energy Converters (WECs) [148],limits the capability and accuracy of the model. However, this ap-proach is very useful to provide a first (quick) insight into the globalbehaviour of the floating dynamic system.
Figure 2.2: Model of the floating platform. The offshore platform is modelled asa heaving floating rigid body having only 1 DoF. The horizontal components ofthe mooring force Tm and the aircraft force Tk are equal.
The forces acting on the system are shown in Fig. 2.2. Underthese assumptions, the vertical equilibrium of the platform yields
Mz(t) = fh(t) + fg + fm(t) + fk(t) (2.1)
where z is the heaving coordinate and M is the nominal mass, i.e.the actual mass of the floating platform. On the right-hand side ofthe equation, there are the time-varying forces acting on the platform:fh are the hydrodynamic forces on the hull, fg is the gravity force,fm and fk are respectively the contributions of the traction forces ofthe mooring system and of the tethered aircraft.
Platform
The hydrodynamic force fh represents the vertical component of theresultant of pressure and shear forces on the wet surface of the hull.It is generally calculated through an integral equation which is not
57

CHAPTER 2. SIMPLIFIED MODEL OF OFFSHOREAIRBORNE WIND ENERGY CONVERTERS
easy to compute and several methods exist for its evaluation, suchas CFD, analytical models or experimental measures. However, as-suming inviscid and irrotational fluids subjected to small amplitudewave fields, linear wave theory can be applied to provide a reason-able estimate that is valid in non-extreme events. In particular, thehydrodynamic force on the hull can be described as the sum of threeterms [149, 150]:
fh(t) = fb(t) + fr(t) + fe(t) (2.2)
where
fb(t) = − kbz(t)− fb0
fr(t) = − M∞z −∫ t
0
kr (t− τ) z (τ) dτ
fe(t) =
n∑i=1
Fwi sin (ωit+ φi) .
(2.3)
In Eq. 2.2, fb is the buoyancy force and it is composed by a con-stant term fb0 plus an elastic contribution with stiffness kb. fr isthe radiation force that takes into account the the kinetic and dissi-pative contributions of the motion of the water particles induced bythe platform oscillations. It comprises an inertial contribution withconstant mass, M∞, plus a convolution integral term which dependson the past oscillations of the platform. The function kr (t− τ) iscalled the ‘memory kernel’, or radiation impulse response function.In particular, kr is zero when its argument is lower than zero in sucha way so as to weight only the present and past values of the heavevelocity in the convolution operation. fe is the excitation force andmodels the forces that are exerted on a fixed body by the waves. Inthe most general case of irregular sea, fe is expressed as a Fourierseries where ωi are the frequencies of the waves, while Fwi and φi arethe amplitudes and phases of the wave forces. As shown by Eqs. 2.1and 2.2, the constant terms fb0 and fg can be balanced if a properchoice of the heave coordinate z is made.
Mooring
The mooring system is difficult to model and its effect on the dy-namics of the floating platform significantly depends on the designcriteria. The mooring system chosen in this analysis is composed by
58

CHAPTER 2. SIMPLIFIED MODEL OF OFFSHOREAIRBORNE WIND ENERGY CONVERTERS
a single catenary line with a gravity anchor because of its simplicityand suitability for WECs [145]. Assuming, as above, linear wave the-ory, the catenary line dynamics are reduced to an equivalent mass,damping and stiffness, which are then added to the platform equationof motion as described in [151].
The expression for the mooring force is
fm = − Mmz − Bmz − kmz (2.4)
where Mm, Bm, km are the mooring linearised coefficients: equiva-lent mass, damping and stiffness respectively. Mm is not simply thenominal mooring mass, but includes also the added mass of waterdisplaced by the mooring line and takes into account the fact thatthe mooring line does not move uniformly along its length.
2.2.2 Aerodynamic model
The aircraft model that is assumed in this chapter is based on thework done in [7]. In addition, we have also taken into account theangle of altitude θ (see Fig. 2.3) and the effects of the cables aero-dynamic drag as in [119] and [118], respectively. In short, the basicassumptions are:
• flight at constant altitude θ and zero azimuth angle with respectto the wind direction1;
• negligible inertia and gravity forces of the aircraft with respectto the aerodynamic loads;
• high equivalent aerodynamic efficiency;
• therefore, steady state flight in crosswind direction is assumed.
These approximations are typically adopted in the literature ofAWESs and are commonly used for first design iterations, even thoughexperimental validations are challenging and the results are scat-tered [120]. This first model allows fast analytical computations andis therefore very useful for our preliminary assessment of offshoreAWESs.
1Notice that this last hypothesis defines a theoretical horizontal flight whichdescribes only the instant of time when the aircraft crosses the zero azimuth.In order to imagine an equivalent more realistic flight path that satisfies thisrequirement, one should think to a semi-circular flight path around the winddirection such that the angular distance of the aircraft from the wind directionis kept constant. A good definition of such distance is given in [138].
59

CHAPTER 2. SIMPLIFIED MODEL OF OFFSHOREAIRBORNE WIND ENERGY CONVERTERS
Figure 2.3: AWES aerodynamic model The balloon shows the aerodynamic equi-librium at the kite in the tether reference system.
With reference to Fig. 2.3, it is possible to derive the equationsthat govern the aircraft dynamics.
In particular, assuming the following notation: Vk is the absoluteaircraft speed, Va is the apparent wind speed, Vw is the actual windspeed, Vc is the velocity of the cable in the direction its own axis,Tk is the tether traction force, L is the aircraft lift force, Deq isthe equivalent drag force (i.e the drag force of the aircraft plus theequivalent cable drag force acting on the aircraft), and V ∗w is the windspeed felt by the aircraft defined as
V ∗w = Vw cos θ − Vc. (2.5)
Notice that, with reference to Fig. 2.3, the force equilibrium atthe aircraft makes the velocity triangle and the force triangle similar,thus yielding
Vk = EeqV∗w . (2.6)
The equivalent aerodynamic efficiency takes account of the ca-bles aerodynamic drag and can be derived by computing the energydissipated by the distributed cable drag and reads as
Eeq =CL
CD + C⊥ncrcdc4A
=L
Deq(2.7)
60

CHAPTER 2. SIMPLIFIED MODEL OF OFFSHOREAIRBORNE WIND ENERGY CONVERTERS
where CL ans CD are the lift and drag coefficients of the aircraft,C⊥ is the drag coefficient of the cable with respect to a flow perpen-dicular to its axis, nc is the number of cables, rc is the length of eachcable, dc is the cable diameter, A is the area of the aircraft, the samearea to which CL and CD are referred.
Assuming Va ∼= Vk (valid for a wing with high aerodynamic effi-ciency) and imposing the equilibrium of the aircraft, it is then possibleto calculate the traction force as
Tk =1
2ρaV
∗w2E2
eqCLA. (2.8)
2.2.3 Integrated model
In an offshore AWES, the platform and the aircraft model are cou-pled. More specifically, the cable speed Vc is given by the sum of twovelocities
Vc = Vr + z sin θ (2.9)
where Vr, is the cables reel-out velocity as seen by the floatingplatform. Notice that it is assumed that the motion of the platformwill have an impact on the aircraft traction force only if the altitude θis greater than zero. Moreover, since the cables length is much largerthan the platform oscillations, the motion of the platform is alwaysassumed to have no impact on the altitude θ.
Under this hypothesis, the equations that describe the behaviourthe 1 DoF offshore AWES read as
(M +M∞ +Mm) z +
∫ t
0
kr (t− τ) z (τ) dτ + Bmz + (kb + km) z
=n∑
i=1
Fwi sin (ωit+ φi) + Tk sin θ
(2.10)
Vr = Vw cos θ − z sin θ −√
Tk12ρaE
2eqCLA
(2.11)
P = TkVr (2.12)
Eq. 2.10 is the platform equation that defines the vertical motionof the floating structure. Eq. 2.11 is the winch equation that couples
61

CHAPTER 2. SIMPLIFIED MODEL OF OFFSHOREAIRBORNE WIND ENERGY CONVERTERS
the platform dynamics with the kite model and defines the cables reelout velocity as seen by the winches. It is given by the combinationof equations 2.5, 2.8 and 2.9. Eq. 2.12 is the power equation thatdefines the instantaneous available power to the alternators, P asthe product between the tether tension, Tk, and the cables reel-outvelocity as seen by a reference system that is fixed on the platform, Vr.
2.2.4 Control
The tether force, Tk, can be controlled thanks to the drums reelingvelocity Vr. For example, if the cables are reeling-in, the wind speedfelt by the aircraft V ∗w increases, thus increasing the flight speed andthe aerodynamic lift. It is easy to understand that a controller candecouple the buoy from the aircraft by imposing an appropriate ve-locity to the drums in order to cancel the effect of the buoy motionon the cable speed Vc.
However, it also is possible to envisage a more complex controllerthat makes it possible to harvest energy, not only from wind, but alsofrom waves without any changes in system architecture. Specifically,a suitable control on the force Tk can be conceived in order to exertan oscillating force on the platform and to extract energy from wavesby damping its heaving motion. In order to assess this potentialimprovement in the power output, the average combined wind-wavepower output of the floating AWES has to be computed. In thefollowing, before analysing the case of combined wind-wave power,the formulations for estimating the maximum wind-only and wave-only power extraction are provided.
Wind-only optimal power output
For the well known case of a ground based pumping AWES, Eqs. 2.11and 2.12 can be simplified by fixing the heave coordinate, z(t)=0.
The optimal reel out speed is known to be Vr0 = 1/3 Vw cos θ [7].In such a case, the optimal aircraft tether force of Eq. 2.8 is constant:
Tk = Tk0
where Tk0 = 1/2 ρaV2w 4/9 E2
eqCLA cos2 θ and generates the nominalaircraft power, P0 = 1/2 ρaV
3w 4/27 E2
eqCLA cos3 θ.
62
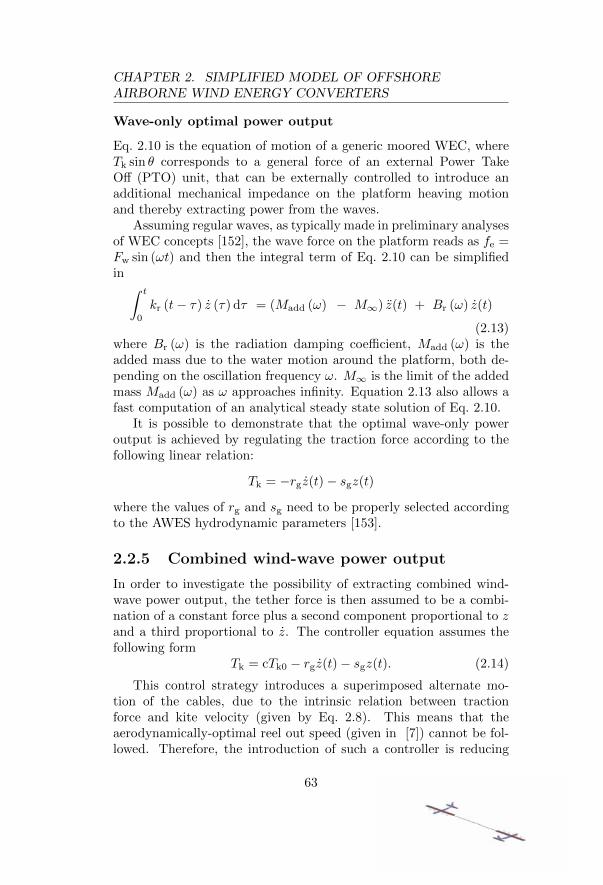
CHAPTER 2. SIMPLIFIED MODEL OF OFFSHOREAIRBORNE WIND ENERGY CONVERTERS
Wave-only optimal power output
Eq. 2.10 is the equation of motion of a generic moored WEC, whereTk sin θ corresponds to a general force of an external Power TakeOff (PTO) unit, that can be externally controlled to introduce anadditional mechanical impedance on the platform heaving motionand thereby extracting power from the waves.
Assuming regular waves, as typically made in preliminary analysesof WEC concepts [152], the wave force on the platform reads as fe =Fw sin (ωt) and then the integral term of Eq. 2.10 can be simplifiedin ∫ t
0
kr (t− τ) z (τ) dτ = (Madd (ω) − M∞) z(t) + Br (ω) z(t)
(2.13)where Br (ω) is the radiation damping coefficient, Madd (ω) is theadded mass due to the water motion around the platform, both de-pending on the oscillation frequency ω. M∞ is the limit of the addedmass Madd (ω) as ω approaches infinity. Equation 2.13 also allows afast computation of an analytical steady state solution of Eq. 2.10.
It is possible to demonstrate that the optimal wave-only poweroutput is achieved by regulating the traction force according to thefollowing linear relation:
Tk = −rgz(t)− sgz(t)
where the values of rg and sg need to be properly selected accordingto the AWES hydrodynamic parameters [153].
2.2.5 Combined wind-wave power output
In order to investigate the possibility of extracting combined wind-wave power output, the tether force is then assumed to be a combi-nation of a constant force plus a second component proportional to zand a third proportional to z. The controller equation assumes thefollowing form
Tk = cTk0 − rgz(t)− sgz(t). (2.14)
This control strategy introduces a superimposed alternate mo-tion of the cables, due to the intrinsic relation between tractionforce and kite velocity (given by Eq. 2.8). This means that theaerodynamically-optimal reel out speed (given in [7]) cannot be fol-lowed. Therefore, the introduction of such a controller is reducing
63

CHAPTER 2. SIMPLIFIED MODEL OF OFFSHOREAIRBORNE WIND ENERGY CONVERTERS
the amount of extracted wind power with respect to the ideal maxi-mum. In order to evaluate if the global balance is positive, having thebenefit from the additional power from waves overcoming the lossesfrom wind, the global wind-wave power output of the floating AWEShas to be computed. Using Eqs. 2.10, 2.11, 2.12 and 2.14, simpli-fying the convolution integral with Eq. 2.13 and integrating on thewave period Tw, it is possible to derive the analytical expression forthe steady state average power output of the combined wind-wavegeneration, Pww.
Pww = cTk0Vw cos θ − 1
Tw
∫ Tw
0
cTk0C(t) dt +1
2z21ω
2rg sin θ
+1
Tw
∫ Tw
0
z(t)rgC(t) dt +1
Tw
∫ Tw
0
z(t)sgC(t) dt
(2.15)
with
C(t) =
√cTk0 − rgz(t)− sgz(t)
12ρaE
2eqCLA
(2.16)
The solution for the dynamics of the platform reads as
z(t) = z1 sin(ωt+ φz)
z(t) = ωz1 cos(ωt+ φz)(2.17)
with
z1 =Fw√
( k − ω2m )2 + ω2r2
φz = − arctan
(ω r
k − ω2m
) (2.18)
m = M +Madd(ω) +Mm
r = Br +Bm + rg sin θ
k = kb + km + sg sin θ
(2.19)
64

CHAPTER 2. SIMPLIFIED MODEL OF OFFSHOREAIRBORNE WIND ENERGY CONVERTERS
If rg and sg are zero, then the maximum Pww is achieved with c =1 and corresponds to the maximum wind-only power, P0. This means,as we could easily guess, that an AWES placed on a floating platformis capable of generating at least the same power as if it were fixed onthe ground exposed to the same absolute wind. However, Eq. 2.15can be numerically maximised in order to find the optimal values ofthe controller parameters and verify if it is possible to achieve a poweroutput Pww higher than P0.
2.3 Case study
In this section, the model provided in section 2.2 is implemented ina numerical case study.
2.3.1 Geometry
The geometry of the platform is assumed to be of cylindrical shapeand to be moored with a single line catenary mooring. A wide rangeof geometries and sea states have been investigated, but we reportonly the few most significant results whose details are provided inFig. 2.4 and Tables 2.1, 2.2, 2.3.
Figure 2.4: Platform and aircraft dimensions The picture shows the dimensionsof platforms and aircraft properly scaled. The draft is the submerged height andis chosen to be equal to 1.88 times the radius.
65

CHAPTER 2. SIMPLIFIED MODEL OF OFFSHOREAIRBORNE WIND ENERGY CONVERTERS
Aircraft Data Unit
Aerodynamic efficiency Eeq 10Lift coefficient CL 0.65Air density ρa 1.225 kg/m3
Flight elevation angle θ 45 degWind speed Vw 12 m/s
Small BigArea A 150 600 m2
Nominal tension Tk0 191 764 kNNominal power P0 0.54 2.16 MW
Table 2.1: Aircraft data.
Platform Data Small Medium Big Unit
Diameter Db 5 10 15 mDraft 4.7 9.4 14.1 mNominal displacement 95 760 2566 tonAdded mass M∞ 31 249 842 tonBuoyancy stiffness kb 198 793 1784 kN/mNatural period (ca.) 5.2 7.1 8.6 sec
Table 2.2: Platform data.
Mooring Data Unit
Water depth 50 mLength 350 mChain diameter 64 mmLinear mass in air 90 kg/m
Smallair-craft
Bigair-craft
Equivalent mass Mm 33.1 53.2 tonEquivalent damping Bm 17954 35084 N/(m/s)Equivalent stiffness km 5940 11331 N/m
Table 2.3: Single line inelastic catenary mooring data. The equivalent mechanicalproperties change significantly with the loading condition.
66

CHAPTER 2. SIMPLIFIED MODEL OF OFFSHOREAIRBORNE WIND ENERGY CONVERTERS
2.3.2 Computation of the hydrodynamic coefficients
For all the considered cases, the hydrodynamic coefficientsM∞, Madd,Br, Fw, Mm, Bm, km were computed for the chosen geometries with astandard linear radiation-diffraction software (WAMIT). The moor-ing coefficients were taken from [151] and dimensioned in such a wayto balance the horizontal forces of the kite cable.
The convolution integral found in Eq. 2.10 can be solved in acomputationally efficient manner by approximating it with a systemof differential equations. Sufficient accuracy can be achieved with asystem of the third order or higher [154]. In this case, a fourth orderlinear system is used and its coefficients were computed by using M∞,Madd (ω) and Br (ω).
The static buoyancy stiffness kb can be easily computed as theproduct of water density, gravity acceleration, and waterplane areaρwgπD
2b/4, where Db is the platform diameter.
2.3.3 Results
A numerical parametric study of Eq. 2.15 in eight different sea stateswas performed for each geometry. The goal was to maximize thepower output Pww and the results are shown in Fig. 2.5.
In Fig. 2.5 each coloured square has two numbers. The first num-ber (without brackets) is the wave power potential improvement andis the ratio Pw/P0 where Pw is the nominal wave power that reachesthe floating platform computed by multiplying the linear wave powerdensity2, Pwl, by the platform diameter Db.
The second number (within brackets) is the wind-wave power ac-tual improvement and is computed as (Pww − P0)/P0. Finally thecolormap of the cells represents how much of the wave potential isexploited (in addition to the wind potential); it is given by the ratiobetween the second and the first number and is then (Pww−P0)/Pw.
The picture also shows the values of the buoy resonance periodTb = 2π√
k/mand the lift safety η. The lift safety is the nominal mass of
the platform plus the mooring line, divided by the maximum steadystate aircraft tension. If an offshore wind-only AWES is to be built,it is reasonable to expect η > 1.5.
2The linear wave power density (W/m) in deep water can be computed with
the formula Pwl =ρwg
2TwH2w
32πwhere Hw is the wave peak-to-peak amplitude.
67
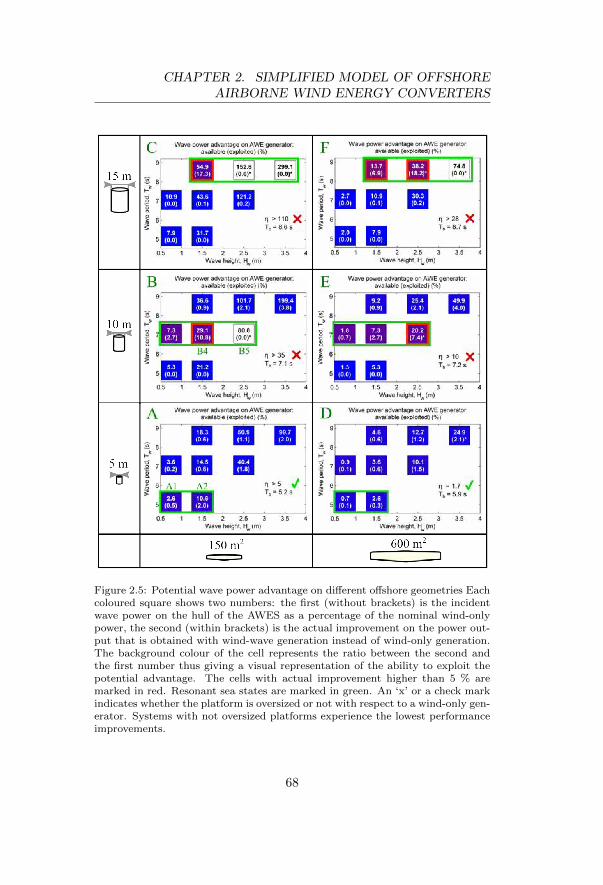
CHAPTER 2. SIMPLIFIED MODEL OF OFFSHOREAIRBORNE WIND ENERGY CONVERTERS
Figure 2.5: Potential wave power advantage on different offshore geometries Eachcoloured square shows two numbers: the first (without brackets) is the incidentwave power on the hull of the AWES as a percentage of the nominal wind-onlypower, the second (within brackets) is the actual improvement on the power out-put that is obtained with wind-wave generation instead of wind-only generation.The background colour of the cell represents the ratio between the second andthe first number thus giving a visual representation of the ability to exploit thepotential advantage. The cells with actual improvement higher than 5 % aremarked in red. Resonant sea states are marked in green. An ‘x’ or a check markindicates whether the platform is oversized or not with respect to a wind-only gen-erator. Systems with not oversized platforms experience the lowest performanceimprovements.
68

CHAPTER 2. SIMPLIFIED MODEL OF OFFSHOREAIRBORNE WIND ENERGY CONVERTERS
2.3.4 Small aircraft - Small platform
In Fig. 2.5A, the platform is well dimensioned (η around 5 or 6),meaning that more than 5 times the nominal aircraft pull is neededto lift the whole system out of the water. The potential wave poweradvantage ranges anywhere between 2.6 % and 99.7 % However, theimprovement that is actually achieved by configuration A is at most2.0 % even in the resonant sea states (inside the green box) where Twis roughly equal to Tb.
2.3.5 Small aircraft - Medium platform
If the buoy size is increased, Fig. 2.5B, η increases, meaning thatthe buoy is heavy when compared to the aircraft force. If comparedto case A, the platform resonates with sea states that carry a largeramount of wave power (potential advantage up to 80 % in B5), how-ever the best power output is achieved in B4 (aircraft-buoy combi-nation B, sea state n. 4) where the improvement is only 10.8 % withrespect to wind-only generation. Sea state data for case A2 and B4are shown in Table 2.4.
Sea state B5 is marked by a * and is white. It has a * becausethe platform oscillations are large comparing to its own dimensionsthus reducing the reliability of results. When such oscillations areconsidered too large, the cell is also white-filled and the advantage isset to zero (sg = rg = 0). In this case the aircraft can be controlledat constant nominal tension yielding the wind-only power Pww = P0.
2.3.6 Small aircraft - Big platform
If the buoy is enlarged even more, Fig. 2.5C, the advantage increasesto 17.3 % at the cost of having a huge platform with respect to thewind-only needs (η > 110).
2.3.7 Big aircraft
Increasing the aircraft size does not change the results discussed forthe small aircraft. Since the aircraft area increased by a factor 4,the potential advantages are much smaller (1/4) than for the smallaircraft. Moreover, in case D the platform could be lifted out of waterby peak forces.
69

CHAPTER 2. SIMPLIFIED MODEL OF OFFSHOREAIRBORNE WIND ENERGY CONVERTERS
2.3.8 Discussion
The fact that WECs performance are optimal only when they res-onate with the sea state explains why all the cells outside the greenboxes (i.e. non resonating working conditions) are coloured in blue(i.e. the obtained improvement is low). However, Fig. 2.5 clearlyshows that the potential advantage of having a combined wind-wavesystem instead of a wind-only generator does not provide major ben-efits in most of the circumstances, even inside the green boxes. Thiscan be explained as follows. It is possible to see from Eqs. 2.5, 2.9,2.10, 2.11 and 2.14 that in order to extract energy from the wave, rgmust be greater than zero, thus requiring Tk to be different from thenominal Tk0. The wind speed at the aircraft, V ∗w , is therefore differentfrom the optimal (2/3 Vw cos θ) violating the aerodynamic optimum.This can be seen in Fig. 2.6 where case B4 is analysed. The averagepower output, Pww, (top) as a function of rg is obtained from Eq. 2.15by fixing the numerically optimal sg and c. It is worth noticing thatthe optimal value of c is very close to one for all the considered cases.The average power contribution due to the wave (bottom) is com-
puted as 1Tw
∫ Tw
0z(t)2rg sin θ dt = 1
2 (ωz1)2rg sin θ. The average windpower (middle) is computed as the difference between the other two.
Sea Data Unit
Water density ρw 1030 kg/m3
Sea State n. 2 n. 4Frequency ω 1.21 0.89 rad/sPeriod Tw 5.16 7.06 secPeak-to-peak height Hw 1.5 2.5 mPower density Pwl 11.4 43.6 kW/m
Table 2.4: Wave data used to simulate cases A2 (n. 2) and B4 (n. 4).
2.3.9 Transient behaviour
So far, only the steady state values that occur during a continuousreel-out phase have been considered. Fig. 2.7 shows the transientbehaviour of the floating platform (case A2 of fig. 2.5) in case thepumping cycle is performed. The equations of motion are the same
70

CHAPTER 2. SIMPLIFIED MODEL OF OFFSHOREAIRBORNE WIND ENERGY CONVERTERS
Figure 2.6: Combined wind-wave power output, case B4 of fig. 2.5 Power output(top), wind power (middle) and wave power (bottom) as a function of rg. Thetop graph is the sum of the other two. The dashed lines represent the nominalwind-only and wave-only power, P0 and Pw respectively.
71

CHAPTER 2. SIMPLIFIED MODEL OF OFFSHOREAIRBORNE WIND ENERGY CONVERTERS
of section 2.2.3 with the only difference that the tether force is multi-plied by a square wave q(t) having unit amplitude and 60% reel-outtime. Tk is then substituted with Tkd = q(t)Tk. According to thishypothesis the transient motion has a negligible impact on the aver-age power output that results equal to 61.4% of P0 (2.4% higher thanthe nominal 60% of P0).
Figure 2.7: Offshore AWES transient behaviour. Typical simulated heave motionof the platform (top), aircraft tether force (middle) and mechanical power output(bottom). Three pumping cycles are shown. Even though the platform reachessteady state conditions in about 30 sec, the three cycles are different because theduty cycle period is not a multiple of the wave period.
72

CHAPTER 2. SIMPLIFIED MODEL OF OFFSHOREAIRBORNE WIND ENERGY CONVERTERS
2.3.10 Applicability of the results
The results shown in section 2.3 represent the first parametric anal-ysis of the design parameters of a floating offshore AWES. In thisstudy, the assumptions and models that have been adopted werepartly taken from the literature of other engineering fields such asocean wave and Airborne Wind Energy. As for the hydrodynamics,the buoy was modelled as a heaving rigid body with only one DoFwhereas other translations and all the rotations have been completelyneglected. Among them, the surge and pitch motions could be alsorelevant since traction force of the aircraft may have relevant compo-nents along these two directions, depending on the structural layout.Moreover, as discussed in section 2.2.1,the structural forces are com-puted thanks to linear wave theory and potential flow hydrodynam-ics, thus limiting the applicability of the results only to non-extremeoperational conditions. As for the aerodynamics, the simple steadystate model introduced in section 2.2.2 aims at representing the air-craft behaviour without considering several aspects of the dynamicsof a real airborne system such as the effects of gravity (weight of theaircraft), wind gusts, deformation of the wing, changes in lift or dragcoefficients, cable vibration/galloping or other aeroelastic flutteringetc. However, the approximations used in this study are very helpfulfor an initial analysis, allowing to introduce for the first time the off-shore floating AWES concept and to provide a preliminary assessmentof its performance.
2.4 Conclusions
In this chapter the dynamics of an offshore Airborne Wind EnergyConverter (AWES) has been investigated by coupling the aircraftsteady state crosswind model with the 1 degree of freedom hydrody-namics of a floating platform held in place by a catenary mooring line.A simple analytical model to compute the power production and theplatform heaving motion was derived. The model shows clearly thatoffshore AWESs are viable and also that there is a mild potentialimprovement due to combined wind-wave energy exploitation thatcan be achieved without changing the generator design. The modelwas numerically optimized and simulated with six different combina-tions of aircraft-platform sizes in eight different sea states. Despitethis simple and fast model allows first design iterations, further re-
73

CHAPTER 2. SIMPLIFIED MODEL OF OFFSHOREAIRBORNE WIND ENERGY CONVERTERS
search is required in modelling the system hydrodynamics in orderto take account of other important factors such as heave-pitch-surgemotion and response in irregular sea. As regards the shape of theplatform, other geometries could be considered in future works withthe aim of improving the performances of the combined wind-wavepower extraction.
Moreover, the proposed analytical tools should be extended tothe modeling of AWES farms which are expected to be much moreefficient from the techno-economic point of view.
74

Chapter 3
Dynamic model offloating offshoreairborne wind energysystems
With respect to Chapter 2 where deep offshore AWESs were mod-eled with 1 D.o.F., this chapter introduces a more general model-ing approach, considering generic multi-DoF models for the differentsubsystems (mooring, platform, tethered AWES). Integrated modelsare obtained by coupling simplified models for the various subsys-tems. Attention is focused on AWESs with generators on the lowerend of the cable (Ground-Gen [8]) mounted on slack-moored plat-forms, although the presented models can be easily extended to thecase of AWESs with flying generators (Fly-Gen) and to any kindof moored floating platform. The assumed methodology provides acomputationally-inexpensive tool that is useful for the preliminaryevaluation and conceptual design of floating AWESs. Moreover, theproposed aero-hydrodynamic models allow to assess the influence ofthe platform motion on the performance of the wind generator, thusproviding strategic information for the design of offshore AWESs con-trollers. An open source simulator based on the model presented inthis chapter has been released and it is described in Appendix A. Itis worth mentioning that the proposed model is only theoretical and
75

CHAPTER 3. DYNAMIC MODEL OF FLOATING OFFSHOREAIRBORNE WIND ENERGY SYSTEMS
that an experimental validation has not been implemented yet.
The chapter is organized as follows. Section 3.1 describes themodels employed for the different subsystems, i.e. platform, mooringsand AWES. On the basis of such formulations, in Section 3.2 a casestudy is presented in which a dynamic simulator is implemented in aMatlab/Simulink environment. Such a simulator has been conceivedas a numerical tool for preliminary assessment of different layoutsof floating AWESs and it may serve as a platform to test controlstrategies and perform feasibility studies.
Discussions on practical layouts for the platform and mooringlines and other relevant engineering issues are finally reported inSection 3.3. A possible roadmap toward full-scale development ofoffshore AWES systems is also proposed on the basis of well-knownmethodologies imported from other sectors of offshore renewables.
3.1 Model
Accurate mathematical description of the dynamic response of a float-ing offshore AWES is an extremely complex problem. The govern-ing physics of the system are characterized by coupled non-linearunsteady hydrodynamic and aerodynamic equations that should besimultaneously solved in order to calculated loads on the platformand predict its time response. CFD techniques, such as commonlyused Reynolds-Averaged-Navier-Stokes Finite Volume solvers, couldbe employed for this purpose to accurately find solutions but theywould result in heavy computational loads and time consuming pro-cedures for setting up simulations.
In this section, a different approach is proposed, that is basedon simplified models that are able to grasp the complex multi-DoFdynamic of a floating offshore AWES with an extremely reducedcomputational complexity. These models make it possible to runpreliminary studies and iterative optimizations with very reducedtime-to-solution. On the downside, the proposed models are basedon assumptions and approximations that are only valid in operativeconditions, i.e. in moderate sea states and wind intensity, far fromextreme levels of stress.
A simplified scheme of floating offshore AWES is shown in Fig.2.1where the plant is represented in its main sub-components: a floatingplatform, a mooring system, a traction tether and a wing.
76

CHAPTER 3. DYNAMIC MODEL OF FLOATING OFFSHOREAIRBORNE WIND ENERGY SYSTEMS
In this section, a simplified mathematical model that is able topredict the response of each of the sub-components is provided. Theapproach that is assumed for modeling the airborne components isbased on state of the art models from the AWE sector while modelsfor floating elements and mooring are borrowed from the naval/oceanengineering sector [155, 156, 157] and ocean renewable energy [158,159].
x
z
Center of mass
xp
zp
xk
Fixed reference system
Platform reference system
Floating platform
Fairlead
Mooring Line (tensioned)
Anchor on seabed
zk
Flying tether
Kite reference system
Mooring Line (at zero posistion)
Kite
Figure 3.1: Sketch of offshore AWES plant sub-components (mooring, platform,tether and kite) and definition of the reference systems.
In order to provide a clear description of the models it is importantto set appropriate reference frames and coordinates. With referenceto Fig. 3.1, the following frames are defined:
• x−y−z is a fixed frame with z axis perpendicular to the waterplane pointing upwards and having the origin in the position ofthe center of gravity of the platform in absence of loads fromwaves and/or tether traction.
• xp − yp − zp is platform-fixed frame having the origin in thecenter of mass of the platform and whose axes coincide withx− y − z when the platform is not loaded;
• xk − yk − zk is the reference system employed to define kitetrajectories and has the origin on the center of mass of the plat-
77

CHAPTER 3. DYNAMIC MODEL OF FLOATING OFFSHOREAIRBORNE WIND ENERGY SYSTEMS
form. The orientation of the axes does not follow the platform-fixed frame of reference, but the xk axis is along the absolutewind direction and the zk axis points upwards against gravity.
3.1.1 Floating platform dynamic model
This sub-section presents a 6 DoF hydrodynamic model of the AWESfloating platforms based on the assumptions of potential flow, linearwave theory [160] and small displacements, which make it possible toadopt linear equations [155] for the description of floater dynamics.
The coordinate system assumed to describe the (small) displace-ments of the floating platform is provided by a six-dimension vector
ξ =[xT ΘT
]T=[x y z θx θy θz
]T, where the first three
elements are the linear displacement components of x and the lastthree components, Θ, are rotations about the indexed fixed axes (allexpressed in the inertial frame of reference). The motion equationcan be written in the time-domain according to [161, 150]:
Mξ(t) = FH(t) + FR(t) + FD(t) + FE(t) + FM (t) + FK(t). (3.1)
which represents the balance of the inertia forces, on the right-hand side of the equation and the applied (six-dimension) force-moment, on the left hand-side. The different terms are detailed inthe following.
Inertia Matrix. M is the platform inertia matrix that in the x−y−zframe of reference reads as
Mii = m for i = 1, 2, 3
Mij = Ii−3,j−3 for i ≥ 4, j ≥ 4
Mij = 0 elsewhere,
(3.2)
being m the platform mass and I3×3 the platform moment of inertiatensor.
Hydrostatic Loads. FH represent the forces and moments due togravity and buoyancy loads. They are a function of the displacement,ξ, and, under the hypothesis of small motion amplitude, they readas
FH(ξ) ≈ FH,0 −Gξ, (3.3)
78

CHAPTER 3. DYNAMIC MODEL OF FLOATING OFFSHOREAIRBORNE WIND ENERGY SYSTEMS
where FH,0 is the resultant of gravity and buoyancy loads in theequilibrium configuration, ξ = 0, and G is the so-called buoyancystiffness matrix, and it is responsible for an elastic-like restoring ef-fect.
Radiation Loads. FR represent the force and moments induced byradiated waves that are generated by the platform oscillation, andread as
FR = −M∞ξ −∫ t
0
K(t− τ)ξ(τ)dτ, (3.4)
where M∞ is the added inertia matrix at infinite oscillation fre-quency, and the convolution integral is a memory term, whose kernel,K, can be expressed in Fourier frequency domain as
K(ω) = iω(MA(ω)−M∞
)+ Br(ω). (3.5)
MA and Br are the frequency-dependent added mass and radiationdamping matrices respectively, ω is the frequency expressed in rad/s,and the superscript indicates the Fourier transform of the labeledquantities. Eq. (3.5) shows that waves radiated by the body influencethe total inertia of the system (because of the displaced water vol-ume) and generate a damping effect (i.e., radiated waves propagateat the expense of the platform mechanical energy). The hydrody-
namic parameters, i.e., M∞, MA(ω), Br(ω), Γ(ω) and ψi(ω) can becomputed using potential flow solvers, based on the Boundary Ele-ment Method (BEM) [162], with respect to the reference position ofthe platform, ξ = 0. Examples of commercial BEM codes employedfor this purpose are WAMIT, ANSYS AQWA, and NEMOH. Theconvolution term in Eq. (3.4) is computationally inconvenient, andit can be replaced by a state-space approximation, by introducing astate vector, η, of appropriate length:
η = Acη + Bcξ∫ t0
K(t− τ)ξ(τ)dτ ≈ Ccη(3.6)
Matrices Ac, Bc and Cc can be chosen using an identification proce-dure in the frequency domain [154].
Viscous Loads. FD are force and moments produced by drag of vis-cous friction of the fluid. Although Eq. (3.1) comes from an assump-tion of inviscid fluid and potential flow, the time-domain formulation
79

CHAPTER 3. DYNAMIC MODEL OF FLOATING OFFSHOREAIRBORNE WIND ENERGY SYSTEMS
allows to include the effects of hydrodynamic drag dissipation. Suchcontribution is useful to model reasonable drift velocities for examplein case of sudden changes in the tether force and it can be expressedin a general form as
FD,i = −1
2ρwCiAili
k | ξi | ξi, with k = 0 for i ≤ 3, k = 1 for i > 3,
(3.7)where ρw is the sea water density, Ai and li are a characteristic crosssections and lengths respectively, and Ci are dimensionless drag co-efficients.
Wave Excitation Loads. FE represent the loads on the floating struc-ture due to sea waves. Thanks to the hypothesis of linear waves, realwaves are described as a superimposition of monochromatic waveswith different frequencies. With this assumption, wave excitationforces can be approximated by a finite sum of N components as fol-lows [163]:
FE,i =
N∑j=1
aw,jΓi(ωj) cos(ωjt+ ψi + ϑj
), (3.8)
where ωj are N different angular frequencies, Γ is a vector of waveexcitation loads (per unit wave amplitude) depending on the wave
frequency and direction of propagation, ψi(ω) are angles expressingthe phase shift among the different components of the excitation loadat each frequency, ϑj are random numbers in the interval [0; 2π];finally, aw,j are the amplitudes of the different harmonics, given by:
aw,j =√
2 ∆ωj Sω(ωj). (3.9)
In Eq. (3.9), ∆ωj are the differences between consecutive frequen-cies, and Sω(ω) is the wave spectrum expressed in m2/(rad/s), whichquantifies the distribution of wave energy over pulsation [164]. Be-sides the action of sea waves, other excitation terms can be kept intoaccount, e.g., the loads induced by sea currents. The latter can beeventually included in the model by means of a term in the samefashion of FD in Eq. (3.7).
External Loads. FM =∑i FM,i is the total load due to the mooring
80

CHAPTER 3. DYNAMIC MODEL OF FLOATING OFFSHOREAIRBORNE WIND ENERGY SYSTEMS
system, and it is the sum of contributions from the single mooringlines (in case of multi-line layout), FM,i; FK represents kite loads.Both these contributions will be detailed later on in this section.
3.1.2 Mooring lines model
In this section, modeling of platform mooring lines will be discussed,with reference to two traditional classes of computation methods(quasi-static and dynamic).
Offshore renewable energy platforms are moored according to avariety of architectures; a review of the different mooring layoutsis presented in [165]. Mooring lines are primarily designed to exertstatic forces and keep the platform in place and guarantee its stability.However, due to the relevant pulling loads imposed by the wind gener-ator, the dynamic effects of the mooring lines on the platform are non-negligible [161]. The dynamic model of the platform (see Eq. (3.1))has therefore to be coupled with a model of the mooring system. Tothis aim, two fundamental approaches exist to model moorings [166]:quasi-static approach and fully-coupled dynamic methods.
Quasi-static methods originate from analytic solutions for theload and shape of continuous homogeneous cables (inextensible ordeformable). These methods are only able to account for the grav-ity/buoyancy forces and, eventually, elastic forces on the cables, thusneglecting any other effect related to inertia and viscous loads. Ac-cording to these approaches, mooring tensions in any intermediateconfiguration are a function of the mooring line ends position only.Assuming a quasi-static formulation, the mooring loads on a platformare, in general, a non-linear function of the displacement; nonetheless,it is a common practice to linearize them:
FM ≈ FM0 −GMξ, (3.10)
where FM0 =∑i FM0,i is the total mooring load in the static equi-
librium position (including the contributions of the single lines), andGM is the overall stiffness matrix of the mooring system [167].
Dynamic approaches, on the other hand, account for inertial anddissipative effects. As pointed out in [168], the dynamics of mooringlines is non-negligible when water depth is large or if the line has large-drag elements (e.g., chain moorings). Besides the intrinsic inertia ofthe mooring line, hydrodynamic parameters (such as added mass, ordrag) are crucial in the dynamics of a mooring lines. Such parameters
81

CHAPTER 3. DYNAMIC MODEL OF FLOATING OFFSHOREAIRBORNE WIND ENERGY SYSTEMS
are usually found by means of specialized codes (e.g., ANSYS AQWAor ORCAFLEX). As for the quasi-static case, the load exerted by themooring on the platform is often expressed in an approximated linearform [151]:
FM ≈ FM0 −GMξ −BM ξ −MM ξ, (3.11)
where BM and MM are overall damping and inertia due to the moor-ing system.
In this work and in the case study presented in the following, ref-erence is made to a quasi-static non linear model described in [146],which applies for catenary moorings [165] and is based on the assump-tion of inextensible mooring lines and on the catenary equations.
Figure 3.2: Sketch of a single catenary mooring line, with the main geometricdimensions defined. In the picture, Tm is the force (module) applied by themooring line to the platform, and Tm,h and Tm,v its components.
The geometry of a single mooring line is shown in Fig. 3.2. Theline is attached to the platform by means of a fairlead and fixed tothe seabed by an anchor. In the picture, L and Ls are respectivelythe total (constant) length and the length of the suspended portionof the line, while hm and vm are, respectively, the horizontal andvertical distance between the fairlead and the anchor in a genericconfiguration.
The force exerted by the line on the platform can be decomposedinto two vectors, one on the horizontal x−y plane and a vertical one,
82
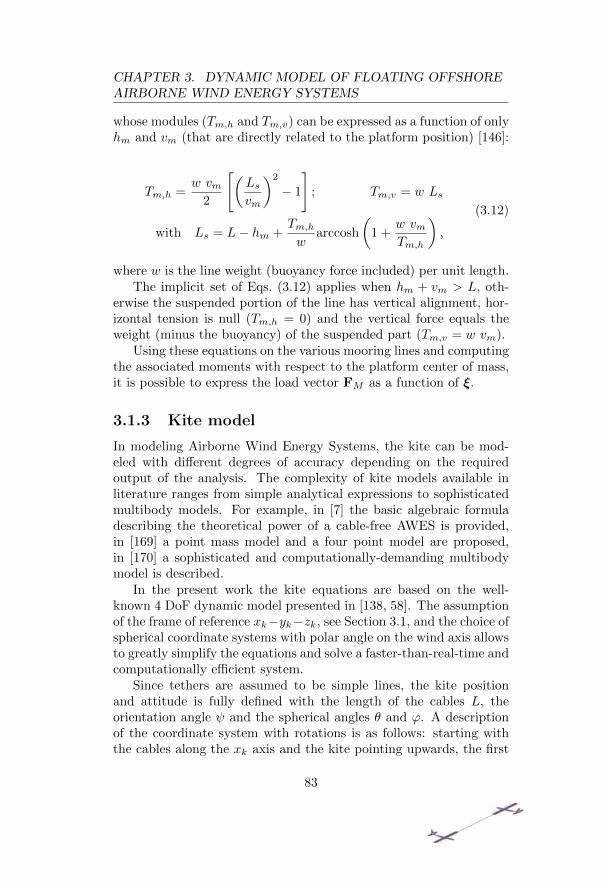
CHAPTER 3. DYNAMIC MODEL OF FLOATING OFFSHOREAIRBORNE WIND ENERGY SYSTEMS
whose modules (Tm,h and Tm,v) can be expressed as a function of onlyhm and vm (that are directly related to the platform position) [146]:
Tm,h =w vm
2
[(Lsvm
)2
− 1
]; Tm,v = w Ls
with Ls = L− hm +Tm,hw
arccosh
(1 +
w vmTm,h
),
(3.12)
where w is the line weight (buoyancy force included) per unit length.The implicit set of Eqs. (3.12) applies when hm + vm > L, oth-
erwise the suspended portion of the line has vertical alignment, hor-izontal tension is null (Tm,h = 0) and the vertical force equals theweight (minus the buoyancy) of the suspended part (Tm,v = w vm).
Using these equations on the various mooring lines and computingthe associated moments with respect to the platform center of mass,it is possible to express the load vector FM as a function of ξ.
3.1.3 Kite model
In modeling Airborne Wind Energy Systems, the kite can be mod-eled with different degrees of accuracy depending on the requiredoutput of the analysis. The complexity of kite models available inliterature ranges from simple analytical expressions to sophisticatedmultibody models. For example, in [7] the basic algebraic formuladescribing the theoretical power of a cable-free AWES is provided,in [169] a point mass model and a four point model are proposed,in [170] a sophisticated and computationally-demanding multibodymodel is described.
In the present work the kite equations are based on the well-known 4 DoF dynamic model presented in [138, 58]. The assumptionof the frame of reference xk−yk−zk, see Section 3.1, and the choice ofspherical coordinate systems with polar angle on the wind axis allowsto greatly simplify the equations and solve a faster-than-real-time andcomputationally efficient system.
Since tethers are assumed to be simple lines, the kite positionand attitude is fully defined with the length of the cables L, theorientation angle ψ and the spherical angles θ and ϕ. A descriptionof the coordinate system with rotations is as follows: starting withthe cables along the xk axis and the kite pointing upwards, the first
83

CHAPTER 3. DYNAMIC MODEL OF FLOATING OFFSHOREAIRBORNE WIND ENERGY SYSTEMS
rotation has amplitude −ψ around xk, then −θ around yk and finally+ϕ around xk again. Three examples of wind-polar coordinates areshown in Fig. 3.3.
Figure 3.3: Examples of wind-polar coordinates. Positive wind-polar coordinates(ψ, θ, ϕ) are indicated by the black arrows. Blue arrows show the kite cartesianreference frame. By definition, the wind window has the wind going towards thescreen, in x direction.
The transformation from polar to cartesian position is therefore:
Xk =
xkykzk
= L
cos θ− sin θ sinϕsin θ cosϕ
(3.13)
The equations of motion of the kite are:
ψ = gkvaδ + ϕ cos θ (3.14)
θ =vaL
(cosψ − tan θ
E
)+vyawL
tan θ (3.15)
ϕ = −va sinψ
L sin θ(3.16)
where the introduced elements assume the following meaning.
Steering response coefficient gk is a constant that defines the steeringresponse of the kite;
Steering control δ is the non-dimensional control input according tothe Turn Rate Law [138];
84

CHAPTER 3. DYNAMIC MODEL OF FLOATING OFFSHOREAIRBORNE WIND ENERGY SYSTEMS
Apparent wind speed va is given by the relation va = vwE cos θ +vyawE (in a realistic system the instantaneous value of this velocityshould be measured by a dedicated on-board sensor);
Equivalent aerodynamic efficiency E takes account of all the relevantdrag contribution (tether drag, wing drag and where applicable steer-ing unit or fuselage drag);
Drift-away velocity vyaw is the velocity of the kite along the yaw axisalligned towards the floating platform, given by the combination ofthe drum control input and the motion of the platform.
When the kite is linked to a fixed ground station, as in many AWEprototypes, the component of the kite velocity in the direction of thecables, vyaw, can be assumed to come only from the drum control
input on the reeling velocity, vyaw = −L [58].However, if the ground station is a floating platform, the ground
ends of the cables of the kite are moved. This may lead to a temporaryincrease or decrease in the relative wind field at the kite and thereforein the tether tension, depending on the kite position in the windwindow and on the direction of motion of the floating platform withrespect to the kite position. For example, in case the cables arepulled against the wind, the kite velocity increases and so does thetether force. Likewise, if the platform moves towards the absolutewind direction, the tether tension will decrease. Conversely, a smallplatform oscillation perpendicular to the cables direction will notgenerate any effect at the kite. Therefore a kinematic law is neededto couple the airborne system to the floating platform to take intoaccount these effects. In this work, the kinematic link is modeled as:
vyaw = −(L + C · Xk
||Xk||
)(3.17)
C = X + RZ RY RX Cp (3.18)
where C and Cp represent the coordinates of the point where thecables exit from the platform (see Fig. 3.2), expressed in the fixedreference system (x − y − z) and in the platform reference system(xp−yp−zp), respectively. RX , RY and RZ are the rotation matricesaround the x, y and z axis for the transformation from the platformref. system to the fixed ref. system (see Fig. 3.1). X and Xk contain
85

CHAPTER 3. DYNAMIC MODEL OF FLOATING OFFSHOREAIRBORNE WIND ENERGY SYSTEMS
the coordinates of the platform and of the kite defined in sections 3.1.1and 3.1.3, respectively.
In case the platform does not move, the velocity of point C iszero and the coupling equation (3.17) goes back to the case of fixedground station (vyaw = −L).
The kite affects the platform motion thanks to the kite aero-dynamic loads that generate forces and moments on the platformthrough the tether.
Fk =1
2ρaV
2a Ak
√C2L + C2
D (3.19)
where ρa is the air density, Ak is the kite aerodynamic area, CL andCD are the lift and drag coefficients, respectively.
Even though the lift and drag coefficients change with the angleof attack and other effects, in this analysis CL and CD are consideredconstant, assuming the presence of an inner control loop that keepsthe angle of attack in a small range as reported in literature [8, 36,120]. Stall effects are therefore not captured by this model.
3.2 Case study
In this section a case study is presented in order to provide an under-standing on what kind of analysis can be conducted using the pre-sented models. Specifically, a pumping kite system and its controllerare implemented and integrated with a light-weight slack-mooredfloating platform model. The proposed analysis highlights the effectsof the moving/floating platform on the AWES system and viceversa.
A cylindrical barge with large diameter and short draft is con-sidered, which is assumed to be moored with a single slack mooringline (i.e., the platform can perform large displacements on the waterplane). These conditions are considered highly disadvantageous intraditional offshore wind, as both the barge-like platform and slackmooring contribute to large displacements of the generator. Never-theless, the results of this analysis show that the floating AWES canpreserve stability and good power output in spite of the unfavorablelayout, thus providing first positive evidences on the feasibility ofoffshore AWES systems based on light-weight floating fundations.
86

CHAPTER 3. DYNAMIC MODEL OF FLOATING OFFSHOREAIRBORNE WIND ENERGY SYSTEMS
3.2.1 Simulator
The analysis of the case study has been carried out with a dynamicsimulator for floating AWESs, which is based on the models pre-sented in Section 3.1. The simulator has been developed in a Matlab-Simulink environment and can be adapted to different AWES archi-tectures with custom layouts of the floating platform, mooring linesand flying kite.
Every time the routine is called, before starting the time-domainsimulation, the implicit Eqs. (3.12) are solved for the input selec-tion of the system parameters in order to map the force response ofthe mooring lines as a function of the fairlead position. Then, thesimulator calls Simulink routines to solve the dynamic motion of thefloating platform (Eq. (3.1)) and of the flying kite (Eqs. (3.14), (3.15)and (3.16)) that are coupled according to Eqs. 3.17 and 3.18 usingthe control strategy described in Section 3.2.3.
The modeled physical phenomena are all statically and dynami-cally stable as there are no negative stiffness and damping coefficients.The simulator showed no numerical stability issues for the range ofthe parameters set that has been employed. A thorough analysis ofthe numerical stability would be an interesting topic but it wouldbe out of the scope of this work. The integration of the aforemen-tioned equations is performed with a fixed step explicit solver (ode3Bogacki-Shampine) with a 0.1 s step size.
A set of three dimensional views showing the animations producedby the simulator for the different subsystems is shown in Fig. 3.4. Thesource code of the simulator and a sample video is available at [11].
87

CHAPTER 3. DYNAMIC MODEL OF FLOATING OFFSHOREAIRBORNE WIND ENERGY SYSTEMS
Kite view
Floating platform view
Mooring line view
Anchor on seabed
Fairlead on platform
Point CKite tether
Mooring line
Platform *
Attraction points
Kite
Figure 3.4: 3D view of the simuation environment. The subsystems of a simpleoffshore AWES are shown: kite, platform and mooring line.
88

CHAPTER 3. DYNAMIC MODEL OF FLOATING OFFSHOREAIRBORNE WIND ENERGY SYSTEMS
3.2.2 Platform and mooring
For the sake of clarity, a simplified layout is assumed, which consistsin a homogeneous axisymmetric platform moored with a single line(Fig. 3.4). Realistic architectures for offshore AWESs are likely tobe more complex (e.g., having multiple mooring lines to keep theplatform in place and non-trivial shapes and distribution of ballastmasses and buoyant volumes to enhance stability). The platformis assumed to be a cylindrical barge-like buoy as in Fig. 3.2, withthe features reported in Table 3.1. The inertia and damping of themooring lines are neglected in this case study.
Platform data Value UnitDiameter 10 mDraft d 1.2 mHeight l 1.8 mDensity ρp 670 kg/m3
Nominal displacement M 94.7 tonViscous drag coefficient Ch 1Viscous drag coefficient Cv 1Mooring line dataLength L 350 mLine linear weight w 373 N/mAnchor position x -301.2 mAnchor position y 0 mAnchor position z -49.7 mFairlead position x, y 0 mAnchor position z -0.9 mWater dataWater density ρw 1025 kg/m3
Water depth h 50 m
Table 3.1: Floating platform, mooring line and water data.
In the hypothesis of cylindrical platform with homogeneous density,ρp, the inertia matrix M and the hydrostatic buoyancy matrix G canbe found analytically, with the relations in Table 3.2. Hydrodynamicparameters introduced in Section 3.1.1 are obtained with the BEMsolver ANSYS AQWA. Platform drag coefficients (Ci in Eq. (3.7))are all taken equal to one, in order to reasonably estimate the dragloads order of magnitude.
89

CHAPTER 3. DYNAMIC MODEL OF FLOATING OFFSHOREAIRBORNE WIND ENERGY SYSTEMS
Inertia Matrix
M11 = M22 = M33 = m =π
4ρplD
2
M44 = M55 =m
4
(l2
3+D2
4
), M66 =
1
8mD2
Hydrostatic Stiffness Matrix
G11 = G22 = G66 = 0 , Gij = 0 for i 6= j
G44 = G55 =π
64ρwgD
4 − π
4ρwgdD
2dB +mgdG
Table 3.2: Inertia matrix and hydrostatic stiffness matrix elements for the caseof cylindrical homogeneous platform. Here, dB=0.6 m is the depth of the bargecenter of buoyancy and dG=0.3 m is the depth of the center of gravity below thestill water level, in the equilibrium configuration.
In the present layout, it is assumed that the winch on which thetether is wound and the mooring line fairlead are aligned with theplatform centroid along the platform zp axis direction. The anchoris positioned along the x axis in a way that, in the reference config-uration (ξ = 0), the suspended length of the line (Ls) is vertical andequal to the vertical distance between the fairlead and the seabed, asshown in Fig. 3.1.
Although the hydrodynamic model proposed in Section 3.1.1 comesfrom a linearization, and is usually valid only for small displacementsof the platform, in the case in exam it rigorously holds even for largedisplacements in x and y direction (not in z direction). Indeed, giventhe form of hydrodynamic parameters (in particular, hydrostatic stiff-ness) for this case (Table 3.2), none of the loads in Eq. (3.1) explicitlydepends on x and y, except for fM and fK . In the computation ofthese two loads general non-linear formulations are used, which applyeven for large x and y displacements as well.
For the choosen layout of mooring-barge-tether system and theassumption of small displacements, the platform dynamics is entirelydescribed by 5 DoFs, as no moment can be generated on the z di-
90

CHAPTER 3. DYNAMIC MODEL OF FLOATING OFFSHOREAIRBORNE WIND ENERGY SYSTEMS
rection, thus the platform yaw rotation, θz, is considered identicallynull.
3.2.3 Kite and controller
Among the many different type of controllers that have been pro-posed in literature [171, 36, 172, 54, 173, 45], we choose for this casestudy the simple control strategy illustrated in [138], including im-provements proposed in [33].
This controller is based on a simple PID tracking and an algorithmbased on four attraction points that makes it possible to reliablyimplement ”side-down” figure-of-eight loops.
With reference to the coordinate system defined in Section 3.1.3,it is possible to define the heading, γ, as:
γ = arctan
(−ϕ sin θ
θ
)(3.20)
The reference heading, γ0, is computed as
γ0 = arctan
(ϕ− ϕ0,i
θ0,i − θ
)(3.21)
where θ0,i and ϕ0,i are the constant polar coordinates of the i-thattraction point, Pi, to which the kite is pointing at (i = 1, 2, 3, 4).
The non-dimensional steering input of eq. 3.14 is given by a simpleproportional control on the reference heading:
δ = Kγ(γ0 − γ) (3.22)
The attraction point Pi is pre-assigned and is changed with thefollowing switch-case algorithm:
Switch iCase i = 1
if ϕ ≤ −ϕth then i = 2Case i = 2
if θ ≤ θth then i = 3Case i = 3
if ϕ ≥ ϕth then i = 4Case i = 4
if θ ≤ θth then i = 1
91

CHAPTER 3. DYNAMIC MODEL OF FLOATING OFFSHOREAIRBORNE WIND ENERGY SYSTEMS
This control algorithm results in a side-down figure-of-eight mo-tion. For example, with reference to Fig. 3.5, viewing the kite fromthe floating platform with the wind going towards the screen, start-ing the kite with initial coordinates ψ0 = 0 deg, θ0 = 45 deg andϕ = 0 deg and initial attraction point P1, the kite moves upwards andstarts steering counterclockwise (δ > 0) while heading to point 1. Theϕ coordinate becomes negative and keeps decreasing until the thresh-old −ϕth is reached and the attraction point switches to point 2. Thekite keeps steering counterclockwise to reach point 2 and lowers its θcoordinate. When θ is lower or equal than θth the attraction pointbecomes point number 3. The kite steers counterclockwise and startsmoving towards greater θ and positive ϕ until +ϕth is reached andthe attraction point becomes point n. 4. The kite steers clockwisetowards lower values of θ and when θ is lower or equal than θth theattraction point becomes point n. 1 and the cycle starts over.
Figure 3.5: The kite is controlled in to a ’side-down’ figure-of-eight motion follow-ing the four attraction points marked with a red *. The wind window is shownwith the wind going towards the screen.
Regarding the control of the reeling drums, different strategies arepossible. For example, in [33] the kite is reeled-in after depoweringmaneuvers, in [137] an optimization of the reeling cycle for a pumpingglider is performed and in [62] a detailed control algorithm for softkites with reel-in at the edge of the wind window is described.
In this work, during reel-out the drum velocity is controlled with asimple proportional controller on the tether force L = KF (Fk−Fk0).When the maximum tether length is reached, the control mode isswitched to reel-in mode and the kite is assumed to fly at constantvelocity towards the ground station with zero tension. When thetether length is below the minimum threshold the drum controller isswitched to reel-out mode again.
92

CHAPTER 3. DYNAMIC MODEL OF FLOATING OFFSHOREAIRBORNE WIND ENERGY SYSTEMS
The complete kite data, employed for this case study, togetherwith the control parameters are reported in Table 3.3.
Kite and wind data Value UnitAerodynamic efficiency E 3.9Turn rate law constant gk 0.13Lift coefficient CL 0.65Avg. polar angle θ 28 degArea Ak 200 m2
Avg. Tether tension Fk 81 kNAvg. reel-out mech. power 200 kWWind speed Vw 12 m/sAir density ρa 1.225 kg/m3
Point C coord. Cp (0, 0, 1) mControl parametersAttraction point coord. ϕ0,1 -20 degAttraction point coord. θ0,1 50 degAttraction point coord. ϕ0,2 -30 degAttraction point coord. θ0,2 15 degAttraction point coord. ϕ0,3 20 degAttraction point coord. θ0,3 50 degAttraction point coord. ϕ0,4 30 degAttraction point coord. θ0,4 15 degHeading proportional gain Kγ 0.4 rad−1
Force proportional gain KF 5e-4 (m/s)/NPolar threshold θth 50 degLongitudinal threshold ϕth ±15 degMin. tether length 400 mMax. tether length 800 mReel-in speed 2.3 m/sForce set point Fk0 76 kN
Table 3.3: Kite, wind and control data.
3.2.4 Simulation results
In order to provide a comparative study, three scenarios have beenconsidered and are presented in this section. Specifically, the sameAWES system have been imagined to be installed: (1) onshore (withfixed ground station), (2) on a floating offshore platform in a calm
93

CHAPTER 3. DYNAMIC MODEL OF FLOATING OFFSHOREAIRBORNE WIND ENERGY SYSTEMS
sea (without waves) and (3) floating offshore platform in presenceof intermediate intensity irregular sea waves. In the last case, waveexcitation (equations 3.8 and 3.9) is computed assuming a propa-gation direction along the x axis and a Pierson-Moscowitz distribu-tion [163, 164] to describe the wave spectrum:
Sω(ω) = 262.9Hs2Te−4ω−5 exp(−1054Te
−4ω−4), (3.23)
where Hs and Te are statistical wave parameters known as ’significantwave height’ and ’energy period’, and they were assumed to equalHs=4 m, Te=10 s.
Results from simulations are reported in Figs. 3.6 and 3.7 thatshow the time series of the power output and the platform displace-ments in the three scenarios, respectively.
In Fig. 3.6 the power is zero during reel-in phases (marked in grayon the plot) due to the assumption of null tether tension, although inpractice some power is required to reel-in the cables. Comparing thethree scenarios, it is clear that when the AWES is on the floating plat-form, the power output is quite irregular. i.e. the reeling controllerneeds to compensate for the platform motion in order to follow theset point of tether tension , thereby generating large oscillations ofthe instantaneous power around the mean value.
As shown in Fig. 3.7, due to the peculiar layout with single moor-ing line, the platform undergoes large displacements on the horizontalplane (in x and y direction) in correspondence of both the switch-ing phases between reel-out / reel-in and the periodic lobes of thefigure-of-eight path. In particular, the platform oscillates above twodifferent equilibrium positions during reel-out and reel-in phases. Inthe first case, the mean equilibrium position is set by the force bal-ance among hydrodynamic loads, mooring traction and kite meantether tension; as the tether tension goes to zero (reel-in), the plat-form moves in x direction toward the reference equilibrium positiondue to the restoring mooring force.
Notice also that, for both the scenarios with floating AWES (withand without waves), the power (Fig. 3.6) becomes negative at thebeginning of reel-out cycles, that is, the generator is required to spendpower even though the controller is set on reel-out mode. This effect,which is due to the large velocity of the platform in the direction ofthe tether length, is important and may introduce further complexityin the controller design.
Finally, further considerations can be outlined:
94

CHAPTER 3. DYNAMIC MODEL OF FLOATING OFFSHOREAIRBORNE WIND ENERGY SYSTEMS
• Heave (z) and pitch (Ry) displacements of the platform in pres-ence of waves are relevantly larger than in calm sea.
• In presence of waves, the hydrodynamic Eq. (3.8) is not rigor-ously valid immediately after the switching between reel-in andreel-out (i.e. when velocity in x and y direction is large). Inthese cases, wave frequency should be corrected accounting forthe relative velocity between wave and platform.
• Although the considered kite is quite large (with a power in theorder of hundreds of kilowatts) and the barge relatively light(the weight is approximately 10 times the mean tether pullingforce), the platform does not lose stability, even in presenceof relatively tall waves. This is an encouraging result, whichdemonstrates that offshore AWESs may be deployed with sim-pler and lighter structures than traditional offshore wind tur-bines.
• The simulation of the kite retraction phase was done assumingzero tension on the tether. The force during reel-in can betheoretically brought to a near-zero magnitude with a properflight of a glider [137] and can be practically reduced to roughlyone fourth of the reel-out force with a canopy kite [174]. Theassumption of zero reel-in force leads to a simple and effectivesimulation of the transient phase between reel-in and reel-out(see Figs. 3.6 and 3.7), though it could be improved by e.g.choosing more accurate values of the tether force and the reel-in velocity or by taking into account different reel-in strategies.
95

CHAPTER 3. DYNAMIC MODEL OF FLOATING OFFSHOREAIRBORNE WIND ENERGY SYSTEMS
Figure 3.6: Available mechanical power at the generator. Reel-in phases arehighlighted in gray.
96

CHAPTER 3. DYNAMIC MODEL OF FLOATING OFFSHOREAIRBORNE WIND ENERGY SYSTEMS
Figure 3.7: Displacements and rotations of the platform: results of the simulatedcase study. Reel-in phases are highlighted in gray.
3.3 Discussion
In this section, a general discussion is provided about technologicaland engineering issues which cannot be directly observed from theproposed simulator results. Design and operational aspects are dis-cussed on the basis of existing knowledge coming from the offshorewind turbines sector. Types of platforms, moorings and very prelim-inary roadmap towards full-scale devices deployment are outlined.
For conventional horizontal-axis wind turbines, it has been sug-gested [161, 175] that in water deeper than 50 m bottom-fixed supportstructures are not economically feasible, thus the necessity of floatingplatform-based solutions arises. The installation of wind turbines onfloating platforms presents a number of criticalities related to stabil-ity and critical loads due to the large aerodynamic forces applied atlarge height above the water surface, which are responsible for largepitch overturning moments [176]. Therefore, offshore wind platformsand moorings are generally designed to minimize the wind/wave in-duced displacements as well as free oscillations [177]. Tethered AWEgenerators have the intrinsic advantage of generating moderate over-
97

CHAPTER 3. DYNAMIC MODEL OF FLOATING OFFSHOREAIRBORNE WIND ENERGY SYSTEMS
turning moments on the platform, thus, it is expectable that designrequirements for floating AWE platform may be less stringent thanfor traditional turbines.
Beside the barge architecture presented in Section 3.2 a variety ofplatform typologies could be considered. Examples of possible config-uration are reported in Fig. 3.8 on the basis of envisaged architecturesin the wind-offshore sector [177, 175].
The spar buoy (Fig. 3.8(a)) is a platform with deep draft and itis stabilized by lowering the center of mass below the center of buoy-ancy with a properly sized ballast. This kind of platform features lowvertical wave induced forces, thus undergoing small heave displace-ments. Due to the small cross section area, its motion is prevalentlyin roll and pitch [176].
Barge platforms (Fig. 3.8(b)) present large water plane surface(which allows to achieve stability) and relatively shallow draft. Ac-cording to Roddier et al. [176], this kind of platform is marginallyinvestigated in traditional offshore wind due to its significant angu-lar motions. As shown by the case study in Section 3.2, in offshoreAWE such angular displacements might be smaller (thanks to themoderate kite-induced moments on the floater), but still relevant.A solution is hypothesized in Fig. 3.8(b) right, where a ring-shapedbarge is sketched, which has inertia and buoyant volume located bythe platform outer perimeter. The barge central part consists of alightweight structure (holding the generator), whose structural resis-tance is possible thanks to the relatively reduced loads generated bythe AWE generator. This layout appears to provide a better pitchstability and reduced angular displacements.
Semisubmersible platforms (Fig. 3.8(c)) combine the restoring ef-fects of the two previous types [175]. They are constituted by bal-lasted pontoons providing buoyancy to the structure, with relativelylow wave excitation loads due to the moderate water plane area.
98

CHAPTER 3. DYNAMIC MODEL OF FLOATING OFFSHOREAIRBORNE WIND ENERGY SYSTEMS
(a) (b) (c) (d)
Spar buoy Barge platforms Semisubmersible Tension leg
Figure 3.8: Schematic drawing of four main types of floating platform for offshorewind: (a) Spar buoy, (b) Barge platforms, (c) Semisubmersible platform, (d)Tension leg platform.
These three platform concepts usually employ catenary lines (likethose modeled in Section 3.1.2) or taut lines as moorings. Catenarymoorings generate a restoring force which is principally due to the lineweight, they are slack and approach the sea bed with horizontal tan-gent. Taut legs arrive at sea bed tense with a certain angle; the maincontribution to restoring forces is the line elasticity. Taut mooringshave smaller positioning radius, thus requiring a reduced occupiedsea bed portion, but they must stand larger tension and their anchorpoint must resist both horizontal and vertical forces [178].
A different type of floating platform is the so-called Tension LegPlatform (TLP), (Fig. 3.8(d)), in which the support tank basementis fully submerged and its excess buoyancy keeps the mooring linestense and vertically aligned. This architecture minimizes platformdisplacements, but it is highly costly and presents a number of issuesrelated to mooring installation and lines tension variation as waterlevel changes (due to tidal or incoming waves) [176].
The choice of the platform and mooring type relies on differenttypes of requirement and must be supported by making reference tocoupled aero-hydrodynamic models. The key factors for the choiceare environmental variables such as water depth (e.g., TLPs andtaut moored platforms become advantageous with respect to cate-nary moored systems as water depth increases [179]), stability, crit-
99

CHAPTER 3. DYNAMIC MODEL OF FLOATING OFFSHOREAIRBORNE WIND ENERGY SYSTEMS
ical loads, displacements. The evaluation of the last two aspects, inparticular, is strongly related to the interaction of the floating plat-form with incoming waves. When the platform resonates (in one ofits oscillation modes) with the incoming waves, wave induced loadsand/or displacements are maximized. Evaluation of wave spectra andrecurring wave energy periods in the installation site is a preliminarystep towards the design of platforms with natural frequency outsidethe range of typical wave frequencies [177]. Moreover, a number ofdesign expedients can be included in order to damp or minimize waveexcitation on floating platforms. E.g., pontoons of semisubmersibleplatforms are usually equipped with horizontal plates at the bottomend, with the aim of increasing the added mass (thus reducing thenatural frequency, shifting it away from waves pulsation) and gener-ating viscous damping [176].
Furthermore, it must be remarked that other technical aspectsshould be kept into account to design and analyze floating AWEplants, i.e.:
• Operating loads and fatigue assessment. This aspect is less cru-cial than in traditional offshore wind, in which the most criti-cal component is the wind turbine structure itself. In floatingAWE, this type of analysis should only be addressed to floatingbasement and mooring lines.
• Cut-off meteorological conditions. The cut-off wind condition(beyond which a safety landing is necessary) have to be chosenin the light of the platform dynamics. A set of combined wind-wave-current cut-off states for the generator should be defined.
• Extreme loads and survivability. Platform design must guar-antee survivability in presence of extreme waves/currents. Themodeling methodology proposed in this work is suitable for av-erage operating conditions only (and in presence of small plat-form displacements). Extreme sea analysis requires differenttools, e.g., finite-volume CFD solvers or pool tests of scaledprototypes.
• Non-linear hydrodynamic effects. The relevance of other hy-drodynamic effects should be preliminarily assessed with ap-propriate tools. E.g., Vortex-Induced Vibration (VIV) due tosea currents has to be examined, as it is potentially damaging atfrequencies close to the natural frequency of the structure [168].
100

CHAPTER 3. DYNAMIC MODEL OF FLOATING OFFSHOREAIRBORNE WIND ENERGY SYSTEMS
Moreover, second-order drift hydrodynamic forces can be in-cluded in the time domain model of Eq. (3.1), which may causethe platform to oscillate about an offset position with respectto the nominal equilibrium [161].
• Installation and operation. Transportation and anchoring of theplatform as well as in-site installation of the tethered generatorhave to be standardized and automatized. Moreover, take-offand landing phases of the flying generator, which are complexoperations still representing a challenge for on-shore AWE [8],have to be further improved and adapted to offshore conditions.
• Farms of devices. Similarly to other offshore renewable en-ergy technologies, it is expected that offshore AWE generatorsbecome more convenient when installed in farms where oper-ation and maintenance can be more efficient and fixed costssuch as electrical connections can be shared among multipledevices [180]. If farms are considered, different layouts can beconceived (e.g., shared platforms and moorings may be em-ployed for different AWESs) and more sophisticated models,keeping into account the aero-hydrodynamic interaction amongdifferent devices, should be employed.
Given the high uncertainty related to floating AWESs modeling anddesign, the above mentioned engineering issues, and the large cap-ital costs involved, it is expectable that a viable roadmap towardsimplementation of full-scale offshore AWESs should include a seriesof incremental scale-up prototyping steps, following the methodologyof the other offshore renewable energy systems (namely, wave, tidal,offshore wind generators) [176, 180].
After a first phase of concept definition, small-scale tests (e.g.,wave tank tests on scaled prototypes of floating platform) are re-quired prior to undertake offshore installation. Such tests are usefulto adjust and update previously established numerical models, cor-rect the design choices and assess the device response in operatingand extreme load conditions. Final scale-up steps may include sea-tests, monitoring and grid connection of nearly-full-scale (e.g., 1:5)prototypes first, and on full-scale devices finally.
101

CHAPTER 3. DYNAMIC MODEL OF FLOATING OFFSHOREAIRBORNE WIND ENERGY SYSTEMS
3.4 Conclusions
In this chapter, the potential of offshore AWESs is investigated andnumerical models are presented for preliminary modeling and designof floating platforms housing AWESs.
Offshore sites are very promising for wind energy application, asthey feature large available airspace and non-turbulent thin windboundary layers. Installing AWESs offshore, in particular, may openthe way to the development of high-altitude wind technology by pre-venting NIMBY effects that AWESs may induce on the general pub-lic. Nevertheless, the implementation of offshore wind generators is acostly and complex operation, which requires a number of progressivesteps preceding the installation of a full-scale fully-functional device.
The first step towards deployment is preliminary numerical mod-eling aimed at understanding the interaction among the different sub-systems (platform, wind generator, mooring system) and roughly de-signing the various parts and the controller. This chapter presentsnumerical models specifically tailored to this purpose. Existing mod-els for the different subsystems have been collected from literature,adapted, extended and coupled. In particular, a multi-DoF hydro-dynamic model for floating platforms is presented, which relies onpotential-flow and linear waves theory, a quasi-static model for cate-nary moorings has been detailed, and a 4-DoF model for kite-typeAWESs has been assumed. With respect to other sophisticated nu-merical tools, which solve fluid continuum equations using a localapproach and a domain discretization, this set of models allows faster-than-real-time calculations and is thus preferable at a first stage ofanalysis.
A Matlab-Simulink simulator that relies on the above mentionedmodels has been released [11]. An illustrative case study is discussed,which makes reference to a cylindrical barge platform with a singlemooring line.
The presented simulator provides a one-of-a-kind numerical plat-form on which different layouts of floating AWESs can be tested anddesigned, prior to undergo progressive scale-up prototyping steps to-wards the installation of full-scale offshore AWESs.
102

Chapter 4
Assessment of highaltitude dual windenergy drone generators
As introduced in Chapter 1, in the upper region of the atmosphericlayers, winds are more powerful, steadier and more persistent thanat lower altitudes, where conventional wind turbines usually oper-ate [13]. At several thousand meters above sea level, jet streamscurrents can reach power densities as high as 15 kW/m2 ( i. e. 50-100more power than typical values at ground level) with typical avail-ability of more than 30 %. Early studies in AWE were focusing onhigh altitudes, at several thousand meters above ground level [28].However, in spite of several research efforts, present Wind EnergyDrones (WEDs) are limited to several hundred meters [120, 37, 123].The reason for this, which is better explained in section 4.1, can beidentified in the problem imposed by the aerodynamic drag of thecables [181]. The gain in power provided by the strength of winds athigh altitude is not enough to compensate the loss in power throughcables drag that increases with their length. Several concepts havetherefore been proposed and patented to overcome this limitationsand achieve near-zero cable drag [131, 134].
This chapter presents the first detailed assessment of a systembased on a dual WED architecture in which the two drones, withon-board generators, are connected to the ground with Y shaped
103

CHAPTER 4. ASSESSMENT OF HIGH ALTITUDE DUALWIND ENERGY DRONE GENERATORS
tethering; a concept that was first envisioned in patent [131] in 1976and has been later investigated by several authors [181, 132, 182, 133].Systems of more than two drones (multi WEDs systems) are alsopossible, however this chapter focuses on dual drone systems.
While previous studies mainly focused on modelling and controlissues, this chapter aims at providing a first detailed evaluation of thepower capabilities of a dual-WED system. Specifically, a model thatcombines essential aerodynamic, electrical and mechanical aspects isdeveloped to derive a simplified power curve. This model takes intoaccount important real-world constraints such as the mass of dronesand tethers, plus structural and electrical constraints of the cablesand hovering constraints.
A series of case studies is implemented on the basis of a site-specific wind data at different scales/altitudes, foreseeing a poweroutput from a few hundred kW to several MW, with 30% capacityfactor.
The contents of this chapter are organised as follows. Section 4.1explains the dual wind drone concept and the working principle ofthe dual WED system, Section 4.2 presents the mathematical modelthat is employed to evaluate the performances of the system and Sec-tion 4.3 provides some numerical examples based on real wind data.The numerical solver of the equations is described in appendix C ofthis thesis.
4.1 Jet stream altitude wind drone sys-tem
Before explaining the WED concept that is proposed and analysedin the following sections, it is useful to recall the working principleof the single Fly-Gen wind drone, i. e. the concept investigated byGoogle-Makani and others [120, 7].
As explained in Chapter 1, in a single Fly-Gen WED, electricenergy is produced on board of the aircraft during its flight and itis transmitted to the ground trough a special rope which integrateselectric cables. The Fly-Gen plane takes off pointing upwards, drivenby the propellers thrust. This take-off mode is similar to that of aquadcopter and the on-board rotors are used as thrusters. Duringtake-off the rope reels out from the ground station. The reel outdirection is mainly downwind. Once the rope has been unwound, the
104

CHAPTER 4. ASSESSMENT OF HIGH ALTITUDE DUALWIND ENERGY DRONE GENERATORS
single WED changes flight mode becoming a tethered airplane. Inthis second flight mode a circular crosswind flight path is poweredby the wind itself and the on-board rotors are used as generators toextract power from the wind. During this phase the cable length isfixed. An animation of the working principle for a single Fly-Gendrone is available in [91].
For a given absolute wind speed Vw, with air density ρ, angle ofaltitude β, lift and drag coefficients of the drone CL and CD referredto a drone wing area A, cable diameter d and length l, drag coefficientof the cable C⊥, the nominal power that can be extracted by a singlewind drone can be computed with the well known formula as in [8]:
Pnom =1
2ρ (Vw cosβ)3
4
27
(CL
CD + dlC⊥4A
)2
CLA
It is very important to notice that the power output reductiondue to cable drag, (dlC⊥)/(4A), increases with the cable length dra-matically. In the attempt of choosing coefficients and dimension ofpractical interest, it is easy to observe that it is difficult to designa system for extreme high altitudes. Actually, the gain obtained inreaching the powerful high altitude winds by increasing the cablelength will soon result in a net loss due to dissipation in cable drag.This is why the optimal altitude for a single Fly-Gen wind drone isusually set at relatively low altitudes of a few hundred meters. Thisissue is currently limiting the real competitive advantage of WEDsand translates into a relatively minor improvement with respect toconventional wind turbines.
For the above mentioned reasons in this work we further developthe analysis of a solution to overcome this physical limit that wasoriginally proposed by [131] and later investigated in [181, 132, 182,133, 16].
This concept consists in (at least) two crosswind drones that sharea common part of their cables (see Fig. 4.1 right). One main longercable connects the ground station to a split point where the two cables(hereafter called dancing cables) that reach each drone are attached.
The drones are controlled in a way to approximately follow thesame circular trajectory maintaining diametrically opposed positions.Such circular trajectory is chosen in a way to minimize the absolutevelocity of the split point.
105

CHAPTER 4. ASSESSMENT OF HIGH ALTITUDE DUALWIND ENERGY DRONE GENERATORS
If this working condition is achieved, the longer-shared cable isnot moving and does not generate any drag, and aerodynamic lossesare only generated by the two shorter cables. This solution may allowto considerably increase the length of the cables (i. e. the altitude)while keeping the aerodynamic losses substantially constant therebyachieving a major gain in the power output because of the strongerhigh-altitude winds.
Figure 4.1: A dual wind drone system and other wind energy technologies. In thisschematic drawing, a dual drone system (right) extracts power at high altitude,converts it into electricity thanks to on-board wind turbines and sends it tothe ground through light-weight electrical cables. A single wind drone (Google-Makani style) and a conventional wind turbine are also depicted.
Because of its complexity, it was hard to envision a real techno-logical viability for this system when it was first sketched back in1976 [131]. Only recently, because of modern enabling technologies,several studies were conducted about this concept. In [132] a nominalpower output of 6 MW is envisioned with a double Fly-Gen dronesystem of 100 m2, in [182] a dual airfoil system is modelled togetherwith a rotational take-off system and in [181] the momentum balanceof the airflow for a dual drone system is investigated.
The present work focuses on assessing the power output of a WEDsystem including real-world constraints such as the weight of the ca-bles, the dissipated heat due to joule effect in the electrical conduc-
106

CHAPTER 4. ASSESSMENT OF HIGH ALTITUDE DUALWIND ENERGY DRONE GENERATORS
tors, and their resulting temperature rise. Specifically, two differentcable layouts are therefore proposed in Fig. 4.2. The first layout as-sumes a coaxial cable having the structural and electrical part on thesame axis. This coaxial layout is simpler but requires a low electricalresistance in order not to heat up the structural cables. A second lay-out proposes the electrical conductors outside the structural cablesin order to allow higher temperatures of the electrical cables therebyincreasing the Joule losses but at the same time reducing the weightof the cables.
Figure 4.2: Schematics of the cable arrangement for dual WEDs. Proportionsare distorted for the sake of clarity. Two different layouts are shown. 1) The leftconfiguration features a coaxial cable with integrated structural and electricalfunctions i. e. the cable is made of structural wires, to resists the traction forcesof the airborne system, coupled with conductive aluminum wires, to transfer thepower from the airborne generators to the ground. 2) Right: a more complexarrangement has the electrical cables that run in parallel to the structural cable.
107

CHAPTER 4. ASSESSMENT OF HIGH ALTITUDE DUALWIND ENERGY DRONE GENERATORS
4.2 Model
This section introduces the mathematical model that makes it pos-sible to asses the nominal power output of the dual WED systempresented in section 4.1. The nominal power output will be then usedin Section 4.3 to provide simplified and conservative power curves ofdual drone systems of several sizes.
4.2.1 Model hypotheses
The split point of the long common cable is assumed to be kept fixedby appropriately controlling the two drones. Each drone is assumedto fly in steady state crosswind flight and at constant altitude, i. e.the radius of the trajectory of the WEDs is much smaller than thelength of the common cable.
Section 4.2.2 describes the basic geometrical relations employedto describe the system. The lengths of the longer shared cable andthe two dancing cables are computed from the nominal altitude andelevation angle assuming straight cables (i.e. neglecting the cable sag)by means of a simple trigonometric equation. Each dancing cable isassumed to be subjected to a triangular relative wind distributionwhile the fixed common cable is assumed to be subjected only toa site-specific absolute wind shear distribution that is computed inSection 4.2.3 assuming low tether sag.
Section 4.2.4 recalls known models for estimating the steady-statenominal power output [120, 7] and also adds a 2D mechanical equilib-rium (Fig. 4.3) in order to take into account also the effect of dronemass and of the distributed cable drag due the absolute wind veloc-ity. The mass of the two drones is assumed to be lumped to a singlepoint at nominal flight altitude. The distributed cable drag force isconservatively assumed to be applied at the nominal flight altitude.
The structural cable diameter is related to the drone lift by con-sidering the nominal breaking strength and a safety coefficient as inSection 4.2.5.
Considering that the cables are very long, Section 4.2.6 takes intoaccount the dissipated power by Joule effect and the resulting temper-ature of the cables surface. The power cables are therefore assumed tobe an ohmic circuit coupled with a constant convective heat transfermodel through a cylindrical surface.
The cables represent the most important mass-payload of the
108

CHAPTER 4. ASSESSMENT OF HIGH ALTITUDE DUALWIND ENERGY DRONE GENERATORS
drones. Even though a small tether sag is assumed to be negligi-ble when computing the cable length and the distributed cable drag,such a small tether sag has an effect in the 2D mechanical equilibrium(Fig. 4.3), especially at larger scale. Thus the tether sag angle at thenominal altitude is computed by approximating the cable shape as aparabola as described in Section 4.2.7.
Finally the electrical power output is computed in Section 4.2.8.
4.2.2 Geometrical relations
This subsection is dedicated to illustrate the geometric parametersand relations. Specifically, the distance between the ground stationand the center of the circular trajectory of the two drones, lfd, isdirectly computed from the nominal flight altitude, H, and the ele-vation angle, β, with a basic geometrical relation (see Fig. 4.3).
lfd =H
sinβ(4.1)
Under the assumption of low tether sag, the distance lfd is a goodapproximation for the length of fixed and dancing cable, defined asthe sum of the length of the shared fixed cable, lf , plus the lengthof one dancing cable, ld, projected along the fixed cable directionthrough the half-angle between dancing cables, γ,
lf = lfd − ld cos γ (4.2)
The two-way length of the electrical cables, le, is twice the lengthof the fixed cable and two dancing cables (see Fig. 4.2). All electricaltethers are conservatively assumed to have constant section.
le = 2 (lf + 2ld) (4.3)
4.2.3 Distributed drag on fixed cable
The horizontal drag force generated by the absolute wind along thefixed cable, Fhd, is non negligible and can be approximated as:
Fhd =
∫ H
0
1
2ρ (h)Vw (h)
2C⊥ (2dpc + 2dec) dh (4.4)
109

CHAPTER 4. ASSESSMENT OF HIGH ALTITUDE DUALWIND ENERGY DRONE GENERATORS
where ρ (h) is the air density as a function of altitude; Vw (h) is theabsolute wind speed as a function of the variable altitude h; C⊥ is theperpendicular drag coefficient of the round cable; dpc is the diameterof each polymeric cable; and dec is the diameter of each electricalcable.
4.2.4 Crosswind Fly-Gen flight and drone mass
The operating wind speed (equal to the cut-in wind speed), Vci, isprojected considering three angles. Not only the elevation angle, β,as done in previous literature [119, 8], but also the angle induced bythe cable mass, θc, and the angle induced by the drone mass, θd,that will be explained later. The projected cut-in wind speed, Vcip,is therefore:
Vcip = Vci cos(β + θc + θd) (4.5)
The equivalent diameter of the dancing cable, deqd, is computed asthe sum of the diameter of the polymeric cable, dpc, and the diameterof the two electrical cables, 2dec. This simple sum is valid in case thetwo conductive cables are outside the polymeric cable (Fig. 4.2-right),and it is conservative with respect to the coaxial case (Fig. 4.2-left).
deqd = dpc + 2dec (4.6)
The equivalent aerodynamic efficiency of each drone, Eeq, is com-puted as in [118]:
Eeq =CL
CD +deqdC⊥ld
4Ad
(4.7)
where CL and CD are the lift and drag coefficients of the wing, re-spectively, Ad is the wing surface and C⊥ is the perpendicular dragcoefficient of each dancing cable.
The power output for the two drones, P2, is computed with knownmodels [7, 8] also taking into account the momentum conservation
110

CHAPTER 4. ASSESSMENT OF HIGH ALTITUDE DUALWIND ENERGY DRONE GENERATORS
efficiency1, ηm, and the efficiency of the electric turbines ηt.
P2 = 2
(1
2ρHV
3cip
4
27E2eqCLAdηmηt
)(4.8)
where ρH is the air density at the flight altitude, H.The flight speed of each drone, Vd, is computed as in [7]:
Vd =2
3VcipEeq (4.9)
and the lift force generated by each drone, L, is:
L =1
2ρHV
2d CLAd (4.10)
As shown in Fig. 4.3, the equivalent lift force, L2, generated bythe two drones together is:
L2 = 2L cos(γ) (4.11)
The equivalent lift is used to compute the horizontal and verticalforce balance (Eqs. 4.12 and 4.13, respectively) also including thetension in the fixed cable, Ff , the mass of the two drones, 2md andthe distributed drag on fixed cable Fhd. Notice that with a momentbalance at the ground station, Fhd should be included in Eq. 4.12with a discount factor between 1/2 and 1. A conservative factor of1 is chosen. In this steady state model, it is assumed that the rollangle of each drone is increased by θc and θd so that the lift forcepoints more upwards and balances the downward gravity componentsas shown in Fig. 4.3.
L2 cos(β + θc + θd) + Fhd = Ff cos(β + θc) (4.12)
L2 sin(β + θc + θd) = 2mdg + Ff sin(β + θc) (4.13)
1ηm takes into account the momentum conservation applied to Fly-Gen air-borne wind turbines. Theoretically, it is possible to have ηm approaching 1 incase the onboard rotors area is much bigger that the wing planform area, as ex-plained in details in [120], in paragraph 28.2.5, where ηm is called η or also 1−a.For practical real world dimensions, this value is also shown to be very high.
111

CHAPTER 4. ASSESSMENT OF HIGH ALTITUDE DUALWIND ENERGY DRONE GENERATORS
Figure 4.3: Force balance at drones. The lift forces and the gravity forces ofthe two drones are summed up and considered as acting on a single point. Thefigure shows the lumped force equilibrium at this single point. The cable shape(together with the angle θc) is given by the linear mass of the cable and its tensionFf . The gravity force acting on the two drones is compensated by the angle θd.Note that in this balance the two drones are assumed to be in steady state flight,flying perpendicular to the screen and that the angle θd aims at representing theinfluence on the roll angle for both drones.
112

CHAPTER 4. ASSESSMENT OF HIGH ALTITUDE DUALWIND ENERGY DRONE GENERATORS
4.2.5 Structural equations of dancing cables
The tension in each dancing cable, Fd, is assumed to be equal to thelift force generated by the drone:
Fd = L (4.14)
A basic structural cable model takes account of the area of eachpolymeric dancing cable, Apc, the breaking strength, σpc and thesafety factor, ηpc
Apc =Fd ηpcσpc
(4.15)
The polymeric dancing cable cross-section is circular
dpc =
√4
πApc (4.16)
4.2.6 Electrical equations
The electrical current in the circuit, I, is related to the generatedpower and the voltage of the on-board turbines, Vt
I =P2
Vt(4.17)
A basic thermal model relates the dissipated power per unit length,Pdl, to the temperature difference between the surface of the electricalcables and the environment, ∆T , and to the diameter of the electricalconductor, dec, through the convective thermal coefficient hair. ∆Tis assumed constant throughout the whole length of the cable.
dec =Pdl
∆Tπhair(4.18)
The relation between the total dissipated power, Pd, and the dis-sipated power per unit length is straightforward
Pdl = Pd/le (4.19)
113

CHAPTER 4. ASSESSMENT OF HIGH ALTITUDE DUALWIND ENERGY DRONE GENERATORS
The total dissipated power is generated by Joule effect and de-pends on the electrical resistance of the cable, Rec
Pd = RecI2 (4.20)
The electrical resistance of the cable is linked to the cable dimen-sions by means of the second Ohm’s law:
Rec =leρeAlπ4 d
2ec
(4.21)
where ρeAl is the resistivity of the conductor.
4.2.7 Fixed cable mass and shape
The linear mass of the fixed cable, mfl, is the sum of the linearmasses of two polymeric dancing cables and two electrical cables (seeFig. 4.2):
mfl = 2Apcρmpc + 2π
4d2ec ρmAl ηmAl (4.22)
ρmpc and ρmAl are the mass densities of the polymer and of theelectrical conductor, respectively, and ηmAl is a safety coefficient thataims at taking into account the mass for additional insulation orcoating fixtures.
In order to model the effect on the power output from the cablegravity force, the shape of the cable is approximated as a parabolathat passes through the ground station and the center of the circulartrajectory of the two drones. Using a parabola instead of a catenarycurve is valid under the hypothesis of small tether sag, i. e. when θcis small. The parabola has equation y = ax2 + 2ax1x. Eq. 4.23 givesthe coefficient a (that was derived in the gravity term of Eq. B.17)and Eq. 4.24 computes the coefficient x1 geometrically.
a =mflg
2Ff(4.23)
x1 =tanβ
2a− lfd cosβ
2(4.24)
114

CHAPTER 4. ASSESSMENT OF HIGH ALTITUDE DUALWIND ENERGY DRONE GENERATORS
The geometrical derivative of the parabola at the flight mid pointallows to compute the tether sag angle:
θc = arctan (2a (lfd cosβ + x1))− β (4.25)
4.2.8 Power output
The electrical power output is straightforward:
Pout = P2 − Pd (4.26)
The next section shows how this model can be used to derive thepower curve of a dual drone generator by means of a several numericalcase studies.
4.3 Power curves of a dual wind dronesystem
This section presents several examples of dual WED systems. Afterestimating the nominal power output with the model presented inSection 4.2, the conservative power curves are presented by means ofthe following additional hypotheses:
• the nominal wind speed is directly computed from the statisticalwind distribution at the nominal flight altitude given a chosenCapacity Factor (CF). The nominal wind speed is the CFth
percentile of the distribution.
• the system is assumed to work only when the absolute windspeed is higher or equal to its nominal wind speed, i. e. thenominal wind speed is conservatively assumed equal to the cut-in wind speed. The system is assumed to be switched off whenthe wind speed is lower.
• the plant is assumed to work at the cut-in/nominal wind speedalso when the wind speed is greater than the cut-in/nominalwind speed. In this case, the plant would work below its theo-retical optimum and the excess power is assumed to be managedby means of spoilers or other control factors that are neglectedin this analysis.
115

CHAPTER 4. ASSESSMENT OF HIGH ALTITUDE DUALWIND ENERGY DRONE GENERATORS
• the cut-off wind speed is neglected.
The resulting power curve is thus simplified into a step functionand it only has an on/off threshold at the cut-in/nominal wind speed(see red lines in Fig. 4.5).
The model presented in Section 4.2 is applied to five different casestudies having different sizes and flight altitudes (see table 4.2). Thefull list of input parameters is shown in Tables 4.1 and 4.2 and theresults are presented in Table 4.3 and in Fig. 4.5.
In all the considered case studies, the WED systems are assumedto operate in Saudi Arabia, the nearest region to Europe with largeavailability of jet streams currents [183]. The wind data are takenfrom radiosonde measurements at King Fahad Airport (see Fig. 4.4).
Plant input
Capacity factor CF 30 %
Flight altitude H see table 4.2
Wing area of each drone Ad see table 4.2
Elevation angle β 20 deg
Half-angle between dancing cables γ 45 deg
Length of each dancing cable ld 300 m
Aerodynamic input
Lift coefficient of drone CL 1.5 ( )
Drag coefficient of drone CD 0.15 ( )
Drag coefficient of each dancing cable C⊥ 1 ( )
Momentum conservation efficiency ηm 0.97 ( )
Polymeric cables
Structural safety factor of polymericcable
ηpc 1.25 ( )
Breaking strength of polymeric cable σpc 1500 N/mm2
Mechanical input
Mass of each drone md see table 4.2
Mass density of polymeric cable(UHMWPE)
ρmpc 997 kg/m3
116

CHAPTER 4. ASSESSMENT OF HIGH ALTITUDE DUALWIND ENERGY DRONE GENERATORS
Mass density of electric cable (Alu-minum)
ρmAl 2700 kg/m3
Mass safety factor of electric cables(insulation)
ηmAl 1.3 ( )
Electrical input
Efficiency of the electric turbine ηt 0.85 ( )
Nominal voltage difference at turbines Vt 35000 V
Electrical resistivity (Aluminum) ρeAl 3e-8 Ω m
Convective heat exchange coefficient hair 6 W/(m2 K)
Temperature difference (electrical ca-ble vs air)
∆T 300 C
Table 4.1: Input parameters. A parameter is chosen to be an input when it iseither: a design choice, a constraint, a variable to be optimized in the future, ora variable that can be linked to other phenomena by nesting it into an additionaliterative loop.
Input data, case n. 1 2 3 4 5
Wing area ofeach drone
Ad (m2) 20 50 50 80 124
Flight altitude H (m) 250 500 2000 5000 10000
Mass of eachdrone
md (kg) 500 2000 2000 5000 12000
Table 4.2: Input parameters for different case studies. Five case studiesare investigated from a smaller (case n. 1) to a larger generator (case n. 5).
Output data, case n. 1 2 3 4 5
Wind data @ King Fahad Airport, SA
Air density ataltitude
ρH(kg/m3)
1.15 1.12 0.98 0.73 0.41
Cut-in windspeed ataltitude (30 %CF)
Vci(m/s) 8.1 8.5 10 19.8 42.1
117

CHAPTER 4. ASSESSMENT OF HIGH ALTITUDE DUALWIND ENERGY DRONE GENERATORS
Plant output
Power output ofthe plant
Pout(MW)
0.14 0.27 0.36 3.2 14.87
Powercoefficient
CP (%) 39.5 44.3 16.8 6.3 2.3
Cut-in windspeed ataltitude(projected)
Vcip(m/s)
7 6.6 7.9 16.5 31.6
Length of fixedand dancingcable
lfd (m) 731 1462 5848 14619 29238
Length of fixedcable
lf (m) 717 1448 5812 14506 29026
Diameter ofdancing cable(equivalent)
deqd(mm)
7 11 12 30 59
Flight speed ofeach drone
Vd(m/s)
45.9 43.4 51.8 99.6 170
Equivalentaerodynamicefficiency ofeach drone
Eeq ( ) 9.9 9.9 9.8 9.1 8.1
Mechanical output
Diameter ofeach polymericdancing cable
dpc(mm)
6 9 10 21 34
Cross section ofeach polymericdancing cable
Apc(mm2)
30 66 82 363 916
Linear mass offixed cable
ρf(kg/m)
0.06 0.14 0.17 0.83 2.71
Lift generatedby each drone
L (kN) 36 79 98 435 1099
118

CHAPTER 4. ASSESSMENT OF HIGH ALTITUDE DUALWIND ENERGY DRONE GENERATORS
Tension in fixedcable
Ff (kN) 47 93 121 584 1539
Equivalent liftgenerated bythe two drones
L2 (kN) 51 112 139 616 1555
Angle inducedby cables mass
θc (deg) 0.2 0.5 1.9 4.7 11
Angle inducedby drone mass
θd (deg) 10.3 19.1 15.5 9.1 10.4
Cable parabolicparameter
a (e-6m−1)
6.4 7.2 6.8 7 8.6
Cable parabolicparameter
x1 (e+4m)
2.8 2.5 2.4 1.9 0.7
Distributeddrag to fixedcable tension
Fhd/Ff(%)
0.1 0.3 1.5 3.3 9.9
Electrical output
Length ofelectrical cables(2 way)
le (m) 1514 2976 11825 29652 59252
Powergenerated bythe two drones(gross)
P2
(MW)0.14 0.29 0.43 3.94 19.1
Dissipatedpower in cables(Joule effect)
Pd(MW)
0 0.01 0.07 0.74 4.23
Dissipatedpower in cables(Joule effect)(linear)
Pdl(W/m)
2.7 4.3 5.7 24.9 71.4
Diameter ofeach electricalcable
dec(mm)
0.5 0.8 1 4.4 12.6
119

CHAPTER 4. ASSESSMENT OF HIGH ALTITUDE DUALWIND ENERGY DRONE GENERATORS
Electricalresistance ofcables
Rec (Ω) 256.6 193.2 449.2 58.4 14.2
Electricalcurrent throughcables
I (A) 4 8.2 12.2 112.5 545.8
Table 4.3: Output parameters for different case studies. Five case studiesare investigated from a smaller (case n. 1) to a larger generator (case n. 5).
4.3.1 Power coefficient of the high altitude winddrone system
An important parameter that is used to describe the technical perfor-mance of a conventional wind turbine is the ratio between the nominalpower output and the available wind power 1
2ρV3wAr through the ro-
tor surface Ar, this number is the so called coefficient of power, CP .It is important to remember that the maximum theoretical CP for aconventional wind turbine is the so called Betz’s limit and it is equalto 16
27 .Also, the Betz’s limit (as we know it) does not apply to wind
drones, especially at large scale, mainly because the hypothesis ofmono-dimensional flow does not hold true with respect to the annu-lus [8, 120, 181]. For example in this assessment, the power coefficienthas reasonable values at smaller scale but it is very small at largerscale, if compared to e.g. a value of CP = 45% for a conventional windturbine, (see Table 4.3). The smaller values are due to the large areaof the annulus that is swept by the drones. However it is worth notic-ing that this low efficiency is not relevant during techno-economicaloptimizations and it is not a weakness of large scale wind drones. Ifthe cost of the wind drone generator is low and the output is large,having this low efficiency has to be regarded as a strength, in that itdemonstrates that the margins for power optimization are large.
4.4 Future works
Possible future investigations may include: a dynamic model of amulti WED system, a more realistic power curve that has a cut-in
120

CHAPTER 4. ASSESSMENT OF HIGH ALTITUDE DUALWIND ENERGY DRONE GENERATORS
Figure 4.4: Wind Power Density as a function of altitude in Saudi Arabia. Thechart shows the value of the wind power density (on the x axis) that is ex-ceeded 30% of the time at different altitudes (on the y axis). The wind carries15.5 kW/m2 at 10250 m, 51 times more than at low altitude. The data are takenfrom 432 radiosonde measurements of the wind speed as function of altitude atKing Fahd Airport in Saudi Arabia throughout 2015 [184]. The jet streams carrysimilar power densities in many other countries, especially United States (northeast), Canada (north east), Egypt, China (north east), Korea, Japan, SouthAfrica, Argentina, Chile, Australia (south).
121

CHAPTER 4. ASSESSMENT OF HIGH ALTITUDE DUALWIND ENERGY DRONE GENERATORS
Figure 4.5: Power curves for the five case studies. The cable layout and the powercurves for the considered WED systems are shown. The top left figure shows thecable layout of the five case studies together. The cable sag effect becomes moreimportant as the WED size and altitude increase. Each wind drone system isassumed to work following a simplified power curve (red line) that has a cut-in wind speed that depends on the desired flight altitude. The wind statisticaloccurrence at the chosen altitude is represented by the blue bars.
122

CHAPTER 4. ASSESSMENT OF HIGH ALTITUDE DUALWIND ENERGY DRONE GENERATORS
wind speed lower than the nominal wind speed, this will certainly in-crease the foreseen power output; a techno-economical optimizationof the dual WED with a genetic algorithm; an optimization of thenumber of flying drones would also be interesting, as it is reasonableto expect that more that two drones can produce more energy at alower cost by sharing a common cable; different take-off and land-ing platforms and their control strategies might be investigated, e.g.ground rings for horizontal take-off of tethered drones or a multi-perch system for vertical take-off, or convertiplane-like drones, or adual drone that can become one single drone or re-detach to increasethe power output or maximize stability, a faired rope for the dualdrone system; moreover, means to achieve the required fast circularmotion including additional lifting surfaces on the drones or othercable layouts are also an interesting topic, e.g. additional fixed ormoving surfaces at an angle with respect to the wing, or a movablecable attachment point; finally, means to achieve the helicopter-likepitch variation of the drones during the rotary motion could be in-vestigated.
For example, a possible take-off method inspired to the disciplineof control line flight [185] is shown in Fig. 4.6. In this representationtwo drones are connected by an horizontal cable at their starboardwing tip so that the mid point of the connection line is in the center ofthe take-off ring. (Fig. 4.6 top). The midpoint of the connection lineis assumed to be connected to the main cable through a rotationaljoint. The main cable is connected vertically to the ground station(represented by a cube). The drones accelerate on the circular runwayuntil take-off speed is achieved. Having detached from the ground,the drones are free to go up until the desired length of the main cableis reached (Fig. 4.6 bottom-left). Once that the desired length isreached, the drones (that keep rotating) are controlled in order torotate the main cable towards the wind direction (Fig. 4.6 bottom-right). After that the slope of the main cable is set, the main cablestands still, the rotation of the drones is sustained by auto-rotationthanks to the wind, and the motors (that do not require power anylonger) are used as generators.
123

CHAPTER 4. ASSESSMENT OF HIGH ALTITUDE DUALWIND ENERGY DRONE GENERATORS
Figure 4.6: Take-off ring. Two wind drones are linked by a cable at their starboardwing-tip. They accelerate along a circular landing strip using the power from themotors until take-off (top). After take-off, the two drones lift the main cable to thedesired altitude (bottom-left). At the desired altitude, the main rope is orientedtowards the wind while the two drones keep rotating (bottom-right) and finallythe generation phase can start, i. e. the main cable is kept fixed and the dronescontinue to rotate thanks to wind power while using their motors as generators.
124

CHAPTER 4. ASSESSMENT OF HIGH ALTITUDE DUALWIND ENERGY DRONE GENERATORS
4.5 Conclusions
In this chapter, the power production of a dual WED system has beenassessed by means of a set of simple algebraic equations. All the mostrelevant physical phenomena and constraints have been consideredand the computations are based on real high altitude wind data.
Being not limited by the cable aerodynamic drag, the dual winddrone system might the first Airborne Wind Energy concept thatincreases the power production with increasing altitude, thus poten-tially allowing to reach the huge power of jet streams.
Five case studies of wind drone systems having different size andflight altitude have also been analysed and their respective powercurves have been presented. The nominal power output for the con-sidered case studies range from hundreds of kW to several MW witha capacity factor of 30%.
Finally a take off ring for horizontal take-off of a dual WED systemis presented for the first time.
125

CHAPTER 4. ASSESSMENT OF HIGH ALTITUDE DUALWIND ENERGY DRONE GENERATORS
126

Chapter 5
Automatic ‘control-lineflight’ for high altitudewind energy drones
In chapter 4 a dual drone system potentially able to extract power atvery high altitudes has been introduced. Thanks to the hypothesisof axi-symmetrical flight, a single drone can be used to model anaxi-symmetric dual drone system at take-off and landing. In thischapter we describe a test campaign on a single wind drone flyinground the pole in an axi-symmetric configuration, a preliminary steptowards the completion of dual drone system. Full autonomous take-off and landing capabilities of the wind drone have been demonstratedby means of a test bench built in TU Delft, The Netherlands, andschematically shown in Fig. 5.1.
Among existing literature in Airborne Wind Energy, it is worthmentioning [186], where a concept for rotary take-off and landing ofa single glider plane has been investigated. A rotational rigid arm in-troduces energy into a suspended tethered drone by pulling the ropethat is connected to its fuselage. Also, among other literature unre-lated to renewable energy, in [187] a system of multiple quadrotorsflying round the pole is investigated.
The major differences of this work from the existing AirborneWind Energy literature are that 1) the ground station is mechani-cally passive, i. e. it does not introduce energy into the system, and
127

CHAPTER 5. AUTOMATIC ‘CONTROL-LINE FLIGHT’ FORHIGH ALTITUDE WIND ENERGY DRONES
2) the tether is not connected directly to the fuselage but it passesthrough the wing tip, following the example of the so called ‘control-line’ flight, also known as ‘u-control’ or ‘round the pole’ flight (seeFig. 5.1-bottom). During take-off and landing the drone is poweredby on-board propellers while the ground station measures the tethertension and the two angular positions (elevation and azimuth). Themeasurements are then sent in real-time to a ground laptop for mea-surement and control purposes.
Figure 5.1: CAD model of the test setup. A single drone system is used toinvestigate an axi-symmetric dual drone system at take-off.
Moreover it is important to notice that, in an attempt of proto-typing a multi drone system, crashing a multi drone system wouldincrease significantly the overall prototyping time and cost. A greatrisk of crash comes from the potential failure of any subsystem of
128

CHAPTER 5. AUTOMATIC ‘CONTROL-LINE FLIGHT’ FORHIGH ALTITUDE WIND ENERGY DRONES
each single drone that composes the assembly. For this reason it isreasonable to expect that testing and tuning each single drone, be-fore assembling the multi drone system, will help reducing the overallrisk and the prototyping time and cost. Therefore the single-dronearrangement shown in Fig. 5.1-bottom can be used to test and tuneeach drone before assembling and taking-off a multi-drone system.
In the present work, the take-off and landing phases of an axi-symmetric wind drone were fully automated. Thanks to this result,it is easier to foresee that a multi-drone system will also take-off andland autonomously. Further research activities are therefore encour-aged in this direction, with the final goal of prototyping a multi-dronesystem for jet stream wind power generation that will be able to pro-vide more power at a lower cost.
This chapter is structured as follows: first, Section 5.1 introducesthe mathematical model for a single axi-symmetric drone tetheredto a ground station, then the test setup is described in details inSection 5.2. The results of the autonomous flight tests are presentedin Section 5.3.
5.1 Dynamic model of take off and land-ing of a single drone
The drone is modelled as a point mass with aerodynamic propertiesthat is rigidly connected to the centre of rotation through an inex-tensible straight tether with constant length. As shown in Fig. 5.2,two coordinate systems are defined, the absolute coordinate system(x, y, z) that is fixed to the ground in the centre of rotation, and thedrone coordinate system (roll, pitch, yaw) that is fixed onto the quar-ter chord point of the wing of the drone so that the roll axis pointsforward, the yaw axis points starboard, and the yaw axis points downof the drone.
Notice that, since the tether passes through the wingtip and hasa tension which is an order of magnitude higher than the mass of theplane, the roll behaviour is stiffened [188, 189] and the roll coordinatecan be considered equal to the tether elevation θ. The same is truefor the yaw coordinate which can be considered equal to the tetherazimuth ϕ. In order to fully represent position and attitude, it istherefore necessary to consider only the pitch coordinate ψ, the tetherelevation θ and azimuth ϕ.
129

CHAPTER 5. AUTOMATIC ‘CONTROL-LINE FLIGHT’ FORHIGH ALTITUDE WIND ENERGY DRONES
5.1.1 Position
The position of the drone r can be represented in spherical coordi-nates with angular elevation θ, azimuth ϕ and tether length r. Thevertical axis is chosen as polar axis and the elevation coordinate θincreases downwards.
r =
xyz
=
r sin θ cosϕr sin θ sinϕr cos θ
(5.1)
Figure 5.2: Coordinate system definition. The three degrees of freedom of thedrone ψ, θ, ϕ and the Cartesian coordinates x, y, z are shown. The tether is shownas a black line. The roll, pitch, and yaw axis of the drone coordinate systemare show in red, green and blue, respectively. The reference iso-altitude line,θ = θref , is indicated with a magenta horizontal circle. The magenta dashed lineis tangent to the circle. Notice that the elevation coordinate increases downwardsby definition. For example, in this picture the coordinates of the drone are θ =35 deg, ϕ = 60 deg, ψ = 15 deg.
130

CHAPTER 5. AUTOMATIC ‘CONTROL-LINE FLIGHT’ FORHIGH ALTITUDE WIND ENERGY DRONES
5.1.2 Attitude
It is possible to define the position and attitude of the drone with3 Degrees of Freedom (D.o.F.). Following the example of [190], wedefine the Zero configuration with the tether lying on the polar axisand the roll axis pointing towards the y direction. The first rotationis defined around z with magnitude ψ, the second rotation is aroundy with magnitude θ, and the third rotation is again around z withmagnitude ϕ. The rotation matrix R that allows the transforma-tion from the Zero configuration to any configuration defined by the3 D.o.F. is therefore as follows:
R = Rz(+ϕ)Ry(+θ)Rz(+ψ) (5.2)
R =
cosϕ cos θ cosψ − sinϕ sinψ, − cosϕ cos θ sinψ − sinϕ cosψ, cosϕ sin θsinϕ cos θ cosψ + cosϕ sinψ, − sinϕ cos θ sinψ + cosϕ cosψ, sinϕ sin θ
− sin θ cosψ, sin θ sinψ, cos θ
It is worth noticing that, by definition, the x, y, z coordinates of theroll pitch and yaw unit vectors in the Zero configuration are (0, 1, 0),(0, 0, 1), (1, 0, 0), respectively. This means that the non-Zero x, y,z coordinates of the roll pitch and yaw unit vectors are the second,third and first column of the R matrix, respectively.
5.1.3 Kinematics
Now that the coordinate system is defined, we can derive the kine-matic relations between the absolute coordinates and the angularcoordinates of the drones.
Setting constant tether length (r = 0) and deriving Eq. 5.1 withrespect to time, it is possible to write the velocity of the drone v:
v = rθθ + rϕ sin θϕ (5.3)
where θ and ϕ are the normal unit vectors in θ and ϕ direction,respectively, expressed in the absolute reference system. These unitvectors, together with the third unit vector r in the tether direction,define a useful reference frame that can be related to the drone unit
131

CHAPTER 5. AUTOMATIC ‘CONTROL-LINE FLIGHT’ FORHIGH ALTITUDE WIND ENERGY DRONES
vectors (eroll, epitch, eyaw) by considering the definition of the pitchcoordinate ψ,
r = epitch
θ = eyaw cosψ − eroll sinψϕ = eyaw sinψ + eroll cosψ
(5.4)
It is then possible to write the velocity relations by substitutingEq. 5.4 in Eq. 5.3, decomposing the resulting equations in the roll,pitch and yaw directions according to v = vrolleroll + vpitchepitch +vyaweyaw, and multiplying both sides of the equations relative to theroll and yaw components by a rotation matrix of magnitude ψ. Theresulting relations in velocities are:
θ =1
r(−vroll sinψ + vyaw cosψ)
ϕ =1
r sin θ(vroll cosψ + vyaw sinψ)
(5.5)
By deriving twice Eq. 5.1, it is possible to write the acceleration ofthe drone a:
a = (−rθ2 − rϕ2 sin2 θ) r +
+ (rθ − rϕ2 sin θ cos θ) θ +
+ (rϕ sin θ + 2rθϕ cos θ) ϕ
(5.6)
Similarly to what already done with the velocities, we can write theacceleration relations by substituting Eq. 5.4 in Eq. 5.6, decomposingthe resulting equations in the roll, pitch and yaw directions accordingto a = arolleroll + apitchepitch + ayaweyaw, and multiply both sidesof the equations in the roll and yaw directions by a rotation matrixof magnitude ψ. The resulting relations in acceleration are:
θ =1
r
(−aroll sinψ + ayaw cosψ + rϕ2 cos θ sin θ
)ϕ =
1
r sin θ
(aroll cosψ + ayaw sinψ − 2rθϕ cos θ
) (5.7)
132
CHAPTER 5. AUTOMATIC ‘CONTROL-LINE FLIGHT’ FORHIGH ALTITUDE WIND ENERGY DRONES
and the expression for the acceleration in pitch direction is:
apitch = (−rθ2 − rϕ2 sin2 θ) (5.8)
5.1.4 Force balance
The following forces are considered in the force balance: tether ten-sion T , motor thrust Fm, lift L and drag D of the main wing, lift ofthe elevator Le, and gravity force Fg. With reference to Fig. 5.3, thevector expressions in the drone reference system can be written as:
T = −T epitchFm = Fm eroll
L = −L cosα eyaw + L sinα eroll
Le = −Le cosαe eyaw + Le sinαe eroll
D = −D sinα eyaw −D cosα eroll
Fg = (mg sin θ cosψ) eyaw − (mg sin θ sinψ) eroll +
− (mg cos θ) epitch
(5.9)
where α is the angle of attack, T , Fm, L, Le, D, Fg are the magnitudesof the forces.
By writing the force balance in the drone axes, Froll = maroll,Fpitch = mapitch, Fyaw = mayaw and considering the expressions ofEqs. 5.8 and 5.9, the accelerations of the drone can be derived
aroll =1
m(Fm + L sinα−D cosα+ Le sinαe −mg sin θ sinψ)
ayaw =1
m(−L cosα−D sinα− Le cosαe +mg sin θ cosψ)
(5.10)
and, from the force balance along the pitch axis, the tether forceexpression results in
T = m (rθ2 + rϕ2 sin2 θ − g cos θ) (5.11)
5.1.5 Relative wind velocity and angles of attack
With reference to Fig. 5.3, the magnitude of the relative speed at themain wing, va, and the angles of attack on the main wing, α, and on
133

CHAPTER 5. AUTOMATIC ‘CONTROL-LINE FLIGHT’ FORHIGH ALTITUDE WIND ENERGY DRONES
Figure 5.3: Force balance at the wind drone. View along the tether direction.The balance lies on the θ-ϕ plane. The forces are shown in black. The roll andyaw axes of the drone reference system are shown in grey. The velocity trianglesare shown in red.
the elevator, αe, are computed as
va =√v2roll + v2yaw
α = arctan
(vyawvroll
)
αe = arctan
(vyaw + lfeψ
vroll
) (5.12)
notice that the airflow velocity at the elevator is assumed equal tothe airflow velocity at the main wing for the sake of simplicity, whilethe angle of attack of the elevator is considered different to take intoaccount the natural stabilization of the pitch motion.
5.1.6 Aerodynamic coefficients and forces
The aerodynamic lift coefficients of the main wing, CL, and of theelevator, CLe, are computed assuming inviscid flow (Re → ∞), el-liptical wings, symmetric airfoils, constant wing profiles and no wing
134

CHAPTER 5. AUTOMATIC ‘CONTROL-LINE FLIGHT’ FORHIGH ALTITUDE WIND ENERGY DRONES
twist. The drag coefficient, CD, is assumed constant.
CL = CL0 +2πα
1 + 2/ÆR
CLe =2παe
1 + 2/ÆRe
(5.13)
Where the coefficient CL0 represents the angle of incidence and thetrim of the main wing. ÆR and ÆRe are the aspect ratios of the mainwing and of the elevator, respectively. The magnitude of the aerody-namic forces are therefore
L =1
2ρv2aCLA
D =1
2ρv2aCDA
Le =1
2ρv2aCLeAe
(5.14)
where ρ is the air density, A and Ae are the areas of the main wingand of the elevator, respectively.
5.1.7 Pitch motion dynamics
With reference to Fig. 5.3, the dynamics of the pitch D.o.F., ψ, aremodelled taking into account the pitch moment of inertia of the air-craft around the tether attachment point, J , the moment on the air-craft generated by the elevator lift, Me, and the stabilizing momenton the aircraft generated by the gravity force, Mg. The momentbalance on the quarter cord of the main wing is
Jψ = +Me +Mg
Me = −lfe Le cosαe
Mg = −mg d sinψ
(5.15)
where lfe is the distance between the tether attachment point onthe fuselage (quarter cord of the main wing) and the elevator aero-dynamic centre (quarter cord of the elevator) and d is the distance
135

CHAPTER 5. AUTOMATIC ‘CONTROL-LINE FLIGHT’ FORHIGH ALTITUDE WIND ENERGY DRONES
between the aerodynamic centre of the main wing and centre of grav-ity. Notice that the centre of gravity is below the aerodynamic centreand that it is assumed zero aerodynamic moment from the main wing.
5.1.8 Horizontal steady-state flight
In the simple case of steady-state flight at constant elevation angle,the dynamic equations reduce to this trivial set of four algebraicrelations: two of them are steady state equilibrium conditions
D = Fm
L = mg sin θ(5.16)
and two of them are the definitions of the aerodynamic forces
D =1
2ρv2aCDA
L =1
2ρv2aCLA
(5.17)
These equations can be solved explicitly by knowing the motor thrustFm, then finding in this order D, va, L, θ. It is interesting to noticethat from Eqs. 5.16 and 5.17 the following relation can be obtained:
L = FmCLCD
and that, with the additional hypothesis of θ close to 90 deg,
θ ≈Fm
CL
CD
mg
5.1.9 Pitch stability
In the real flights, the drone tends to fly horizontally without pitchactuation. This intrinsic pitch stability is given in the dynamic modelby the Mg component of Eq. 5.15. Setting to zero the offset d, or set-ting the centre of gravity above the aerodynamic center, immediatelyresults in an unstable set of equations.
136

CHAPTER 5. AUTOMATIC ‘CONTROL-LINE FLIGHT’ FORHIGH ALTITUDE WIND ENERGY DRONES
5.1.10 Altitude stability
Some important information about the altitude stability of controlline flight can be easily understood from the horizontal steady-statecase, i.e. when the drone is flying at a constant flight velocity. Inparticular the flight is stable in altitude when θ > 90 deg (dronebelow the horizontal plane that passes through the ground attach-ment point of the tether) but it is unstable when θ < 90 deg (droneabove the ground station, towards the zenith). This can be explainedby perturbing the vertical force equilibrium of the steady-state case(fourth equation in Eqs. 5.16). For example, if the drone is below theground station, a displacement down (i. e. an increase in θ), decreasesthe mg sin θ component while the lift L is constant. The vertical bal-ance is then dominated by L that brings the drone up, thus keepinga stable altitude. Conversely, in case θ < 90 deg, a displacement up(i. e. a decrease in θ) generates an unstable behaviour due to, again,lower gravity and same lift that brings the drone further up.
A simple feedforward controller can be used if the elevation angleis below the ground station and this is well confirmed by experimentalresults. Moreover, we foresee that a feedback controller is mandatoryin order to manoeuvre the drone in the upper region of its workingspace, however further test campaigns are needed to experimentallyvalidate this statement.
5.1.11 Faster than real time integration
The dynamic equations can be integrated for control or simulationpurposes by following this sample procedure. First the initial posi-tions and the initial roll and yaw velocity are set, then the angles ofattack and the aerodynamic forces are computed with Eqs. 5.12, 5.13and 5.14. By knowing the motor thrust and the gravity force, the ac-celerations in the drone reference frame are computed with Eq. 5.10.Integrating those in time gives the velocities which can be in turnintegrated to yield the ψ, θ, ϕ coordinates by means of Eq. 5.5.
5.2 Test setup
As introduced in Fig. 5.1, a rotary single-drone take-off system is auseful first step towards the experimental validation of a multiple-drone axi-symmetric take-off system.
137

CHAPTER 5. AUTOMATIC ‘CONTROL-LINE FLIGHT’ FORHIGH ALTITUDE WIND ENERGY DRONES
A detailed description of the single-drone test setup is summarizedin Fig. 5.4. The setup is composed by a ground station and a rotatingtethered drone having full automatic take-off and landing capabilities.
Figure 5.4: Schematics of the test setup.
The drone is a revised version of a control-line model plane, there-fore it does not have roll and yaw actuation capabilities, and it fea-tures only one actuator for the pitch command. Nose-up is achievedwhen both the ailerons are moved downward and the elevator ismoved upward at the same time. Conversely, nose-down is achievedby actuating the ailerons up and the elevator down. Besides the pitchactuator, a battery, an electric engine, a flight controller and a radioreceiver and transmitter are also fitted on board the plane.
The ground station is shown in Fig. 5.5. It is composed by arotor assembly (highlighted in blue) and a stator (not highlighted).The stator is a heavy fixture that allows a maximum tether force of9.6 kg before tilting. The rotor passively follows the azimuth andelevation position of the drone. The whole rotor rotates in azimuthwhile the top mechanical link (highlighted with a green box) passivelyfollows also the elevation angle of the drone. Thanks to two absolutemagnetic encoders and a load cell, the ground station measures in realtime the azimuth angle, the elevation angle and the tether tension.A rotating electronic assembly then performs the data acquisitionand sends the measured data to a laptop computer via a wireless
138

CHAPTER 5. AUTOMATIC ‘CONTROL-LINE FLIGHT’ FORHIGH ALTITUDE WIND ENERGY DRONES
Figure 5.5: Functional CAD model of the ground station.
connection.The laptop is able to receive at the same time the data coming
from the ground station and the data coming from the plane. A softreal time controller running on the laptop at 60 Hz sends the throttleand nose-up commands to a microcontroller through a serial interface.The microcontroller first converts the commands to a Pulse PositionModulation (PPM) signal and then sends them to a standard radiocontrol for model planes. The radio control finally forwards the signalto the drone. If compared to a custom electronic design, feeding aPPM signal to a standard radio control allows a quick setup of areliable wireless communication from the laptop to the drone, withthe disadvantage of a longer actuation time.
A picture of the overall setup is shown in Fig. 5.6 and a list oftechnical details is available in Table 5.1.
5.3 Automatic flight results
A fully automatic ‘take off - fly - land’ sequence can be achieved byusing the test setup introduced in Section 5.2. Figs. 5.7 and 5.8 showthe time history of two consecutive sequences performed in laboratoryenvironment (without wind) with a simple feed-forward controller (avideo is available in [191]).
During the ‘take-off’ sequence, the throttle increases until a suit-able take-off speed is reached, then the nose-up command is increasedand the drone takes-off. During the ‘flight’ sequence a simple pro-portional feed-forward controller tracks three different altitudes by
139

CHAPTER 5. AUTOMATIC ‘CONTROL-LINE FLIGHT’ FORHIGH ALTITUDE WIND ENERGY DRONES
Ground stationBase mass 20 kgTilting tether pull 94 NSafe operating pull 78 NLoad cell Futek monoaxial FSH00107 with cus-
tom amplifier, accuracy ± 0.2 NEncoders Absolute magnetic Mouser AEAT6012-
A06, accuracy ± 0.1 degBattery Lipo 3000 mAh 3S 25C 11VoltsAcquisition board Udoo Neo based on ARM Cortex-M4
200 MHzDroneWingspan 0.6 mTotal mass 0.74 kgMax recorded flightspeed
17.2 m/s (62 km/h)
Flight radius 2.8 m (centre of rotation to fuselage)Tether Dyneema braided, 0.5mm, max 225 NPropeller Xoar wooden, size 9x4”Drone electronicsFlight controller PixhawkRC receiver Spektrum AR610ESC Turnigy Multistar V2 OPTO 40 AmpsMotor Turnigy Aerodrive 3530 24 AmpsBattery Lipo 3000 mAh 3S 25C 11VoltsServo Corona 919MG, actuation time 0.06 secControllerLaptop controller Simulink basedPPM converter Udoo Neo based on ARM Cortex-M4
200 MHzRadio transmitter Spektrum DX6i
Table 5.1: Details of the test setup.
140

CHAPTER 5. AUTOMATIC ‘CONTROL-LINE FLIGHT’ FORHIGH ALTITUDE WIND ENERGY DRONES
Figure 5.6: The automatic model ready to fly at the Cyber-Zoo facility of TUDelft.
controlling the throttle only. Finally, in the ‘landing’ sequence thedrone is slowed down until it almost touches the ground, then a fullnose-down command is given and the throttle is removed.
Considering the simple feed-forward controller, the overall se-quence is remarkably repeatable. It is possible to tune the steady-state model presented in Section 5.1 in order to validate experimentaldata in steady-state conditions. Using CL and CD as calibration pa-rameters, the results are shown in Table 5.2.
Steady state flight (θref = 95 deg)
Flight speed, rϕ 12 m/s measuredFlight altitude, θ 95 deg simulated 94.7 deg, measured
95 deg ±0.5 degTether force, T 36 N simulated 38 N, measured 36 N
±1 NMotor thrust, Fm 1.96 N Measured at zero flight speedLift coefficient, CL 0.92 () Estimated by matching the el-
evation angleDrag coefficient,CD
0.25 () Estimated by matching theflight speed
Table 5.2: Steady state flight, model validation.
141

CHAPTER 5. AUTOMATIC ‘CONTROL-LINE FLIGHT’ FORHIGH ALTITUDE WIND ENERGY DRONES
Figure 5.7: Automatic flight. The charts show the measurements from two con-secutive automatic ‘take off - fly - land’ sequences. The measured tether tensionis shown (top), together with flight speed (middle) and the azimuth (bottom).
142

CHAPTER 5. AUTOMATIC ‘CONTROL-LINE FLIGHT’ FORHIGH ALTITUDE WIND ENERGY DRONES
Figure 5.8: Automatic flight. The charts show the results from two consecutiveautomatic ‘take off - fly - land’ sequences. In each sequence, take off is performedfirst, then the drone tracks elevation angles θ of 95, 90.5 and 96.5 degrees andthen the drone lands. The chart shows throttle command (top), nose-up command(middle) and elevation angle (bottom).
143

CHAPTER 5. AUTOMATIC ‘CONTROL-LINE FLIGHT’ FORHIGH ALTITUDE WIND ENERGY DRONES
Motor thrust, FmThrottle 45% 1.37 NThrottle 50% 1.86 NThrottle 55% 1.96 NThrottle 70% 3.43 NThrottle 100% 4.90 N
Table 5.3: Experimental motor thrust of the drone, measured at zero flight speed.
5.4 Conclusions
Recent literature suggests that the so called ‘dancing drone’ (or dualdrone) concept might be the first system able to reach altitudes ofseveral thousand meters where the jet streams carry extremely largepower densities, more than 15.5 kW/m2 for 30% of the time. Be-cause of this, the dancing drone concept is potentially an interestingstarting point to build an ultra low cost wind turbine.
In this chapter the take off and landing for the dancing droneconcept has been investigated by means of a rotating drone in axi-symmetrical configuration following the example of control line flight.A dynamic model has been developed, and the flight stability wasdiscussed.
Full automatic take-off and landing capabilities were experimen-tally demonstrated and two sample ‘take off - fly - land’ sequencesare reported. Given the flight stability and the repeatability of thesequences, the dual drone system is foreseen to have autonomoustake-off and landing capabilities and further research in this direc-tion is highly encouraged.
144

Conclusions and futurework
At several thousand meters above sea level, jet streams currents canreach power densities as high as 15 kW/m2 (i. e. from 50 to 100times more powerful than at 100 m altitude) with typical availabilityof more than 30%. In the attempt to exploit this resource, in the lastdecade several companies and research organizations patented anddeveloped diverse principles and technical solutions for the imple-mentation of the so called Airborne Wind Energy Systems (AWESs).These systems appear exceptionally promising from the point of viewof: 1) increased power production, because of the high power densityand high capacity factors and 2) reduced structural mass (10 to 50times lighter than conventional wind turbines), thanks to the tensileloading conditions.
On the downside, current AWESs require large airspace, they canraise safety issues, and might face Not In My Back-Yard (NIMBY)effect. For these reasons, deep-offshore floating AWESs may takeadvantage of both the lightweight design of AWESs and the hugeavailability of low-cost sites for the installation of floating structures.In this thesis the dynamics of an offshore floating AWES has been in-vestigated with two models: the first couples the aircraft steady statecrosswind model with one DoF hydrodynamics of a floating platformheld in place by a catenary mooring line; the second couples a 4-DoF model for Ground-Gen AWESs with a multi-DoF hydrodynamicmodel for the floating platform with catenary mooring. The possi-bility of extracting combined wind-wave power has been investigatedand an open source simulator has been released.
Possible future work, actually fundamental steps towards a com-
145

CHAPTER 5. AUTOMATIC ‘CONTROL-LINE FLIGHT’ FORHIGH ALTITUDE WIND ENERGY DRONES
mercial scale floating generator, includes a thorough assessment ofdifferent kinds of floating platforms and mooring systems in a simula-tion environment, followed by a series of small scale implementationsof small scale floating AWESs.
Another important factor that is currently limiting the potentialof AWESs is represented by the cable aerodynamic drag. In orderto reach higher altitudes a longer cable is of course needed. How-ever the gain in power provided by the wind at higher altitude isnot enough to compensate the loss in power, through the cable drag,that increases with the cable’s length. Several concepts have there-fore been proposed and patented to overcome this limitations andachieve near-zero cable drag. One of these concepts is a system ofdrones tethered according to a special layout that theoretically allowsto overcome the physical burden of the aerodynamic drag. Based onsuch a concept, a multi Wind Energy Drone (WED) system has beeninvestigated. A set of simple algebraic equations has been used toassess the power production and the most relevant physical phenom-ena and constraints have been considered. The proposed analyticalmodel shows that, being not limited by the cable aerodynamic drag,the jet stream altitude wind drone system might be the first AirborneWind Energy concept that increases the power production with in-creasing altitude, thus allowing to reach the unprecedented powerof jet streams. A power curve of a jet stream altitude wind dronesystem based on real wind data in Saudi Arabia is also shown. Com-paring to the 1.5 MW of a wind turbine that has blade length equalto the wing-span of each drone, or to the 0.6 MW forecast of a singlewind drone (Google-Makani concept), this study foresees a power pro-duction of 15 MW from a large scale jet-stream-altitude wind dronesystem with a capacity factor of 30%. In order to get one step closerto such a multi WED system, a novel take-off and landing method fora system of multiple WEDs has been investigated by means of a ro-tating drone in axi-symmetrical configuration, following the exampleof control line flight. A dynamic model has been developed, and theflight stability has been discussed. A small scale test setup has beenbuilt allowing to experimentally demonstrate full automatic take-offand landing capabilities. Two sample ‘take off - fly - land’ sequencesare reported. Given the flight stability and the repeatability of thesequences, a multi WED system is foreseen to have autonomous take-off and landing capabilities and further research in this direction ishighly encouraged.
146

CHAPTER 5. AUTOMATIC ‘CONTROL-LINE FLIGHT’ FORHIGH ALTITUDE WIND ENERGY DRONES
As regards multi WEDs systems, future work towards a smallscale demonstrator can be divided in four parallel frameworks:
1. A control subsystem, composed of model planes with on-boardbatteries, should demonstrate the capability of taking-off/landingthe multi WED system but, most importantly, it should demon-strate the capability of keeping the desired set-points in terms ofinclination and tension of the main tether, at first in a laboratoryenvironment, and then in real wind conditions.
2. An on-board generation subsystem that allows to generate powerfrom the relative wind should be built following the examples ofexisting Fly-Gen AWESs;
3. An electro-mechanical tethering system should resist the structuralloads while providing and receiving electricity between the groundstation and the on-board generation subsystem. A custom-builtsmall scale setup in a laboratory environment might allow a rela-tively fast development of this subsystem;
4. A ground station assembly should be built. It should be ableto handle the cables and resist the structural loads, while safelytransmitting the electrical power.
Finally, these four subsystems should be assembled together in orderto create a fully-functional small scale prototype that should be usedto demonstrate power production at different altitudes and should beused to measure the power productivity of the multi WED system.Measuring the power output, together with the wind conditions andother relevant information, plays a fundamental role in the overalltechnology development process in that it allows data-driven forecastsabout the productivity at larger scale and higher altitude by meansof validated power curves.
147

CHAPTER 5. AUTOMATIC ‘CONTROL-LINE FLIGHT’ FORHIGH ALTITUDE WIND ENERGY DRONES
148

Appendix A
How to use the opensource multi d.o.ffloating offshore AWEsimulator
This chapter explains how to use the simulation tool based on themodel described in chapter 3 with a step by step guide. The sourcecode of the simulator and a sample video is available at [11].
A.1 Step by step guide
The simulation is divided into five phases as shown in Fig. A.1. Givena buoy geometry, a first hydrodynamic preprocessing is performedwhere the hydrodynamic coefficients are found (see Section A.2), aninput script is called where all the useful data is defined, then a time-domain integrator processes the input generating the output, andfinally the results are shown thanks to a postprocessing script (seeSection A.6).
149

APPENDIX A. HOW TO USE THE OPEN SOURCEMULTI D.O.F FLOATING OFFSHORE AWE SIMULATOR
Figure A.1: Main simulator script The simulation tool runs first the input file,then launches the Simulink time domain integration and finally shows the results.
150

APPENDIX A. HOW TO USE THE OPEN SOURCEMULTI D.O.F FLOATING OFFSHORE AWE SIMULATOR
A.2 Hydrodynamic preprocessing
Every time the geometry is changed, a manual phase of hydrody-namic preprocessing is needed to compute the hydrodynamic coef-ficients of the floating platform. The hydrodynamic preprocessingis not needed if the platform geometry is not changed because it isvalid for different sea state conditions, mooring and kite data. Thehydrodynamic preprocessing is in turn composed by three phases,first the hydrodynamic coefficients are computed with a commercialBEM software such as WAMIT, NEMOH or AQWA (Fig. A.2), thena state space model identification is performed in order to build adynamic system that has the proper response with a wide-spectrumwave input, (Fig. A.3) finally, the original system and the identifiedsystem response is checked (Fig. A.4).
Once this is done, a faster than real time simulation tool is avail-able for first design iterations.
Figure A.2: Computation of the hydrodynamic coefficients A commercial BEMsolver is used to compute the hydrodynamic coefficients at different frequencies.
A.3 Input simulation options
The simulation file MAIN simulator.m allows to choose the followingoptions.
• plotplot.animation on switches on/off the animation pane (Fig. A.5)when set to 1 or 0, respectively.
• plotplot.verbose plot on switches on/off the detail plots (Fig. A.6).
151

APPENDIX A. HOW TO USE THE OPEN SOURCEMULTI D.O.F FLOATING OFFSHORE AWE SIMULATOR
Figure A.3: State space identification. The state space identification is performed.
Figure A.4: Validation of the resulting reduced model. The reduced model isvalidated.
152

APPENDIX A. HOW TO USE THE OPEN SOURCEMULTI D.O.F FLOATING OFFSHORE AWE SIMULATOR
• kite force on decouples the kite and the platform so that thekite is affected by the platform motion but the platform dy-namics are not affected by the kite force. This option is usefulto investigate how the kite affects the floating platform.
• waves on switches on and off the waves. This option allows tochoose between calm sea and sea with waves.
• platform displacement on switches on and off the platform mo-tion regardless of the forces that are applied to the platform.This option is useful to investigate how the floating platformmotion affects the kite dynamics.
A.4 Input platform and mooring data
In the file AWEC input.m the following parameters related to thefloating platform can be chosen:
• h is the water depth in m. Only values higher than 20 m areacceptable because the hydrodynamics of the platform are com-puted in deep water conditions,
• geom.pc is the 3d vector expressing the cable output point po-sition in platform coordinates.
• ss type sets the sea state type. 0 indicates monochromatic reg-ular waves and 1 indicates polychromatic irregular waves;
• T is the wave period for regular waves or the energy period (Te)for irregular waves;
• H is the wave height for regular waves or the significant waveheight (Hs) for irregular waves;
• Lm is the length of the mooring line in m;
• x plat initial is the initial x coordinate (m);
• y plat initial is the initial y coordinate (m);
The script load platform.m loads the following geometry data andBEM results:
• D (m) barge diameter;
153

APPENDIX A. HOW TO USE THE OPEN SOURCEMULTI D.O.F FLOATING OFFSHORE AWE SIMULATOR
• l (m) total height (draft plus emerged part);
• d (m) nominal draft;
• W (rad/s) vector of angular frequencies;
• GAMMA matrix, the rows correspond to different frequencies,and columns are the wave excitation loads per unit wave ampli-tude. GAMMA(:,1:3) is in (N/m), GAMMA(:,4:6) is in (Nm/m);
• PHASE g are the corresponding frequency-dependent phase an-gles (rad) of the wave excitation loads on the different DoFs;
• MINF is the infinite-frequency added-mass matrix;
• Arad, Brad, Crad, Drad are state-space matrices for radiationloads.
A.5 Input kite data
In the file AWEC input.m the following parameters can be chosen.
• data.Vw sets the wind speed in m/s;
• data.E sets the equivalent aerodynamic efficiency (non dimen-sional);
• data.rho a sets th air density in kg/m3;
• data.Ak sets the area of the kite in m2;
• data.CL sets the lift coefficient of the kite (non dimensional);
• data.gk sets the proportional factor of the turn rate law [138]in rad/m;
• psi0 sets the initial ψ coordinate in rad;
• theta0 sets the initial θ coordinate in rad;
• fi0 = sets the initial ϕ coordinate in rad;
• L0 = sets the initial flying cable length in m;
• contr.kPg sets the gamma proportional control gain [33];
154

APPENDIX A. HOW TO USE THE OPEN SOURCEMULTI D.O.F FLOATING OFFSHORE AWE SIMULATOR
• contr.initial att p sets the initial attraction point of the switch-ing control algorithm. It can be either 1, 2, 3 or 4.
• contr.fi is a vector containing the ϕ coordinates of the fourattraction points in rad.
• contr.theta is a vector containing the θ coordinates of the fourattraction points in rad.
• contr.fi th is a vector containing the thresholds of the ϕ coor-dinate for the switching condition expressed in rad ;
• contr.theta th is a vector containing the thresholds of the θcoordinate for the switching condition expressed in rad;
• contr.type sets the reel-out control strategy: 1 indicates forcecontrol while 2 indicates velocity control;
• contr.Vr0 sets the reel-out speed (expressed in m/s) in casecontr.type is equal to 2.
• contr.Fk0 sets the force set-point (expressed in N) in case thevariable contr.type is equal to 1.
• contr.kPf is the kite force proportional gain and is used only ifcontr.type is equal to 1.
• contr.Vr in sets the reel-in speed in m/s.
• contr.L min sets the reel-in to reel-out threshold in the cablelength;
• contr.L max sets the reel-out to reel-in threshold in the cablelength.
A.6 Simulation results
To get the results it is sufficient to run the file MAIN simulator.mfrom the Matlab environment. The animation pane shown in Fig. A.5will pop up together with the plots of the results (Fig. A.6).
The animation pane (Fig. A.5) shows three figures. The top leftfigure shows a close view of the motion of floating platform. In thisfigure also a small part of the mooring line and of the flying tether
155

APPENDIX A. HOW TO USE THE OPEN SOURCEMULTI D.O.F FLOATING OFFSHORE AWE SIMULATOR
Figure A.5: Animation of the Offshore AWES Simulator. The animation pop upis composed by a set of 3 subplots, showing the floating platform view (top left),the aerial kite view (top right) and the underwater mooring line view (bottomleft).
are shown. The top right figure shows a far aerial view of the kiteand flying tether. The bottom left figure shows a far submarine viewof the mooring line.
Finally the postprocessor shows the main simulation results bymeans of a set of plots (see Fig. A.6):
• Plot n. 1 shows the time history of the platform displacements,
• Plot n. 2 shows the time history of the platform rotations,
• Plot n. 3 shows the top view of the x-y platform trajectory,
• Plot n. 4 shows the kite trajectory as viewed looking towardsthe wind direction,
• Plot n. 5 shows the time history of the tether length,
• Plot n. 6 shows the non dimensional steering input to the kite,
• Plot n. 7 shows the time history of the tether force,
156

APPENDIX A. HOW TO USE THE OPEN SOURCEMULTI D.O.F FLOATING OFFSHORE AWE SIMULATOR
Figure A.6: Output plots of the Offshore AWES Simulator. A set of 9 plots isshown. 1) Platform displacements; 2) Platform rotations; 3) Platform trajec-tory - top view; 4) Kite trajectory - view towards the wind direction; 5) Tetherlength; 6) Non dimensional steering input; 7) Tether force; 8) Coupled motion;9) Mechanical power output.
157

APPENDIX A. HOW TO USE THE OPEN SOURCEMULTI D.O.F FLOATING OFFSHORE AWE SIMULATOR
• Plot n. 8 represents the coupled motion according to the defi-nition given in Eq. 3.17,
• Plot n. 9 shows the time history of the mechanical power output.
158

Appendix B
Cables for AirborneWind Energy
As introduced in Chapter 1, the tethering system represents a ma-jor challenge in the development of Airborne Wind Energy Systems.There are several reasons for this. The tether has a large aerodynamicdrag and therefore has a major effect on the overall aerodynamic per-formance of the AWES and also on the aerodynamic design of the air-craft. The tether has to withstand important structural loads and insome cases it has to carry electricity for on-board actuation or powertransmission. The tether wear is likely to be an important designfactor in many large scale designs. Finally a tether is not straightfor-ward to handle automatically. As for the material, common choicesfor AWESs tether are UHMWPE (known commercially as Dyneema)or Kevlar.
This appendix describes a model to predict the shape of a tetherin crosswind flight. Important shape parameters such as the anglewith respect to the aircraft are derived.
B.1 Cable sag 2D steady state model
This section briefly shows the results of the application of a sim-ple 2D model for computing the kite tether sag under steady stateaerodynamic loading [124].
The model computes analytically the tether shape by assuming
159

APPENDIX B. CABLES FOR AIRBORNE WIND ENERGY
constant tension along the tether and a relative wind velocity thatvaries linearly along the length as shown in Fig. B.1.
Figure B.1: Triangular relative wind Simplest hypothesis on wind distribution.
B.1.1 Differential steady state model at constanttension
Assuming constant tether length and no inertia forces along the tetheras shown in Fig. B.2, it is possible to derive the analytical equationfor the tether sag. The aerodynamic force is assumed perpendicularto the undeformed tether shape and the deflection is assumed small.The undeformed tether lies on the x axis.
Figure B.2: Differential model Steady state 2D tether model.
In this section the 2D steady state tether model is analyzed in thefollowing cases:
• Without gravity, constant air density, ρ
160

APPENDIX B. CABLES FOR AIRBORNE WIND ENERGY
• Without gravity, variable air density
• With gravity, constant air density
B.1.2 Without gravity, constant ρ
With reference to Fig. B.2, the vertical equilibrium equation of theinfinitesimal element can be written as
T sin
(∂y
∂x
∣∣∣∣x+dx
)− T sin
(∂y
∂x
∣∣∣∣x
)+ dFaer = 0 (B.1)
Where T is the tether tension and dFaer is the aerodynamic forceacting on the infinitesimal piece of tether. Assuming small tethersag, y, and small sag derivative, ∂y/∂x, the equation can be furthersimplified to the first order and becomes:
T∂2y
∂x2dx = −dFaer (B.2)
Considering
dFaer = −1
2ρVR(x)2Cdcd dx (B.3)
VR(x) = Vkx
r(B.4)
where VR(x) is the relative wind velocity acting along the tether, Cdcis the tether perpendicular drag coefficient, d is the tether diameter,Vk is the kite velocity and r is the tether length, the equation becomes:
T∂2y
∂x2=
1
2ρV 2
k
x2
r2Cdcd (B.5)
The integration of equation B.5 along the tether length, with bound-ary conditions y(0) = y(r) = 0, yields:
y(x) =1
2ρV 2
k Cdcd1
T
(x4 − r3x)
12r2(B.6)
Equation B.6 represents the tether shape. Notice that, because ofthe assumption of small tether sag, the overall tether length is notstrictly preserved.
161

APPENDIX B. CABLES FOR AIRBORNE WIND ENERGY
The angle between the undeformed tether shape and the deformedshape at the kite-tether joint can be computed
ω = arctan
(∂y
∂x
∣∣∣∣r
)= arctan
(1
2ρV 2
k Cdcd3r
12T
)(B.7)
and the maximum displacement can also be obtained
∂y
∂x= 0 (B.8)
xmax = r3
√1
4≈ 0.63r (B.9)
ymax =1
2ρV 2
k Cdcdr2
16T3
√1
4(B.10)
This means that the maximum displacement is located at 63 % of thetether length, regardless of all the other variables.
B.1.3 Without gravity, variable ρ
In case variable air density along the tether is taken into account,equation B.5 becomes:
T∂2yρ∂x2
=1
2ρ(x)V 2
k Cdcdx2
r2(B.11)
Equation B.11 can be easily integrated numerically or can be writtenin an analytical form by defining
ρ(x) = ρ+ ∆ρ(x, β) (B.12)
k =1
2V 2k Cdcd
1
r2T(B.13)
where β is the elevation angle at which the kite flies. The integral ofequation B.11 is
yρ(x) = y(x) + ∆yρ(x) =1
12kρx4 + k
∫∫∆ρ(x, β)x2dx2 (B.14)
plus the boundary conditions yρ(0) = 0 and yρ(r) = 0.
162

APPENDIX B. CABLES FOR AIRBORNE WIND ENERGY
It is possible to define the error in the maximum displacementobtained by considering a variable air density (taking into accountthe altitude) with respect to the case in which air density is consideredconstant.
errρ =∆yρ(x)
y(x)
∣∣∣∣x=xmax
=
[∫∫∆ρ(x, β)x2dx2
]∣∣x=xmax
112x
4maxρ
(B.15)
From equation B.15 it is interesting to notice that the error errρdepends only on r, ρ and β.
B.1.4 With gravity, constant ρ
In case the gravity force is added to the aerodynamic force in thedifferential model, equation B.5 becomes:
T∂2yg∂x2
=1
2ρV 2
k Cdcdx2
r2+ gml (B.16)
where ml is the mass per unit length of tether.The integral of equation B.16 represents the tether shape and is
yg(x) = y(x) + ∆yg(x) =1
2ρV 2
k Cdcd1
T
(x4 − r3x)
12r2+
1
2
gml
T
(x2 − rx
)(B.17)
It is possible to define the error in the maximum displacementobtained by considering the gravity effect with respect to the case inwhich gravity force is neglected.
errg =∆yg(x)
y(x)
∣∣∣∣x=xmax
=16 gml
(3
√14 − 1
)ρV 2
k Cdcd(B.18)
B.1.5 Numerical results
For the case of a kite flying crosswind in the conditions defined inTab. B.1, the results are shown in Figs. B.3 and B.4.
The angle ω at the kite-tether joint (which is zero when the tetheris a straight line) is:ω = 11.08 deg (analytical value - without gravity, constant ρ)ω = 10.67 deg (numerical value - without gravity, variable ρ)ω = 11.77 deg (analytical value - with gravity, constant ρ )
163

APPENDIX B. CABLES FOR AIRBORNE WIND ENERGY
Simulation data
Air density ρ = 1.225 kg/m3
Kite velocity Vk = 80 m/sCable diameter d = 0.020 m
Cable drag coefficient Cdc = 1Tension in the rope T = 100000 N
Cable length r = 1000 mElevation angle β = 30 deg
Table B.1: 2D tether model data
Figure B.3: Cable sag Cable sag of a kite tether. The world coordinates, xw andyw, have the same scale
164

APPENDIX B. CABLES FOR AIRBORNE WIND ENERGY
Figure B.4: Cable sag Cable sag shown in the tether reference system, x and y.Deformation is emphasized.
The difference of the maximum displacement obtained with vari-able air density (from International Standard Atmospheres (ISAs)table) with respect to the maximum displacement obtained with con-stant air density is errρ = 3.19%.
The difference of the maximum displacement obtained with grav-ity with respect to the maximum displacement obtained without grav-ity (with constant air density in both cases) is errg = −9.83%.
B.2 Partitioned tether fairing
As explained in section 1.6, tether aerodynamic drag represents animportant physical limit in the development of AWESs, thereforethis section describes a novel tether concept aimed at overcoming thetether drag issue.
B.2.1 Concept
Cable fairing is a well known technique that allows to reduce thetether drag and is used in a wide variety of applications, especiallyunderwater [192, 193, 194]. Cable fairing has the potential to reduce
165

APPENDIX B. CABLES FOR AIRBORNE WIND ENERGY
substantially aerodynamic drag while solving the stability issues ofstreamlined cross-sections. A summary of the potential advantagesthat can be achieved thanks to tether fairing are shown in Fig. B.5.
Figure B.5: Potential reduction in tether drag The drag coefficients, Cd, com-puted with reference to the section thickness are shown. Cable fairing may leadto a 15-25 folds decrease in tether drag thus increasing substantially (possibly bya factor of two or three [123]) the power output of a crosswind AWE generator.
The proposed solution is shown in Fig. B.6 and a mock-up isrepresented in Fig. B.7. Several independent faired sections are freeto rotate around the inner tether and their position is ensured by theuse of rings that are fixed to the tether. Some backlash will allow thetether to align with the wind direction with minimal aerodynamicforce. This concept is similar to other submarine concepts [193].
Figure B.6: Partitioned fairing The partitioned fairing concept exploits knowntechnology applying it to the AWE field.
166

APPENDIX B. CABLES FOR AIRBORNE WIND ENERGY
Figure B.7: Mock-up of the partitioned fairing concept. A 9 mm ropes passesthrough the fairing section: a streamlined NACA0020 symmetrical profile.
B.2.2 Experimental procedure
The experimental procedure described in this section aims at inves-tigating the large scale behavior of faired tethers for AWE systemsthrough small scale measurements as shown in Fig. B.8. Each inde-pendent faired subsection can be modeled with a multi D.o.F. system,for example two coordinates in the plane of the relative airflow anda third coordinate representing the rotation of the section about thetether axis, and the model coefficients can be measured experimen-tally at small scale. The full scale behavior can then be rigorouslysimulated.
Figure B.8: Experimental procedure for aerodynamic tether measurements.Thanks to small scale measurements it is possible to simulate the dynamics oflarge scale systems.
167

APPENDIX B. CABLES FOR AIRBORNE WIND ENERGY
Figure B.9: Modeling fairing dynamics for AWESs Cable fairing is modeled with amulti D.o.F. aeroelastic system and the coefficients are measured experimentally.
This kind of test can be performed with different facilities, e.g. awind tunnel campaign or by means of a laboratory car. This lattercase, being relatively inexpensive, is here explored in more detail.
Such a laboratory car should be equipped with load cells for mul-tiaxial force measurements and an high speed camera to measure thetime history of the tether degrees of freedom by means of computervision algorithms (see Figs. B.10 and B.11). Differential measure-ments with a reference tether are an important validation tool. Itis easy to show that inertial loads of the moving vehicle are not anissue.
Figure B.10: Experimental setup for partitioned low-drag tether concept A spe-cially equipped laboratory car is used for data acquisition.
The fixtures on the laboratory car must be positioned at a sig-nificant distance from the car roof in order to make the fairing workin a reasonably undisturbed flow. A sample analysis of such a flowis shown in Fig. B.12. A slightly disturbed flow is visible at a dis-tance of 1 m from the roof at low speed (around 60 km/h). Further
168

APPENDIX B. CABLES FOR AIRBORNE WIND ENERGY
Figure B.11: Experimental setup details Load cells for multiaxial differentialmeasurements are shown together with an high speed camera. Markers along thetether could also be used to effectively measure the tether position with computervision techniques.
CFD investigation is needed to asses the minimum vehicle velocityat which the test can be considered in undisturbed flow in the realsetup.
169

APPENDIX B. CABLES FOR AIRBORNE WIND ENERGY
Figure B.12: Simplified vision analysis of the airflow around a sport car andfamily car. At low speed the flow at 1 meter height is slightly compressed. Basepictures from [195, 196].
170

Appendix C
Fast solver based onnon-linear iterativenested loops
Non-linear systems are difficult to solve in that no specific methodol-ogy guarantees a solution and multiple solutions are generally possi-ble. However, a solution method for the non-linear system presentedin section 5.1 is found to be as follows: first the cut-in wind speed ofthe plant is computed by a pre-processor, then an iterative proceduresolves the non linear equations, and finally a post-processor performssome double checks to avoid errors in the implementations. It is im-portant to notice that this particular solution method depends on theset of variables that are assumed to be inputs and the set of variablesthat are assumed to be unknown (outputs). The full list of input andoutput parameters is shown in Tables 4.1 and 4.3.
C.1 Pre-processing wind data analysis
A pre-processor is used to compute the operating wind speed depend-ing on the specific site data. More specifically, the pre-processingroutine has the following inputs:
• The desired capacity factor of the plant, CF
• The working altitude of the drones, H
171

APPENDIX C. FAST SOLVER BASED ON NON-LINEARITERATIVE NESTED LOOPS
• The statistical wind data in the chosen site in the referenceperiod
and the pre-processor outputs are:
• The operational/cut-in wind speed, Vci (computed as the CFth
percentile of the wind speed statistical distribution at the op-erating altitude, H)
• The average air density at the operating altitude, ρH
• The wind speed and air density distributions at different alti-tudes, Vw(h) and ρ(h)
The wind statistics are extracted from the radiosonde database in [184]and the average air density is computed with the ideal gas law ρH =pH/(287.05 TH), where pH and TH are the average pressure and tem-perature at the operational altitude in the reference period expressedin Pa and K respectively.
C.2 Solver processing
After that the operational/cut-in wind speed and the air density arecomputed by the pre-processor, the system of 26 equations in 26unknowns introduced in Section 5.1 is solved with a recursive iterativeprocedure. The equations are arranged into four nested iterativeloops as shown in Fig. C.1. Numerical stability and convergence ina wide range of input data are achieved by having the inner core tosolve the well known AWE algebraic models used for first assessmentsand then adding external loops for each physical phenomenon thatneeds to be analyzed.
With reference to Fig. C.1, first, Equations 4.1, 4.2, 4.3 are solvedto compute the geometrical parameters, then an initial guess is madefor the following three variables: θc, dec, dpc. Then Eq. 4.4 is solved,and the fourth guess θd is made. Subsequently, the core Equa-tions 4.5, 4.6, 4.7, 4.8, 4.9, 4.10, 4.11, 4.12, 4.13 are iterated in theinner loop until the fourth guessed variable θd converges. Then thecable structural Eqs. 4.14, 4.15, 4.16, together with the whole innerloop and the drag equation Eq. 4.4, are iterated in the second-to-inner loop until the third variable dpc also converges. Note that foreach single iteration pass of the second-to-inner loop, the inner loop
172

APPENDIX C. FAST SOLVER BASED ON NON-LINEARITERATIVE NESTED LOOPS
is solved with several iteration passes. Now that both the fourthand the third variable θd and dpc converged, the electrical equationsin the third-to-inner loop, Eqs. 4.17, 4.18, 4.19, 4.20, 4.21 are iter-ated together with the second-to-inner loop until the second guessedvariable, dec, converges. Similarly to the previous loop, for each it-eration pass of the third-to-inner loop, the second-to-inner loop issolved several times. After that, the outer loop solves the cable grav-ity equations 4.22, 4.23, 4.24, 4.25 until also the first guessed variable,θc, converges. After that all variables converged, the power output isfinally computed with Eq. 4.26.
Despite this numerical intensive structure, the solver is extremelyfast and converges usually in a few seconds up to less than 0.5 secondsin a standard laptop, thus allowing to build optimization algorithmson top of it.
C.3 Post-processing and hovering constraint
The postprocessor displays the output and runs some redundantchecks to issue automatic warnings to prevent human errors whenwriting the code and to verify that all the hypotheses hold true.
Besides that, the post-processor checks that the required massof the electrical turbines/motor is compatible with the drone massand displays the minimum rotor area that is required for verticaltake-off (not using the horizontal ring of Fig. 4.6) up to 1000 m al-titude, assuming 6 rotors per drone. This hovering viability check isperformed by computing a reasonable rotor area with a first approx-imation physical model as follows:
msm =P2
12PtoW
where msm is the mass of a single rotor and PtoW is the Power-to-Weight ratio of the motors.
The Hovering Specific Electric Consumption HSEC is the ratiobetween the required electrical power for vertical take-off and thelifted mass
HSEC =P2
2(md +mc 1000 + 6msm)
173

APPENDIX C. FAST SOLVER BASED ON NON-LINEARITERATIVE NESTED LOOPS
Eqs. 4.1, 4.2, 4.3 lfd, lf , le Geometry
hyp θc
hyp dec
hyp dpc
Eq. 4.4 Fhd Drag on fixed cable
hyp θd
Eq. 4.5 Vcip
Coreequations:known firstassessment
modelsand drone
gravity
Eq. 4.6 deqd
Eqs. 4.7, 4.8 Eeq, P2
Eq. 4.9 Vd
Eqs. 4.10, 4.11 L, L2
Eq. 4.12 Ff
Eq. 4.13 θd
Eq. 4.14 Fd
Structuralcable model
Eq. 4.15 Apc
Eq. 4.16 dpc
Eq. 4.17 I
Electricaland thermal
models
Eqs. 4.18, 4.19 Pdl, Pd
Eq. 4.20 Re(1)
Eq. 4.21 Re(2)
diff & gain∆dec
Eq. 4.22 mfl
Cable gravity modelEq. 4.23,4.24,4.25 θc
Eq. 4.26 Pout Power output
Figure C.1: Solver routine. The solver is composed by 4 nested iteration loops.The inner loop is the most important and models the crosswind flight. Everyouter loop models an additional phenomenon. Despite his numerical intensivestructure, the solver is extremely fast.
174

APPENDIX C. FAST SOLVER BASED ON NON-LINEARITERATIVE NESTED LOOPS
where mc 1000 = 1000 mfl is the mass of 1000 m of cables assumedto be carried by each drone.
The hovering specific electric consumption is linked to the rotorarea of each rotor, Asr, by the physical relation
Asr = ηhovP2
12
(12ρg
(2HSEC
g
)3)where ρg is the air density art ground level (1.22 kg/m3), g is thegravity constant, and ηhov is a lumped coefficient assumed to beequal to 10 to roughly match real data from convertiplanes and largehelicopters that have rotor diameters around 10 m and HSEC around200 W/kg at take-off.
175

APPENDIX C. FAST SOLVER BASED ON NON-LINEARITERATIVE NESTED LOOPS
176

Appendix D
Technical drawings ofthe wind droneexperimental setup
This appendix contains the executive technical drawings that wereused in the experimental setup described in Chapter 5.
177

B-B
( 1 :
4 )
A-A
( 1 :
4 )
BB
AA
APPENDIX D. TECHNICAL DRAWINGS OF THE WINDDRONE EXPERIMENTAL SETUP
178

B-B ( 1 : 1 )A-A ( 1 : 1 )
B B
A
A
APPENDIX D. TECHNICAL DRAWINGS OF THE WINDDRONE EXPERIMENTAL SETUP
179

Roto
r - s
uppo
rt pl
ate
for
elec
troni
cs o
n m
ain
shaf
t
90
,00
15,1
0
2,00
APPENDIX D. TECHNICAL DRAWINGS OF THE WINDDRONE EXPERIMENTAL SETUP
180

10,00
178,
00
10,0
010
,00
5,00
5 th
readed
-10,0
0 DEE
P
5 thre
aded -
10,00
DEEP
6x
bars
, bet
wee
n st
ator
top
and
botto
m d
isks
APPENDIX D. TECHNICAL DRAWINGS OF THE WINDDRONE EXPERIMENTAL SETUP
181
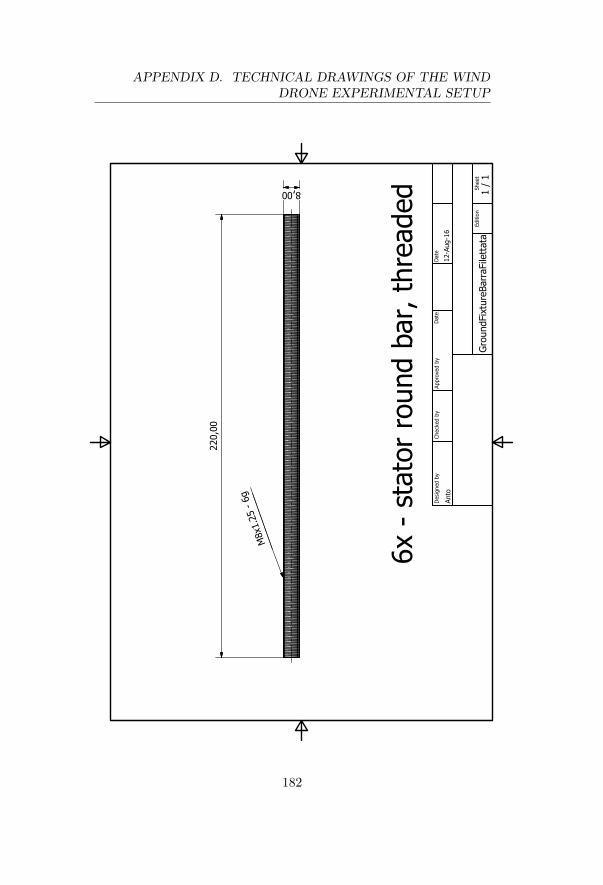
Grou
ndFi
xtur
eBar
raFi
letta
ta
Anto
12-A
ug-1
6De
signe
d by
Chec
ked
byAp
prov
ed b
yDa
te
1 / 1
Ed
ition
Shee
t
Date
220,
00
8,00
M8x1
.25
- 6g
6x -
stat
or ro
und
bar,
thre
aded
APPENDIX D. TECHNICAL DRAWINGS OF THE WINDDRONE EXPERIMENTAL SETUP
182

Stat
or -
botto
m d
isk
9,00
3,00
Cham
fere
d
Appr
ox 2
,00
X 45
,00°
24
,00
Hole
for b
all b
earin
g
160,00
5,10
67,5
067,50
22,5
0
5,00
APPENDIX D. TECHNICAL DRAWINGS OF THE WINDDRONE EXPERIMENTAL SETUP
183

24,0
0Ho
le fo
r bal
l bea
ring
Stat
or -
top
disk
5,00
5,10
67,5
0
75,00
160,005,00
APPENDIX D. TECHNICAL DRAWINGS OF THE WINDDRONE EXPERIMENTAL SETUP
184

1
1
2
2
3
3
4
4
5
5
6
6
A A
B B
C C
D D
GroundFixtureLowerTube
Anto 12-Aug-16Designed by Checked by Approved by Date
1 / 1 Edition Sheet
Date
6 holes M3 8,00 DEEP
230,
00
6,10
8,00
5,00
Stator - lower tube (to umbrella base)
50,00
APPENDIX D. TECHNICAL DRAWINGS OF THE WINDDRONE EXPERIMENTAL SETUP
185

Roto
r - p
hi e
ncod
er c
age
-to
p di
sk
35,00
25
,00
3,00
M3
thre
aded
12,0
0
40,0
0
APPENDIX D. TECHNICAL DRAWINGS OF THE WINDDRONE EXPERIMENTAL SETUP
186

35,00
3,10
Appr
ox 1
,00
X 45
,00°
cham
fere
d
cham
fere
d
8,
00
Roto
r - p
hi e
ncod
er c
age
-bo
ttom
disk
8,50
15,0
0
2,
10
2,00
APPENDIX D. TECHNICAL DRAWINGS OF THE WINDDRONE EXPERIMENTAL SETUP
187

Roto
r - p
hi e
ncod
er c
age
-to
p di
sk
8,1
0
10,00
5,00
3,1
0
Apro
x 1,
00 X
45,
00°
cham
fere
d
15,0
0
35,002,00
APPENDIX D. TECHNICAL DRAWINGS OF THE WINDDRONE EXPERIMENTAL SETUP
188

1 1
2 2
3 3
4 4
5 5
6 6
AA
BB
CC
DD
Grou
ndFi
xtur
ePhi
Cage
Cont
rast
Shaf
t
Anto
12-A
ug-1
6De
signe
d by
Chec
ked
byAp
prov
ed b
yDa
te
1 / 1
Ed
ition
Shee
t
Date
Stat
or to
roto
r-enc
onde
r, m
ount
ing
shaf
t
30,0
0
10,00
Hole
M6
(thre
aded
)
10,0
0
The
enco
der s
haft
has
to b
e fix
ed in
this
hole
(the
enco
der d
atas
heet
say
s: S
haft
diam
eter
(mm
) 6 +
0/-
0.01
)
6,00
APPENDIX D. TECHNICAL DRAWINGS OF THE WINDDRONE EXPERIMENTAL SETUP
189

Roto
r - to
p m
ount
- th
eta
shaf
t
15,00
M6
Hole
for f
ixing
thet
a-ar
m b
olt
Hole
to fi
x th
e en
code
r sha
ftTh
e en
coed
r dat
ashe
et s
ays:
Sh
aft d
iam
eter
(mm
) 6 +
0 /
-0.0
1Us
eful
dep
th fo
r enc
oder
sha
ft 6
mm
12,5
0 th
read
dep
th
3,00
9,00
13,0
0
19,0
0
4x s
eege
r rin
gs, 1
mm
thick
ness
23,0
0
APPENDIX D. TECHNICAL DRAWINGS OF THE WINDDRONE EXPERIMENTAL SETUP
190

1 1
2 2
3 3
4 4
5 5
6 6
AA
BB
CC
DD
Roto
r - to
p m
ount
- th
eta
arm
par
t 1
310
24,00
15,10
5,00
Smoo
thed
edg
es (d
on't
have
to c
ut th
e ca
ble)
9,00
4710
253
5,00
1,00
R6,00 o
r highe
r
12
37
APPENDIX D. TECHNICAL DRAWINGS OF THE WINDDRONE EXPERIMENTAL SETUP
191

1 1
2 2
3 3
4 4
5 5
6 6
AA
BB
CC
DD
Roto
r - to
p m
ount
- th
eta
arm
par
t 2(o
nly
diffe
renc
es fr
om p
art 1
are
sho
wn)12,00
6,10
APPENDIX D. TECHNICAL DRAWINGS OF THE WINDDRONE EXPERIMENTAL SETUP
192
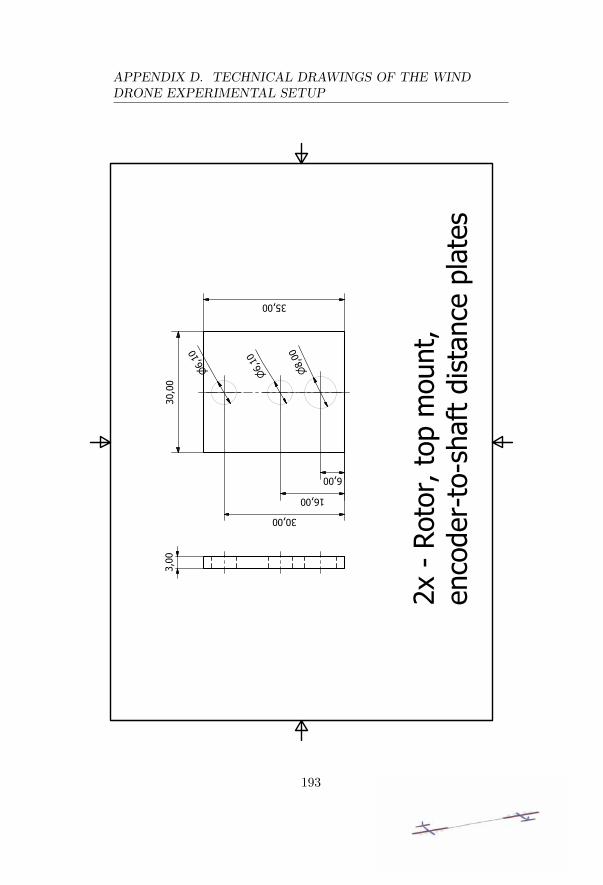
30,0
0
35,00
3,00
6,00
16,00
30,00
8,
00
6,1
0
6,1
0
2x -
Roto
r, to
p m
ount
, en
code
r-to-
shaf
t dist
ance
pla
tes
APPENDIX D. TECHNICAL DRAWINGS OF THE WINDDRONE EXPERIMENTAL SETUP
193

Appro
x 2,00
X 45
,00°
2,10
cham
fere
d
8,0
0
6,1
0
6,1
0
8,0
0
2,10
6,00
16,00
30,00
42,50
51,00
59,50
30,0
0
66,00
2,00
Roto
r - to
p m
ount
- th
eta
enco
der s
uppo
rt pl
ate
APPENDIX D. TECHNICAL DRAWINGS OF THE WINDDRONE EXPERIMENTAL SETUP
194

66,00
30,0
0
24
,00 6,
10
6,
10
8,
00
6,00
16,00
30,00
51,00
2x -
Roto
r, to
p m
ount
, m
ain
shaf
t sup
port
plat
es
3,00
Hole
for b
all b
earin
g
APPENDIX D. TECHNICAL DRAWINGS OF THE WINDDRONE EXPERIMENTAL SETUP
195

3,00 THRU
6,00
3,00M3x0.5 -
6g
Smoo
thed
edg
e (s
o th
at it
doe
sn't
cut t
he w
ire)
2x lo
ad c
ell h
ook
Scal
e 8:
1
Hole
to ti
e th
e dy
neem
a w
ire
2,00
6,00
6,00
Smoo
thed
hol
e
APPENDIX D. TECHNICAL DRAWINGS OF THE WINDDRONE EXPERIMENTAL SETUP
196

A-A
( 1 :
1 )
B-B
( 1 :
1 )
AA
BB
1 1
2 2
3 3
4 4
5 5
6 6
AA
BB
CC
DD
247,00
54,00
36,00
8,00
4,007,00
15,0
0
8,00
1,00
40,00
8,
00 th
read
ed M
8
83,50107,50
112,50
155,50
50,00
30,00
8,00
Roto
r - m
ain
shaf
t
6,10
mm
, firs
t tw
o ho
les
6,00
20,00
Hole
s fo
r en
code
r cab
les
M8
thre
aded
at t
he b
otto
m
(to h
old
phi c
age
top
plat
e)
1,00
2x s
eege
r rin
gs(b
otto
m b
earin
g)
2x s
eege
r rin
gs(to
p be
arin
g)
1x s
eege
r rin
g(e
lect
roni
cs
supp
ort p
late
)
20,00
26,0029,00
1,00
7,00
APPENDIX D. TECHNICAL DRAWINGS OF THE WINDDRONE EXPERIMENTAL SETUP
197

198

Bibliography
[1] E. A. Wrigley, Energy and the english industrial revolution,Philosophical Transactions of the Royal Society A (2013) 371.
[2] Roadmap 2050: A Practical Guide to a Prosperous, Low-Carbon Europe, European Climate Foundation (2010).
[3] Global wind statistics 2013, Global Wind Energy Council,Brussels, Belgium (May 2014).
[4] J. Peeringa, R. Brood, O. Ceyhan, W. Engels, G. de Winkel,Upwind 20MW Wind Turbine Pre-Design, Report for the Eu-ropean Project SES6-019945 (2011).
[5] R. Wiser, M. Bolinger, 2015 Wind Technologies Market Re-port, https://energy.gov/ sites/prod/ files/ 2016/08/f33/ 2015-Wind- Technologies- Market- Report- 08162016.pdf (2015).
[6] Global Wind Energy Council, Global Offshore: Current Statusand Future Prospect, (2016).
[7] M. L. Loyd, Crosswind kite power (for large-scale wind powerproduction), Journal of Energy 4 (3) (1980) 106 – 111.
[8] A. Cherubini, A. Papini, R. Vertechy, M. Fontana, Airbornewind energy systems: A review of the technologies, Renewableand Sustainable Energy Reviews 51 (2015) 1461–1476. doi:
10.1016/j.rser.2015.07.053.
[9] A. Cherubini, R. Vertechy, M. Fontana, Simplified model ofoffshore airborne wind energy converters, Renewable Energy88 (2016) 465–473.
199

[10] A. Cherubini, G. Moretti, M. Fontana, Dynamic modeling offloating offshore airborne wind energy converters, AirborneWind Energy, Roland Schmehl Ed., Book Chapter (2017).
[11] Offshore AWEC simulator, http://www.percro.org/AWE/.
[12] I. Bastigkeit, Study on Wind Resources at Mid-Altitude, Ab-stract submitted to the Airborne Wind Energy Conference, TUDelft, (2015).
[13] C. L. Archer, K. Caldeira, Global Assessment of High-AltitudeWind Power, Energies 2 (2) (June 2009) 307–319.
[14] K. Marvel, B. Kravitz, K. Caldeira, Geophysical limits to globalwind power, Nature Climate Change 3 (2012) 118–121.
[15] L. M. Miller, F. Gans, A. Kleidon, Jet stream wind power asa renewable energy resource: little power, big impacts, EarthSystem Dynamics 2 (2011) 201–212.
[16] M. Diehl, Airborne Wind Energy: Basic Concepts and PhysicalFoundations, Airborne Wind Energy, U. Ahrens, M. Diehl, R.Schmehl Eds. (Springer Berlin), Chapter 1, 3 - 22, (2013).
[17] P. Williams, B. Lansdorp, W. J. Ockels, Optimal crosswindtowing and power generation with tethered kites, J. GuidanceControl Dyn. 31 (2008) 81–93.
[18] M. Canale, L. Fagiano, M. Milanese, KiteGen: a revolution inwind energy generation, Energy 34 (2009) 355–361.
[19] Y. Ji, J. He, Analysis on lightning triggering possibility alongtransmission tethers of high altitude wind energy exploitationsystem, Electric Power Systems Research 94 (2013) 16–23.
[20] J. Zhang, N. Zou, W. Zhou, System and method for umbrellapower generation, PCT Patent Application WO2010129124(2010).
[21] L. Perkovic, P. Silva, M. Ban, N. Kranjcevic, N. Duic, Har-vesting high altitude wind energy for power production: Theconcept based on Magnus’ effect., Applied energy 101 (2012)151–160.
200

[22] G. Magnus, Uber die Abweichung der Geschosse, und uber eineabfallende Erscheinung bei rotierenden Korpern, Annalen derPhysik 164 (1) (1853) 1–29.
[23] B. T. Legaignoux, D. M. Legaignoux, Propulsive wing with in-flatable armature, PCT Patent Application WO8602902 (1987).
[24] X. Paulig, M. Bungart, B. Specht, Conceptual Design of Tex-tile Kites Considering Overall System Performance, AirborneWind Energy, U. Ahrens, M. Diehl, R. Schmehl Eds. (SpringerBerlin), Chapter 32, 547-562, (2013).
[25] S. Dunker, Ram-air Wing Design Considerations for AirborneWind Energy, Airborne Wind Energy, U. Ahrens, M. Diehl, R.Schmehl Eds. (Springer Berlin), Chapter 31, 517 - 546, (2013).
[26] E. J. Terink, J. Breukels, R. Schmehl, W. J. Ockels, Flight Dy-namics and Stability of a Tethered Inflatable Kiteplane, Journalof Aircraft 48 (2) (2011) 503–513.
[27] J. C. M. Breuer, R. H. Luchsinger, Inflatable kites using theconcept of Tensairity, Aerospace Science and Technology 14(2010) 557–563.
[28] W. J. Ockels, Laddermill, a novel concept to exploit the energyin the airspace, Aircraft design 4 (2) (2001) 81–97.
[29] Kitepower 2.0 website, http://kitepower.eu (accessed on20/01/2015).
[30] R. Schmehl, Experimental setup for automatic launch-ing and landing of a 25 m2 traction kite, Videourl: www.youtube.com/watch?v= w4oWs zNpr8 (accessed on20/01/2015) (2014).
[31] TU Delft Research Website, http:// www.tudelft.nl/en/research/ thematic-cooperation/ delft-research-based-initiatives/ delft-energy-initiative/ news/ article/ detail/vliegerenergie-naar-betaalbare-schone-energie-1/ (last accessedon 24/02/2017).
[32] S. Haug, Design of a Kite Launch and Retrieval System for aPumping High Altitude Wind Power Generator, MSc Thesis,University of Stuttgart (2012).
201

[33] R. van der Vlugt, J. Peschel, R. Schmehl, Design and Experi-mental Characterization of a Pumping Kite Power System, Air-borne Wind Energy, U. Ahrens, M. Diehl, R. Schmehl Eds.(Springer Berlin), Chapter 23, 403 - 425, (2013).
[34] AWESCO website, http:// www.awesco.eu/ partners.html (lastaccessed on 01/03/2017).
[35] S. Sieberling, R. Ruiterkamp, The PowerPlane an AirborneWind Energy System Conceptual Operations, Proc. 11th AIAAATIO Conference (2011).
[36] R. Ruiterkamp, S. Sieberling, Description and Preliminary TestResults of a Six Degrees of Freedom Rigid Wing Pumping Sys-tem, Airborne Wind Energy, U. Ahrens, M. Diehl, R. SchmehlEds. (Springer Berlin), Chapter 26, 443 - 458, (2013).
[37] M. Kruijff, Status and Development Plan of the PowerPlaneof Ampyx Power, Abstract submitted to the Airborne WindEnergy Conference, TU Delft, (2015).
[38] Ampyx Power website, www.ampyxpower.com (accessed on13/03/2017).
[39] Royal Dutch Shell website, www.shell.com/ inside-energy/ kite-power.html (last accessed on 01/03/2017).
[40] Enerkite website, www.enerkite.com (accessed on 30/12/2014).
[41] A. Bormann, C. Gebhardt, C. Hauke, S. Skutnik, Global Econ-omy of Airborne Wind Energy and our Path Towards a Market-Ready Technology, Abstract submitted to the Airborne WindEnergy Conference, TU Delft, (2015).
[42] A. Bormann, M. Ranneberg, P. Kovesdi, C. Gebhardt, S. Skut-nik, Development of a Three-Line Ground-Actuated AirborneWind Energy Converter, Airborne Wind Energy, U. Ahrens,M. Diehl, R. Schmehl Eds. (Springer Berlin), Chapter 24, 426- 436, (2013).
[43] U. Ahrens, M. Diehl, R. Schmehl, Preface to the first edition,Airborne Wind Energy, Springer Berlin (2013).
202

[44] M. Ippolito, System and process for automatically control-ling the flight of power wing airfoils, PCT Patent ApplicationWO2007129341 (2007).
[45] M. Canale, L. Fagiano, M. Ippolito, M. Milanese, Control oftethered airfoils for a new class of wind energy generator, 45thIEEE Conference on Decision and Control (2006), 4020-4026.
[46] M. Ippolito, Aeolian system for converting energythrough power wing airfoils, European Patent ApplicationEP2463516A1 (2013).
[47] Kitegen website, www.kitegen.com/en/ (accessed on30/12/2014).
[48] A. Cherubini, M. Ippolito, Puleggia perfezionata per verricelload alta efficienza, Italian Patent Application ITTO20130365(2013).
[49] M. Ippolito, Infrastructure for driving and assisted take-off ofairfoils for tropospheric aeolian generator, PCT Patent Appli-cation WO2009147692 (2009).
[50] M. Ippolito, Tether for tropospheric aeolian generator, PCTPatent Application WO2010084520 (2010).
[51] M. Ippolito, Floating offshore kite powered generator, PCTPatent Application WO2010143214 (2010).
[52] L. Fagiano, M. Milanese, Airborne Wind Energy: an overview,American Control Conference, Fairmont Queen Elizabeth,Montreal, Canada (2012).
[53] L. Fagiano, M. Milanese, D. Piga, High-altitude wind powergeneration, IEEE Transactions on Energy Conversion 25 (1)(2010) 168 – 180.
[54] L. Fagiano, M. Milanese, D. Piga, Optimization of airbornewind energy generators, International Journal of Robust andNonlinear Control 22 (18) (2012) 2055 – 2083.
[55] Kitenergy website, www.kitenergy.net (accessed on30/12/2014).
203

[56] M. Milanese, L. Fagiano, I. Gerlero, Actuating systems for con-trolling the flight of a power wing profile for conversion of windenergy into electrical or mechanical energy, PCT Patent Appli-cation WO2011121557 (2011).
[57] L. Fagiano, A. U. Zgraggen, M. Morari, M. Khammash, Auto-matic crosswind flight of tethered wings for airborne wind en-ergy: modeling, control design and experimental results, IEEETransactions on control systems technology (2014) 22 (4).
[58] M. Erhard, H. Strauch, Control of Towing Kites for Seago-ing Vessels, IEEE Transactions on Control Systems Technology21 (5) (2013) 1629–1640.
[59] S. Wrage, S. Brabeck, Wind power plant comprising a steerablekite, PCT Patent Application WO2007112993 (2007).
[60] J. Maaß, M. Erhard, Software System Architecture for Con-trol of Tethered Kites, Airborne Wind Energy, U. Ahrens, M.Diehl, R. Schmehl Eds. (Springer Berlin), Chapter 35, 599 -611, (2013).
[61] S. Wrage, S. Brabeck, Starting and recovering device for anaerodynamic profiled element, and aerodynamic profiled ele-ment, PCT Patent Application WO2008019700 (2008).
[62] M. Erhard, H. Strauch, Flight control of tethered kites andwinch control for autonomous airborne wind energy generationin pumping cycles, Control Engineering Practice 40 (2015) 13–26.
[63] Insolvenz Portal, https://app. insolvenz-portal.de/ Insol-venzverfahren/ skysails-gmbh/ 2343986 (last accessed on24/02/2017).
[64] C. Houle, D. Costa, C. Galliot, F. Gohl, R. H. Luchsinger,Mobile Wind Farms Using Tethered Wings - Technical andEconomic Considerations, Abstract submitted to the AirborneWind Energy Conference, TU Delft, (2015).
[65] R. Luchsinger, D. Aregger, F. Bezard, D. Costa, C. Galliot,F. Gohl, J. Heilmann, H. Hesse, C. Houle, T. A. Wood, R. S.Smith, Closing the Gap: Pumping Cycle Kite Power with
204

Twings, Abstract submitted to the Airborne Wind Energy Con-ference, TU Delft, (2015).
[66] L. Carnel, T. Harklau, Kitemill, a Driver of Second-GenerationWind Energy, Abstract submitted to the Airborne Wind En-ergy Conference, TU Delft, (2015).
[67] A. van den Brink, Design of the e-50 Ground Station, Abstractsubmitted to the Airborne Wind Energy Conference, TU Delft,(2015).
[68] eKite website, http:// www.e-kite. com/ wp-content/ uploads/2014/12/ e-kite-in-sky.jpg (accessed on 24/02/2017).
[69] Windlift website, www.windlift.com (accessed on 30/12/2014).
[70] B. Kronborg, D. Shaefer, eWind Solutions Company Overviewand Major Design Choices, Abstract submitted to the AirborneWind Energy Conference, TU Delft, (2015).
[71] SkyPull Website, http:// skypull.com/ home/ technology/ (lastaccessed on 24/02/2017).
[72] K. Geebelen, M. Vukov, A. Wagner, H. Ahmad, M. Zanon,S. Gros, D. Vandepitte, J. Swevers, M. Diehl, An ExperimentalTest Setup for Advanced Estimation and Control of an AirborneWind Energy System, Airborne Wind Energy, U. Ahrens, M.Diehl, R. Schmehl Eds. (Springer Berlin), Chapter 27, 459 -471, (2013).
[73] University of Freiburg - Systems Control and OptimizationLaboratory, https:// www.syscop.de/ people (last accessed on01/03/2017).
[74] SwissKitePower website, www.swisskitepower.ch (accessed on30/12/2014).
[75] NASA, Control and Tracking for Tethered Airborne WindEnergy (AWE) Vehicles , http:// technologygateway. nasa.gov/ docs/ TOA LARC120 aWE 7web.pdf (accessed on30/12/2014).
[76] R. J. Lozano, M. Alamir, J. Dumon, A. Hably, Control of awind power system based on a tethered wing, IFAC Workshop
205

on Embedded Guidance, Navigation and Control in Aerospace(EGNCA) (2012).
[77] GIPSA-lab website, http://www.gipsa-lab.grenoble-inp.fr/recherche/ plates-formes.php?id plateforme=70 (ac-cessed on 30/12/2014).
[78] Allister Furey’s personal website, http://www.sussex.ac.uk/Users/adjf20/index.html (last accessed on 25/10/2013).
[79] H. Zhang, Kite Modeling for Higher Altitude Wind Energy,Energy and Power Engineering 5 (2013) 481–488.
[80] D. J. Olinger, J. S. Goela, G. Tryggvason, Modeling and Test-ing of a Kite-Powered Water Pump, U. Ahrens, M. Diehl, R.Schmehl Eds. (Springer Berlin), Chapter 22, 387 - 401, (2013).
[81] M. Ippolito, Vertical axis wind turbine with control systemsteering kites, European Patent Application EP1672214 (2006).
[82] M. Ippolito, Wind energy conversion system with kites tow-ing modules on a rail, PCT Patent Application WO2014087436(2014).
[83] U. Ahrens, Wind-operated power generator, PCT Patent Ap-plication WO2008006413 (2008).
[84] U. Ahrens, Method and system for converting kinetic energycontained in horizontal flows into useful mechanical energy,PCT Patent Application WO2009083486 (2009).
[85] U. Ahrens, B. Pieper, C. Topfer, Combining Kites and RailTechnology into a Traction-Based Airborne Wind EnergyPlant, Airborne Wind Energy, U. Ahrens, M. Diehl, R. SchmehlEds. (Springer Berlin), Chapter 25, 437 - 441, (2013).
[86] L. Fagiano, M. Milanese, System for converting wind energyinto electrical energy through the flight of power wing profilestethered to the ground by cables of a fixed length, without pas-sive phases, and with automatic adaptation to wind conditions,PCT Patent Application WO2012127444A1 (2012).
[87] B. Ruhe, Using Kites to Generate Electricity: Plodding, LowTech Approach Wins, Drachen Foundation journal 16 (2004)14.
206

[88] F. Ferguson, Systems and methods for tethered turbines, PCTPatent Application WO2006117593 (2006).
[89] F. Ferguson, Systems and methods for tethered turbines, PCTPatent Application WO2010007466 (2010).
[90] M. L. Loyd, Wind driven apparatus for power generation, USPatent Application US4251040 (1981).
[91] Makani Power website, www.google.com/makani/ (accessed on30/12/2014).
[92] M. Specter, Inherit the Wind, The New Yorker,www.newyorker.com/ magazine/2013/05/20/inherit-the-wind(2013).
[93] C. Hardam, D. V. Lind, N. B. Van, Tethered system for powergeneration, US Patent Application US2010295303 (2010).
[94] S. Griffith, C. Hardham, P. Lynn, D. Montague, Faired tetherfor wind power generation systems, PCT patent applicationWO2009142762 (2009).
[95] S. Griffith, P. Lynn, D. Montague, C. Hardam, Bimodal kitesystem, US Patent Application US2009072092 (2009).
[96] D. Vander Lind, Radiator and Duct Configuration on an Air-borne Wind Turbine for Maximum Effectiveness , Patent ap-plication WO2015138289 (A1) (2015).
[97] G. B. Christopher, P. E. Wolfgang, H. Brian, Tether termina-tion systems and methods, Patent application TW201629338(A) (2016).
[98] S. Griffith, P. Lynn, C. Hardam, Wind power generation, USPatent Application US7847426B1 (2010).
[99] D. V. Lind, Deeloping a 600 kW Airborne Wind Turbine, Ab-stract submitted to the Airborne Wind Energy Conference, TUDelft, (2015).
[100] A. Cherubini, Rotary wind drones for jet stream wind power -video presentation, www.antonellocherubini.com/ jet-streams-here-we-come.html (last accessed on 01/03/2017).
207

[101] Joby Energy website, http://www.jobyenergy.com/ (accessedon 30/12/2014).
[102] J. Bevirt, Tethered Airborne Power Generation System WithVertical Take-Off and Landing Capability, US Patent Applica-tion US2010283253A1 (2010).
[103] J. Bevirt, M. Peddie, System and method for controlling a teth-ered flying craft using tether attachment point manipulation,US Patent Application US2011121570A1 (2010).
[104] J. Bevirt, Tether sheaths and aerodynamic tether assemblies,US Patent Application US20110266395A1 (2011).
[105] Altaeros Energies website, http://www.altaerosenergies.com/(accessed on 30/12/2014).
[106] C. Vermillion, B. Glass, A. Rein, Lighter-Than-Air Wind En-ergy Systems, Airborne Wind Energy, U. Ahrens, M. Diehl, R.Schmehl Eds. (Springer Berlin), Chapter 30, 501 - 514, (2013).
[107] B. Glass, Power-augmenting shroud for energy-producing tur-bines, PCT Patent Application WO2010045441 (2010).
[108] C. Vermillion, B. Glass, A. Goessling, Systems and methods forattitude control of tethered aerostats, PCT Patent ApplicationWO2013043586 (2013).
[109] Sky WindPower website, www.skywindpower.com (accessed on30/12/2014).
[110] B. W. Roberts, Windmill kite, US Patent ApplicationUS6781254B1 (2004).
[111] B. W. Roberts, Control system for a windmill kite, PCT PatentApplication WO2009126988A1 (2009).
[112] B. W. Roberts, Tethered airborne wind-driven power generator,US Patent Application US2011057453 (2011).
[113] B. W. Roberts, Electrical generating rotorcraft, PCT PatentApplication WO2012024717A1 (2011).
[114] B. W. Roberts, Quad-Rotorcraft to Harness High AltitudeWind Energy, Abstract submitted to the Airborne Wind En-ergy Conference, TU Delft, (2015).
208

[115] B. W. Roberts, D. H. Shepard, K. Caldeira, M. E. Cannon,D. G. Eccles, A. J. Grenier, J. F. Freidin, Harnessing high-altitude wind power., IEEE Transactions on Energy Conversion22 (1) (2007) 136–144.
[116] A. Cherubini, M. Fontana, Assessment of Megawatt-Scale WindEnergy Drone Generators at Jet Stream Altitude, In Review,2017.
[117] I. Argatov, P. Rautakorpi, R. Silvennoinen, Estimation of theMechanical Power of a Kite Wind Generator, Renewable En-ergy for Sustainable Future, 1-28, (2013).
[118] B. Houska, M. Diehl, Optimal control of towing kites, Proceed-ings of the 45th IEEE conference on decision & control, SanDiego, USA (2006) 2693 – 2697.
[119] I. Argatov, P. Rautakorpi, R. Silvennoinen, Estimation of themechanical energy output of the kite wind generator, Renew-able Energy 34 (6) (2009) 1525 – 1532.
[120] D. V. Lind, Analysis and Flight Test Validation of High Per-formance Airborne Wind Turbines, Airborne Wind Energy, U.Ahrens, M. Diehl, R. Schmehl Eds. (Springer Berlin), Chapter28, 473 - 490, (2013).
[121] R. Schmehl, R. van der Vlugt, Traction Power Generation withTethered Wings - A Quasi-Steady Model for the Prediction ofthe Power Output, Abstract submitted to the Airborne WindEnergy Conference, TU Delft, (2015).
[122] G. Lutsch, Airborne Wind Energy Network HWN500 - Shoul-dering R&D in Co-Operations, Abstract submitted to the Air-borne Wind Energy Conference, TU Delft, (2015).
[123] A. Cherubini, Kite Dynamics and Wind Energy Harvesting,MSc Thesis, Politecnico di Milano (2012).
[124] I. Argatov, P. Rautakorpi, R. Silvennoinen, Apparent wind loadeffects on the tether of a kite power generator, Journal of WindEngineering & Industrial Aerodynamics 99 (10) (2011) 1079–1089.
209

[125] A. Venturato, Analisi fluidodinamica del profilo alare Clark-Yed ottimizzazione multi-obbiettivo tramite algoritmo genetico,MSc Thesis, Universita degli studi di Padova (2013).
[126] R. Bosman, V. Reid, M. Vlasblom, P. Smeets, Airborne WindEnergy Tethers with High-Modulus Polyethylene Fibers, Air-borne Wind Energy, U. Ahrens, M. Diehl, R. Schmehl Eds.(Springer Berlin), Chapter 33, 563 - 585, (2013).
[127] T. Schneiderheinze, T. Heinze, M. Michael, High PerformanceRopes and Drums In Airborne Wind Energy Systems, Abstractsubmitted to the Airborne Wind Energy Conference, TU Delft,(2015).
[128] N. Zero, Energy High in the Sky: Expert Perspectives on Air-borne Wind Energy Systems, ed. Mason Inman (2012).
[129] D. Brandt, M. Busch, A. Bormann, M. Ranneberg, AdaptingWind Resource Estimation for Airborne Wind eenrgy Convert-ers, Abstract submitted to the Airborne Wind Energy Confer-ence, TU Delft, (2015).
[130] Udo Zillmann, Daidalos Capital, The Trillion Dollar Drone -A Change of Perspective, Abstract submitted to the AirborneWind Energy Conference, TU Delft, (2015).
[131] P. R. Payne, Self erecting windmill, US patent applicationUS3987987 (1976).
[132] M. Zanon, S. Gros, J. Andersson, M. Diehl, Airborne WindEnergy Based on Dual Airfoils, IEEE Transactions On ControlSystems Technology (2013) 21 (4).
[133] M. Diehl, G. Horn, M. Zanon, Multiple Wing Systems - anAlternative to Upscaling?, Abstract submitted to the AirborneWind Energy Conference, TU Delft, (2015).
[134] B. Tigner, Multi-tether cross-wind kite power, US patent ap-plication US8066225 (2008).
[135] A. Cherubini, AWE community is growing fast,www.antonellocherubini.com/ awe-community-is-growing-fast.html (2014).
210

[136] U. Fechner, M. Noom, Kite power system optimizer.URL https://bitbucket.org/ufechner/awe_book
[137] G. Horn, S. Gros, M. Diehl, Numerical trajectory optimizationfor airborne wind energy systems described by high fidelity air-craft models, in: U. Ahrens, M. Diehl, R. Schmehl (Eds.), Air-borne Wind Energy, Springer, Berlin Heidelberg, 2013, Ch. 11,pp. 205–218.
[138] M. Erhard, H. Strauch, Theory and experimental validation ofa simple comprehensible model of tethered kite dynamics usedfor controller design, Airborne Wind Energy, U. Ahrens, M.Diehl, R. Schmehl Eds., Springer Berlin, Chapter 8, p 141 -165, 2013.
[139] J. Breukels, R. Schmehl, W. Ockels, Aeroelastic simulation offlexible membrane wings based on multibody system dynamics,in: Airborne Wind Energy, Springer, Berlin Heidelberg, 2013,Ch. 16, pp. 287–305. doi:10.1007/978-3-642-39965-7_24.
[140] P. Williams, B. Lansdorp, W. Ockels, Modeling and control ofa kite on a variable length flexible inelastic tether, AIAA Mod-elling and Simulation Technologies Conference and Exhibit,Hilton Head, SC, USA (2007) 6705.
[141] O. M. Faltinsen, Sea loads on ships and offshore structures,Cambridge University Press, Cambridge, 1990.
[142] A. F. de O. Falco, Wave energy utilization: A review of thetechnologies, Renewable and Sustainable Energy Reviews 14 (3)(2010) 899 – 918.
[143] A. Babarit, J. Hals, M. Muliawan, A. Kurniawan, T. Moan,J. Krokstad, Numerical benchmarking study of a selection ofwave energy converters, Renewable Energy 41 (0) (2012) 44 –63.
[144] R. A. Skop, Mooring systems: A state-of-the-art review, J.Offshore Mech. Arct. Eng. 110 (4) (1988) 365 – 372.
[145] R. E. Harris, L. Johanning, J. Wolfram, Mooring systems forwave energy converters: A review of design issues and choices,Paper presented at The Institute of Marine Engineering, Sci-ence and Technology (IMarEST) (2004) 180 – 189.
211

[146] L. Johanning, G. H. Smith, J. Wolfram, Mooring design ap-proach for wave energy converters, Proceedings of the Institu-tion of Mechanical Engineers. Part M, Journal of engineeringfor the maritime environment (online) 220 (4) (2006) 159 – 174.
[147] M. E. McCormick, Ocean wave energy conversion, Dover pub-lications Inc., Mineola, New York, 2007.
[148] T. Soulard, M. Alves, A. Sarmento, Force reacting principleapplied to a heave point absorber wave energy converter, Pro-ceedings of the International Offshore and Polar EngineeringConference (2009) 312–318.
[149] J. Falnes, On non-causal impulse response functions related topropagating water waves, Applied Ocean Research 17 (6) (1995)379 – 389.
[150] M. Alves, Numerical simulation of the dynamics of point ab-sorber wave energy converters using frequency and time domainapproaches, PhD Thesis, Universidade Tecnica de Lisboa Insti-tuto Superior Tecnico.
[151] F. Cerveira, N. Fonseca, R. Pascoal, Mooring system influenceon the efficiency of wave energy converters, International Jour-nal of Marine Energy 34 (0) (2013) 65 – 81.
[152] G. Moretti, D. Forehand, R. Vertechy, M. Fontana, D. Ingram,Modeling of an oscillating wave surge converter with dielectricelastomer power take-off, ASME 33rd International Conferenceon Ocean, Offshore and Arctic Engineering (2014).
[153] J. Falnes, Ocean waves and oscillating systems, Cambridge Uni-versity Press, Cambridge, 2004.
[154] Z. Yu, J. Falnes, State-space modelling of a vertical cylinder inheave, Applied Ocean Research 17 (5) (1995) 265–275.
[155] W. Cummins, The impulse response function and ship motions,Tech. rep., DTIC Document (1962).
[156] J. Nossen, J. Grue, E. Palm, Wave forces on three-dimensionalfloating bodies with small forward speed, Journal of Fluid Me-chanics 227 (1991) 135–160.
212

[157] M. Yamamoto, C. K. Morooka, S. Ueno, Dynamic behavior ofa semi-submersible platform coupled with drilling riser duringre-entry operation in ultra-deep water, in: ASME 2007 26th In-ternational Conference on Offshore Mechanics and Arctic Engi-neering, American Society of Mechanical Engineers, 2007, pp.239–248.
[158] A. Day, A. Babarit, A. Fontaine, Y.-P. He, M. Kraskowski,M. Murai, I. Penesis, F. Salvatore, H.-K. Shin, Hydrodynamicmodelling of marine renewable energy devices: A state of theart review, Ocean Engineering 108 (2015) 46–69.
[159] J. M. Jonkman, Dynamics of offshore floating wind turbines-model development and verification, Wind Energy 12 (5) (2009)459–492.
[160] M. E. McCormick, Ocean engineering wave mechanics, JohnWiley & Sons, 1973.
[161] J. M. Jonkman, Dynamics modeling and loads analysis of an off-shore floating wind turbine, Tech. Rep. TP-500-41958, NREL,Golden, Colorado (2007).
[162] J. Newman, C.-H. Lee, Boundary-element methods in offshorestructure analysis, Journal of Offshore Mechanics and ArcticEngineering 124 (2) (2002) 81–89.
[163] J. C. Henriques, J. C. Chong, A. F. Falcao, R. P. Gomes, Latch-ing control of a floating oscillating water column wave energyconverter in irregular waves, in: ASME 2014 33rd InternationalConference on Ocean, Offshore and Arctic Engineering, Amer-ican Society of Mechanical Engineers, 2014.
[164] D. Carter, Estimation of wave spectra from wave height andperiod, Tech. rep. (1982).
[165] L. Castro-Santos, S. F. Gonzalez, V. Diaz-Casas, Mooring forfloating offshore renewable energy platforms classification, in:International Conference on Renewable Energies and Powerquality (ICREPQ’13), Bilbao, Spain, 2013.
[166] C. Kwan, F. Bruen, et al., Mooring line dynamics: comparisonof time domain, frequency domain, and quasi-static analyses,
213

in: Offshore Technology Conference, Offshore Technology Con-ference, 1991.
[167] E. Loukogeorgaki, D. C. Angelides, Stiffness of mooring linesand performance of floating breakwater in three dimensions,Applied Ocean Research 27 (4) (2005) 187–208.
[168] D. Matha, M. Schlipf, R. Pereira, J. Jonkman, et al., Chal-lenges in simulation of aerodynamics, hydrodynamics, andmooring-line dynamics of floating offshore wind turbines, in:The Twenty-first International Offshore and Polar EngineeringConference, International Society of Offshore and Polar Engi-neers, 2011.
[169] U. Fechner, R. van der Vlugt, E. Schreuder, R. Schmehl,Dynamic model of a pumping kite power system, Renew-able EnergyarXiv:1406.6218, doi:10.1016/j.renene.2015.04.028.
[170] W. Breukels, J.; Ockels, Analysis of complex inflatable struc-tures using a multi-body dynamics approach, Collection ofTechnical Papers - AIAA/ASME/ASCE/AHS/ASC Struc-tures, Structural Dynamics and Materials Conference, 49thAIAA/ASME/ASCE/AHS/ASC Structures, Structural Dy-namics, and Materials Conference.
[171] C. Jehle, R. Schmehl, Applied tracking control for kite powersystems, AIAA Journal of Guidance, Control, and Dynamics37 (4) (2014) 1211–1222. doi:10.2514/1.62380.
[172] J. H. Baayen, W. J. Ockels, Tracking control with adaption ofkites, IET Control Theory and Applications 6 (2) (2012) 182–191. doi:10.1049/iet-cta.2011.0037.
[173] P. Williams, B. Lansdorp, W. J. Ockels, Nonlinear control andestimation of a tethered kite in changing wind conditions, AIAAJournal of Guidance, Control and Dynamics 31 (3). doi:10.
2514/1.31604.
[174] M. Erhard, H. Strauch, Flight control of tethered kites in au-tonomous pumping cycles for airborne wind energy, ControlEngineering Practice 40 (2015) 13–26.
214

[175] J. Jonkman, D. Matha, Dynamics of offshore floating wind tur-bines - analysis of three concepts, Wind Energy 14 (4) (2011)557–569.
[176] D. Roddier, C. Cermelli, A. Aubault, A. Weinstein, Windfloat:A floating foundation for offshore wind turbines, Journal ofRenewable and Sustainable Energy 2 (3) (2010) 033104.
[177] K. H. Lee, Responses of floating wind turbines to wind and waveexcitation, Ph.D. thesis, Massachusetts Institute of Technology(2005).
[178] D. Qiao, J. Ou, F. Wu, et al., Design selection analysis for moor-ing positioning system of deepwater semi-submersible platform,in: The Twenty-second International Offshore and Polar Engi-neering Conference, International Society of Offshore and PolarEngineers, 2012.
[179] W. Musial, S. Butterfield, A. Boone, Feasibility of floating plat-form systems for wind turbines, in: 23rd ASME Wind EnergySymposium, Reno, NV, 2004.
[180] K. Ruehl, D. Bull, Wave energy development roadmap: designto commercialization, in: Oceans, 2012, IEEE, 2012, pp. 1–10.
[181] M. Zanon, S. Gros, J. Meyers, M. Diehl, Airborne Wind En-ergy: Airfoil-Airmass Interaction, IFAC 19th World Congress,The International Federation of Automatic Control, CapeTown, South Africa. August 2014.
[182] S. Gros, M. Diehl, Modeling of airborne wind energy sys-tems in natural coordinates, in: U. Ahrens, M. Diehl,R. Schmehl (Eds.), Airborne Wind Energy, Springer, BerlinHeidelberg, 2013, Ch. 10, pp. 181–203. doi:10.1007/
978-3-642-39965-7_10.
[183] C. Archer, K. Caldeira, Atlas of high altitude wind power,www.mdpi.com/ 1996-1073/2/2/307/s1 - last accessed on 1stJuly 2016.
[184] National Oceanic and Atmospheric Administration, Ra-diosonde Wind Database, http://esrl.noaa.gov/raobs/ accessedon 1st July 2016.
215

[185] Video, Control Line Flying from Inside the Circle, video,www.youtube.com/ watch?v=4uy4Vq7eSoI - last accessed on1st July 2016.
[186] K. Geebelen, Design and Operation of Airborne Wind EnergySystems, PhD thesis, KU Leuven, 2015.
[187] M. Schulz, F. Augugliaro, R. Ritz, R. DAndrea, High-speed,Steady Flight with a Quadrocopter in a Confined EnvironmentUsing a Tether, Proceedings of IEEE/RSJ International Con-ference on Intelligent Robots and Systems (IROS), CongressCenter Hamburg, (2015), Hamburg, Germany.
[188] G. Hays, Control Line Flight, Video url: youtu.be/4uy4Vq7eSoI?t=125 (accessed on 06/02/2017) (2014).
[189] T. Petschel, Control Line Flight From A World Cham-pion, Video url: youtu.be/ 0tRqihqtzgY?t=152 (accessed on06/02/2017) (2016).
[190] M. Erhard, H. Strauch, Sensors and navigation algorithmsfor flight control of tethered kites, in: Proceedings of theEuropean Control Conference (ECC13), Zurich, Switzerland.arXiv:1304.2233.
[191] A. Cherubini, B. Szalai, R. Schmehl, M. Fontana, Auto-matic control-line flight for jet stream wind energy drones,Video url: youtube.com/watch?v=PaeCZ72ghRQ (accessed on05/05/2017) (2016).
[192] A. D. Zoysa, Steady state analysis of undersea cables, OceanEngineering 5 (3) (1978) 209–223.
[193] M. Every, R. King, D. Weaver, Vortex excited vibrations ofcylinders and cables and their suppression, Ocean Engineering9 (2) (1982) 135–157.
[194] P. Wingham, Comparative steady state deep towing perfor-mance of bare and faired cable systems, Ocean Engineering10 (1) (1983) 1–32.
[195] Mercedes, Lewis Hamilton visit in the Mer-cedes wind tunnel and in the driving simulator,https://www.youtube.com/watch?v=2pzDtT4BKIg lastaccessed Jan 2016.
216

[196] GermanCarForum.com, GermanCarForum.com,http://www.germancarforum.com/threads/aerodynamic-wind-tunnel-pictures.53082/ last accessed Jan 2016.
217

My publications
· Antonello Cherubini, Balazs Szalai, Roland Schmehl, Marco Fontana,‘Automatic control-line-flight for jet stream wind energy drones’, tobe submitted, 2017
· Antonello Cherubini, Marco Fontana, ‘An Assessment of a MegawattScale Offshore Wind Energy Drone Generator at Jet Stream Alti-tude’, to be submitted, 2017
· Antonello Cherubini, Giacomo Moretti, Marco Fontana, ‘Dynamicmodeling of floating offshore airborne wind energy converters’, Air-borne Wind Energy, Roland Schmehl Ed., Book Chapter, 2017
· Antonello Cherubini, Rocco Vertechy, Marco Fontana, ‘Simplifiedmodel of offshore Airborne Wind Energy Converters’, RenewableEnergy, 88, 465-473, 2016
· Antonello Cherubini, Andrea Papini, Rocco Vertechy, Marco Fontana,‘Airborne Wind Energy Systems: A review of the technologies’, Re-newable and Sustainable Energy Reviews, 51, 14611476, 2015 - firstgoogle result when looking for ‘Airborne Wind Energy’
· Antonello Cherubini, Giacomo Moretti, Rocco Vertechy, MarcoFontana, ‘Experimental characterization of thermally-activated ar-tificial muscles based on coiled nylon fishing lines’, AIP Advances,2015
· Giacomo Moretti, Antonello Cherubini, Rocco Vertechy, MarcoFontana, ‘Experimental characterization of a new class of polymeric-wire coiled transducers’, SPIE Conference, San Diego, 2015
· Antonello Cherubini, Massimo Ippolito, ‘Puleggia perfezionata perverricello ad alta efficienza’, patent application ITTO20130365,2013
218

219

220