advances on cognitive automation at lgi2p / ecole des ...urtado/slides/rr11_lab_001.pdf ·...
TRANSCRIPT

Advances on cognitive automationat LGI2P / Ecole des Mines d'Alès
Doctoral research snapshot 2010-2011
June 2011Research report RR11/Lab/001


Foreword
This research report is the accompanying document of the annual day-long seminar devoted topresenting the research works led by PhD students at the LGI2P lab of Alès School of Mines.
The 2011 edition of the seminar will take place on June 28th. All PhD students from theLGI2P lab will present the results they obtained during the past academic year. The format oftheir presentations will vary depending on their thesis advancement. All presentations will befollowed by extensive time for questions from the audience.
The aggregation of abstracts of these works constitute the present research report and give aprecise snapshot of the research on cognitive automation led in the lab this year.
I would like to thank all the members of the LGI2P lab for their professionalism andenthusiasm in helping me prepare and participating in this seminar.
I wish you all a nice and informative seminar, a fruitful reading and hope to see you all againfor next year’s edition!!
Page 1

Page 2

Contents
First year PhD students
Afef DENGUIR Page 5
Improvement of energy management system
Sébastien HARISPE Page 9
Measures of semantic similarity based on a hierarchical ontology
Mambaye LO Page 17
Contribution to the Analysis of Architectures in Mechatronics Systems Engineering
Second year PhD students
Clémentine CORNU Page 23
Toward an equipped methodological guide for the introduction of Systems Engineering withina company considering interoperability
Benjamin DUTHIL Page 27
Towards an automatic characterization of criteria for opinion-mining
Matthieu FAURE Page 31
A Service Component Framework for Multi-User Scenario Management in UbiquitousEnvironments
François PFISTER Page!35
A Design Pattern meta-model proposal for Systems Engineering
Thanh-Liem PHAN Page 40
Incremental construction of component assembly supported by behavioural verification
Mohameth-François SY Page!44
Ontology-based user profiling
Page 3

Third year PhD students
Abdelhak IMOUSSATEN Page 48
Multicriteria and multiactor decision situations in the management of industrial safety
Sihem MALLEK Page 52
An approach for an anticipative detection of interoperability problems in collaborative process
Jean-Louis PALOMARÈS Page 56
Circular signal descriptor in points of interest
Fourth year PhD students
Baptiste MAGNIER Page!61
Rotating Half Smoothing Filters, Image Segmentation and Anisotropic Diffusion
PhD defense announcement
Sihem MALLEK Page 66
Page 4

IMPROVEMENT OF ENERGY MANAGEMENT
SYSTEM
Afef DENGUIR1, Jacky MONTMAIN2, François TROUSSET2
1 LGI2P EMA - LIRMM UM2, Site EERIE – Parc Scientifique G.Besse - 30035 Nîmes cedex 12 LGI2P EMA - Site EERIE – Parc Scientifique G.Besse - 30035 Nîmes cedex 1
{afef.denguir, jacky.montmain, francois.trousset}@mines-ales.fr
Abstract: The incessant greed of energy needs has raised their cost to unexpected values. As
answer, a lot of projects have been issued in order to gain efficient energy economies. In this
context, this work tries to give pathways to provide recommendations to decrease those costs.
Instead of searching for complex and difficult quantitative models of system behavior to give
precise recommendations, we choose in our approach to deal with energy management system
improvement considering both subjective system evaluation and weak system dependency
solution constraints.
Keywords: multi-scaled energy management model, influence relationship, functional
dependency users’ preferences constraints, optimization, system variability modeling.
1 Introduction
Nowadays, we assist to a high energy demand against a constant or even a decreasing
supply which yield to an increasing energy cost. That’s why managing energy
efficiently has become one of the most important purposes of organizations and
households. Several energy management solutions were proposed to deal with the
efficient energy management request but they all have the same drawbacks which
consist in their strong system dependency and their carelessness of user subjective
perceptions of improvement.
The RIDER (Réseaux et Interconnectivité Des Energies classiques et
Renouvelables) project has as main goal the development of an energy management
framework for different systems with various scales: building, subdivision of
buildings, neighborhood or even a town.
This PhD is part of RIDER project and its aim is to develop generic optimization
techniques for energy management systems. These techniques have to be applicable at
various optimization scales and take in consideration user subjective perceptions of
improvement.
The paper is structured as follows. First, section 2 concerns subjectivity in system
performance evaluation. Section 3 gives proposals and methods to model the
improvement of energy management system. Finally, we finish by a conclusion that
summarizes paper content and gives outlooks of our future works.
2 Subjective evaluation of performances
System performances are evaluated subjectively depending on user preferences and
his interpretation of system’s outputs with regard to his goals (e.g. we consider a
heating system and the temperature as its primary output. Even when there is no
malfunctioning detected, i.e. temperature value is equal to its set-point; two users may
be more or less tolerant to set-point variations and thus not equally satisfied). Based
on this observation, users’ and facility managers’ preferences have to be captured in
the model of the managed energy system.
The managed energy system model has to consider a physical sub-model which
describes the system behavior (e.g., how temperature evolves in time); as well as a
preferences sub-model which represents users’ and facility managers’ appreciations of
Page 5

system outputs (e.g. the way thermal comfort is related to temperature depends on
users).
In order to build a weak system dependency solution and deal with multi-scale
requirements, we choose to use learning techniques to construct physical and
preferences sub-models. In this case, parametric identification is interesting for the
physical sub-model learning whereas other subjective and indirect method like AHP
[9] or MACBETH are more suitable for preferences sub-model learning.
When physical and preferences sub-models are inversible, it’s possible to make
various types of decisions (optimize control, adaptation and anticipation) based on the
two learned sub-models, otherwise it is necessary to do simulations and use forecast
methods which generally lead to combinatorial problems (heuristics must be
introduced to solve our optimization problems). To bypass this problem, we propose
to construct as many as simple models (inversible models) as system modes [7]. Note
that switching between modes may both change actions availability and user
preferences.
3 Indicator system
To instantiate the generic model of the managed energy system on a given system and
scale, we use an indicators system which connects subjective and objective variables.
Whatever the system or the scale, these variables may be actions, attributes
(measurements) or performances (degrees of satisfaction) and they are connected with
different semantic relationships: dependency relationships, influence relationships and
preference relationships (Fig. 1)
Fig. 1. Indicator system model
The possible system actions can be system actuators, set-points changes, etc.
Actions are connected to the system attributes by influence relationships (e.g. gain
parameters). Physical constraints are represented by dependency relationships
between actions.
Attributes refer to system characteristics such as sensors measurements. The last
variables are system performances which are connected with system attributes by
preference relationships (e.g. weight parameters).
Performances are related to criteria and decisions are made from these criteria.
Thus, our aim is to identify most relevant actions with regard to a preference
framework under behavioral constraints.
Several methods from different research areas were proposed by literature to
express influence, dependency and preference relationships.
3.1 Influence relationships
The influence relationship modeling is mixed with the physical sub-model
construction. It consists on system’s outputs prediction based on its inputs. System
outputs correspond to the attribute set X of the indicator system whereas system inputs
refer to its action set A (Fig. 1).
Page 6
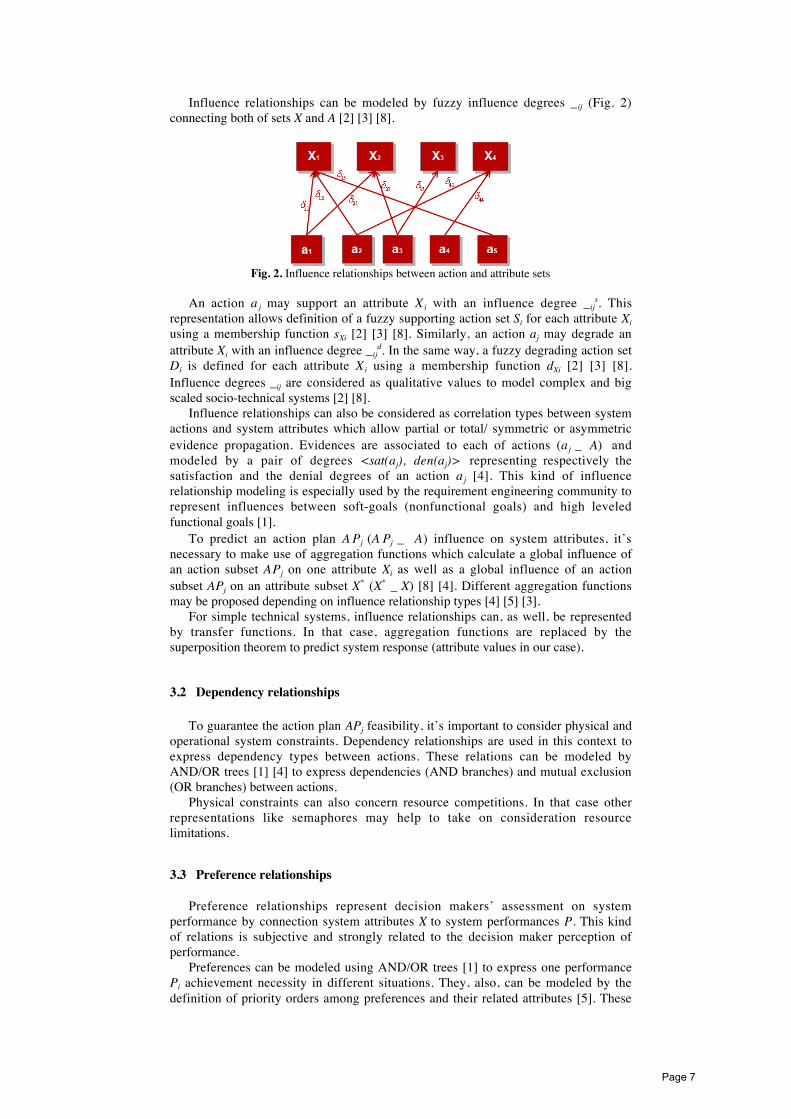
Influence relationships can be modeled by fuzzy influence degrees _ij (Fig. 2)
connecting both of sets X and A [2] [3] [8].
Fig. 2. Influence relationships between action and attribute sets
An action aj may support an attribute Xi with an influence degree _ijs. This
representation allows definition of a fuzzy supporting action set Si for each attribute Xi
using a membership function sXi [2] [3] [8]. Similarly, an action aj may degrade an
attribute Xi with an influence degree _ijd. In the same way, a fuzzy degrading action set
Di is defined for each attribute Xi using a membership function dXi [2] [3] [8].
Influence degrees _ij are considered as qualitative values to model complex and big
scaled socio-technical systems [2] [8].
Influence relationships can also be considered as correlation types between system
actions and system attributes which allow partial or total/ symmetric or asymmetric
evidence propagation. Evidences are associated to each of actions (aj _ A) and
modeled by a pair of degrees <sat(aj), den(aj)> representing respectively the
satisfaction and the denial degrees of an action aj [4]. This kind of influence
relationship modeling is especially used by the requirement engineering community to
represent influences between soft-goals (nonfunctional goals) and high leveled
functional goals [1].
To predict an action plan A Pj (A Pj _ A) influence on system attributes, it’s
necessary to make use of aggregation functions which calculate a global influence of
an action subset APj on one attribute Xi as well as a global influence of an action
subset APj on an attribute subset X* (X* _ X) [8] [4]. Different aggregation functions
may be proposed depending on influence relationship types [4] [5] [3].
For simple technical systems, influence relationships can, as well, be represented
by transfer functions. In that case, aggregation functions are replaced by the
superposition theorem to predict system response (attribute values in our case).
3.2 Dependency relationships
To guarantee the action plan APj feasibility, it’s important to consider physical and
operational system constraints. Dependency relationships are used in this context to
express dependency types between actions. These relations can be modeled by
AND/OR trees [1] [4] to express dependencies (AND branches) and mutual exclusion
(OR branches) between actions.
Physical constraints can also concern resource competitions. In that case other
representations like semaphores may help to take on consideration resource
limitations.
3.3 Preference relationships
Preference relationships represent decision makers’ assessment on system
performance by connection system attributes X to system performances P. This kind
of relations is subjective and strongly related to the decision maker perception of
performance.
Preferences can be modeled using AND/OR trees [1] to express one performance
Pi achievement necessity in different situations. They, also, can be modeled by the
definition of priority orders among preferences and their related attributes [5]. These
Page 7

kinds of representation (AND/OR trees and priorities) are quit restrictive and luck of
subjectivity expressivity.
In order to express users and facility manager’ preferences, subjective and indirect
method like AHP [9] and ELECTRE [10] coming from multi-criteria decision making
area; are most suitable and give more facilities to express subjectivity. These methods
allow both subordination preferences modeling (preference or indifference between
performances or attributes) and coordination preferences modeling (interactions
between performances or attributes).
To predict users and facility manager’ assessment on system performance, it’s
necessary to use aggregation functions like Choquet integral which consider as well
subordination and coordination preferences [6].
Influence, dependency and preference relationships modeling and their associated
aggregation functions or rules enable most relevant actions identification with regard
to a preference framework following physical and operational constraints.
4 Conclusion
Managing energy efficiently isn’t only a set-points satisfaction matter. Users and
facility manager’ assessments of the system response are as much important as the
system ability to reach fixed set-points. That’s why, energy system model has to
consider system behavior and constraint as well as users and facility manager’
preferences and perceptions of improvement.
In this paper, we studied different ways to model dependencies, influences and
preferences. This our objective is to mix those approaches in order to build a more
suitable and efficient model for energy recommendation witch consider, from one
hand, human perception of improvement and should be, system scale independent
from the other hand.
References
1 GONZALEZ-BAIXAULI, B., LE I T E, J.C.S.P., AND MYLOPOULOS, J., VISUAL VARIABILITY
ANALYSIS FOR GOAL MODELS. IN 12TH IEEE INTERNATIONAL CONFERENCE ON REQUIREMENTS
ENGINEERING, PAGE 198-207, KYOTO, JAPAN, 6-11 SEPT. 2004.
2. MONTMAIN, J. LABREUCHE, C. AMELIORATION MULTICRITERE D’OPTIONS DANS LES SYSTEMES
COMPLEXES. LFA, NOVEMBRE 2009, ANNECY, FRANCE.
3. FELIX, R. MULTICRITERIA DECISION MAKING (MCDM): MANAGEMENT OF AGGREGATION
COMPLEXITY THROUGH FUZZY INTERACTIONS BETWEEN GOALS OR CRITERIA. 12TH INT.
CONFERENCE IPMU, 2008, MALAGA, SPAIN.
4. GIORGINI, P., MYLOPOULOS, J., NICCHIARELLI, E., AND SEBASTIANI, R., REASONING WITH
GOAL MODELS IN 21ST INTERNATIONAL CONFERENCE ON CONCEPTUAL MODELING, PAGE 167-181,
LONDON, UK, 2002.
5 FELIX, R. RELATIONSHIPS BETWEEN GOALS IN MULTIPLE ATTRIBUTE DECISION MAKING. FUZZY
SETS AND SYSTEMS 1994, 67, P.!47-52.
6 SAHRAOUI, S., MONTMAIN, J., BERRAH, L. AND M AURIS, G. USER-FRIENDLY OPTIMAL
IMPROVEMENT OF AN OVERALL INDUSTRIAL PERFORMANCE BASED ON A FUZZY CHOQUET INTEGRAL
AGGREGATION. IEEE INT. CONF. ON FUZZY SYSTEMS, 2007, LONDON, UK.
7. FL E U R E Y, F., SO L B E R G, A. A DOMAIN S PECIFIC MODELING LANGUAGE SUPPORTING
SPECIFICATION, SIMULATION AND EXECUTION OF DYNAMIC ADAPTIVE SYSTEMS. IN PROCEEDINGS
OF THE MODELS/UML 2009 CONFERENCE, 2009
8. IM O U S S A T E N , A., MO N T M A I N , J., TR O U S S E T, F., LABREUCHE, C. MULTI-CRITERIA
IMPROVEMENT OF OPTIONS, EUROPEAN SOCIETY FOR FUZZY LOGIC AND TECHNOLOGY (EUSFLAT).
2011.
9. SAATY T. L., THE ANALYTIC HIERARCHY PROCESS, MCGRAW-HILL, NEW YORK, 1980.
10 ROY B. CLASSEMENT ET CHOIX EN PRESENCE DE POINTS DE VUE MULTIPLES. LA METHODE
ELECTRE RIRO 1968;8:57–75.
Page 8

Measures of semantic similarity based on ahierarchical ontology
Sebastien Harispe, Sylvie Ranwez, and Stefan Janaqi
LGI2P, Ecole des Mines d’AlesSite EERIE, Parc scientifique G. Besse, F - 30035 Nımes, France
Resume Assessing the semantic similarity between concepts correspondsto evaluating their likeness in a way that incorporates semantic informa-tion. Measures of semantic similarity are generally used to automaticallyimitate human judgement regarding concept relatedness. Widely used invarious analysis such as natural language processing, information retrie-val and data mining, semantic similarity has become an important issuein many research areas including Linguistics, Artificial Intelligence andPsychology. Many methods based on multiple knowledge sources, suchas text corpora, taxonomy or more complex domain specification alreadyexist. The conceptual specification represented by an ontological hierar-chy constitutes a space which appears particularly adapted to the defini-tion of accurate semantic similarity measures. Several approaches usingontological hierarchy were designed for various needs which makes it dif-ficult today to select the best solution adapted to a specific problematic.Detailing the main approaches will allow us to thoroughly understandtheir foundations in order to highlight the key metrics to consider, withthe aim of comparing semantic similarity measures.
Keywords: Semantic similarity, ontology, subsumption hierarchies, taxo-nomy, information content, graph.
1 Introduction
Studies have shown that humans are able to quickly assess the semantic re-
latedness of two concepts in a way that they generally agree [26,14]. To give
an example, most people would define ”coffee” as more related to ”cup” than to
”telephone”. Due to the process complexity involved behind human perception
of relatedness, the fascinating physiological and psychological explanations of
this ability remains unclear. Despite the difficulty to explain the foundations of
semantic relatedness perception, researchers have tried to design automatic me-
thods which calculate semantic similarity as human do. Semantic similarity and
relatedness are two distinct notions. The former relies on the degree of taxono-
mic likeness between concepts considering relationships such as hyponymy and
hyperonymy whereas the latter is more general because others kinds of semantic
relationships (e.g. part-of ) can be considered [16]. The study of semantic rela-
tedness and similarity between concepts has been a very active trend in compu-
tational linguistics over the past twenty years. There are numerous applications
Page 9
II
which include information retrieval [12], visualization [22], document clustering
and categorization [4], gene analysis [19], among others. Several approaches and
calculation methods involving different knowledge sources have been defined. We
propose to focus on the main approaches exploiting structured representations
of knowledge, such as taxonomy, or a more complex space described by an onto-
logy specification, which will help us to define their foundations and to highlight
the information taken into account. We will only discuss methods used to assess
semantic similarity, however most of them can be adapted and generalized to
deal with semantic relatedness.
2 The is-a hierarchy as a base for semantic similarity
Hierarchical structures including subsumption hierarchies or taxonomies are
a common way to represent and classify knowledge, they generally only consider
inheritance relationships underlying specialization (is-a relation). These basic
knowledge organizations have evolved into formal representations such as onto-
logy in order to incorporate the wealth of the domain modeled, including many
types of relationships and logical descriptions. Both representation skeletons pro-
vide an interesting graph model in which vertices refer to the concepts characte-
rizing the domain and the oriented edges represent semantic relationships among
them. As semantic relationships are oriented, cycles are not allowed and only one
root (i.e node without ancestors) is admitted, the graph corresponds to a rooted
direct acyclic graph (rDAG).
Due to the difficulties to integrate the full richness of an ontology and to
wholly appreciate its meaning in order to discuss semantic similarity, most mea-
sures only consider ontologies as subsumption hierarchies. The few attempts
made taking into consideration i) class properties, ii) logical description and iii)
all relationships characterizing an ontology were promising but suffered from lack
of genericity. Thereby the hierarchical ontology represented by the is-a rDAG is
commonly used as a working space for assessing semantic similarity.
3 Measures of semantic similarity overview
3.1 The edge-based approach
The first measures based on hierarchical structures consider the similarity
of two concepts as inversely proportional to the length of the minimum path
linking them [36,21,3]. Note that said similarity is computed using a distance. To
normalize the assessed similarity taking into account the expressiveness of the
model, the maximal distance between two concepts can be integrated [11,23].
Basic path length measures do not differentiate between paths only composed
of generalization or specialization events and those composed of the two. Effortsto consider this information have been made through the penalization of the
number of event changes [8].
Page 10

III
Since the hierarchical ontology is made up of specialization/generalizationrelationships, the depth of a concept (i.e. the length of the path to the root) isdirectly correlated to its degree of specialization. This consideration is known as”depth-relative scaling”, the more a concept is specialized the less the product ofits specialization is supposed to be distant from it [38,45]. Another feature of thegraph which can be exploited to approximate link weights relies on the degreeof nodes, that is to say the number of links a node has. Defined as ”local densityeffect”, this suggests that the greater the density, the closer the distance betweenthe nodes [24]. Improvements to the shortest path measures, considering nodedepth and density to weight links, refine the similarity. In fact, is-a relationshipscan be characterized by weights and the distance between two nodes can beestimated as a sum of weights [24,38].
The intersection of the properties shared by two concepts can be seen as theproperties characterizing their least common ancestor (lca) [44,18,39]. This keynotion is the basis of numerous measures. The depth of the lca and the distancebetween the lca and compared concepts are very informative. Wu and Palmeramong others proposed different ways to express this notion in order to integratethe specificity of the compared concepts [44,37,18,34,42].
The edge-based approach takes into account a lot of topological informa-tion contained in the graph representation. It has a generally low computationtime and because measures are based solely on ontological hierarchy their resultscan be explained and discussed considering the domain specification defined byspecialists. This approach is well-suited for massive ontologies composed of ahomogeneous distribution of links and good inter-domain coverage [10]. Never-theless, the main problem is that the coherency of measures heavily depends onthe expressiveness of the ontology as it could be strongly impacted by partialknowledge modeling [5]. Degrees of completeness, homogeneity and coverage areimportant factors to take into account in order to ensure edge-based measurecoherency [27].
3.2 The node-based approach
The node-based approach focuses on the information content (IC) charac-terizing each concept. The IC defines the degree of specificity of a concept,based on the assumption that the more a concept is used the less informative itis. Resnik originally defined the IC of a concept as a function of its frequencyin a corpus of text, considering that a concept appears when said concept orone of its descendants appear in the corpus [23]. Numerous intrinsic IC com-putation methods, based on the topological information of the rDAG, have alsobeen proposed in order to reduce computation time and corpus sparseness effects[29,46,32,41,25,28,30,20].
The similarity of two concepts can directly be seen as the IC of the mostinformative common ancestor (MICA), the common ancestor with the highestIC value [23]. The MICA indicates the information content shared by the twoconcepts, the more information two concepts share, the more similar they are.
Page 11

IV
Information contents of compared concepts can also be taken into account during
similarity calculation [13,10,31].
Due to the rDAG structure two concepts can share disjunctive common an-
cestors (DCA) thus the integration of all DCA information content can also
lead to an accurate comparison [6].
The node-based approach is less sensitive to variable semantic distance and
hierarchy expressiveness than path-based measures [23] and generally produces
better results than path-based approach. Nevertheless, data sparseness and com-
putational burden of corpus pre-processing are highly limiting [1]. Thereby, cor-
pora issues can be sidestepped using intrinsic IC at the cost of introducing
topological dependencies to semantic similarity measures.
3.3 Other approaches
Path-based and node-based measures do not consider features of the concepts
expressed by the domain specification. The feature-based approach focuses on
this valuable information by considering the semantic similarity of two concepts
as a function evaluating the quantity of their common and different properties
[40]. In this context, various classical set-based similarity measures can also be
used [9,7,15,2,33,35].
Another approach, defined as hybrid, combines some of the presented ap-
proaches. Path-based and node-based approaches can be mixed [25,42,3]. The
feature-based approach can also be redefined in terms of IC [28] or adapted to
consider topological information [43,22].
3.4 Concluding remarks and future work
Multiple approaches defining various measures are used to assess the semantic
similarity of two concepts considering a hierarchical ontology. The accuracy and
the sensibility of measures are usually compared to benchmarks built from hu-
man assessed similarities of concepts within few hierarchical ontologies [17,26,14].
As shown in several studies, performances of all proposed measures are highly
dependent on both the model considered and the use of the similarity [17,26].
Current available comparisons do not distinguish the measure which is better-
suited to a specific domain model or to a specific task. Ontological hierarchy
properties such as expressiveness and homogeneity appear to be useful metrics
for discussing the suitability of existing approaches and measures in a generic
way. The number of nodes, rDAG depth and node degrees can be used to cha-
racterized expressiveness while homogeneity can be evaluated using link density
and independent rDAG components.
Until now, large efforts have been made to develop new measures or to adapt
existing ones to a specific domain. A comprehensive study to compile and com-
pare semantic similarity and proximity measures is required. Moreover, conside-
ring the growing number of ontology developments, there is a consequent need
Page 12

V
for generic methods to discuss semantic similarity and proximity computation
strategies.
Thoroughly understanding semantic similarity and proximity based on hie-
rarchical ontologies will allow us to start dealing with various problematics invol-
ving ontologies and their graph representation. Ontology alignment and merging,
semantic clustering, sub-ontology extractions or query expansions are examples
of processes which can be approached from the point of view of a semantic si-
milarity/proximity.
References
1. Montserrat Batet, David Sanchez, and Aida Valls. An ontology-based measure tocompute semantic similarity in biomedicine. Journal of biomedical informatics,44(1) :118–125, September 2010.
2. Josias Braun-Blanquet. Plant sociology : the study of plant communities. McGraw-Hill, 1932.
3. Henrik Bulskov, Rasmus Knappe, and Troels Andreasen. On Measuring Similarityfor Conceptual Querying. In Proceedings of the 5th International Conference on
Flexible Query Answering Systems, volume 1, pages 100–111, London, UK, 2002.Springer-Verlag.
4. Rudi Cilibrasi and P.M.B. Vitanyi. The Google Similarity Distance. IEEE Tran-
sactions on Knowledge and Data Engineering, 19(3) :370–383, March 2007.
5. Philipp Cimiano. Ontology Learning and Population from Text : Algorithms, Eva-
luation and Applications. New York,NY, November 2006.
6. Francisco M. Couto, Mario J. Silva, and Pedro M. Coutinho. Semantic Similarityover the Gene Ontology : Family Correlation and Selecting Disjunctive Ancestors.In Conference in Information and Knowledge Management, pages 343–344. ACM,2005.
7. Lee R. Dice. Measures of the Amount of Ecologic Association Between Species.Ecology, 26(3) :297–302, 1945.
8. Graeme Hirst and David St-onge. Lexical chains as representations of context for
the detection and correction of malapropisms. Number April. MIT Press, Cam-bridge, MA, 1998.
9. Paul Jaccard. Distribution de la flore alpine dans le bassin des Dranses et dansquelques regions voisines. Bulletin de la Societe Vaudoise des Sciences Naturelles,37 :241 – 272, 1901.
10. Jiang Jay J. and Conrath David W. Semantic Similarity Based on Corpus Statisticsand Lexical Taxonomy. In In International Conference Research on Computational
Linguistics (ROCLING X), volume cmp-lg/970, page 15, 1997.
11. Claudia Leacock and Martin Chodorow. Combining Local Context and WordNet
Similarity for Word Sense Identification, chapter 13, pages 265 – 283. MIT Press,1998.
12. Joon Ho Lee, Myoung Ho Kim, and Yoon Joon Lee. Information retrieval basedon conceptual distance in is-a hierarchies. Journal of Documentation, 49(2) :188 –207, 1993.
Page 13

VI
13. Dekang Lin. An Information-Theoretic Definition of Similarity. In 15th Interna-
tional Conference of Machine Learning, pages 296–304, Madison,WI, 1998.
14. George A. Miller and Walter G. Charles. Contextual Correlates of Semantic Simi-larity. Language & Cognitive Processes, 6(1) :1–28, 1991.
15. Akira Ochiai. Zoogeographic studies on the soleoid fishes found in Japan and itsneighbouring regions. Bulletin of the Japanese Society of Scientific Fischeries,22(9) :526–530, 1957.
16. Siddharth Patwardhan and Ted Pedersen. Using WordNet-based context vectorsto estimate the semantic relatedness of concepts. In EACL Workshop Making
Sense of Sense—Bringing Computational Linguistics and Psycholinguistics Toge-
therWorkshop Making Sense of Sense—Bringing Computational Linguistics and
Psycholinguistics Together, pages 1–8, 2006.
17. Ted Pedersen, Serguei V S Pakhomov, Siddharth Patwardhan, and Christopher GChute. Measures of semantic similarity and relatedness in the biomedical domain.Journal of biomedical informatics, 40(3) :288–99, June 2007.
18. Viktor Pekar and Steffen Staab. Taxonomy learning : factoring the structure ofa taxonomy into a semantic classification decision. In COLING ’02 Proceedings
of the 19th international conference on Computational linguistics, volume 2, pages1–7. Association for Computational Linguistics, 2002.
19. Catia Pesquita, Daniel Faria, Andre O. Falcao, Phillip Lord, and Francisco M.Couto. Semantic similarity in biomedical ontologies. PLoS Computational Biology,5(7) :12, July 2009.
20. Giuseppe Pirro and Jerome Euzenat. A Feature and Information Theoretic Fra-mework for Semantic Similarity and Relatedness. In Proceedings of the 9th Inter-
national Semantic Web Conferene ISWC 2010, pages 615–630. Springer, 2010.
21. Roy Rada, Hafedh Mili, Ellen Bicknell, and Maria Blettner. Development andapplication of a metric on semantic nets. Ieee Transactions On Systems Man And
Cybernetics, 19(1) :17–30, 1989.
22. Sylvie Ranwez, Vincent Ranwez, Jean Villerd, and Michel Crampes. OntologicalDistance Measures for Information Visualisation on Conceptual Maps. Lecture
notes in computer science, 4278/2006(On the Move to Meaningful Internet Systems2006 : OTM 2006 Workshops) :1050–1061, 2006.
23. Philip Resnik. Using Information Content to Evaluate Semantic Similarity in aTaxonomy. In Proceedings of the 14th International Joint Conference on Artificial
Intelligence IJCAI, volume 1, pages 448–453. Citeseer, 1995.
24. Ray Richardson and Alan F. Smeaton. Using WordNet in a Knowledge-BasedApproach to Information Retrieval. 1995.
25. M. Andrea Rodrıguez and Max J. Egenhofer. Determining semantic similarityamong entity classes from different ontologies. IEEE Transactions on Knowledge
and Data Engineering, 15(2) :442–456, 2003.
26. Herbert Rubenstein and John B. Goodenough. Contextual correlates of synonymy.Communications of the ACM, 8(10) :627–633, October 1965.
27. David Sanchez. Domain Ontology Learning from the Web. PhD thesis, December2009.
28. David Sanchez, Montserrat Batet, and David Isern. Ontology-based informationcontent computation. Knowledge-Based Systems, 24(2) :297–303, March 2011.
Page 14

VII
29. Mark Sanderson and Bruce Croft. Deriving concept hierarchies from text. InProceedings of the 22nd annual international ACM SIGIR conference on Researchand development in information retrieval - SIGIR ’99, pages 206–213, New York,USA, 1999. ACM Press.
30. K Saruladha, Gnanasekaran Aghila, and Sajina Raj. A new semantic similaritymetric for solving sparse data problem in ontology based information retrievalsystem. International Journal of Computer Science Issues, 7(3) :40–48, 2010.
31. Andreas Schlicker, Francisco S. Domingues, Jorg Rahnenfuhrer, and Thomas Len-gauer. A new measure for functional similarity of gene products based on GeneOntology. BMC bioinformatics, 7(1) :302, January 2006.
32. Nuno Seco, Tony Veale, and Jer Hayes. An Intrinsic Information Content Metricfor Semantic Similarity in WordNet. In 16th European Conerence on ArtificialIntelligence, volume 16, pages 1–5. IOS Press, 2004.
33. George Gaylord Simpson. Notes on the measurement of faunal resemblance. Ame-rican Journal of Science, 258A :300–311, 1960.
34. Thabet Slimani, Ben Yaghlane Boutheina, and Khaled Mellouli. A New SimilarityMeasure based on Edge Counting. In World academy of science, engineering andtechnology,, pages 34–38, 2006.
35. Robert Reuven Sokal and Peter Henry Andrews Sneath. Principles of numericaltaxonomy. W. H. Freeman and Company, San Francisco, 1963.
36. John F. Sowa. Conceptual structures : information processing in mind and machine.Addison-Wesley, October 1984.
37. Nenad Stojanovic, Maedche Alexander, Steffen Staab, Studer Rudi, and Sure York.SEAL - A Framework for Developing SEmantic PortALs. Lecture notes in computerscience, 2097/2001, :1–22, 2001.
38. Michael Sussna. Word Sense Disambiguation Using a Massive of Computer forFree-text Semantic Indexing Network. In Proceedings of the Second InternationalConference on Information and Knowledge Management (CIKM-93), Arlington,Virginia, 1993. ACM.
39. Amos Tversky. Features of similarity. Psychological Review, 84(4) :327–352, 1977.
40. Amos Tversky and Gati Itamar. Studies of Similarity, pages 79–98. LawrenceErlbaum, Hillsdale, NJ, 1978.
41. Carl Van Buggenhout and Werner Ceusters. A novel view on information contentof concepts in a large ontology and a view on the structure and the quality ofthe ontology. International journal of medical informatics, 74(2-4) :125–32, March2005.
42. Li Yuhua, Zuhair A. Bandar, and David McLean. An approach for measuring se-mantic similarity between words using multiple information sources. IEEE Tran-sactions on Knowledge and Data Engineering, 15(4) :871–882, July 2003.
43. Haıfa Zargayouna and Sylvie Salotti. Mesure de similarite dans une ontologiepour l’indexation semantique de documents XML. In IC 2004 : 15es journeesfrancophones d’ingenierie des connaissances, pages 249–260, Lyon, 2004. PressesUniversitaires de Grenoble, Grenoble, FRANCE.
44. Wu Zhibiao and Martha Palmer. Verb semantics and lexical selection. In 32nd.Annual Meeting of the Association for Computational Linguistics, pages 133–138,1994.
Page 15

VIII
45. Jiwei Zhong, Haiping Zhu, Jianming Li, and Yong Yu. Conceptual Graph Mat-
ching for Semantic Search. In ICCS ’02 Proceedings of the 10th InternationalConference on Conceptual Structures : Integration and Interfaces, pages 92–196.
Springer-Verlag, 2002.
46. Zili Zhou, Yanna Wang, and Junzhong Gu. A New Model of Information Content
for Semantic Similarity in WordNet. In FGCNS ’08 Proceedings of the 2008 SecondInternational Conference on Future Generation Communication and NetworkingSymposia - Volume 03, pages 85–89. IEEE Computer Society, December 2008.
Page 16
Contribution to the Analysis of Architectures
in Mechatronics Systems Engineering
(Progress report)
Mambaye LÔ,1, Pierre Couturier1, Vincent Chapurlat1,
1 LGI2P, Ecole des Mines d’Alès
Site EERIE, Parc scientifique G. Besse, F – 30 035 Nîmes, France {lo.mambaye, pierre .couturier, vincent.chapurlat}@mines-ales.fr
Abstract. System Engineering is an adapted framework for designing complex systems. The purpose of the PHD thesis is to provide some models, methods and tools to contribute on Evaluation and Optimization processes during the design of mechatronic systems. Mechatronic systems involve various technical and scientific disciplines, such as mechanics, electronics, and computer science. From the stakeholders’ needs definition, products are specified, designed and integrated. During the development phases, the right choices have to be made taking into account the engineers’ different points of view so as to design the right product that must satisfy the consumers’ needs. Furthermore the multidisciplinary team’s members can often neither understand each other constraints nor their solving methods. Thus there is no guarantee that each designer has spent the needed effort to reach some global optimum. Moreover, the number of design parameters is generally high and it may be difficult to grasp their influence on the stakeholders’ multiple criteria that even can be contradictory. In this context, we plan to develop methods and tools in order to help designers in evaluation of candidate solutions. We focus more particularly on the analysis of mechatronic product architectures.
Keywords: mechatronic products, system engineering, inter-disciplinary
design, evaluation and optimization process.
Page 17

1 Introduction
Engineering design of complex system such as Mechatronic Systems has been widely
developed in this last decade [1] [2][3]. Our research is placed in that context of the
interoperability of design processes, particularly the system engineering of
multidisciplinary products. It has been proposed in the ISOE (Interoperable System
and Organization Engineering) team of the LGI2P laboratory of Ecole des Mines
d'Ales. System Engineering (SE) is a structuring framework for specification and design that
can be used at each situation/stage of the lifecycle of the system including need
definition, development, manufacturing, re-engineering and withdrawal. Through
standards such as ISO-IEC 15288 and ANSI/EIA 632, SE defines and describes the
different processes for engineering a system.
In our research, we are interested in concepts, methods, tools, good practices, and
reference models of SE which must be applied or adapted to support Mechatronic
systems design activities.
2 System engineering and Mechatronic design
Mechatronic is an approach needing the synergic integration of mechanics,
electronics, computing and information technology during the design and the
manufacturing of a product in order to improve/optimize its functionality [NF E 01-
010]. This integration which can be functional or physical involves members of a
pluri-disciplinary team who generally share neither the same methods, nor tools, nor
scientific culture and nonetheless must cooperate to reach a common goal of
satisfaction of the final customer. Furthermore, the international standards
(ANSI/EIA632 – ISO 15288) distinguish different technical processes aiming at
defining firstly needs and requirements, and secondly functional and physical
architecture. Support processes are also defined whose activities concern
verification/validation and optimization/evaluation. The problematic in this context is
to be able to provide a sufficient level of completeness, of consistency and traceability
for the choices of a pluri-disciplinary team from conceptual design of a mechatronic
system to the proposition of alternative detailed architectures (see Figure 1). This
must be done by ensuring to explore as deeply as possible the solutions space, without
eliminating any solution too early. The awaited contribution is the automation of
some activities of the support processes of Mechatronic System engineering, from
conceptual to detail design. We focus on the evaluation support process in SE.
From the beginning of the research until now, we have concentrated our efforts on
identifying methods and tools that are currently used, and known to be efficient. In
this paper, we will point out the different concepts we have identified in the state of
art, our scientific contribution, the tools that we are developing as illustration of our
work, and our future works.
2.1 The Evaluation support process
Page 18

Figure 1. Mechatronic product development cycle [3][4]
2.1.1 Why, Who, and when to evaluate?
First, we have to precise why an evaluation process is specifically needed. Currently,
while developing a new product (including as well innovation or reusing) it is needed
to explore the different possible solutions and to select the most relevant. This
analysis is very difficult because of: the high number of criteria, the huge mass of
data, the great numbers of dimensions, the different points of views, the various
stakeholders... This makes the choice difficult. So the evaluation process helps on
making the good decision during the conception of Mechatronics systems.
Our study focuses on the embodiment and detailed design phases of the SE activities.
These stages appear early in the development of a system because of the iterative and
the recursive nature of the design process. How this Evaluation is done? Let us give
some principal phases of this process.
2.1.2 How to evaluate?
In order to evaluate, many (more than 2) alternatives are needed. In the mechatronic
domain, the allocation of components to functions is neither automatically nor easily
done, and needs an accurate management because of the multidisciplinary expertise of
the members of the development team. For example, the most efficient motor gear
solution chosen by electronic or electrical engineers could become a constraint for
mechanical engineers because they should have to manage space and structure to
include it in the system and in return, such a needed structure may have an impact on
the choice of the motor gear solution. So we have identified some method for building
architecture, and then allocating functions to components. Based on matrix
representation, these methods are generic, and allow obtaining modular architecture.
Page 19

• Obtaining different and efficient candidate solutions (usage of DSM and
DMM).
DSM (Design structure matrix) and DMM (Domain Mapping Matrix) are relational
matrices [5]. They can link different points of view of a system such as components
or functions, etc…; they help to identify interactions and internal coupling between
different fields, and help in obtaining modular architecture of products. There are two
main kinds of DSM, the static ones and the temporal ones. Static DSM enables
clustering elements of a given matrices. This is an original and interesting way to
design architecture of mechatronic products. The matrices are used to identify intra-
domain (DSM) and inter-domain interaction (DMM). In mechatronics, this can lead to
functional modules constituting a modular architecture of the system to design,
instead of non-modular and non-flexible architecture, with a lot of interaction
between sub-systems. Matrices are used to have an easy visualization, and for
clustering the modules (in Mechatronics modules, sub-systems are often functional,
and rarely mechanical or electronic…), clustering algorithms are used for the
rearrangement of matrices.
Besides the DSM/DMM [6], there are other methods using matrices:
! Axiomatic design matrices where links between functional
requirements and design parameters can be visualized
! QFD (Quality Function Deployment) method [7]: matrices represent
links between design processes, from client needs to manufacturing
process.
Once candidate architectures have been obtained (responding to stakeholders and
system requirements), we can then proceed to the analysis/evaluation of each one of
them in term of:
! efficiency and operational constraints (Measure of effectiveness,
Measure of Performance, see[8]),
! Cost analysis: Global cost of Ownership, Manufacturing, and time
of production…
! Risk Analysis
! Tradeoff studies from criteria of the system
• Tradeoff studies
System engineering doesn’t provide specific tools to answer to this problematic.
Modeling the links between the performance of the system and the design variables is
made difficult because of the multi-disciplinary context, and the iterative and
recursive nature of the design activities. Measures of effectiveness (MOE) represent a
stakeholder’s expectation that is critical to the success of the system [8]. MOE are not
directly linked to design parameters. Generally from MOE are derived from Measures
of Performance (MOP) that define key performance parameters. MOPs depend upon
Technical Parameter Measures (TPMs). TPMs can be generic (attributes that are
meaningful to each component element, like mass or reliability) or specific [8].
Design variables have a direct impact on the TPMs. Decomposition of MOE into
MOPs and TPMs is critical in the tradeoff studies. Once tradeoff has been achieved,
sensibility analysis has to be performed in order to check the robustness and the
reliability of each solution. Furthermore, the adapted criteria (to mechatronic systems
Page 20

in our case) have to be correctly selected[2][8][9][10]). At last but not at least, we have to take into account the preference of the stakeholders. We distinguish two kinds of model, to clearly elaborate the tradeoff studies:
! A preference model: Captures stakeholders’ preference, in order to identify the most desirable solution (candidate alternative) set. For MCDA (Multi Criteria Decision Analysis), many evaluation methods exists as MAUT, ELECTRE, …
! A behavioral model: Captures the relationship between design parameters and the TPMs of the system. We are working on some efficient visualization methods for dealing with the behavior of the system, in answer of some stimulation. Sensibility analysis goes in the same way.
These two models, as an extension, can be used as entries of the optimization processes of support process of System Engineering [4] [11] .
2.2 Monitoring the design process
One other aspect of our study is to provide tools to manage the traceability of the evaluation process all along the development cycle as the system is broken down into subsystems and components.
3 Conclusion and state of the research work
From the state of art that we are still completing, we have successfully submitted one paper in an IEEE conference [4] and have participated in different research activities (like seminaries, doctoriales ...). We have chosen an electrical pool cleaner robot, as an example of Mechatronic Systems, to illustrate our research work. Next, our objective is to adapt (different) evaluation methods according to the degree of maturity of the architecture of a mechatronic system. For this purpose, we need to clearly define variables and parameters used in the process, and build relevant models that we will apply to our example.
References
[1] R. M. Henderson et K. B. Clark, « Architectural Innovation: The Reconfiguration of
Existing Product Technologies and the Failure of Established Firms », Administrative
Science Quarterly, vol. 35, no. 1, p. 9-30, mars. 1990. [2] M. Tomizuka et I. F. of A. Control, Mechatronic Systems 2002: A Proceedings Volume
from the 2nd Ifac Conference Berkeley, California, Usa, 9-11 December 2002. Gulf Professional Publishing, 2003.
[3] J. Gausemeier et S. Moehringer, « VDI 2206 - A New Guideline For The Design Of Mechatronic Systems », MECHATRONIC SYSTEMS, A proceedings volume from the 2nd
IFAC Conference, p. 785 - 790, 11-déc-2002. [4] P. Couturier, M. LÔ, et O. Mouelhi, « EVALUATION PROCESS SUPPORTIN
MECHATRONIC DESIGN », 7th ASME/IEEE International Conference on Mechatronic
and Embedded Systems and Applications, août-2011.
Page 21

[5] E. Bonjour, « Mémoire de HDR : “Contributions à l’instrumentation du métier
d'architectesystème : de l'architecture modulaire du produit àl'organisation du système de
conception” ». nov-2008.
[6] M. Danilovic et T. R. Browning, « Managing complex product development projects with
design structure matrices and domain mapping matrices », International Journal of
Project Management, vol. 25, no. 3, p. 300-314, avr. 2007.
[7] Y. Akao, QFD: Quality Function Deployment - Integrating Customer Requirements into
Product Design, 1er éd. Productivity Press, 2004.
[8] NASA, NASASystems EngineeringHandbook. NASA/SP 2007 6105 Rev1
[9] C. De-Jiu et T. Martin, « System Architecture in a Mechatronics Perspective »,
Compendium of Papers, SNART 99 Real-time System Conference, 1999.
[10] R. Scheidl et B. Winkler, « Model relations between conceptual and detail design »,
Mechatronics, vol. 20, no. 8, p. 842-849, déc. 2010.
[11] O. Mouelhi, P. Couturier, et T. Redarce, « A hybrid search algorithm in a multi-agent
system environment for multicriteria optimization of products design », in Neural
Networks, IEEE - INNS - ENNS International Joint Conference on, Los Alamitos, CA,
USA, 2009, vol. 0, p. 2160-2167.
Page 22
Toward an equipped methodological guide for the
introduction of Systems Engineering within a company
considering interoperability
Clémentine Cornu1, Vincent Chapurlat2, François Irigoin3, Jean-Marc Quiot1
1 Eurocopter, ETZR, Aéroport International Marseille Provence, 13725 Marignane Cedex –
France, email:{Clementine.Cornu, Bernard.Chiavassa}@eurocopter.com 2 LGI2P - Site de l'Ecole des Mines d’Alès, Parc Scientifique George Besse, 30035 Nîmes
Cedex 1 - France, email: [email protected] 3 Mines ParisTech - CRI, 35 rue Saint Honoré, 77305 Fontainebleau Cedex - France, email:
Abstract. Systems Engineering is a tried and tested methodological approach to
design and test new products. It acts as a model based engineering approach and
promotes for this purpose a set of standardized collaborative processes,
modelling languages and frameworks. The systems engineering processes
imply many interactions and exchanges between resources. Nevertheless,
currently there is no method guiding companies in the deployment of these
processes adapted to meet their stakeholders' expectations. Particularly,
interoperability abilities and capacities which are required at each level of the
company and by each resource remain poorly addressed.
This research work aims to support companies in their efforts to deploy
Systems Engineering by providing them with an equipped methodological
guide. This paper aims to present the content of this guide and the selection of
computer tools which would facilitate its application.
Keywords: System Engineering, Processes deployment in Industry,
Interoperability, Enterprise Modelling.
1 Introduction
Considering the increased competition on markets, companies seek to eliminate the
origins of their customers’ lack of satisfaction or of their products’ lack of
profitability. This can be achieved by applying the principles of Systems Engineering
(SE) which can be defined as a “general methodological approach that includes all
the appropriate activities to design, develop and test a system which both provides an
economical and competitive solution to the needs of a customer and also satisfies all
Page 23

stakeholders”1. Among the numerous stakes of Systems Engineering (SE), we can
mention: the reduction of development cycles and therefore development costs, the
reduction of system complexity and a greater satisfaction of all system stakeholders.
Activities to implement the good practices of the SE are formalized with more or
less standardized process described in reference documents (e.g. [5], [2], [6], etc.).
However, the introduction of SE in an enterprise is not obvious since it requires first
answering many questions including:
- How to know if the company is ready for the application of SE and on which
specific topics a specific attention must be paid on?
- Among all available documents, which one must be used as reference and
how to tailor it to the company?
- Since there is no methodology that describes how to introduce SE within
companies, how to do it pragmatically?
- Etc.
This research work aims to help companies introduce the SE in their organizations by
providing an equipped methodological guide that not only helps them at each stage of
their effort, but also offers ways to promote interoperability (i.e. the "ability of
companies and entities within those companies to communicate and interact
effectively" [1]) to ensure the success of the deployment.
2 Content of the proposed methodological guide
The guide includes first a maturity model (already validated in a company) to assess
the readiness of the enterprise for the deployment of SE. Depending on the result of
this assessment, two major strategies are proposed to manage the SE introduction
within the company.
If the business is mature enough to directly deploy SE processes, the proposed
approach is to define the ideal vision of the processes to deploy, then to build the AS-
IS model i.e. to model the current organisation of the company used to design new
products, and last, to formalize in a TO-BE model, the trade-off found between these
two visions.
However, if the company cannot assume to directly deploy processes for various
reasons like lack of standardized practices, or human obstacles, we therefore propose
to take advantage of the kick-off of new design projects, to introduce the good
practices of SE. In this scenario, an approach to initiate projects is suggested. Then,
steps to build all the models required for SE application are included.
Whatever the scenario chosen, a version of each model having to be built is
included in the guide, along with modelling best practices to adapt these models or to
create new ones.
Finally, in order to define a common basis for communication, an ontology (i.e.
"an explicit and formal specification of a conceptualisation" [4] – which defines "the
concepts, relationships, and other distinctions that are relevant for modelling a
1 Definition from the Association Française d'Ingénierie Système, the French chapter of
INCOSE (http://www.afis.fr/)
Page 24

domain" [3]) is proposed, enabling thus the formalization of the semantics used
among the different stakeholders of the design project. When defining the concepts
used in the ontology, specific attributes are associated in order to assess the
interoperability of their instances.
3 Computer tools equipping the guide
To facilitate its implementation, the guide is equipped with a coherent and
interoperable set of elements including mainly:
- An ontology manager enabling particularly to manually populate the ontology
(written in OWL2) and to check its consistency according to rules set by us,
- A modelling workbench enabling to create models that meet the semantic
requirements of ontology and of the standard modelling language chosen (BPMN3),
- A translator BPMN/OWL to automatically populate the ontology on the basis of
models built,
- A documentation platform enabling to generate project documents from all models
built (for discreet deployment scenario).
Currently, we are developing the ontology and drafting the specifications for all these
tools.
4 Conclusion
This paper presents the content of the equipped guide we are currently developing to
support the introduction of Systems Engineering within companies. This guide
includes not only methodological and conceptual tools useful to describe and organize
the deployment, but also a set of coherent and interoperable software tools to facilitate
its application. One of the strengths of this guide is that each component of the guide
is designed to be directly operational in industry and to improve the interoperability of
the company which applies it. Another of its strengths is to progressively support
companies in their approach to deploy and adapt System Engineering according to
their specific needs and constraints. Thus, it enables maximizing the chances of
success for the deployment even if the company is not fully prepared to it.
References
[1] Iso/dis 11354-1 - advanced automation technologies and their applications -
part 1: Framework for enterprise interoperability. Technical report, ISO, 2010.
[2] Systems engineering handbook - a guide for system life cycle processes and
activities - v3.2. Technical report, INCOSE, January 2010.
2 OWL: Web Ontology Language – More information on http://www.w3.org/ 3 BPMN: Business Process Modelling Notation – More information on http://www.bpmn.org/
Page 25

[3] Tom Gruber. Ontology. In Ling Liu and M. Tamer Özsu, editors, Encyclopedia of Database Systems. Springer-Verlag, 2009. [4] T.R. Gruber. Toward principles for the design of ontologies used for knowledge sharing. International Journal of Human Computer Studies, 43(5):907–928, 1995. [5] ISO/IEC. Iso/iec 15288:2008 - systems engineering - system life cycle processes. Technical report, International Organization for Standardization, 2008. [6] R. Shishko and R.G. Chamberlain. Nasa systems engineering handbook. Technical report, National Aeronautics and Space Administration, December 2007.
Page 26

Towards an automatic characterization ofcriteria for opinion-mining
Benjamin Duthil1, Gerard Dray1, Jacky Montmain1, Pascal Poncelet2, andFrancois Trousset1
1EMA-LGI2P, Parc Scientifique Georges Besse, 30035 Nımes Cedex, France
[email protected] CNRS 5506, 161 Rue Ada, 34392 Montpellier, France
Abstract. The number of documents is growing exponentially with the
rapid expansion of the Web. The new challenge for Internet users is now
to rapidly find appropriate data to their requests. Thus information re-
trieval, automatic classification and detection of opinions appear as ma-
jor issues in our information society. Many efficient tools have already
been proposed to Internet users to ease their search over the web and
support them in their choices. Nowadays, users would like genuine deci-
sion tools that would efficiently support them when focusing on relevant
information according to specific criteria in their area of interest. In this
paper, we propose a new approach for automatic characterization of such
criteria. We bring out that this approach is able to automatically build a
relevant lexicon for each criterion. We then show how this lexicon can be
useful for documents classification or segmentation tasks. Experiments
have been carried out with real datasets and show the efficiency of our
proposal.
Keywords: Criteria characterization, Opinion-mining, Sentiment anal-
ysis, Classification, Segmentation
1 Introduction
Following the web development, more and more text documents are avail-
able and more and more tools allow searches for relevant information.
Knowing people opinions on a product, searching, classifying and index-
ing in an automatic manner documents are nowadays problematic. For
example, as far as restaurants gastronomes’ opinions are concerned, sev-
eral tools are available to know the general opinion of the audience on
a restaurant. Nevertheless, the information available on the web does
not always reflect the overall semantic richness of the critics. In figure 1,
we consider, as an example, a ”Farmhouse Inn and Restaurant” restau-
rant critic. One can notice that the 3/5 mark was given to this hotel-
restaurant. This mark can be explained as followed: the bad value for
money (wine and spa prices) should lead to a disappointing score, but
the attractive amenities seems to be the main center of interest of the
critics and balances significantly the overall restaurant evaluation. The
Page 27
aggregated score hides the divergence of the ”value” and ”amenities-
services” criteria and does not represent the semantic richness of the
text. This report is not restaurant-critics specific. We would reach some
similar observations, for example, in politics [9], online-shopping [2] and
recommender systems [4] analysis, and point out the same limitations of
the analysis.
”Charming but did not meet expectations” 3/5
The staff greeting us at check in was friendly and professional. Our room was quaint
but on the small side. Great bathroom amenities. A little disappointed in the restaurant
as it relates to the dinner with an extensive and extremely expensive wine list with very
few and highly priced priced local wines after all we are in Sonoma County. Service at
dinner was spotty we had 2 incidents during our dinner. The Spa I felt should not have
offered spa treatments until they were ready, I spent 200 on a spa treatment in a brand
new spa where the power went out during my massage and other things were not up
to par. Overall we were disappointed in the 1 Michelin star restaurant. Breakfasts were
great and wait staff friendly and professional. This was a very expensive weekend as
we had great expectations as it was my birthday weekend
Fig. 1. Example of restaurant critic
2 The approach
Our work, instead of trying to associate a global score and the general
associated opinion to a document, we propose a more-detailed analysis
based on a decomposition of this opinion in several viewpoints related to
a set of criteria representative of this domain (for the restaurant domain,
that would lead to consider the ”service” and ”cleanliness” viewpoints).
Then, we suggest a method of automatic construction of a training cor-
pus using a minimal expertise (selection of relevant criteria and selection
of few associated key-words). From this corpus, we try to identify the
representative words (respectively non-representative) of each criteria.
For this purpose, we study the occurrence frequency of the words highly
correlated to the key-words in the corpus texts relatively to a criterion.
We consider the following hypothesis: the more the frequent words are
closed to the key-word, greater chances they have to characterize this
criterion. And so, we will only focus on words close enough to the key-
word. After this analysis is run, we get a set of words closed to the
key-words and their frequency of occurrence in the documents. From
this frequency, we build, for each criterion, a lexicon of words with their
associate score. Starting with these lexicons, we suggest a technique that
allow isolate text segments that are associated to each criteria. In last
step, an opinion-mining process on the identified segments, calculate the
opinion relatively to this criterion. This process uses SenticNet [1] to
detect and attribute a score to each word as an opinion issuer.
Page 28

3 Related Work
The our described approach main objectives are to identify text segments
related to a given theme of interest and to extract specific opinion. So
our work is highly connected to texts partitioning process, thematic ex-
traction process and opinion-detection process.
– A text partitioning process is based on the analysis of thematic
breakdowns in a document in order to subdivide this document in
several homogeneous parts. These parts are considered as ”text por-
tions” inside which we can observe very strong semantic coherence.
These parts are clearly disconnected from other adjacent defined
parts of a given document. Just like in many other articles, we based
our approach on statistical methods. For example, Text Tilling [6]
studies the terms distribution according to criteria. Other methods,
such as the C99 approach [3] are based on similarities calculated
between sentences and detect thematic breakdowns. One can no-
tice that segmentation approaches have all the same weakness: they
don’t allow the precise identification (label) of the thematic of a text
portion.
– On the other hand, this work deals with the opinion and feelings
detection in text data. Even if the issues mentioned in the quoted
articles [8, 7] could seem close to ours (i.e. informative entities could
correspond, for example, to characteristics, function or building ele-
ments of a camera), these approaches always rely on a learning step
implying an expert specification of every sentences related to an en-
tity to be retrieved from a huge volume of documents. In our process,
this step is automatic (that constitutes a major improvement!). We
think that this expert (human, manual) intervention constitutes a
major constrain that indeed compromises a wider-use of opinion-
mining techniques. As far as the opinion detection is concerned,
most methods usually use supervised approaches [10]: opinion carrier
words are defined either in dictionaries (WordNet, General Inquirer,
and Dictionary of affect of Language (DAL)) or manually. Other
non-supervised methods introduce the opinion carrier word learning
process notion based on seed word analysis in order to build auto-
matically their own opinion dictionary [5]. Our approach, inspired
by the previously quoted methods of opinion detection, would ad-
just these techniques for documents thematic extraction and opinion
extraction.
4 Conclusion
Our new approach allowing to automatically characterize criteria for a
given domain and to extract related opinion. We also suggested a method
to build automatically corpus for the lexicon construction of criterion
specific words, lexicon being used for the automatic extraction of text
segments. Meanwhile, we suggest to automatically extract chosen crite-
rion specific opinions, from these text segments. Finally, we did get some
remarkable performances for the thematic extraction step as well as for
Page 29

the criterion specific opinion extraction step.We can anticipate many perspectives from this work. First, we did choosethe use of the lexicon in a thematic extraction context for text data, butthis could also be used in the first phase of automatic ontologies build-ing process or in a documents classification context. Furthermore, we’dlike to optimize our criterion specific opinion extraction approach. Inprevious works [5], we did emphasize that according to the considereddomain, opinions can be expressed by various specific terms. The expertvocabulary study would certainly lead to more accurate results and arefining of opinion analysis.
References
1. Cambria, E., Speer, R., Havasi, C., Hussain, A.: Senticnet: A publiclyavailable semantic resource for opinion mining. Artificial Intelligencepp. 14–18 (2010)
2. Castro-Schez, J.J., Miguel, R., Vallejo, D., Lopez-Lopez, L.M.: Ahighly adaptive recommender system based on fuzzy logic for B2Ce-commerce portals. Expert Systems with Applications 38(3), 2441–2454 (2011)
3. Choi, F.Y.Y.: Advances in domain independent linear text segmen-tation. In proceedings of the 1st Meeting of the North AmericanChapter of the Association for Computational Linguistics 23, 26–33(2000)
4. Garcia, I., Sebastia, L., Onaindia, E.: On the design of individualand group recommender systems for tourism. Expert Systems withApplications 38(6), 7683–7692 (2011)
5. Harb, A., Plantie, M., Dray, G., Roche, M., Trousset, F., Poncelet,P.: Web opinion mining: how to extract opinions from blogs? Inter-national Conference on Soft Computing as Transdisciplinary Scienceand Technology (2008)
6. Hearst, M.A.: Texttiling: segmenting text into multi-paragraphsubtopic passages. ACM 23, 33–64 (1997)
7. Jin, W., Ho, H.H., Srihari, R.K.: Opinionminer: A novel machinelearning system for web opinion mining and extraction. IEEE Sym-posium on Visual Analytics Science and Technology (2009)
8. Liu, B., Hu, M., Cheng, J.: Opinion observer: analyzingand comparing opinions on the web. In: Proceedings ofthe 14th international conference on World Wide Web. pp.342–351. WWW ’05, ACM, New York, NY, USA (2005),http://doi.acm.org/10.1145/1060745.1060797
9. Thomas, M., Pang, B., Lee, L.: Get out the vote: Determining sup-port or opposition from congressional floor-debate transcripts. In: InProceedings of EMNLP. pp. 327–335 (2006)
10. Yi, J., Nasukawa, T., Bunescu, R., Niblack, W.: Sentiment analyser:Extraction sentiments about a given topic using natural languageprocessing techniques. In IEEE Intl. Conf. on Data Mining (ICDM)(2003)
Page 30
A Service Component Framework for Multi-UserScenario Management in Ubiquitous Environments
M. Faure1, L. Fabresse2, M. Huchard3, C. Urtado1, and S.Vauttier1
1 LGI2P / Ecole des Mines d’Ales, Nımes - France2 URIA / Ecole des Mines de Douai, Douai - France3 LIRMM / Univ. Montpellier 2, Montpellier - France
1 Motivation and general principle of the SaS System
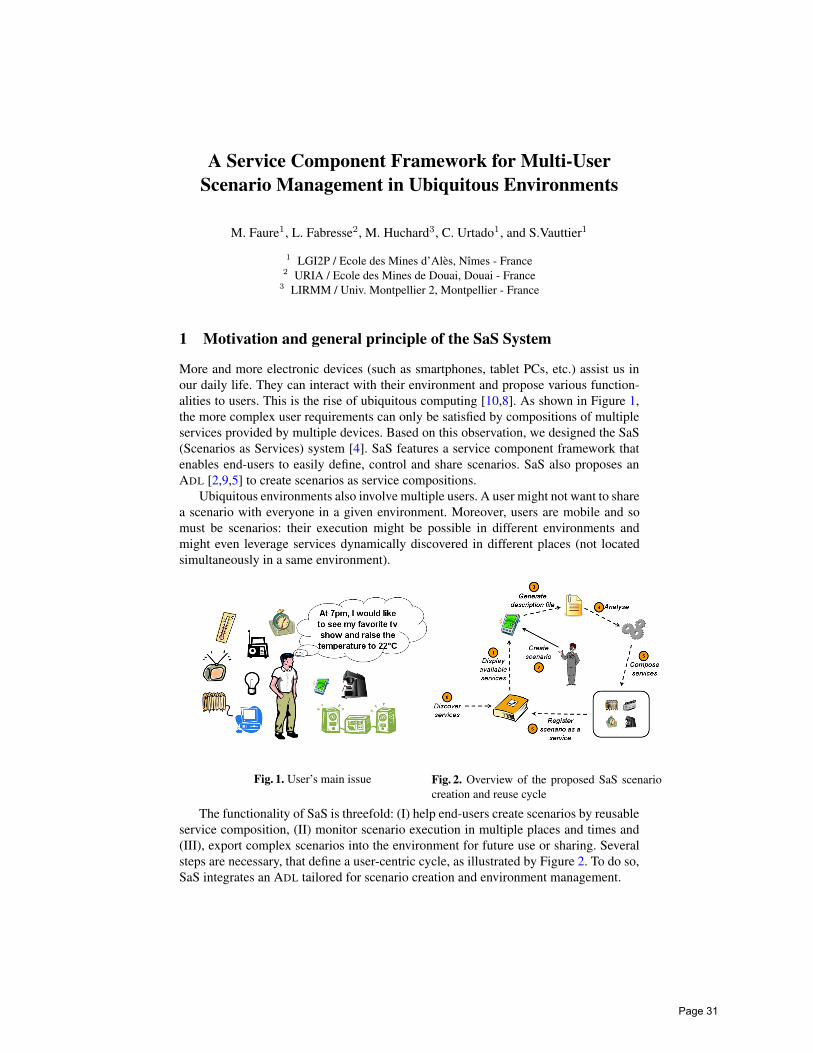
More and more electronic devices (such as smartphones, tablet PCs, etc.) assist us inour daily life. They can interact with their environment and propose various function-alities to users. This is the rise of ubiquitous computing [10,8]. As shown in Figure 1,the more complex user requirements can only be satisfied by compositions of multipleservices provided by multiple devices. Based on this observation, we designed the SaS(Scenarios as Services) system [4]. SaS features a service component framework thatenables end-users to easily define, control and share scenarios. SaS also proposes anADL [2,9,5] to create scenarios as service compositions.
Ubiquitous environments also involve multiple users. A user might not want to sharea scenario with everyone in a given environment. Moreover, users are mobile and somust be scenarios: their execution might be possible in different environments andmight even leverage services dynamically discovered in different places (not locatedsimultaneously in a same environment).
Fig. 1. User’s main issue Fig. 2. Overview of the proposed SaS scenariocreation and reuse cycle
The functionality of SaS is threefold: (I) help end-users create scenarios by reusableservice composition, (II) monitor scenario execution in multiple places and times and(III), export complex scenarios into the environment for future use or sharing. Severalsteps are necessary, that define a user-centric cycle, as illustrated by Figure 2. To do so,SaS integrates an ADL tailored for scenario creation and environment management.
Page 31

2 Insight on the SaS ADL
In this section, we give an overview of our ADL4. This ADL enables end-users to createscenarios that correspond to their needs. Moreover, users can organize their environ-ment and register services for future use.2.1 Scenario declaration
A scenario has a name, some actions and properties. An action can be: an operationinvocation, an alternative, or a repetition loop. Scenarios also have properties which en-able to specify if the scenario is exportable, editable, etc. Moreover, action lists are ex-ecuted in sequence by default, however, our ADL enables users to specify some actionsto execute in parallel. Listing 1.1 describes the main elements of a scenario declarationusing the BNF notation and Listing 1.2 illustrates our ADL with a scenario example.
<scenario> ::= scenario <scenario_name> <action_block> [<scenario_properties>]
<action_block> ::= { ( <action> )+ } |{ ( [ [<parallel_exec>] <action_list> <action_list> ] ) }<action_list>::= ( <action> | <action_block> )+<action> ::= <op_invocation> ; | <alternative> | <repeat>
<op_invocation> ::= (<device>) <service_name>.<operation_name>([<parameter_list>])<parameter_list> ::= (<op_invocation> | <parameter_value>)
(, (<op_invocation>|<parameter_value>) )*<alternative> ::= if <cplx_condition> <action_block> [<else_clause>]<else_clause> ::= else <action_block>
<cplx_condition> ::= ( <condition> (<log_operator> <condition>)* )<condition> ::= <op_invocation> <comp_operator> ( <op_invocation> | <value> )<repeat> ::= (while<cplx_condition> | <repeat_value> times) <action_block>
<parameter_value> ::= <value> | nil<parallel_exec> ::= parallel:<log_operator> ::= and|or|not<comp_operator> ::= < | <= | > | >= | ==
Listing 1.1. Grammar of the scenario declaration using the BNF notation
scenario nightif ( (any) Clock.getTime() == 6pm and(BedroomThermomether) Thermometer.getTemperature() <= 17)
{ (BedroomRadiator) Heater.setValue(7); }
Listing 1.2. Scenario declaration example
2.2 Environment organization declaration
Ubiquitous computing implies user mobility and multiplicity. As defined in [1], twocharacteristics of ubiquitous systems are the social environment and the evolving envi-ronment. Users need therefore to organize their environment.
We identify two main entities in ubiquitous environment: services (which can bescenarios) and SaS platforms (which can export services). SaS platforms always belongto users. SaS ADL enables therefore to create virtual users and to attach SaS platformsto them. Services are often related to a specific location (such as home, office, etc.). So,SaS ADL allows users to specify locations and to register services on them. Listing 1.3illustrates these two repertories with an example.
4 The interested reader might refer to [4] for a longer description.
Page 32

platform myPlatformrepertory {
user meplatform Nokia3310platform Acer TimelineX
user Lucplatform macintosh
}locations {
location home[services TV, (scenario) wakeUp]
location office[services fax, print]
}
Listing 1.3. Platform repertory example
3 Execution of distributed scenarios in SaS
Scenarios are dynamic. They can be started and stopped, services used in scenarios canalso disappear. Moreover, scenario could imply services not available simultaneously.SaS needs therefore to handle scenario execution control. In addition, ubiquitous sys-tems are distributed, and so are scenarios.
3.1 Scenario execution controlScenario life-cycle. Users can easily manage them with two service operations (startand stop). The SaS system also provides reactions to external events (such as servicedisappearance). A scenario launched by a user automatically stops if a necessary servicedisappears. SaS searches for another compliant service and, if needed, waits for one tobecome available. The state diagram in Figure 3 illustrates the scenario life-cycle.
Fig. 3. State diagram of scenario life-cycle
Scenario delayed execution. At scenario creation, SaS asks to the user if scenarioshould only be executed when all services are simultaneously present. Instead, usersneed to specify a period of validity (such as one hour, one day, etc.) for the scenario.During that period, SaS tries to execute the scenario with available services on its evolv-ing environment. SaS analyses the different service compositions inside the scenarioand extract dependency rules to apply in case of service appearance/disappearance.
3.2 Scenario distribution
Scenario selected sharing. SaS enables users to select some specific users to sharescenarios with. SaS platforms attached to selected users and the ones belonging to the
Page 33

creator are thus notified of the presence of that scenario, even if they arrive after the sce-nario creation. The same mechanism eases user access to scenarios created by selectedusers5. They can therefore easily select an user present in the environment and discoverscenarios and services exported by platforms attached to him/her.Scenario redeployment. When a user shutdowns his/her platform, SaS warns the userif a scenario provided by this platform is running. Users can wait for the end of sce-nario execution. Otherwise, SaS tries to redeploy the scenario on another platform withcurrent status and execution advancement.
4 Conclusion and Future Work
We presented here our SaS system and its features. In addition to enable scenario cre-ation by service composition, the SaS ADL allows users to organize ubiquitous envi-ronments and to register services for a future use. Users can therefore share scenarioswith selected users and, moreover, scenarios can be executed in different times on mul-tiple places. A prototype is under development to prove the feasibility and evaluate ourproposition. It is an ongoing work implemented in Java over OSGi [6,7] with iPOJO [3].
For future work we want to add semi-automatic service composition to SaS. Learn-ing from existing scenarios, SaS will propose some possible service composition tothe user. Then, we plan to enable remote scenario execution. Since SaS allows usersto define scenarios with not available services, SaS platforms can deploy a web serverand enable to execute a scenario remotely (if they have all services present). Moreover,SaS can consider scenarios as a succession of indivisible action list. Users can thereforecreate a scenario and SaS could distribute the execution to several remote platforms.
References1. Banavar, G., Bernstein, A.: Software infrastructure and design challenges for ubiquitous
computing applications. Communications of the ACM 45(12), 92–96 (2002)2. Clements, P.: A survey of architecture description languages. In: Proc. of the 8th international
workshop on software specification and design. pp. 16–25. IEEE (March 1996)3. Escoffier, C., Hall, R.: Dynamically adaptable applications with iPOJO service components.
Proc. of the 6th international conference on Software composition pp. 113–128 (2007)4. Faure, M., Fabresse, L., Huchard, M., Urtado, C., Vauttier, S.: The SaS Platform for Ubiqui-
tous Environments. In: To appear in proc. of the 23rd International Conference on SoftwareEngineering and Knowledge Engineering (SEKE 2011). KSI (July 2011)
5. Mishra, P., Dutt, N.: Architecture description languages. IEEE proc. - Computers and DigitalTechniques 152(3), 285 (2005)
6. OSGi Alliance: OSGi Service Platform Core Specification Release 4 (2005), http://www.osgi.org/download/r4v40/r4.core.pdf
7. OSGi Alliance: OSGi Service Platform Enterprise Specification (march 2010), http://www.osgi.org/download/r4v42/r4.enterprise.pdf
8. Schulzrinne, H., Wu, X., Sidiroglou, S., S: Ubiquitous computing in home networks. IEEECommunications pp. 128–135 (nov 2003)
9. Vestal, S.: A Cursory Overview and Comparison of Four Architecture Description Lan-guages. Tech. rep., Honeywell (February 1993)
10. Weiser, M.: The computer for the 21st century. Scientific American pp. 78–89 (1995)
5 Access to scenarios used by selected users is a perspective.
Page 34

A Design Pattern meta-model proposal for Systems Engineering
F.Pfister1, V.Chapurlat1, M.Huchard2, C.Nebut2, and J.-L.Wippler3
1LGI2P, Ecole des Mines d'Alès, site de Nîmes, Parc Scientifique G. Besse, 30000 Nîmes,
France 2LIRMM, CNRS – Université Montpellier 2, 161 rue Ada, 34095 Montpellier Cedex 5,
France 3LUCA Ingénierie - 1 Chemin de Pechmirol - 31320 Mervilla, France
Abstract. Design patterns and architecture patterns have been considerably promoted by software engineering. The software oriented tools and methods have been adapted for Systems Engineering, conforming to the model driven engineering paradigm proposed by the Object Management Group. However, designers of complex socio-technical systems have specific concerns, which differ from those of software designers. We propose a method of pattern implementation for Systems Engineering, based on a functional approach and relying on formal conceptual foundations in the form of a meta-model, which can be used for the management, application, and cataloguing of patterns specific to the field of Systems Engineering.
Keywords: design-pattern, model-based systems engineering, eFFBD
1 Introduction
Capitalized, approved, and sometimes standardized solutions and practitioners’ experience in design can be shared, interpreted and applied by engineers having to face repetitive classes of problems during engineering projects. This allows at least to gain performance (comprehensiveness, relevance), reliability (proven solutions, justified and contextual argued), economic value (time savings), and to capitalize enterprise’s experience. This idea, globally known as Design Pattern, is now formalized and used in various engineering fields such as buildings architecture [1], software engineering [5][7][8][9], process management [2][13], and systems engineering (SE) [3][4][10][12]. However, the formalization of Design Pattern concept provided by this literature remains too insufficient in order to promote a usable meta-model compatible and interoperable with SE meta-models which are today implemented by the major SE tools. The objectives of this research are first to provide a Design Pattern meta-model suitable for structuring and organizing the required knowledge (best practices, experiences…) about existing solutions in SE domain for guiding and optimizing system of interest (SOI) development. Second, it aims to provide mechanisms allowing engineers to catalog then to look for relevant Design Patterns for a given purpose, and to align i.e. to help them to interpret and imitate the solutions taking into account the SOI functional and organic models.
Page 35

In this sense, a design pattern aims to improve non functional features, quality of service and “-ilities” [11] (availability, maintainability, vulnerability, reliability, supportability …) by providing a supplement of quality to a current model of a SOI under design. For this, it is a simple and small artifact, linking the description of a problem (problem model) that can occur in a given context and a proposition (solution model) that can be used to solve this identified problem in this context highlighting various forces. The proposed solution must be a well known one and frequently used in the context i.e. a design pattern is generally not used in order to be innovative. Last, the solution must be imitated and adapted to a particular context. A design pattern is then rarely isolated and therefore correlated with other ones.
2 Design pattern meta-model
The proposed Design Pattern meta-model is defined in UML, shown in Figure 1 (upper part) and underpinned by a minimalistic System meta-models (lower part). The meta-model elements (in italics) are illustrated in the next. All along a SE Project engineers handle various SOI models and a catalogue of existing design patterns called SystemPattern. A SystemPattern is designed as a parameterized functional micro-architecture, ie. a Function graph whose some elements play given roles (patternRole) linked by a Parameter meta-class to roles (concreteRole) played by elements belonging to the model under study. A SystemPattern identifies at least and argues a tested Solution addressing a Problem in a given Context. A SystemPattern is characterized by a unique identifier, a short but evocative name, alternative aliases, a creation date, a textual description and an author. A Problem describes the pointed out design problem motivating the SystemPattern. It is characterized by an informal description, a Feature to optimize, a set of competing Forces, a use case Model showing an elementary functional and/or organic architecture. A Force is a competing constraint when put in conflict with another one(s) is the cause from which arises the Problem. So the SystemPattern application decision depends from arbitration between the Forces. A Force is described by a challenge, a constraint and a ProblemType (Fluid, Field, Structure, Security...). A Feature is an extra functional characteristic identified as an “-ilities”. A Solution holds a pattern Model, which is parameterized system architecture. It figures a design solution as a response to a Problem considering the given Context. There is only one solution for one pattern, but one Problem may have many solutions through several patterns by using equivalent-patterns and/or related-patterns relations. A Solution is illustrated by a use case showing a more relevant architecture and an Impact quantified by a VariationSense (increase, decrease, equals) and a value on a scale. Impact is measured on a feature and allows to quantify the influence of a SystemPattern on a SOI model by detecting what are the optimized and degraded Feature.
Page 36

Figure 1. Systems Engineering Pattern meta model
Page 37

The Context is interpreted as a (set of) pre-condition(s) which define in what cases and in which conditions the SystemPattern may be applied. The main other relations between a SystemPattern and other concepts from the meta-model are:
• A SystemPattern is a parameterized micro-architecture: each of its Parameters associates one of its own ModelElement to a ModelElement belonging to the model under work, e.g. Function, Component, Item, Interface, DataFlowConnection, Need, Scenario or Requirement.
• A SystemPattern is legitimated when mined in several well known applications (defined as knownUses).
• A requestedPattern is a SystemPattern required when applying a given SystemPattern. All requestedPatterns are also relatedPatterns.
• A relatedPattern is a SystemPattern, often present when a given pattern is applied. Within a triangular association Problem Context Solution, related patterns have often the same context, but relatedPatterns exclude antiPatterns.
• An antiPattern is in opposition with the SystemPattern of interest in a given case. Within a triangular association Problem Context Solution, antiPatterns have the same problem and the same context. • EquivalentPatterns are patterns that have the same problem and the same
context. In this case, the textual description may be more formalized in the solution/model/needs/description The Domain identifies a specific area in which a SystemPattern can be applied or is relevant e.g. mechanics, electronics, software, civil engineering, organization & service, security, pedagogy... The Rationale justifies the SystemPattern by an explicit description and the associated argumentation allowing to assume the SystemPattern application decision. It is different from known-uses in several Applications, which are a statistical observation. Last Problems, Solutions, Contexts, Applications and Rationales are indexable objects, described by Keywords. This meta-model describes the required language allowing to implement a SE Design Pattern catalogue. System architects become then able to translate their experience to form this catalogue. Mining techniques can be then used to identify applicable design patterns in a given context.
Page 38

3 Conclusion and outlook
Systems Engineering, conforming to the Model Based Systems Engineering initiative [6], adopts languages and tools derived from those used by software engineering. Design patterns may then adopt this initiative. This paper proposes to develop a specific approach for Systems Engineering, based on the eFFBD formalism which is widely used in this area. A meta-model interoperable with the main tools used by system architects has been designed. An editor is now under development allowing to manage a catalogue of Design Patterns, and to use mining and alignment mechanisms (not described here) for applying patterns based on model transformations.
References
1. Alexander, C. et al., 1977. A pattern language: towns, buildings, construction, Oxford University Press.
2. Appleton, B., 1997. Patterns for Conducting Process Improvement. In Proceedings of the 4th Annual Conference. Pattern Languages of Program Design (PLoP’97). Urbana Champaign.
3. Barter, R.H., 1998. A Systems Engineering Pattern Language. In Proceedings. 8th Annual International Symposium of the International Council on Systems Engineering. Vancouver.
4. Cloutier, R.J. & Verma, D., 2007. Applying the concepts of patterns to systems architecture. In Systems Engineering. Wiley, p. 138-154.
5. Coplien, J.O. & Schmidt, D.C., 1995. Pattern Languages of Program Design, Addison-Wesley Professional.
6. Estefan, J.A., 2008. Survey of Model-Based Systems Engineering (MBSE) Methodologies, Seattle, WA - U.S.A.: INCOSE.
7. Fowler, M., 1996. Analysis Patterns, Addison-Wesley Professional. 8. Gamma, E. et al., 1994. Design Patterns: Elements of Reusable Object-Oriented Software,
Addison-Wesley. 9. Harrison, N., B, 1999. The language of shepherding. A pattern language for shepherds and
sheep. In Proceedings. 7th Pattern Languages of Programs Conference PLoP. 10. Haskins, C., 2005. Application of Patterns and Pattern Languages to Systems Engineering.
In INCOSE 15th Annual International Symposium. 11. Manola, F., 1999. Providing Systemic Properties (Ilities) and Quality of Service in
Component-Based Systems. Available at: http://www.objs.com/aits/9901-iquos.html. 12. Schindel, W.D. & Rogers, G.M., 2000. Methodologies and Tools For Continuous
Improvement of Systems. Journal of Universal Computer Science, p.289-323. 13. Van der Aalst, W.M.P. et al., 2003. Workflow Patterns. Distributed and Parallel
Databases, 14(3), p.5-51.
Page 39
Incremental construction of component assembly supported by behavioural verification
Thanh Liem Phan!, Anne Lise Courbis!, Thomas Lambolais!, Thérèse Libourel"
! !"#$%"&$%'(!)*+,-(./$01(213(45613(2780ès
Site EERIE, Parc Scientifique Georges Besses, 30035 Nimes Cedex 1 - France
!"#$%#&'()*+,#$%-.$%%)&'(/)+01234(/-.
"#1*$/+'$*41'$(/56*(%)/&$')/+73.
" Laboratory LIRMM, Université de Montpéllier 2
161 rue Ada, 34095 Montpellier Cedex 5 - France
'(4123)'6'(3**+73.
Abstract. UML is becoming a de facto standard, including for the development
of critical systems. However, current tools offer little help to take benefit of be-
havioral models and to verify them, especially during the development phases.
Our goal is to study the incremental construction of component assemblies, be-
haviours of which are described by means of UML state machines. This in-
cludes the verification that each step preserves dynamic properties of previous
steps.
Keywords: UML, LTS, state machine, composite structure, incremental devel-
opment, component assembly, software architecture.
1 Introduction
Our interest concerns the build-up of critical software architectures in which de-
fects could have a dramatic impact on human life, environments or significant assets.
When constructing such architectures, we focus on behavioural analysis in order to
detect communication problems such as deadlock between software components.
Hence, we need to pay attention to two aspects: construction processes of architec-tures and evaluation techniques.
First, to support the construction of architectures, we believe that using an incre-
mental approach [1] is suitable. Such an approach is natural because on the one hand,
specifying a complex system requires a hierarchical and iterative approach, and on the
other hand, initial specification cannot be considered as complete and must be up-
dated all along the modelling process. The incremental construction operations of
architecture could be the following:
i. Addition operation: adding a component into an architecture
ii. Removal operation: removing a component from an architecture
iii. Substitution operation: substituting a component by a new one
Page 40

Second, to support the evaluation techniques, we have to deal with two problems:
i. Define semantics of architectures by transforming UML architectures into
formal languages. In our current work, we chose the LTSs (Labelled
Transition Systems) as the underlying semantics of UML architectures
and UML components.
ii. Compare models in order to verify that a model preserves the necessary
properties of the previous version by using pre-orders and equivalences.
Conformance relations (conf, red, ext, conf-restr, cred, cext) [2], [3], [4],
bi-simulations (=, ) and testing pre-orders ( ) have been
considered. In complex system design, hiding and parallel composition
are the most important contexts to be considered carefully. So we need to
find appropriate relations to be used correctly in hiding and parallel com-
position contexts.
2 Methods
2.1 Semantic of architectures
Architectures are described by assemblies of components using UML Composite
Structure models where the behaviour of each component is represented by UML
State Machine models.
So, we have defined:
i. A semantics of components by transforming UML State Machines into
Labelled Transition Systems (LTSs) [1][4],
ii. A semantics of architectures by transforming UML Composite Structures
into EXP.OPEN [5] specification and then LTSs by using facilities of the
CADP toolkit [6]. The parallel operator with synchronisation vectors of
EXP.OPEN supports both single-way and multiple-way synchronization
between components, which leads to easily transform UML architectures.
2.2 Ver ification of architectures
In order to compare two versions of an architecture, there are two ways [1]:
i. Calculate the behaviour of the whole architectures to be compared and
then analysis their LTSs. We can use this method to evaluate the three in-
cremental operations (addition, removal and substitution operation). But
the problem appears when the system becomes complex (with many com-
ponents) so that having LTSs of the whole architecture is not easy. The
second way could solve this limitation.
ii. Without calculating and comparing behaviour of the whole architecture,
we just consider only behaviour of the changing part between two ver-
sions of the studied architecture, for example: a component being substi-
tuted by a new one. This method can be applied to evaluate the substitu-
tion operation efficiently. In our context, we focus on this second way.
Page 41
After having the semantics of architectures, the next task is to formally analyse the
interoperability properties of systems. In our work, we considered the interoperability
of architectures in a restricted point of view, which is defined by [7]: !"#$%&#'(#)"*&$#+$#
interoperable when it is stuck-free, i.e., whatever point of interaction may be reached, communication will not be blocked, and each part will reach one of its final states,.
This raises up two problems: i) component substitutability and ii) component com-patibility.
Component substitutability
If a component C1 has to be replaced by a component C2, we must not only check
that C2 must do what C1 do (what conformance relations check), but also that C2
does not offer any new observable behaviours. In fact, C2 must be able to provide
what C1 provides, and C2 must not require any new service which may interfere with
its environment. That is the reason why conformance relations are not enough. The
relations which satisfy such substitutability properties in any context are congruence
relations. Congruence relations defined over the conformance relation are cext and
cred [3]. However, these relations are congruent only in choice and disabling context
but they still fail to be congruent in hiding contexts creating divergence [3] [8]. (i.e.
an infinite sequence of internal actions) which means cred and cext are insufficient
for using in the context of components assembly.
The root problem of the non-congruence is in divergence interpretation which is
not adequate to cope with. For example: in [3], divergences are considered as harm-
less (or fair), while in [8] divergences are not necessary harmless (or unfair). We have
found that these following relations, which are congruent in every context including
hiding context:
! The three known variants of testing equivalence [8]: FAUD (the Failure equiva-
lence with Abstraction of Unstable Divergences), CFFD (the Chaos-Free Fail-
ures Divergences), and NDFD (Non Divergent Failure Divergences). But their
interpretations of divergences are not accordance with our previous works.
! The should-testing pre-order defined in [9][10] is an answer to a long stated
problem: the greatest congruence stronger than red. It exactly corresponds to what we are looking for , however the implementation of this relation is still
unknown.
Component compatibility
If the new component is not in relation with the former one by a known congru-
ence relation, it is possible to verify its compatibility with its context. Since the archi-
tecture is translated into EXP.OPEN specification, all interactions are expressed by
binary parallel composition operators. That means it is always possible to consider the
context as a set of components that can be modelled by a unique LTS. Thus, we pro-
posed a notion of component compatibility, which is expressed by a compatibility
relation between two LTS, according to its context [11].
Page 42

3 Conclusion
We have implemented in our tool, IDCM [1] (Incremental Development of Con-
formance Model), the transformation of UML architectures using EXP.OPEN. We
have found several congruence relations (FAUD, CFFD, NDFD, and should-testing
pre-order) which are suitable for the context of component substitutability. We have
defined and implemented the compatibility relation [11], which is suitable to evaluate
interoperability of architectures.
In the next phase, we would like to:
Study the relevance to implement the above should-testing congruence relation,
Study the relevance of transforming UML architectures into the others formal
languages such as: LOTOS-NT, FIACRE,
Study problems of component communication, especially to face up the challenge
in the context of asynchronous communication between components, which often
are used in web services applications.
References
1. Luong, H.-V.: Construction Incrémentale de Spécifications de Systèmes Critiques
intégrant des Procédures de Vérification, Thesis, Université Paul Sabatier-Toulouse 3, (2010).
2. Brinksma, E., Scollo, G.: Formal notions of implementation and conformance in
LOTOS. Twente University of Technology (1986).
3. Leduc, G.: A framework based on implementation relations for implementing LO-
TOS specifications. Computer Networks and ISDN Systems. 25, 23--41 (1992).
4. Luong, H.-V., Lambolais, T., Courbis, A.-L.: Implementation of the Conformance
Relation for Incremental Development of Behavioural Models. Model Driven Engineering
Languages and Systems. p. 356--370 (2008).
5. Lang, F.: Exp.Open 2.0: A Flexible Tool Integrating Partial Order, Compositional,
and On-the-fly Verification Methods. (2005).
6. Garavel, H., Mateescu, R., Lang, F., Serwe, W.: CADP 2006: A Toolbox for the
Construction and Analysis of Distributed Processes. Computer Aided Verification. p. 158--163
(2007).
7. Baldoni, M., Baroglio, C., Chopra, A.K., Desai, N., Patti, V., Singh, M.P.: Choice,
interoperability, and conformance in interaction protocols and service choreographies. Proceed-
ings of The 8th International Conference on Autonomous Agents and Multiagent Systems -
Volume 2. p. 843--850 (2009).
8. Leduc, G.: Failure-based congruences, unfair divergences and new testing theory.
Proceedings of the fourteenth of a series of annual meetings on Protocol specification, testing
and verification XIV. p. 252--267 Chapman & Hall, Ltd., London, UK (1995).
9. Brinksma, E., Rensink, A., Vogler, W.: Fair Testing. International Conference on
Concurrency theory. 962, 313--327 (1995).
10. Rensink, A., Vogler, W.: Fair testing. Information and Computation. 205, 125!198
(2007).
11. Lambolais, T., Courbis, A.L., Luong, H.V., Phan, T.L.: Interoperability Analysis of
Systems. 18th World Congress of the International Federation of Automatic Control (IFAC).
(2011).
Page 43

!"#$%$&'()*+,-./+,0.10$23%3"&.
!"#$%&'#()*$+,"-.(/012(/345-&(6$+7&812(9-+:&+'(6$+7&8
;2((!-:#&4(<*$%=&.1(
(1(>?@;A2(B:"4&(C&.(!-+&.(C!D4&.(/-'&(BB6@B2(A$*:(.:-&+'-E-FG&(?H(I&..&2(
)("(JKKJL(MN%&.()*$+:&(
O%"#$%&'#H.32(.345-&H*$+7&82(%-:#&4H:*$%=&.PQ%-+&.R$4&.HE*((
;@+.'-'G'(C&.(/:-&+:&.(C&(4!B5"4G'-"+(ST!6(LLLU(<M6/V2(
T+-5&*.-'W(!"+'=&44-&*(@@2(<<(KXU2(JUKYL(!"+'=&44-&*(<&C&Z(KL2()*$+:&(5-+:&+'H*$+7&8QG+-5R%"+'=;HE*(
4)+#0*5#6( @+(%".'( @+E"*%$'-"+(6&'*-&5$4( /3.'&%.2( '#&( *&4&5$+:&(%"C&42( "+432(*&4-&.( "+( FG&*3( .=&:-E-:$'-"+.( '"( $..&..( C":G%&+'.( *&4&5$+:&( 7H*H'( #$%&!$(
-+E"*%$'-"+(+&&C.H(@+C&&C2('#".&(.3.'&%.(*&'G*+(.$%&(*$+[&C(4-.'.("E(C":G%&+'.(
7#&+( G.&*.2( 7-'#( C-EE&*&+'( =*&E&*&+:&.( $+C( &5"45-+\( -+( C-EE&*&+'( :"+'&Z'.2(.G]%-'( '#&( .$%&(FG&*3H(A&*."+$4-8&C(.&$*:#($-%.($'( $CC-+\(G.&*.( -+( *&4&5$+:&(
$..&..%&+'(=*":&..(]3(:"+.-C&*-+\('#&-*(=*&E&*&+:&.($+C(:"+'&Z'.($.(."G*:&.("E(
&5-C&+:&H(^#-.(=$=&*(=*&.&+'.($(.#"*'(.'$'&("E($*'("E("+'"4"\3R]$.&C(G.&*(=*"E-4&2(C-.:G..&.( '#&( %$-+( 4-%-'$'-"+.( "E( &Z-.'-+\( $==*"$:#&.( $+C( *$-.&.( ."%&(
=&*.=&:'-5&.H(
7,'8$0-+9.=&*."+$4-8$'-"+2("+'"4"\32(G.&*(=*"E-4-+\2(-+E"*%$'-"+(6&'*-&5$4H(
:...;"#0$-/5#3$".
!".'(-+E"*%$'-"+(*&'*-&5$4( .3.'&%.(:"+.-C&*( '#$'(C-EE&*&+'( G.&*.(.G]%-''-+\('#&(
.$%&(FG&*3( #$5&('#&(.$%&(-+E"*%$'-"+( +&&C.2($+C(*&'G*+('#G.2( '#&( .$%&(
*&.G4'.H('()*+%, $#-., $/$0%1$2, 340%(, -5))%6, 73(%, $*8%, 4*0$, 5))92, :%&$3($4-8&C( &+$]4&C(
.&$*:#( "+&.( $-%( $'( :G.'"%-8-+\( @6/( S@+E"*%$'-"+( 6&'*-&5$4( /3.'&%V( ]3( -+'&\*$'-+\(
-+'"( *&4&5$+:&( %"C&4( G.&*( -+'&*&.'.( $+C( =*&E&*&+:&.H(
^"(*&$:#(=&*."+$4-8$'-"+2(.G:#(.3.'&%.(+&&C('"( '$[&(-+'"($::"G+'(G.&*( :"+'&Z'(7#-:#(
-.( "E'&+(%"C&4&C( ]3($(G.&*(=*"E-4&H(_&*&($(G.&*(=*"E-4&(-.(.&&+($.( $+3( =-&:&( "E(-+E"*%$'-"+(C&E-+-+\(G.&*(-+'&*&.'.($+C(=*&E&*&+:&.(`1aH(
@+($( .&$*:#( $:'-5-'3('7"( [-+C.("E(:"+'&Z'.($*&( \&+&*$443(:"+.-C&*&C(-+( "*C&*(
'"(G+C&*.'$+C('#&( G.&*( -+E"*%$'-"+( ( +&&Cb( 7$.3&0, 0%&1, -3(0%;09( $+C( 7)3(<, 0%&1,
-3(0%;09`1a`;a`JaH^#&( E-*.'( :"**&.="+C.('"( $( G.&*( '#&%&.("*($*&$.("E(
-+'&*&.'($+C(=*&E&*&+:&.(\4&$+&C(CG*-+\($(.&$*:#(.&..-"+H(D(.&$*:#(.&..-"+($'('-%&('(-.(
C&E-+&C( $.($(.&FG&+:&( "E( -+'&*$:'-"+.(=&*E"*%&C( '#*"G\#( =$.'( $+C( .G::&..-5&(
FG&*-&.(7#-:#(#&4=('"(%&&'($(.=&:-E-:($+C(-%%&C-$'&(-+E"*%$'-"+(+&&C(`UaH(^#G.2(.G:#(
$(.&..-"+(-.(4-%-'&C(-+('-%&($+C(%$3(*&FG-*&(.&5&*$4(.'$\&.("E(-+'&*$:'-"+.H(
((((((((((((((((((((((((((((((((((((((((((((((((((((((((((((
Page 44

!" #$%&" '#$%&()*+," -$%)*.)!" /0" ,12*" $3" 1" 40*+" 0*1+-5" 5/0)$+67" 0$" /)" -$,*0" 3+$,"
0*8*+1#" 05$+)" )*+," -$%)*.)09" :)" ,$2*#0" )5*" ;*+0/0)*%)" 40*+" /%)*+*0)0" 1%2" ;+*3*+*%-*09"
<5*0*")=$"2*3/%/)/$%0"$3"40*+"-$%)*.)0"2/0)/%&4/05")5*"40*+"#"0;*-/3/-"/%)*+*0)0"3+$,"5/0"
&*%*+1#"/%)*+*0)09"
!"""#$%&"'&()*+*,-"
!" 0)+1)*&6" 3$+" >4/#2/%&" 1%2" 4;21)/%&" 1" 40*+" ;+$3/#*" /0" 1" ,1/%" 34%-)/$%1#/)6" $3" 1";*+0$%1#/?*2" 0*1+-5" *%&/%*9" :,;#*,*%)1)/$%" $3" 04-5" 1" 0)+1)*&6" +1/0*0" 0$,*" /004*0"
1--$+2/%&")$")5*"0)1)*"$3"1+)@"
! A5*+*"*8/2*%-*"0$4+-*0"3$+"$#%&#""/%)*+*0)0"1%2";+*3*+*%-*0"-$,*"3+$,B"
! C$=")$">4/#2"1%2",1%1&*"$%)$#$&6">10*2"40*+";+$3/#*B"
! C$=")$";*+0$%1#/?*"0*1+-5"=/)5"$%)$#$&6">10*2"40*+";+$3/#*B"
!./"""01*2%,3%$"$(4&3%$")(&"4$%&!$"'&%)%&%,3%$"+%5&,*,-"
!--$+2/%&" )$" DEF" 1" 40*+" G4*+67" $3)*%" -$%0/0)/%&" $3" 1" 3*="H*6=$+207" ;+$8/2*0" )5*"
,$0)"2/+*-)"/%3$+,1)/$%"1>$4)"5/0"/%)*+*0)09"C$=*8*+7")5*6"100*00"1)")5*"01,*")/,*")51)"
1" 40*+" G4*+6" /0" >$)5" 1,>/&4$40" 1%2" 05$+)" 1%27" )5407" /0" %$)" 1;;+$;+/1)*" 10" *8/2*%-*"
0$4+-*"3$+";+$3/#*">4/#2/%&9"
I$,*" 060)*,0" ,16" *.;#/-/)#6" 10H" 40*+0" )$" ;+$8/2*" 2$-4,*%)0" $+" H*6=$+20" $3"
/%)*+*0)" )$">4/#2" )5*/+";+$3/#*9"'()#*#+&,+%-.* )#*/0+%1*2,33%4*5&%3%6,12%* 0%%47,28!*,14*
,1%6"14)5$+0"04-5"10"DJF" DEF"016")51)"40*+0"1+*"+*#4-)1%)")$"*.;+*00")5*/+";+*3*+*%-*0"
*.;#/-/)#69" :%0)*127" )5*0*" 14)5$+0" ;+$;$0*" )$" -$##*-)7" /,;#/-/)#67" /%3$+,1)/$%" 1>$4)" 1"
40*+">6"$>0*+8/%&"5/0"/%)*+1-)/$%0"=/)5"1"0*1+-5"060)*,9"<5/0"/0"1%"/,;#/-/)"3**2>1-H"
1%2")5*"3$##$=/%&"40*+"/%)*+1-)/$%0"1+*"$3)*%"-$%0/2*+*2@"-#/-H/%&"$%"1"2$-4,*%)"DKF7"
>+$=0/%&7"018*7";+/%)/%&7"2$-4,*%)"04,,1+/*0"8/*=*2"DEF9"
!.!"""#$%&"6&()*+%"74*+2*,-"
!" ;*+0$%1#/?*2" 0*1+-5" *%&/%*" ,40)" >*" 1>#*" )$" -1;)4+*" )5*" /%)*+*0)0" $3" 1" 40*+9"
!--$+2/%&")$"DLF7")=$"40*+";+$3/#/%&"0)+1)*&/*0"-1%">*"2/0)/%&4/05*2@"2$-4,*%)(>10*2"
,*)5$20" 1%2" -$%-*;)(>10*2" ,*)5$209" M$-4,*%)(>10*2" ,*)5$20" DKFDNF" +*#6" $%"
2$-4,*%)" ;+*3*+*%-*0" #*1+%*2" 3+$," 40*+" >+$=0/%&" 1%2" -#/-H/%&" >*518/$+09" I4-5"
2$-4,*%)";+*3*+*%-*0"1+*")5*%"40*2")$">4/#2"40*+",$2*#"10"1"0*)"$3"=*/&5)*2"3*1)4+*0"
DLF9" O$%-*;)(>10*2" ,*)5$20" DPFDQF" >4/#2" 40*+" ;+$3/#*" 10" 1" 0*)" $3" -$%-*;)0" 3+$," 1%"
$%)$#$&67" -1;)4+/%&7" 5*%-*7" 40*+" -$%-*;)41#" /%)*+*0)09"R%*" -1%" %$)/-*" )51)" 1" 40*+" /0"+1)5*+",$+*"/%)*+*0)*2"/%"2$-4,*%)"/%3$+,1)/$%"-$%)*%)"SH%$=#*2&*"=/)5/%"/)T")51%")5*"
2$-4,*%)" /)0*#39" O$%0/2*+" )5/0" 1004,;)/$%" #*120" )$" -5$$0*" -$%-*;)(>10*2" 40*+"
;+$3/#/%&",*)5$20"=5*%"1%"$%)$#$&6"S2$,1/%"$%*"$+"%$)T"/0"181/#1>#*9""
U$0)"*./0)/%&"1;;+$1-5*0"40*")5*"*%)/+*"$%)$#$&6"10"1"40*+";+$3/#*9"V1-5"-$%-*;)"/0"
=*/&5)*2"1--$+2/%&")$")5*"40*+"/%)*+*0)"1%2"1"0;+*12"1-)/81)/$%",*-51%/0,"/0"40*2")$"
/%3*+"/%)*+*0)0"$3"1##"-$%-*;)0"/%")5*"+*3*+*%-*"$%)$#$&69"!4)5$+0"/%"DQF"40*")5*"*%)/+*"
Page 45

!"#!$!%&'#!'(!)*$'+',-*.'/.!01$*'2,#'(+"+%*'2!#3'+'$!"%'#*.('1"#*.*-#'+")'+'-3!.#'#*.('
!"*4'5"$16*' #3*' /.*7*)*"#' +,#3!.-' 83!' !"$&' 7!"-1)*.*)' 7!"7*/#-' 0.!('!"#!$!%&' +-'
*$*(*"#-'!0'#3*',-*.'/.!01$*9':;<'7!"-1)*.'2!#3'#+=!"!(17'.*$+#1!"-'+")'"!"'#+=!"!(17'
.*$+#1!"-'0!.',-*.'/.!01$*'.*/.*-*"#+#1!"-'+")')*01"*',-*.'(!)*$'+-'+"'1"-#+"#1+#1!"'!0'
!"#!$!%&4'
>"':?<'+,#3!.-'1"0*..*)',-*.'/.!01$*'0.!('.*7*"#'-*+.73'31-#!.&'@-3!.#'#*.(A'+")'2,1$)'+'
,-*.' /.!01$*' +-' +' 8*1%3#*)' %.+/3' !0' -*(+"#17+$$&' .*$+#*)' 7!"7*/#-' !0' /.*)*01"*)'
!"#!$!%&4'
'
'
!"""#$%&'%%$()%"*)+",()&-'%$()"
>"' #31-' -*7#1!"9'8*' )1-7,--' #3*' (+1"' $1(1#+#1!"-' !0' *=1-#1"%' !"#!$!%&B2+-*)' ,-*.'
/.!01$1"%'+//.!+73*-4'C1%3$1%3#1"%'-,73'$1(1#+#1!"-'7+"'$*+)'#!'2,1$)'+"'+77,.+#*',-*.'
/.!01$*4'D!'!,.'6"!8$*)%*9' E+.1!,-'!"#!$!%&'2+-*)',-*.'/.!01$1"%'-#.+#*%1*-'8*'3+E*'
-#,)1*)'-,00*.'0.!('#3*'0!$$!81"%'$1(1#+#1!"-4'
F.!(' +' -*#' !0' ,-*.' 7!"7*/#-' !0' 1"#*.*-#9' !"#!$!%&' 2+-*)' /*.-!"+$1G*)' -*+.73'
*"%1"*-'!0#*"'1"0*.'!#3*.'7!"7*/#-'83173'+.*'.*$+#*)'#!'#3*'1"1#1+$'!"*-'+")'83173'3+E*'
+' %.*+#' $16*$13!!)' #!' 1"#*.*-#' #3*' 7!"-1)*.*)' ,-*.4'H'(+I!.' /+.#' !0' +,#3!.-' :?<:J<:;<'
,-*-' +' -/.*+)' +7#1E+#1!"' (*73+"1-(' #!' 1"0*.' "*8' 7!"7*/#-' !0' 1"#*.*-#4' D3*' ,-*.'
/.*0*.*"7*-' 0.!(' 1"1#1+$' 7!"7*/#-' +.*' -/.*+)' #3.!,%3' "*8' !"*-' #+61"%' 1"#!' +77!,"#')100*.*"#'61")-'!0'$1"6-'+")'#3*1.'-#.*"%#34'D31-'-/.*+)'-#.+#*%&'3+-'+').+82+76'-1"7*'1#'
!"#$%&''#+6*'1"#!'+77!,"#'#3*'-1(1$+.1#&'2*#8**"'7!"7*/#-4' >")**)9'83*"'+',-*.'$16*-'
#3*' 7!"7*/#'(!"#)'83173' 3+-' ($%&'!(%)' +-' 0+#3*.' +")'()*#+, )'%-.")' +-' -!"9' #3*' ,-,+$'
-/.*+)'+7#1E+#1!"'(*73+"1-('%1E*-'-+(*'8*1%3#'#!'2!#3'#3*'1"1#1+$'7!"7*/#'@(7+.)A'-!"'
+")'0+#3*.4'C!8*E*.9'83*"'+',-*.'/.*0*.'(7+.)9' +"'1"0*.*"7*'(*73+"1-('(,-#'%1E*'+'
(!.*'1(/!.#+"#'8*1%3#'#!'(0!.)'01*-#+)'#3+"'#3*'!"*'1#'%1E*-'#!'(E*317$*)'2*7+,-*'8*'
+.*'-,.*'#3+#'@+77!.)1"%'#!'!,.'!"#!$!%&A'+'(0!.)'01*-#+)'1-'+'(7+.)'+")'+'(E*317$*)'7+"'
2*'!#3*.'#31"%-'#3+"'(7+.)'-,73'$16*'@217&7$*A4'H,#3!.-'1"':KL<'#.1*-'#!'#+76$*'#31-'1--,*'
2&' 1"#.!),71"%' +' -1(1$+.1#&' (*+-,.*' 1"' !.)*.' #!' #+6*' 1"#!' +77!,"#' .*$+#1E*' /!-1#1!"'
2*#8**"' +' -!,.7*' 7!"7*/#' +")' +' #+.%*#' !"*' 83*"' -/.*+)1"%' ,-*.' /.*0*.*"7*' !E*.'
!"#!$!%&'%.+/34'M,#'#3*&')!"&#'7!"-1)*.'#3*')100*.*"#'#&/*-'!0'$1"6-'+")'#3*1.'-#.*"%#34'
H' -/.*+)1"%' -#.+#*%&' (,-#' #+6*' 1"#!' +77!,"#9' 83*"' -/.*+)1"%' ,-*.' /.*0*.*"7*' !E*.'!"#!$!%&9' #+.%*#' 7!"7*/#-' -1(1$+.1#1*-' 81#3' -!,.7*' !"*-9' $1"6-' /.!/*.#1*-' @#&/*-' +")'
-#.*"%#3A'+")'#1(*4'
5-*.' /.*0*.*"7*-' +.*' !0#*"' 1")17+#*)' 1"' )!7,(*"#' -/+7*' *=/$171#$&:?<:J<:KK<' !.'
1(/$171#$&':K<N'+',-*.'!.'#3*'-&-#*('73!!-*-'+'-*#'!0')!7,(*"#-'!0'1"#*.*-#'81#31"'#3*'
O,*.&' .*-,$#-4' H$$' #3*' -#.+#*%1*-' 8*' -#,)1*)' #.&' #!' 1"),7*' +' ,-*.' /.*0*.*"7*' 0.!(' +'
)!7,(*"#'#!'7!"7*/#-'@!.'6*&8!.)-A'81#31"'1#-'1")*=4'D3+#'-#.+#*%&'1-'"!#'-+#1-0+7#!.&4'
F!.'*=+(/$*9'$*#',-'7!"-1)*.'#3*')!7,(*"#'+'83173'1-'1")*=*)'2&'+/01(2%34&'.%3#%+54'
H' ,-*.' 7+"' $16*'+' 2*7+,-*' !0' !"*' !0' 1#-' 1")*=' @1(%2%' 0!.' *=+(/$*A' !.' 2*7+,-*' !0' +'
7!(21"+#1!"' !0' 1#-' 1")*=&-' *$*(*"#-' @!1(2%34&'.%", *#, !1(2%34&'.%3#%+"A4' D3*.*0!.*'
83*"'+'-&-#*('!"#$%&''*=/$171#$&'+-6'+',-*.'#!'*=/.*--'31-'/.*0*.*"7*'1"'7!"7*/#'-/+7*9'
#3*.*'1-'"!'8+&'#!'!2I*7#1E*$&'1"0*.',-*.'/.*0*.*"7*-'1"'7!"7*/#'$*E*$4'
P!-#'!0' #3*'/*.-!"+$1G*)'-*+.73'-&-#*(-' 0!7,-'!"',-*.-&'/!-1#1E*'/.*0*.*"7*-9' 14*')!7,(*"#-'#3+#',-*.-'+.*'1"#*.*-#*)'1"4'Q!-1#1E*'/.*0*.*"7*-'+.*'"!#'*"!,%3'#!'+--*--'
*$#+&$' 1"#*.*-#-' 1"'-!(*',-,+$'7+-*-4' >")**)9' -!(*')10017,$#'O,*.1*-'(+&'3+E*' +' 0*8'
Page 46

!"#"$%&'(!")*#')(%&+(',*)(',"(&*-."!(/0(+/1*-"&')(',%'(%!"(!"#"$%&'('/(%(*)"!(2)(#/34(5&(
',%'()2'*%'2/&6(3"(,%$"(%(7!"%'(&*-."!(/0(&/&(!"#"$%&'(+/1*-"&')(%&+(%(#/3(&*-."!(
/0(!"#"$%&'(/&")4(8/(1/!!"1'#9(!":!")"&'(*)"!(2&'"!")')6(:"!)/&%#2;"+()9)'"-(-*)'(,/#+(
%&+(-%&%7"(./',('3/(<2&+(/0(*)"!(:!/02#")=(',"(&"7%'2$"(/&"(%&+(',"(:/)2'2$"(/&"4(
(
(
>4(?,"&(@6(8%&(A6(B,%2(C=(!"#$%&%'()*+,("-.+$%/0(1-,(#+,*-/2$%3+.(*+2,&44(D%&)(
!"#$%%&'()*+#,+-.%+/0-.+123+'(-%"(4-'#(45+$#(,%"%($%+#(+6(,#"74-'#(+4(&+8(#95%&)%+
74(4)%7%(-4((E"3(F/!<6(EF6(G?H=(HCIJ(KLLM=NKO!NP>4(
(
K4( 8%-2&"QR"1,%&2( R6( A/*7,%&"-( I6( B"-2!#2( E=( 5+,*-/2$%3+.( .-&)"+/'(
,2/6%/07( 89#$-%'%/0( +:%.+/&+( 1,-"( ")$'%#$+( )*+,( %/'+,+*'*( 1-,( #,-1%$%/0( 2/.(,+',%+:2$4(:;63(KLLN6(;=PMOQPSM4(
(
P4( T"##9( D6( 8""$%&( U=( !"#$%&%'( 1++.<2&6( 1-,( %/1+,,%/0( )*+,( #,+1+,+/&+7( 2(
<%<$%-0,2#4=4(<6=6>+?#"@7(KLLP6(>?=>N!KN4(
(
O4( D%/*+( I6( 8%-2&"QR"1,%&2( R6( A/*7,%&"-( I6( C,".%!/( A=(@( *+**%-/( <2*+.(
#+,*-/2$%3+.( *+2,&4( )*%/0( 2/( -/'-$-0%&2$( )*+,( #,-1%$+4( D%&)(!"#$%%&'()*+ #,+ -.%+
ABBC+ 123+ *D7E#*'@7+ #(+ 1EE5'%&+ 2#7E@-'()4( ( E"3( F/!<6( EF6( G?H=( HCIJ(
KLLV=>WPK!>WPS4(
(
M4( U/%1,2-)( 8=( A#'%"%3%/0( *+2,&4( +/0%/+*( )*%/0( &$%&6'4,-)04( .2'24( D%&)(
!"#$%%&'()*+ #,+ -.%+ %').-.+ 123+ <6=F;;+ '(-%"(4-'#(45+ $#(,%"%($%+ #(+ F(#95%&)%+&'*$#G%"D+4(&+&4-4+7'('()4((E"3(F/!<6(EF6(G?H=(HCIJ(KLLK=>PP!>OK4(
(
S4( R"*&7( TX6( R""( DR=(B+,%:%/0( C-/&+#'DE2*+.( F*+,( 5,-1%$+*( 1,-"( G+2,&4(
8/0%/+(H-0*4(6HHH+I"4(*4$-'#(*+#(+F(#95%&)%+4(&+;4-4+H()'(%%"'()(KL>L6(II=VSVQ
VNK4(
(
W4(E7(X6(D"&7(R6(R""(DR=(J%/%/0(F*+,(#,+1+,+/&+()*%/0(G#=(:-'%/0(1-,(*+2,&4(
+/0%/+(#+,*-/2$%32'%-/4(123+I"4(*J+6(-%"(%-+I%$.(#5J(KLLW6(?4(
(
N4( Y%##"'( D6( C%)'"##)( Z6( ["!&%&+";( I6( I9#/&%)( Z6( H$!2',2)( F=( 5+,*-/2$%3+.(
C-/'+/'(K+',%+:2$(%/(C-/'+9'(F*%/0(A/'-$-0%&2$(L/-M$+.0+4(2'"$@'-*+4(&+<D*-%7*+
,#"+K'&%#+I%$.(#5#)DL+6HHH+I"4(*4$-'#(*+#((KLLW6(N?=PPSQPOS4((
V4(U2%&7(@6(8%&(H=(H+2,/%/0(2/.(%/1+,+/&%/0(%/()*+,(-/'-$-0=(1-,(#+,*-/2$%3+.(
G+"2/'%&(O+<(*+2,&44(6(,#"74-'#(+<$'%($%*(KLLV6(N?P=KWVOQKNLN4(
(
>L4(?1,21<"#QB*."!(Y6([%#'2&7)(A=(!/1+,,%/0()*+,Q*(#,+1+,+/&+*()*%/0(-/'-$-0%+*4(
D%&)(E"#$%%&'()*+#,+-.%+A/*-+(4-'#(45+$#(,%"%($%+#(+1"-','$'45+'(-%55')%($%+M+K#5@7%+
A4((HHH5(Z!"))J(KLLS=>O>P!>O>N4(
(
>>4( 8%-2&"QR"1,%&2( R6( A/*7,%&"-( I6( B"-2!#2( E=( 5+,*-/2$%3+.( .-&)"+/'(
,2/6%/07( 89#$-%'%/0( +:%.+/&+( 1,-"( ")$'%#$+( )*+,( %/'+,+*'*( 1-,( #,-1%$%/0( 2/.(,+',%+:2$4(:;63(KLLN6(;=PMOQPSM4(
Page 47

Multicriteria and multiactor decision situationsin the management of industrial safety
Abdelhak Imoussaten, Jacky Montmain, Eric Rigaud, and Francois Trousset
LGI2P - Ecole des mines d’Ales, Nı[email protected]
Keywords: Multicriteria decision, Argumentation theory, Constraints program-ming, Game Theory.
1 Introduction
Improving industrial safety in a complex industrial system requires many deci-sions that depict a group of actors. Each actor has his expertise domain and hisactions. These decisions come under different levels of abstraction: operationaldecisions which ensure system reliability by controlling that the observable ofthe system are maintained in a given operating range ; tactical decisions whichensure that the outputs of the system reach the desired security objectives andfinally ; strategic decisions which anticipate standards evolutions ; safety guide-lines or context changes. These three levels of decision involve many actors andmany criteria to assess system security and many more potential actions to im-prove it. Actions and performances are linked by various relationships which areon the one hand, physical constraints on the system and, on the other hand, thestrategy of the industrial in safety mater. As an example, European standardsor guidelines are an expression of requirements at state or Europe level. Then,industrials have policy or strategy implementations that can be seen as refine-ments of requirements. We propose to formalize a number of collective decisionsituations observed in safety management. We then propose several mathemati-cal modelization of this problematics whose resolution is supported by a softwaretoolbox.
2 Leadership versus operational
When system performance is measured by several indicators and there are manypotential actions that could improve this multicriteria performance, it is oftendifficult to isolate the most relevant actions. Furthermore, actions are usuallyattached to different services or departments, which do not necessarily know(or know little) about the capacity of neighboring departments to coordinatejoint actions. Individual interests also may be sources of competition or con-flict. An efficient collective control of the improvement project requires, amongother things, to know the issues and functions of the communication betweendepartments (collaborative exchange of useful knowledge), to identify the key of
Page 48

II
group dynamics (collective and individual issues). We distinguish between two
extreme views regarding to this concept of collective improvement control: 1)
the first point of view corresponds to an ideal situation where each one reveals
his capacity and has no other goal than the success of the collective project. The
decision is then reduces to a combinatorial optimization problem; 2) the second
point of view is a more realistic situation where information shared is just nec-
essary to conduct the collective action and where individual interests are added
to the common goal. This latter view is more akined to a model of decision in
organization.
In a complex system, only a qualitative model T can usually be established to
define the relationships between indicators of the system performances and po-
tential actions on the system. Based on this model, identifying the most relevant
actions to improve system performances is modeled as a problem of collective
decision. We consider two models based on different assumptions. Either de-
partments cooperate fully: T is known to everyone. Or they act as autonomous
cooperating agents: they seek to solve the problem of improvement together,
but they have individual policies regarding the sharing of the budget devoted to
the improvement. Then they do not necessarily share all the knowledge in the
transformation T.
When agents share their knowledge about the effects of actions on perfor-
mances of the company for which they are responsible, we turn to a multi objec-
tive optimization problem [3]. When agents only reveal partial of their knowledge
of the effects of actions on performances, we opt for an argumented negotiation
model based on the argumentation theory [4].
3 Strategist versus experts
This deals with information fusion from different sources in a context of multi-
criteria and multiactor decision aid. In our experiments, the sources come from
experts, but the proposed model can also be applied to imprecise sensor data
fusion. Information fusion consists in combining opinions from several sources
in order to help the decision makers make a more reliable decision when takes
into account all received views. This decision problem corresponds to the con-
figuration where there is a unique strategist who seeks to better manage the
recommendations delivered by the experts. This actor is supposed to know the
priorities and fix the strategy. Other actors or experts agree on the objectivity
of his preference model. They just give their opinions on the decision concerning
their domain of expertise. Thus, the group decision in this configuration is seen
as a problem of fusion of experts’ opinions. This fusion problem takes place on
two levels. The first level of fusion synthesizes the information from the experts
on a given criteria. The second level assign an overall evaluation on each ana-
lyzed alternative. It is based on partial assessments obtained on this alternative
for all criteria. It is thus placed deliberately, in an aggregation of scores scheme,
and not of preferences: we believe that an expertise is often devoted to a single
object of analysis. It assesses the appropriateness for a particular purpose rather
Page 49

III
than a comparative analysis of several alternatives as an expert can not have
the same degree of expertise on each subject. The two steps of fusion involved
in our approach have different semantics. The first step consists in finding the
possible values of a criteria with regard to an alternative based on experts opin-
ions and eventually in detecting conflicts between people known for excellence
on the subject. We rely on a possibilistic representation of the distribution of
opinions. The second step consists in adopting a strategy of aggregation accord-
ing to the priorities that the scientific or political authorities have established
(then focused on the semantics of the mathematical operator used to carry out
the fusion). Divergences of experts’ opinions are used by the strategist (leader of
a crisis cell, for example) to direct the debate of experts on the conflicting points
which refer to critical dimensions of the decision. The criticality of a decision
criterion is estimated through sensitivity analysis performed on the aggregation
operator that models the strategy of the strategist.
4 Governance debate
The governance of the experts debate mentioned above is based on the reduction
of entropy resulting from divergences of opinions of experts. From this analysis,
the decision maker asks experts to compare their views on each of the criteria for
which inconsistencies were found to reduce the dispersion of global distribution
and ease the comparison of alternatives. In this new section, we focus, on the one
hand, on arguments exchanged between experts when reviewing their opinions,
and, on the other hand, on the introduction of a more ”Political” dimension of
the control of the dynamics of debate. This is the dimension of influence in a
social network.
we thus focuse on multiactor configurations where the collective decision
akin to an argumented collective deliberation. The task of each actor is to state
his opinions using arguments built upon his beliefs and his individual goals.
This is a decision problem of organization or group. Autonomous agents have
reasoning ability based on knowledge and preferences which may be conflicting
to other ones. They interact to solve the common problem. Conflicts may emerge
from their interdependencies and negotiation is a necessary mechanism to find
a mutually acceptable consensus. In such a process, argumentation is necessary
to justify the choice of agents. The problem may be seen as a complement to
the vision of the previous section, since it addresses the notion of arguments,
only suggested in the resolution of conflicts in the previous section. The notion
of influence between the actors of the decision is introduced. Thus, in opposite
of the previous section, it focuses on how the entropy can decrease during the
debate of experts. The previous section raised the question of ”what to control”
in the process to obtain a consensus among experts and decision makers. Here
we are interested in ”what is controlled and how it is controlled” at the level of
decisional logic of each actor.
This issue of governance of the debate is also trying to link different work
on the simulation of debates in multi-criteria analysis, argumented negotiation
Page 50

IV
and influence in a social network. Each work providing fragmented views onthe debate modeling. We do not pretend to produce a more complete model,but simply suggest connections between these approaches. The starting pointfor our works is to consider the experts’ debate as a dynamic process whichneed to be analyzed and controlled. Its dynamics depends on the argumentationstrategy of the actors, and on the order of their intervention in the deliberation.Indeed, the act of actors, their ability to maneuver, to produce coalitions areimportant factors in the dynamic process of collective decision that are addedto the argumentation quality.
The basic principle behind our model is as follows: control the dynamic of thedebate by using the influence that an actor may have in a social network. Thiscontrol is to determine the most influential actor in real time (the speaker atthis time) because he is supposed to be able to rally more actors to his opinions.The concept of social influence is related to the statistical notion of decisionalpower of an individual in a social network. We propose to consider the decisionalpower as a dynamic variable because it evolves during time depending on thepreferences of actors: indeed, it is based on the probability that an actor has in-clination for one option over another at a given time. Two methods are proposedto calculate this probability. The first method [2] is based on the utility assignedto each option every time a new argument is introduced in the debate. The sec-ond method [1] is based on the equations of evolution of convictions. The stateequations which are established in this approach allow to simulate statisticallythe outcome of a debate. This is based on initial preferences of the actors andinfluences exerced in the group. The formalism proposed is similar to approchesused in automatic to model continuous dynamic systems and their control. Gov-ernance debate is clearly seen there as a control problem even hiding the role ofthe argument in favor of actors influence exerted during the deliberations for astatistical simulation of the outcome of the debate.
References
1. A. Imoussaten, J. Montmain, A. Rico, and F. Rico. A dynamical model for simu-lating a debate outcome. In 3rd International Conference on Agents and ArtificialIntelligence, ICAART 2011, Roma, Italy, 2011.
2. A. Imoussaten, J. Montmain, and E. Rigaud. Modele d’influence pour le pilotaged’une decision de groupe. In Rencontres Francophones sur la Logique Floue et sesApplications (LFA), Annecy, France, 2009.
3. A. Imoussaten, J. Montmain, F. Trousset, and C. Labreuche. Multi-criteria im-provement of options. In European Society for Fuzzy Logic and Technology (Eusflat),Aix-les-Bains, France, 2011.
4. A. Imoussaten, F. Trousset, and J. Montmain. Improving performances in a com-pany when collective strategy comes up against individual interests. In EuropeanSociety for Fuzzy Logic and Technology (Eusflat), Aix-les-Bains, France, 2011.
Page 51

An approach for an anticipative detection of
interoperability problems in collaborative process
Sihem Mallek1, Nicolas Daclin1, Vincent Chapurlat
1,
1 LGI2P - Laboratoire de Génie Informatique et d'Ingénierie de Production
site de l’Ecole des Mines d’Alès, Parc Scientifique Georges Besse,
F30035 Nîmes Cedex 5, France
{Sihem.Mallek, Nicolas.Daclin, Vincent.Chapurlat}@mines-ales.fr
Abstract. Enterprises are today involved in collaborative processes with other
partners sharing common economical interests in confidence. This allows these
enterprises to focus on their core business, to optimize, and to be effective to
respond to customers’ needs. Implicitly, a partner that wishes to become
involved in a partnership must demonstrate numerous qualities and enable to
gain the confidence of other partners. Among other ones, demonstrate its ability
to be interoperable is a major issue. This research work aims to define, to
formalize and to analyze a set of interoperability requirements that each partner
of a collaborative process have to satisfy prior to any collaboration.
Keywords: interoperability, interoperability requirements, compatibility,
interoperation, verification, model checker, conceptual graphs, collaborative
process.
1 Introduction
A collaborative process can be defined as “a process whose activities belong to
different organizations” [1]. It is a way allowing to formalize how partners
(enterprises for inter organizational collaborative processes or team for intra-
organizational processes) may work together regarding a common objective that is
usually defined to provide - faster and efficiently - products and services (to design, to
produce, to deliver…) to their stakeholders. However, before being involved with
confidence in a collaborative structure, each partner may have to assume and, if
needed, to demonstrate that it possesses relevant qualities and it respects needs
regarding the type, the requested role and the nature of the collaboration. One of them
is related to its ability to interoperate harmoniously and efficiently with other partners,
in other words to be interoperable as defined in [2] as the “ability of enterprises and
entities within those enterprises to communicate and interact effectively”. Therefore,
to help partners involved in a collaborative process to find their interoperability
problems, this research work focuses on the detection from an anticipative manner –
i.e. before the implementation of the collaborative process - of interoperability
problems that can be induced by characteristics or behaviors of partners. In this
perspective, the anticipation of a problem requires to perform analysis on a model of
Page 52
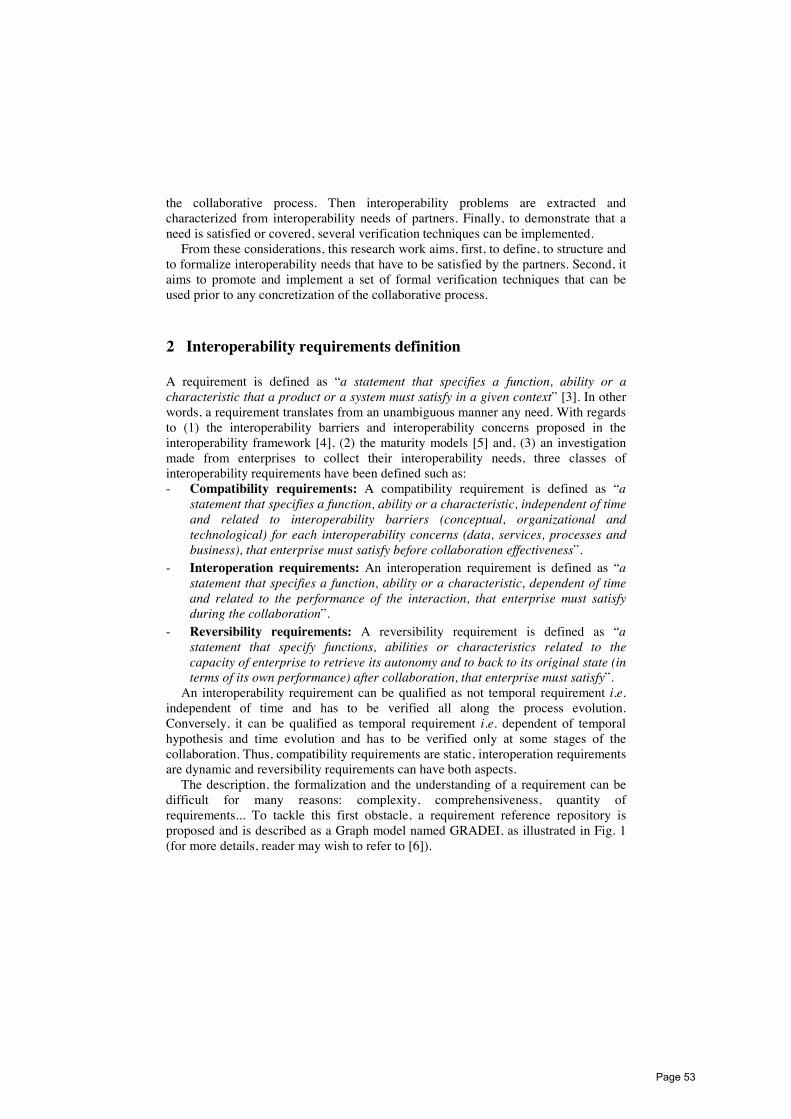
the collaborative process. Then interoperability problems are extracted and
characterized from interoperability needs of partners. Finally, to demonstrate that a
need is satisfied or covered, several verification techniques can be implemented.
From these considerations, this research work aims, first, to define, to structure and
to formalize interoperability needs that have to be satisfied by the partners. Second, it
aims to promote and implement a set of formal verification techniques that can be
used prior to any concretization of the collaborative process.
2 Interoperability requirements definition
A requirement is defined as “a statement that specifies a function, ability or a
characteristic that a product or a system must satisfy in a given context” [3]. In other
words, a requirement translates from an unambiguous manner any need. With regards
to (1) the interoperability barriers and interoperability concerns proposed in the
interoperability framework [4], (2) the maturity models [5] and, (3) an investigation
made from enterprises to collect their interoperability needs, three classes of
interoperability requirements have been defined such as:
- Compatibility requirements: A compatibility requirement is defined as “a
statement that specifies a function, ability or a characteristic, independent of time
and related to interoperability barriers (conceptual, organizational and
technological) for each interoperability concerns (data, services, processes and
business), that enterprise must satisfy before collaboration effectiveness”.
- Interoperation requirements: An interoperation requirement is defined as “a
statement that specifies a function, ability or a characteristic, dependent of time
and related to the performance of the interaction, that enterprise must satisfy
during the collaboration”.
- Reversibility requirements: A reversibility requirement is defined as “a
statement that specify functions, abilities or characteristics related to the
capacity of enterprise to retrieve its autonomy and to back to its original state (in
terms of its own performance) after collaboration, that enterprise must satisfy”.
An interoperability requirement can be qualified as not temporal requirement i.e.
independent of time and has to be verified all along the process evolution.
Conversely, it can be qualified as temporal requirement i.e. dependent of temporal
hypothesis and time evolution and has to be verified only at some stages of the
collaboration. Thus, compatibility requirements are static, interoperation requirements
are dynamic and reversibility requirements can have both aspects.
The description, the formalization and the understanding of a requirement can be
difficult for many reasons: complexity, comprehensiveness, quantity of
requirements... To tackle this first obstacle, a requirement reference repository is
proposed and is described as a Graph model named GRADEI, as illustrated in Fig. 1
(for more details, reader may wish to refer to [6]).
Page 53
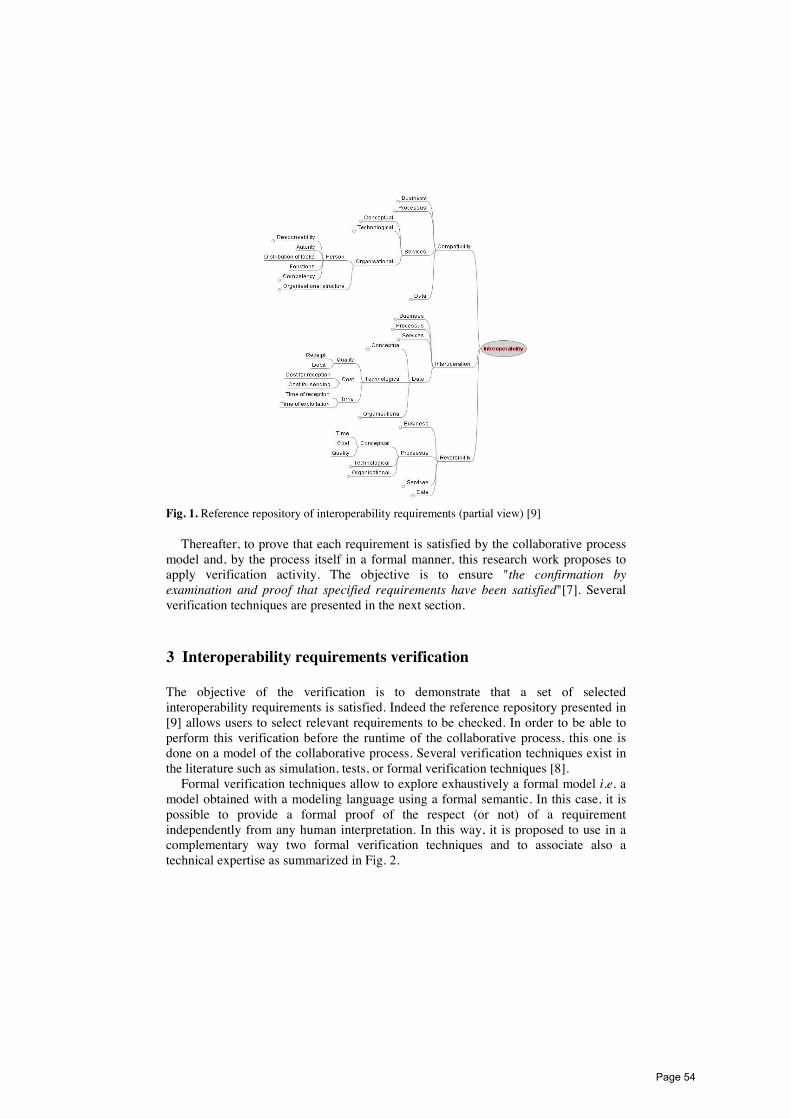
Fig. 1. Reference repository of interoperability requirements (partial view) [9]
Thereafter, to prove that each requirement is satisfied by the collaborative process
model and, by the process itself in a formal manner, this research work proposes to
apply verification activity. The objective is to ensure "the confirmation by
examination and proof that specified requirements have been satisfied"[7]. Several
verification techniques are presented in the next section.
3 Interoperability requirements verification
The objective of the verification is to demonstrate that a set of selected
interoperability requirements is satisfied. Indeed the reference repository presented in
[9] allows users to select relevant requirements to be checked. In order to be able to
perform this verification before the runtime of the collaborative process, this one is
done on a model of the collaborative process. Several verification techniques exist in
the literature such as simulation, tests, or formal verification techniques [8].
Formal verification techniques allow to explore exhaustively a formal model i.e. a
model obtained with a modeling language using a formal semantic. In this case, it is
possible to provide a formal proof of the respect (or not) of a requirement
independently from any human interpretation. In this way, it is proposed to use in a
complementary way two formal verification techniques and to associate also a
technical expertise as summarized in Fig. 2.
Page 54
!"#$%&'(#)'*+,-.(-#-!"#$%"&'()#*+(
+*'&,-(%*."&!"/$,01&'($.'(2#*3$4,&
!"#$%&'(#)'*+,-.(-#/*0&'(#
)#*+("5&(&!2&#"1-(%$..*"(4&(
6)*#+$,,78(2#*3&'
Interoperability requirements
Model
checker
12-#3-2&4&-.#5"
Conceptual Graphs
6"'70&/8979&/
Technical
expertise
:'4*207,
Fig. 2. Proposed verification techniques
The first verification technique is based on Conceptual Graphs [9] to verify static
requirements. The advantage to use Conceptual Graphs is (1) to describe the
collaborative process and interoperability requirements on the same formalism, (2) to
dispose of a convenient graphical form to handle and, (3) to dispose of a mathematical
foundation and mechanisms (projection, principles of rules and constraints principles)
which are used to check static requirements.
The second one is based on model checking [10] for the dynamic requirements.
The advantage to use model checker is (1) to include temporal aspect of the
collaboration, (2) to consider all states of the collaborative process all along the
collaboration and (3) to verify dynamic requirements exhaustively.
In other cases, if interoperability requirements highlight particular points of view
of the process and cannot be described due to a limitation imposed by the modeling
language, the technical expertise of the model is required. This aspect of checking is
not considered in this work.
References
1. Aubert, B., Dussart, A.: Système d’Information Inter-Organisationnel. Rapport
Bourgogne, Groupe CIRANO, March (2002) [in French]
2. ISO/DIS 11345-1: Advanced automation technologies and their applications. Part 1:
Framework for enterprise interoperability (2009)
3. Scucanec, S. J., Van Gaasbeek, J. R.: A day in the life of a verification requirement.
U.S Air Force T&E Days, Los Angeles, California, February (2008)
4. INTEROP: Enterprise Interoperability-Framework and knowledge corpus - Final
report. INTEROP NoE, FP6 – Contract n° 508011, Deliverable DI.3, May 21st (2007)
5. Tolk, A., Muguira, J.A.: The Levels of Conceptual Interoperability Model. Proceedings
of Fall Simulation Interoperability Workshop (SIW), Orlando, USA (2003)
6. Mallek, S., Daclin, N., Chapurlat, V.: Toward a conceptualisation of interoperability
requirements. IESA 2010, Interoperability for Enterprise Software & Applications,
Coventry, 14-15 April (2010)
7. ISO 8402: Quality management and quality assurance. Vocabulary, Second edition
1994-04-01, International Standard Organization, (1994)
8. Edmund, M., Clarke, Jr., Grumbereg, O., Doron A.P.: Model checking. The MIT Press
(1999)
9. Sowa, J.F.: Conceptual Graphs. IBM Journal of Research and Development, (1976)
10. Behrmann, G., David, A., Larsen, K. G.: A tutorial on Uppaal. Department of
Computer Science, Aalborg University, Denmark (2004)
Page 55
Circular Signal Descriptor (CSD)in points of interest
Jean-Louis Palomares and Philippe MontesinosParc scientifique Georges Besse, 30035 Nımes, France
[email protected] ,[email protected]
Ecole des Mines d’Ales, LGI2P, Site EERIE
Abstract. This paper presents a new local descriptor named CircularSignal Descriptor (CSD) based on the signal obtained by a half circu-lar anisotropic Gaussian filter discretized in 360 degrees applied aroundpoints of interest. This new approach o!ers a complete description ofcolor variation around a point of interest. The CSD permits to com-pare and to identify di!erent signals for matching points two by two.The distance defined between two signals CSD is invariant at Euclideantransformation of the image; And after normalization is robust at thecolor transformation model. The minimum distance between two CSDdescriptions is immediately performed for matching pairs of points be-tween images. This new approach gives conclusive results for matchingpairs of points in various natural images.
1 Introduction
The description of local points of an image has many applications for 3D struc-tures [20] [7], Stereo vision [17], tracking [3], motion detection [19]... The SIFTDescriptor [10] is currently qualified by several studies as robust local descriptoridentifier [12] [16]. And the subject of articles which further improves its per-formance [8] [1] and extended it at the color: CSIFT [11] [1].The SIFT (ScaleInvariant Feature Transform) is based on the method of extracting local intensityand direction of the gradient for obtained keypoints [10] [5] but it is patentedby the university of columbia. The SURF (Speeded Up Robust Features) is anopen source, it used a Hessian matrix-based measure for the detector and adistribution based descriptor [2].SIFT presents its stability in most situationsexcept rotation and illumination changes. SURF is the fastest one with a goodperformance [6].The new concept introduced here by the Circular Description of the Signal(CSD) around a point of interest consists in o!ering a local circular informa-tion (without a sharp cut o! window) of the filtering color RGB for each degree! considered. The study is completed by its implementation and standardiza-tion for invariance of Euclidean transformation, translation and rotation, andits robustness to a linear model of transformation Colorimetric.
Page 56

2 Local Directional FilterThe definition of Local Directional Filter applied at a point (x0, y0):
G( ) (x0, y0) = S(x0) e!!
X2
2 21
+ Y 2
2 22
"with
#X = x0cos( ) + y0sin( )Y = !x0sin( ) + y0cos( ) (1)
The intensity of color RGB of neighboring points with the discrete values oflocal directional filter Gd( ) (fig. 1 image of t he local discre t e fil t er Gd(!) for somedegree) gives the discrete values of CSD:
CSDR(!0!359)(xn, yn) =$l
0IR(xn+l, yn+l).Gd(!)(xl, yl)
CSDG(!0!359)(xn, yn) =$l
0IG(xn+l, yn+l).Gd(!)(xl, yl)
CSDB (!0!359)(xn, yn) =$l
0IB (xn+l, yn+l).Gd(!)(xl, yl)
(2)
3 Euclidean InvarianceA ccording to t he defini t ion t he signal is circular around t he point of int erest . T he 360degrees descrip t ion fea t ures can b e considered as a cont inue signal informa t ion of ap eriodical func t ion F (!).
For t his, if CSDp1 is t he signal of t he point p1 in t he first image and CSDp2 is t hesignal of t he same point p2 in second image, wi t h a lag induced by t he rot a t ion of t hesecond image :
CSDP1(xn, yn)(!0!359) ! CSDP2(xn, yn)(! !359+ ) = 0$l
0IR(xn1+l, yn1+l).Gd(!)(xl, yl) !
$l
0IR(xn2+l, yn2+l).Gd(! + ")(xl, yl) = 0
(3)
T wo same signals C S D can b e ma t ched in discre t e value E qua t ion (2), if we de t er-mine t he lag " or pu t in coincidence t he two signals.
Readjustment by Maximum start T he func t ion F (!) admi ts a ma ximum indiscre t e mode a t an angle ! and is used for normaliza t ion in E qua t ion (7). D efini t ion:!CSDmax is t he angle in degrees giving t he ma ximum value of t he local fil t ering for apoint P.
ma x(CSD0!359) =" !CSDmax (4)
4 Invariance against color transformationA model of color transformation by a matrix M(3 " 3) (amplification/reduction)and a vector T () (translation) is used to evaluate the CSD evolution.
ITr =
%
& R 0 00 G 00 0 B
'
( I +
%
& R G B
'
( (5)
CSD comparison of a corner point using the model of color transformation inEquation 5 shows the change in amplitude (eg: R for RED channel) and signallevel ( R) (Fig. 3).
Page 57

Fig. 1. Images of the Local Directional Filter at ! = 0!, 36!, 64!, 96!... showing itsdiscrete regularity Equation (1)
!" #$ %& !'( !(' !%" ')$ '*& )&( )$'&
'
$
(
"
!&
!'
!$
!( !"#$
%&
'(
)*
!*"
!($
!&&
!$(!"*!)"(!$
(#&
(%(
('*
(""
#*$
#(&
#&( #$*
a b c
Fig. 2. Image of the signal CSD at a corner point in graphic representation a) Imagewith a corner point b) CSD graph of the signal c) CSD circular representation
!" #$ !$% !"& $'( $"" '($&
&)&$
&)&(
&)&%
&)&"
&)!
&)!$
&)!(
&)!%
!" #$ !$% !"& $'( $"" '($&
&)&$
&)&(
&)&%
&)&"
&)!
&)!$
&)!(
&)!%
!" #$ !$% !"& $'( $"" '($&
&)&*
&)!
&)!*
&)$
&)$*
a b c d
Fig. 3. Image ITr of a corner point by color transformation (Red chanel) a)ImageITr variation (changed to red) b)CSD variation for "R = 0.50 and #R = 0.2 c)CSDvariation "R = 0.50 d) CSD variation #R = 0.50
!" #$ !$% !"& $'( $"" '($)!*+
)!
)&*+
&
&*+
!
!*+ !"#$
%&
'(
)*
!*"
!($
!&&
!$(!"*!)"(!$
(#&
(%(
('*
(""
#*$
#(&
#&( #$*
!" #$ !$% !"& $'( $"" '($)&*!+
)&*!
)&*&+
&
&*&+
&*!
&*!+
!" #$ !$% !"& $'( $"" '($)&*$
)&*!
&
&*!
&*$
a b c d
Fig. 4. Examples comparison of CSD at a corner point a,b using the model of colortransformation and c,d from real image with a di erent illumination for the second im-age a)CSDp1 and CSDp2 by color transformation "R = 0.5 and #R = 0.2 b)CSDp1 andCSDp2 in circular representation c)The movement of signal CSDI1p1 follows CSDI2p1
d) Same CSDI1p2 and CSDI2p2 (we can see a di erence i n the ampl i tude of the signa ls)
Page 58

5 Normalization of the CSD and MatchingThe complete filtering CSD normalized around the point eliminates R(GB) and R(GB) terms of the model of transformation color :
norma(CSD n+1! n)
=
!l
0IRGB(xn+l,yn+l).Gd( n+1)(xl,yl)!
!l
0IRGB(xn+l,yn+l).Gd( n)(xl,yl)
max( ∂F ( )∂ )
(6)
norma(CSD n+1! n) =∂F( )
∂
max( ∂F( )∂ )
(7)
For the best identification color by the CSD, the minimum distance given bythe means of the three colors RGB is considered; For all p points for the firstimage, with m points for the second image:
MCSD(I1(xp, yp), I2(xm, ym)) =( ∆ CSDR
+ ∆ CSDG+ ∆ CSDB
)
3(8)
6 ResultsA filter of 1 = 0.66 and 2 = 8 is used for matching the points of the first image,with
the second image that has undergone a transformation. The number of points (between
50 and 100 points) are kept in order by the ranking of the better match Equation (8).
a b
Fig. 5. Photos with a slight di erence between the two images a)Image I1: 59 pointsindicated b)Image I2, darker image, 59 points matched between the two images
7 ConclusionIn this paper, we present a new method of local description of a point of interestby extracting a Circular Signal Descriptor (CSD) wich filters the information.With previous example-based methods, the consistent information required todefine a local window or sharp cuto zone around the point. We resolve a rotatelinear filter in all 360 degrees as series of discrete mask filter performing thecomputation (this method is applicable to all linear rotary filters). This approacho ers complete and continuous description of local information in RGB color.The CSD can be used in many search solutions, by studying the signal needed,or comparing CSD or looking at CSD signals connections.
Page 59

References
[1] A.E. Abdel-Hakim and A.A. Farag. CSIFT: A SIFT descriptor with color in-variant characteristics. In C omputer V ision and P atter n Recogn ition , 2006 I E E EC omputer Soc iety C onference on, volume 2, pages 1978–1983. IEEE, 2006.
[2] H. Bay, T. Tuytelaars and L. Van Gool. Surf: Speeded up robust features. C om-puter V ision– E C C V 2006, pages 404–417, 2006.
[3] M. Bicego, A. Lagorio, E. Grosso and M. Tistarelli. On the use of SIFT featuresfor face authentication. In C omputer V ision and P atter n Recogn ition W orkshop,2006. C V P RW ’06. C onference on, page 35. IEEE, 2006.
[4] C. Harris and M. Stephens. A combined corner and edge detector. In A lvey visionconference, volume 15, page 50. Manchester, UK, 1988.
[5] S. Heymann, K. Maller, A. Smolic, B. Froehlich and T. Wiegand. SIFT im-plementation and optimization for general-purpose GPU. In P roceedi ngs of theI nter nationa l C onference i n C entra l E urope on C omputer G raphics, V isua l izationand C omputer V ision. Citeseer, 2007.
[6] L. Juan and O. Gwun. A comparison of SIFT, PCA-SIFT and SURF. I nter na-tiona l Jour na l of I mage P rocessi ng ( I J I P ), 3(4):143, 2009.
[7] M. Kafai, Y. Miao and K. Okada. Directional mean shift and its application fortopology classification of local 3D structures. In C omputer V ision and P atter nRecogn ition W orkshops ( C V P R W ) , 2010 I E E E C omputer Soc iety C onference on,pages 170–177. IEEE, 2010.
[8] Y. Ke and R. Sukthankar. PCA-SIFT: A more distinctive representation for localimage descriptors. C omputers, I E E E T ransact ions on, 2004.
[9] D.G. Lowe. Object recognition from local scale-invariant features. In iccv, page1150. Published by the IEEE Computer Society, 1999.
[10] D.G. Lowe. Distinctive image features from scale-invariant keypoints. I nter na-tiona l jour na l of computer vision, 60(2):91–110, 2004.
[11] R.H. Luke, J.M. Keller and J. Chamorro-Martinez. Extending the Scale Invari-ant Feature Transform Descriptor into the Color Domain. I C G S T I nter nationa lJour na l on G raphics, V ision and I mage P rocessi ng, G V I P.
[12] K. Mikolajczyk and C. Schmid. A performance evaluation of local descriptors.I E E E transact ions on patter n ana lysis and machi ne i ntel l igence, pages 1615–1630,2005.
[13] B. Montesinos, P. Magnier and JL. Palomares. A New Perceptual Edge Detector.M ult imedi a , 2010. I W I A ’ 09. 3th I W I A E cole des M i nes d A les, 2010.
[14] P. Montesinos and G. Claude. Finding People in Internet Images. In M ult imedi a ,2009. ISM ’09. 11th I E E E I nter nationa l Symposium on, pages 159–164. IEEE,2009.
[15] P. Montesinos, V. Gouet and R. Deriche. Di!erential invariants for color images.In P atter n Recogn ition , 1998. P roceedi ngs. Fourtee nth I nter nationa l C onferenceon, volume 1, pages 838–840. IEEE, 2002.
[16] P. Moreels and P. Perona. Evaluation of features detectors and descriptors basedon 3D objects. I nter nationa l Jour na l of C omputer V ision, 73(3):263–284, 2007.
[17] S. Se, D. Lowe and J. Little. Vision-based mobile robot localization and map-ping using scale-invariant features. In Robotics and A utomation , 2001. P roceed-i ngs 2001 I C R A . I E E E I nter nationa l C onference on, volume 2, pages 2051–2058.IEEE, 2005.
[18] I.T. Young and L.J. van Vliet. Recursive implementation of the Gaussian filter.Signa l processi ng, 44(2):139–151, 1995.
[19] E. Zadicario, S. Rudich, G. Hamarneh and D. Cohen-Or. Image-Based MotionDetection: Using the Concept of Weighted Directional Descriptors. E ngi neer i ngi n M edic i ne and B iology M agazi ne, I E E E , 29(2):87–94, 2010.
[20] H. Zhou, Y. Yuan and C. Shi. Object tracking using SIFT features and meanshift. C omputer vision and image understandi ng, 113(3):345–352, 2009.
Page 60

Rotating Half Smoothing Filters, Image
Segmentation and Anisotropic Diffusion
Baptiste Magnier, Philippe Montesinos and Daniel Diep
Ecole des Mines d’ALES, LGI2P, Parc Scientifique G.Besse 30035 Nimes
{Baptiste.Magnier,Philippe.Montesinos,Daniel.Diep}@mines-ales.fr
Abstract. In this paper, we propose a synthesis of our work since the
year of 2010. Indeed, we have developed a rotating half smoothing deriva-
tive filter allowing to detect edges based on anisotropic Gaussian kernels.
This new approach has been compared to others method and performs in
noisy textured images. We have also compute en new roof edge detector
by the difference of these two Gaussian filters but not derived (DoG).
This method extracts crest and valley lines even in noisy cases and per-
ceptual curves. One of these smoothing filters is also used to calculate
two directions used in a new texture diffusion scheme in images.
Key words: Contours, roof edges, directional half Gaussian filters, re-
cursive filter, anisotropic difference of Gaussian, anisotropic diffusion.
1 Fast Anisotropic Edge Detection using Half Kernels
Edges detection methods differ in the types of smoothing filters that are applied,they also differ in the types of filters used for computing gradient estimates [3][16] [6]. In most cases, commonly used edge detectors [3] [16] do not lead directlyto object edges, then contours must be searched among numerous edge points.Furthermore, crossing edges and corners are not well detected with the methodsof [3] and [16]. Indeed, the filtered value is greater near the corner as on thecorner itself. Authors of [5] introduced steerable filters which can be tuned to aspecific orientation by making a linear combination of isotropic filters [3] [4].
Edge detection techniques using anisotropic Gaussian filtering have been in-troduced in [14] and fast implemented in [6]. These approaches are able to cor-rectly detect large linear structures. For anisotropic filtering methods [6], therobustness against noise depends strongly on the two smoothing parameters ofthe filter (λ, µ). If these parameters increase, the detection is less sensitive tonoise, but small structures are considered as noise. Consequently, the precision ofthe detected edge points decreases strongly at corners points and for non straightobject contour parts. In [7] is developed a new fast recursive [4] anisotropic edgedetection method able to detect crossing edges and corners due to two elongatedand oriented filters in two different directions (Fig. 1). Consequently, we proposea new edge operator enabling very precise detection of edge points involved inlarge structures (Fig. 2). This detector has been tested successfully on variousimage types1 presenting difficult problems for classical edge detection methods.1 www.lgi2p.ema.fr/~montesin/Demos/perceptualedgedetection.html
Page 61

!
"#$%&'()&*+,-&.)$%
/(.-,01
**)2&+3
45 6!
!
"
#
7 6
!
First X!derivative
!20 !10 0 10 20
!10
!5
0
5
10
15
20
25
30
!
!
!
!
!
! "
"
"
"
"
"
!"#$%&
'
(!)!
"*
+
+ *
*++
,
!
!
!
)
('
,"#$%&
Fig. 1. Rotating filter. Left to right: Edge operator (derivation filter on X and halfsmoothing filter on Y with µ and λ the two standard-deviations of the Gaussian filter).Discretized filter, µ = 10 and λ = 1. Rotated filters with an angle of ∆θ. Computationof direction η(x, y) from θ1 and θ2, the two directions of an edge from a pixel P. Edgesare extracted by computing local maxima of the gradient in the direction η(x, y). HalfAnisotropic Gaussian kernels at linear portions of contours and at corners.
Original Canny [3] Shen [16] Anisotropic [6] Our result [7]
Fig. 2. Result on a color image 321×165. Anisotropic results: µ = 10, λ = 1.
2 Roof Edge Detection using Difference of Rotating Half
Smoothing Filters (DRF)
Roof edges are attached but not limited to roads in aerial images or blood vessels
in medical images. Based on the difference of rotating Gaussian semi filters, we
propose a new ridge/valley detection method in images [8]. The novelty of this
approach resides in the mixing of ideas coming both from directional filters and
difference of Gaussian (DoG) method (Fig. 3). Applying by convolution the
DRF filter to each pixel of an image, we obtain for each pixel a signal which
corresponds to a 360/∆θ scan in all directions. Our idea is then to characterize
pixels which belong to a roof edge, and thus to build our detector.
On a typical valley, the pixel signal at the minimum of a valley contains at
least two negative sharp peaks. For ridges, the pixel signal at the maximum of a
ridge contains at least two positive peaks. These sharp peaks correspond to the
two directions θM1 and θM2 of the curve (an entering and leaving path). In case
of a junction, the number of peaks corresponds to the number of crest lines in
the junction. We obtain the same information for bended lines.
!
"
#
$
%&&
# $'
!"#$%$&'
()*%+#,'&-.
! "# "! $# $! %#
!
"#
"!
$#
$!
%#
%!
&#
!'(#
! "# "! $# $! %# %!
!
"#
"!
$#
$!
%#
%!
&#
)
)
*
*
Anisotropic DoG
!20 !10 0 10 20!10
!5
0
5
10
15
20
25
30 Y
X
!
"!"#$%$&'
(
!
!
Fig. 3. DRF filter descriptions. Left to right: DRF schema, DRF in the thin netdirections, two discretized filters with top: µ = 10 and λ = 1 and bottom: λ = 1.5, adiscretized DRF and computation of η(x, y) from θM1 and θM2 for the local maxima.
Page 62

(a) Original image (b) Result of [19] (c) Result of [2] (d) Our result [8]
Fig. 4. Ridge detection (roads) on a satellite image (277 × 331).
We obtain a new ridge/valley anisotropic DoG detector enabling very precisedetection of ridge/valley points. Moreover, this detector performs correctly atcrest lines even if highly bended, and is precise on junctions. This detector hasbeen tested successfully on various image types2 (see Fig. 4) presenting difficultproblems for classical ridges/valleys detection methods [19] [2]. We have extendthis method to perceptual curves [9] and roof edge junctions detection [10].
3 New Anisotropic Scheme for Texture Suppression
Applying a smoothing rotating filter (Fig. 3 middle) and making a 360 scanprovides to each pixel a characterizing signal s(θ) enables to classify a pixel as atexture pixel, a homogenous region pixel or an edge pixel [11]. Then, we introducea new method for anisotropic diffusion which controls accurately the diffusion intwo directions of edge or corner points and diffuses isotropically inside texturedregions. These two directions corresponds to the curvature of s(θ). Several resultsapplied on real images and a comparison with other anisotropic diffusion methods[13] [15] [1] [18] [17] show that our model is able to remove the texture and controlthe diffusion (Fig. 5). We have enhanced this method for color images [12] andwe are improving this approach to image restoration.
References1. Alvarez, L., Lions, P.-L., Morel, J.-M.: Image Selective Smoothing and Edge Detec-
tion by Nonlinear Diffusion, ii. In SIAM, 29(3), pp. 845–866. (1992)2. Armande, N., Montesinos, P., Monga, O.: Thin Nets Extraction using a Multi-Scale
Approach. In: Scale-Space Theory in Computer Vision, pp. 361–364. (1997)3. Canny, J. F.: A Computational Approach to Edge Detection. In: IEEE Trans. Pat-
tern Anal. Machine Intell., 8(6), 679–698, (1986)4. Deriche, R.: Recursively Implementing the Gaussian and its Derivatives. In ICIP. A
longer version is INRIA Research Report RR-1893, pp. 263–267, 1992.5. Freeman, W. T. and Adelson, E. H.: The Design and Use of Steerable Filters. In
IEEE Trans. Pattern Anal. Machine Intell., 13, pp. 891–906. (1991)6. Geusebroek, J., Smeulders, A., Van De Weijer, J.: Fast Anisotropic Gauss Filtering.
In: 7th European Conference on Computer Vision, pp. 99–112. Springer (2002)7. Montesinos, P., Magnier, B.: A New Perceptual Edge Detector in Color Images. In:
ACIVS, pp 203–220, Sydney. (2010)
2 www.lgi2p.ema.fr/~magnier/Demos/DRFresults/
Page 63

Fig. 5. Comparison of several diffusion methods for texture removal. Left to right andtop to bottom. Original, Nagao [13], Mean Curvature Motion, Weickert [18], Perona[15], Alvarez [1], Tschumperle [17], our result [11]. Evaluation with edge detection [3]:original, Alvarez, Tschumperle and our result.
8. Magnier, B., Montesinos, P., Diep, D.: Ridges and Valleys Detection in Images usingDifference of Rotating Half Smoothing Filters. In ACIVS, Ghent. (2011)
9. Magnier, B., Montesinos, P., Diep, D.: Perceptual Curve Extraction. In The 10thIEEE IVMSP, pp 93–98 Ithaca, USA. (2011)
10. Magnier, B., Diep, D., Montesinos, P.: Ridge and Valley Junctions Extraction. InIPCV’11, Las Vegas. (2011)
11. Magnier, B., Montesinos, P., Diep, D.: Texture Removal by Pixel Classificationusing a Rotating Filter. In: IEEE 36th ICASSP, pp. 1097–1100, Prague. (2011)
12. Magnier, B., Montesinos, P., Diep, D:. Texture Removal in Color Images byAnisotropic Diffusion. In VISAPP 2011, pp. 40–50, Algarve. (2011)
13. Nagao M. and Matsuyama T.: Edge Preserving Smoothing. In CGIP, vol. 9, pp.394–407. (1979)
14. Perona,P.: Steerable-Scalable Kernels for Edge Detection and Junction Analysis.In IMAVIS, 10(10), pp. 663–672. (1992)
15. Perona, P. and Malik, J.: Scale-Space and Edge Detection using Anisotropic Dif-fusion. In Trans. on Pat. Rec. and Machine Intelligence, 12, pp. 629–639. (1990)
16. Shen, J. and Castan, S.: An optimal linear operator for step edge detection. InCVGIP, 54(2), pp. 112–133. (1992)
17. Tschumperle, D.: Fast Anisotropic Smoothing of Multi-Valued Images usingCurvature-Preserving PDEs, IJCV, 68(1), pp. 65–82. (2006)
18. Weickert, J.: Coherence-Enhancing Diffusion. In IJCV 31(2/3), pp 111–127 (1999)19. Ziou, D.: Line Detection using an Optimal IIR Filter. Pattern Recognition, 24(6),
pp 465–478 (1991)
Page 64

Page 65

Contribution au développement de l’interopérabilité en entreprise : versune approche anticipative de détection de problèmes d’interopérabilité
dans des processus collaboratifs
Sihem MALLEK
Directeur de thèse : V. CHAPURLAT, Professeur – LGI2P, École des Mines d’Alès
Encadrant : N. DACLIN, Ingénieur de Recherche – LGI2P, École des Mines d’Alès
Rapporteurs : D.CHEN, Professeur – IMS Bordeaux 1
J.-P.BOUREY, Professeur – Centrale Lille
Examinateurs : M. PETIT, Professeur – Université de Namur, Belgique
D. CRESTANI, Professeur – Université de Montpellier 2
C. BRAESCH, Professeur – Université de Savoie
Date de soutenance prévisionnelle : 13 Octobre 2011
Résumé : L’interopérabilité revêt un enjeu majeur pour l’industrie et son absence peut êtrevue comme un des principaux freins à un travail collaboratif, et plus particulièrement dans lesprocessus collaboratifs aussi bien publics (inter-entreprises) que privé (intra-entreprise). Ilparait donc pertinent d’analyser et de détecter d’éventuels manques ou défautsd’interopérabilité dans des entreprises impliquées dans un processus collaboratif. Les recher-ches en interopérabilité ont montré l’intérêt de mesurer et d’évaluer l’interopérabilité avec laproposition de cadres et de modèles de maturité dans le but d’éviter d’éventuels problèmesd’interopérabilité. Cependant, des approches de détection et d’anticipation de problèmesd’interopérabilité n’existent pas à notre connaissance. Les travaux de recherche proposés danscette thèse se développent dans un contexte d’ingénierie de processus guidée par les modèleset se proposent d’utiliser des techniques de vérification formelle pour détecter différents typesde problèmes ou de présomption de problèmes d’interopérabilité. Ceci implique, dans unpremier temps, de définir les besoins particuliers en interopérabilité devant être pris encompte dans un contexte collaboratif. Dans un second temps, il est nécessaire de formaliserces besoins en un ensemble d’exigences d’interopérabilité, de manière aussi formelle que pos-sible. Ceci a abouti à quatre classes d’exigences d’interopérabilité respectant le cycle de vied’un processus collaboratif : les exigences de compatibilité, les exigences d’interopération, les
Page 66
exigences d’autonomie et les exigences de réversibilité. Enfin, ces exigences doivent être vé-rifiées en se référant aux modèles du ou des processus étudiés.
Mots clés : interopérabilité, exigences d’interopérabilité, compatibilité, interopération, auto-nomie, réversibilité, vérification, processus collaboratif.
Abstract : Interoperability is becoming a crucial issue for industry and a lack of interoper-ability can be seen as an important barrier to a collaborative work, particularly on collabora-tive process both public (inter-enterprise) and private (intra-enterprise). Indeed, interoperabil-ity characterises the ability of any enterprises to interact within a collaborative process. Priorto any effective collaboration, it is necessary to inform enterprises that aim to work together,if they are able to interoperate. Researches in interoperability have shown the benefits ofhaving a measurement and an evaluation of interoperability by the proposition of severalframeworks and maturity models. However, approaches to detect and anticipate interoper-ability problems do not exist as we know. The research works proposed in this thesis are de-veloped in a context of process engineering-driven models and propose to use formal verifi-cation techniques to detect different types of problems or suspected problems of interoperabi-lity. On the one hand, this induces to be able to define the particular needs of interoperabilityto consider. On the other hand, it requires to formalise these needs as a set of unambiguousand, as formal as possible, requirements. Four classes of interoperability requirements aredefined: compatibility requirements, interoperation requirements, autonomy requirements andreversibility requirements. Finally, interoperability requirements must be checked thanks totarget process model.
Keywords: interoperability, interoperability requirements, compatibility, interoperation,autonomy, reversibility, verification, collaborative process.
Page 67