advancing new research in water innovation for the · pdf file ·...
TRANSCRIPT

ww
w.in
l.g
ov
Advancing New Research in Water Innovation for the Future at INL
Aaron D. Wilson, Christopher J. Orme, Michael G. Jones, Catherine M. Hrbac, Birendra Adhikari, Daniel S. Wendt, and Gregory L. Mines
November 17h, 2015
Water Efficiency in Downstream Refinery, Petrochemical and Chemical processing Workshop
AIChE
INL/MIS-xxxxxxx

INL Water Technology and Science
• Translational technology research
– 30 year history in chemical (membrane) separations
– Emergent and disruptive new technology
– Bridging the gap between TRL 2 and TRL 6
• Aquifer level modeling
– Surface water, ground water, and energy
– History in CCS, geothermal energy, and hydraulic fracturing
2
• National security research Water Security Test Bed
– Simulating a municipal water system at scale with real materials
– Developed with the EPA

DOE’s Interest in the Energy Water-Nexus

Summary of meeting
• Meeting report was promised.
• DOE is currently seeking feedback and input from industry; Formal RFI expected.
• Large Hub or multiple large projects are anticipated
• Call(s) to be funded 2/3 out of EERE (AMO and Solar) and 1/3 FE
• Desalination not limited to seawater, includes
– Brackish water
– Municipal reuse
– Industrial reuse
– Oil and Gas water
• Push to move away from looking at core desalination energy cost to include total process cost:
– Pretreatment
– Brine Disposal
• Pipe parity mentioned multiple times as the target.

Impact of Water on Energy Generation
5 Water-Smart Power (2013) Union of Concerned Scientists. Select events 2006-2012

State of the Art Publications in FO/PRO
*Topic “forward osmosis” or “pressure retarded osmosis”
in Web of Science
0
40
80
120
160
200
Nu
mb
er
of
Pu
bli
ca
tio
ns
*
Year

State of the Art: Forward Osmosis Introduction
• Forward osmosis membrane flux spontaneous (No energy input)
• Primary process energy requirements delivered during draw solute recovery,
which can include:
• Reverse Osmosis,
• Various Distillation including Membrane Distillation, and
• Thermal solute separation such as thermolytic solutes (Switchable
Polarity Solvents).
Brine
Saline
Water
Membrane
Dilute
draw
solution
Draw
solute
recovery
Product
Water
Concentrated
draw solution
Energy input
(deus ex machina)

Tertiary Amine Switchable Polarity Solvents
• High concentration in polar form.
• Can be mechanically separated once switched to non-polar form.
1-cyclohexylpiperidine
• 2nd Generation SPS Draw Solute.
• Identified with Quantitative Structural Activity Relationship (QSAR) model.
• Material balances non-orthogonal (interdependent) draw solute properties.
1-cyclohexylpiperidenium bicarbonate
• Maximum concentrations over 70 wt%.
• Has an osmotic pressure over 500 atm which should extract water from a fully saturated brine solution (6.14 mol/Kg ~370 atm), precipitating NaCl solid.
8
Orme, Wilson, 1-Cyclohexylpiperidine as a Thermolytic Draw Solute for Engineered Osmosis. Desalination 2015. 371, 126-133
McNally, Wilson Density Functional Theory Analysis of Steric Impacts on Switchable Polarity Solvent (SPS) Journal of Chemical Physics B 2015, 119, 6766-6775.
Wilson, Orme Concentration Dependent Speciation and Mass Transport Properties of Switchable Polarity Solvents RCS Advances 2015, 5, 7740-7751
Wilson, A. D.*; Stewart, F. F. Structure-Function Study of Tertiary Amines as Switchable Polarity Solvents RCS Advances 2014, 4, 11039-11049.

Tertiary Amine Switchable Polarity Solvents
• High concentration in polar form.
• Can be mechanically separated once switched to non-polar form.
9
Organic DMCHA
+ H2O + CO2
Aqueous DMCHAH-HCO3
- H2O - CO2
CO2
Sparging
CO2
Stripping
HCO3-

Proposed Switchable Polarity Solvents Forward Osmosis System
10
Thermally driven process with the majority of energy
input at the CO2 degasser
Stone; Rae; Stewart; Wilson
Switchable Polarity Solvents as
Draw Solutes for Forward Osmosis
Desalination 2013, 312,124-129.
Wilson; Stewart; Stone Methods and Systems for Treating
Liquids Using Switchable Solvents. US20130048561 A1.
Wilson; Stewart; Stone Methods and Systems for Treating
Liquids Using Switchable Solvents. WO2013032742 A1.

High Salinity, High Fouling, High Recovery
• Pre-treatment can be the bulk of the water treatment cost.
• Disposal of the waste brine can be the bulk of the water treatment cost.
• State of the art methods are reaching thermodynamic limits but the cost is still too high.
• FO requires little to no pre-treatment.
• High recover even from high salinity feeds.
• Thermally driven processes uses lower cost energy than electrically driven processes.
11
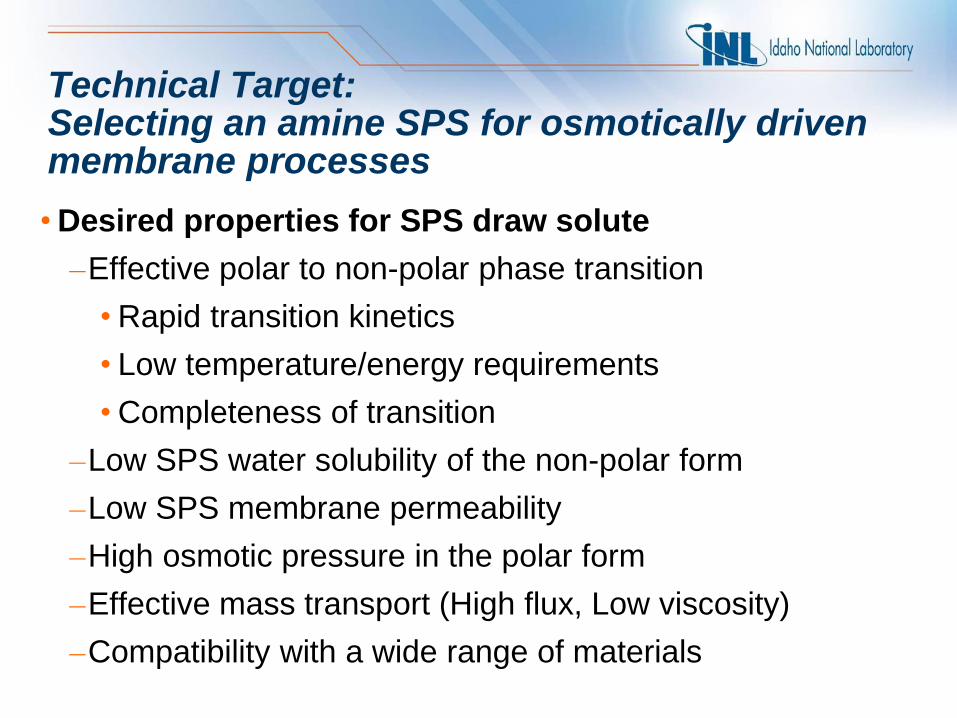
Technical Target: Selecting an amine SPS for osmotically driven membrane processes
• Desired properties for SPS draw solute
–Effective polar to non-polar phase transition
• Rapid transition kinetics
• Low temperature/energy requirements
• Completeness of transition
–Low SPS water solubility of the non-polar form
–Low SPS membrane permeability
–High osmotic pressure in the polar form
–Effective mass transport (High flux, Low viscosity)
–Compatibility with a wide range of materials

Proof of concept SPS Draw Solute
13
Jw
(Water Flux)
Js
(Reverse Solute Flux)
, c
(Osmotic density
and cost)
V/VHI or KV
(Carrying Capacity)
HI
(Maximum Available
Osmotic Pressure)
Π/T
(Entropic Sensitivity)
SPO
(Minimum Stimuli-Driven
Osmotic Concentration)
Molecular Mass Low High
Material/Membrane
Compatibility
Orme; Wilson 1-Cyclohexylpiperidine as a Thermolytic Draw Solute for
Osmotically Driven Membrane Processes. Desalination 2015, 371, 126–133.
???

Equilibrium “Maximum” Concentration of the SPS Polar Form
• SPS Function can be defined as the ratio between the ammine/ammonium solution concentration in the presence and absence of CO2.
• The physical/molecular drivers for high concentrations is what is in most need of elucidation.
Ambient pressure
and temperature

SPS Active
SPS Inactive
Amines Tested in SPS Function Study
• No simple correlation between structure and function.
15
Wilson; Stewart Structure–function Study of
Tertiary Amines as Switchable Polarity
Solvents. RSC Adv. 2014, 4 (22), 11039–11049.

y = -0.618 x + 7.865 R² = 0.999
0.0
0.5
1.0
1.5
2.0
2.5
3.0
3.5
4.0
4.5
5.0
5 6 7 8 9 10 11 12 13 14
mola
r
Carbon:Nitrogen Ratio
NR3 molar
H2CO3 molar
Equilibrium Concentration of SPS Polar Form
dimethyl-n-alkylamines

Equilibrium Concentration of SPS Polar Form
0.0
0.5
1.0
1.5
2.0
2.5
3.0
3.5
4.0
4.5
5.0
5 6 7 8 9 10 11 12 13 14
mola
r
Carbon:Nitrogen Ratio
NR3 molar
H2CO3 molar
amines with ancillary
carbon functionality

Equilibrium Concentration of SPS Polar Form
amines with ring systems
0.0
0.5
1.0
1.5
2.0
2.5
3.0
3.5
4.0
4.5
5.0
5 6 7 8 9 10 11 12 13 14
mo
lar
Carbon:Nitrogen Ratio
NR3 molar
H2CO3 molar

y = 0.987x - 0.056 R² = 0.961
0.0
1.0
2.0
3.0
4.0
5.0
0.0 1.0 2.0 3.0 4.0 5.0C
alc
ula
ted
(M
) Observed (M)
The correlation between the observed
maximum molarity of SPS and those
calculated from equation.
Predicating the Equilibrium Concentration of SPS Polar Form with QSAR
• Our QSAR model predicts the SPS performance of tertiary amines.
𝑆𝑃𝑆 𝐻2𝐶𝑂3 (𝑀) = 7.87 − 0.62( Carbon) − 0.55𝛽 − 1.1𝛾 − 0.5𝛿 + 1.2(𝛼 𝑟𝑖𝑛𝑔)
Wilson*; Stewart Structure-Function Study of Tertiary Amines as
Switchable Polarity Solvents RSC Advances 2014, 4, 11039-11049.
19

0
100
200
300
400
500
600
700
800
900
5 6 7 8 9 10 11 12
Os
mo
tic
Pre
ss
ure
Carbon:Nitrogen Ratio
Gen 1
Projected Osmotic Pressures of Equilibrium Concentrations
Osmotic Pressure of
Saturated NaCl Brine
Gen 2
20 Wilson; Stewart Structure–function Study of
Tertiary Amines as Switchable Polarity Solvents.
RSC Adv. 2014, 4 (22), 11039–11049.

Advantages of 2nd Generation SPS Draw
21
Jw
(Water Flux)
Js
(Reverse Solute Flux)
, c
(Osmotic density
and cost)
V/VHI or KV
(Carrying Capacity)
HI
(Maximum Available
Osmotic Pressure)
Π/T
(Entropic Sensitivity)
SPO
(Minimum Stimuli-Driven
Osmotic Concentration)
Molecular Mass Low High
Material/Membrane
Compatibility
Orme; Wilson 1-Cyclohexylpiperidine as a Thermolytic Draw Solute for
Osmotically Driven Membrane Processes. Desalination 2015, 371, 126–133.

Degassing Experiments
• Un-optimized conditions intended for rough temperature sensitivity comparison between amines.
• N,N-Dimethylcyclohexylamines (DMCA) requires 95 C to achieve a good degassing and phase separation at ambient atmospheric pressures.
• Gen 2 can be degassed at 70 C under ambient atmospheric pressures or less with limited amount of vacuum.
0
0.5
1
1.5
2
2.5
3
0 500 1,000 1,500 2,000
Osm
ola
lity
(O
sm
/Kg
)
Time (min)
70 °C DMCHA
80 °C DMCHA
95 °C DMCHA
70 °C CHP
80 °C CHP
Orme; Wilson 1-Cyclohexylpiperidine as a Thermolytic Draw Solute for
Osmotically Driven Membrane Processes. Desalination 2015, 371, 126–133. CHP = 1-Cyclohexylpiperidine

0
2
4
6
8
10
12
0 1 2 3 4 5 6
Wat
er
Flu
x (k
g/m
2h
r)
CHP Concentration ( mol/kg )
DI Water 0.5 mol/Kg NaCl
1 mol/Kg NaCl
Porifera (2014)
FO mode
Feed: DI water
~25 ⁰C
CHP flux over a range of concentration feeds
• FO flux tests against DI water can have limited implications on FO performance against a feed with real world osmotic pressures. Thus tests against 0.5 and 1.0 mol/Kg NaCl feed solutions.
• There is a modest flux attenuation for CHP vs DMCHA attributed to a shift is rheological properties associated with moving from a 8 to an 11 carbon amine.
Christopher Orme

Long term membrane performance with CHP
• Demonstrates compatibility between amine and membrane.
• Results are consistent with previous initial flux study with DMCHA and CTA membranes once membrane orientation/specifications and draw solution concentrations influences are considered.
24
2
2.5
3
3.5
4
4.5
5
5.5
6
6.5
7
0 1 2 3 4 5
Wate
r F
lux (
kg
/m2h
r)
Run Time (hr)
1st 4 hrs
(hrs : 1 to 4)
last 4 hrs
(hrs : 28 to 32 )
(~2 mol/Kg SPS )
(~3 mol/Kg SPS) Porifera (2014)
FO mode
Feed: DI water
Draw: Initial 3 mol/Kg CHP
~25 ⁰C

0.0
1.0
2.0
3.0
4.0
5.0
6.0
0 40 80 120 160 200 240 280 320 360
Rela
tive E
nerg
y (
kcal)
Relative Dihedral Angle (degrees)
DFT Potential Energy Surface (PES) Scan
• A potential energy surface scan of the C1-N1-C7-H dihedral angle allowed for a ‘conformational analysis’ associated with the complete rotation along the N1-C7 bond.

0
2
4
6
8
10
12
0 100 200 300
Re
lati
ve E
ne
rgy
(kca
l)
Degrees
2a
3a
4a
2b
3b
3ad
4ad
3bd
DFT Potential Energy Surface (PES) Scan with R-group rotation for model compounds
• Work conducted by post doc Josh McNally now a full time employee.
• -bond barrier of rotation for interactions with amine substituent.
• -bond barrier of rotation direct interactions with the bicarbonate ion through a pseudo-six membered interaction.
2a
3a
4a
2b
3b
3aβ
4aβ
3bβ
α-bond rotation
Interaction with N-Me α-bond rotation
Limited interaction
with bicarbonate
β-bond rotation
Interaction with
bicarbonate
McNally; Noll; Orme; Wilson Density
Functional Theory Analysis of the Impact
of Steric Interaction on the Function of
Switchable Polarity Solvents. J. Phys.
Chem. B 2015, 119 (22), 6766–6775.

System Design and Testing
27
Initial scale
(2011)
Lab scale (2014)
10 gallon per hour pilot system
(2015)

ASPEN Evidence for SPS FO cost competitiveness
• Rough ASPEN techno-economic analysis estimated small scale (480 m3/day) SPS FO cost between 1.7 to 2.6 USD/m3 which is competitive with injection which ranges from 1.9 to 63 USD/m3.
28
Wendt, D. S.; Orme, C. J.; Mines, G. L.; Wilson, A. D.* Energy requirements of the switchable polarity solvent forward osmosis (SPS-FO) water
purification process. Desalination 2015, 374, 81-91, DOI:10.1016/j.desal.2015.07.012

High Salinity, High Fouling, High Recovery
• Pre-treatment can be the bulk of the water treatment cost.
• Disposal of the waste brine can be the bulk of the water treatment cost.
• State of the art methods are reaching thermodynamic limits but the cost is still too high.
• FO requires little to no pre-treatment.
• High recover even from high salinity feeds.
• Thermally driven processes uses lower cost energy than electrically driven processes.
29

Funding
30
• DOE Energy Efficiency and Renewable Energy (EERE) Geothermal Technology Office (GTO)
• DOE Office of Science - Small Business Innovation Research (SBIR) Program
• DOE Office of Fossil Energy (FE) -National Energy Technology Laboratory (NETL) Novel Crosscutting Research and Development to Support Advanced Energy Systems
• Battelle Energy Alliance (INL)
• LDRD
• Royalty Fund
Acknowledgements
• Frederick F. Stewart
• Mark L. Stone
• Christopher J. Orme
• Michael G. Jones
• Joshua S. McNally
• Catherine M. Hrbac
• Birendra Adhikari
• Daniel S. Wendt
• Gregory L. Mines
• Jeffrey R. McCutcheon
• Kevin K. Reimund
INL Team
UConn Team


0
2
4
6
8
10
12
14
16
18
20
0 50 100 150 200 250
Wa
ter
Flu
x (
kg
/m2h
r )
Time min
1st Run, Sample HB 14-16, 2 m NaCl
2nd Run, Sample HB 14-16, 2 m NaCl
3rd Run, Sample HB 14-16, 2 m NaCl
Sample LS, 2 m NaCl
Cattle Waste, 2 m NaCl
Cattle Waste, SPS CHP
Scoping Study for FO Treatment of Dairy Waters
• HB ~1,070 mOsm/Kg similar to seawater
• LS ~303 mOsm/Kg similar to mid-range brackish water or plasma
– Contained biofilms when delivered.
– HB may have avoided biological activity due to its salinity
• Manure Water ~68 mOsm/Kg
– ~50% of the water removed in both tests.
32
Porifera (2014)
FO mode
~21 ⁰C

SPS draw vs. Cattle Waste Water
• The redline indicates equilibrated flux for an SPS draw against a DI water feed.
• The high concentration cattle waste water data likely represents pre-equilibration flux conditions.
• The parallel trend suggests that cattle water sample isn’t fouling but approaching an equilibrated polarized flux.
33
0.0
5.0
10.0
15.0
20.0
25.0
3.03.54.04.55.05.5
Wate
r F
lux (
kg
/m2h
r)
CHP (mol/Kg)
Cattle Waste
DI waterPorifera (2014)
FO mode
~21 ⁰C

Proposed Switchable Polarity Solvents Forward Osmosis System
34
Thermally driven process with the majority of energy
input at the CO2 degasser
Stone; Rae.; Stewart.; Wilson* Switchable Polarity
Solvents as Draw Solutes for Forward Osmosis
Desalination 2013, 312,124-129.

0.5
1.0
1.5
2.0
2.5
3.0
5 6 7 8 9 10 11 12 13 14
NR
3:
H2C
O3
Carbon:Nitrogen Ratio
What determines an SPS’s “osmotic” character? Osmotic vs. Non-osmotic SPS
Blue diamonds “osmotic” SPS,
Red Cross “nonosmotic” SPS.
• “Osmotic” SPS function with ~1:1 NR3:H2CO3 ratios which vary little with concentration and behave as salty aqueous solutions.
• “Non-osmotic” SPS with >> 1:1 NR3:H2CO3 ratios which vary with concentration and behave similar to polar organic solvents.
quantitative 13C NMR
spectroscopy

Osmotic vs. Non-osmotic SPS
• The osmotic SPS data appears to contain divergent trends
0.5
1.0
1.5
2.0
2.5
3.0
5 6 7 8 9 10 11 12 13 14
NR
3:
H2C
O3
Carbon:Nitrogen Ratio 0.95
1.00
1.05
1.10
1.15
1.20
1.25
1.30
5 6 7 8 9 10 11 12 13 14
NR
3:
H2C
O3
Carbon:Nitrogen Ratio
quantitative 13C NMR
spectroscopy

Molecular surface charge and the “osmotic” character of SPS
• Hypothesis : The molecular structure of an “osmotic” SPS is predominantly contained within an ionic domain.
• Currently being explored via DFT and MD. 37
Ionic Domain
Organic Domain
Ionic Domain
Osmotic SPS Non-osmotic SPS

0.5
1.0
1.5
2.0
2.5
3.0
0 1 2 3 4 5 6 7
NR
3:
H2C
O3
Carbons > 4 Bonds From Nitrogen
The influence of organic domains on the “osmotic” character of SPS
38
Organic regions likely allows the formation of
micelle and/or organic nanostructures.
quantitative 13C NMR
spectroscopy

Carbon Chain Length vs. Hydrophilicity
• The surface charge of four carbons chains (ionic domain) may define the boarder between water soluble and water insoluble liquid ions.
39 Kohno; Ohno; Temperature-Responsive Ionic Liquid/water Interfaces:
Relation between Hydrophilicity of Ions and Dynamic Phase Change.
Physical Chemistry Chemical Physics 2012, 14 (15), 5063.