aeries analytics™ - advanced analysis of student...
TRANSCRIPT
Aeries Analytics™ - Advanced Analysis of Student Data
Conference 2017
Session 225 - Page 1 Aeries Analytics™ - Advanced Analysis of Student Data
Session Description: This session will delve deeper into how to set up and configure advanced Analytics Items and Dashboards. If you've been using Aeries Analytics and want to learn how to use it more effectively, this session will give you more ideas and techniques to track and improve student achievement.
1. Analytics Overview
2. Indicator Setup Label Layouts Item Definitions Student Sub Groups Summary Data
3. Analytics Dashboards Dashboard Item Configuration Dashboard Configuration Dashboards
4. Update Indicators
Session 225 - Page 2 Aeries Analytics™ - Advanced Analysis of Student Data
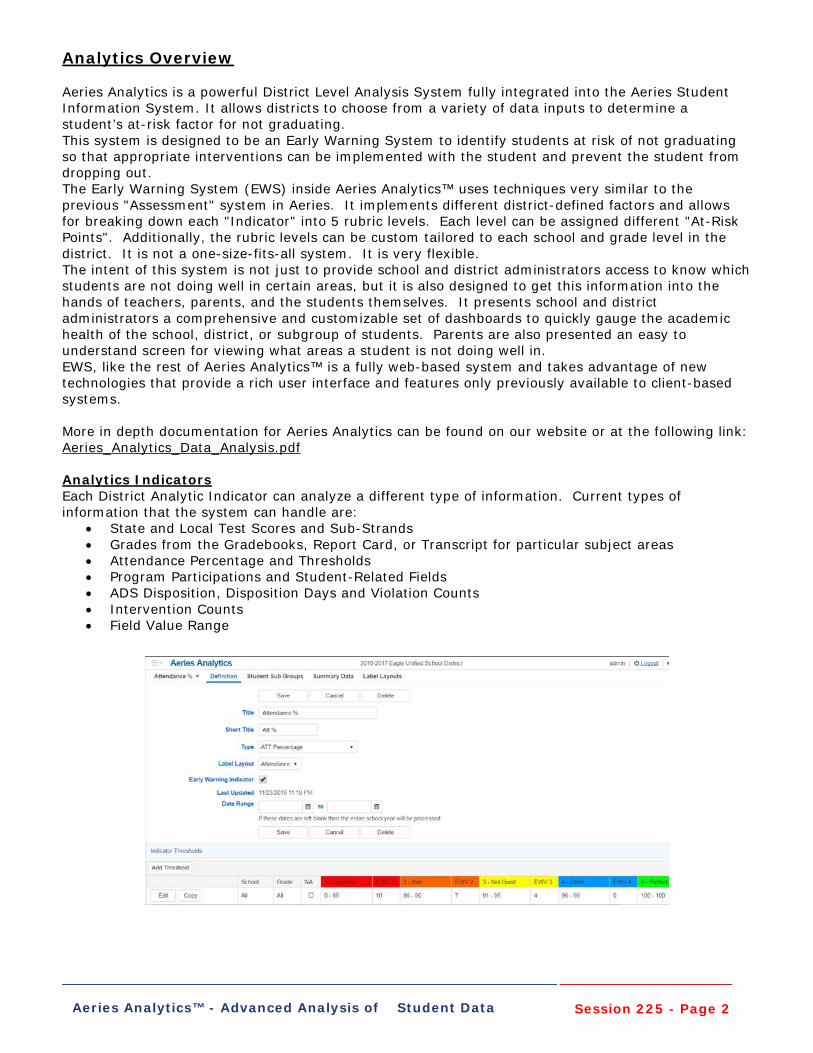
Analytics Overview Aeries Analytics is a powerful District Level Analysis System fully integrated into the Aeries Student Information System. It allows districts to choose from a variety of data inputs to determine a student’s at-risk factor for not graduating. This system is designed to be an Early Warning System to identify students at risk of not graduating so that appropriate interventions can be implemented with the student and prevent the student from dropping out. The Early Warning System (EWS) inside Aeries Analytics™ uses techniques very similar to the previous "Assessment" system in Aeries. It implements different district-defined factors and allows for breaking down each "Indicator" into 5 rubric levels. Each level can be assigned different "At-Risk Points". Additionally, the rubric levels can be custom tailored to each school and grade level in the district. It is not a one-size-fits-all system. It is very flexible. The intent of this system is not just to provide school and district administrators access to know which students are not doing well in certain areas, but it is also designed to get this information into the hands of teachers, parents, and the students themselves. It presents school and district administrators a comprehensive and customizable set of dashboards to quickly gauge the academic health of the school, district, or subgroup of students. Parents are also presented an easy to understand screen for viewing what areas a student is not doing well in. EWS, like the rest of Aeries Analytics™ is a fully web-based system and takes advantage of new technologies that provide a rich user interface and features only previously available to client-based systems. More in depth documentation for Aeries Analytics can be found on our website or at the following link: Aeries_Analytics_Data_Analysis.pdf Analytics Indicators Each District Analytic Indicator can analyze a different type of information. Current types of information that the system can handle are:
• State and Local Test Scores and Sub-Strands • Grades from the Gradebooks, Report Card, or Transcript for particular subject areas • Attendance Percentage and Thresholds • Program Participations and Student-Related Fields • ADS Disposition, Disposition Days and Violation Counts • Intervention Counts • Field Value Range
Session 225 - Page 3 Aeries Analytics™ - Advanced Analysis of Student Data
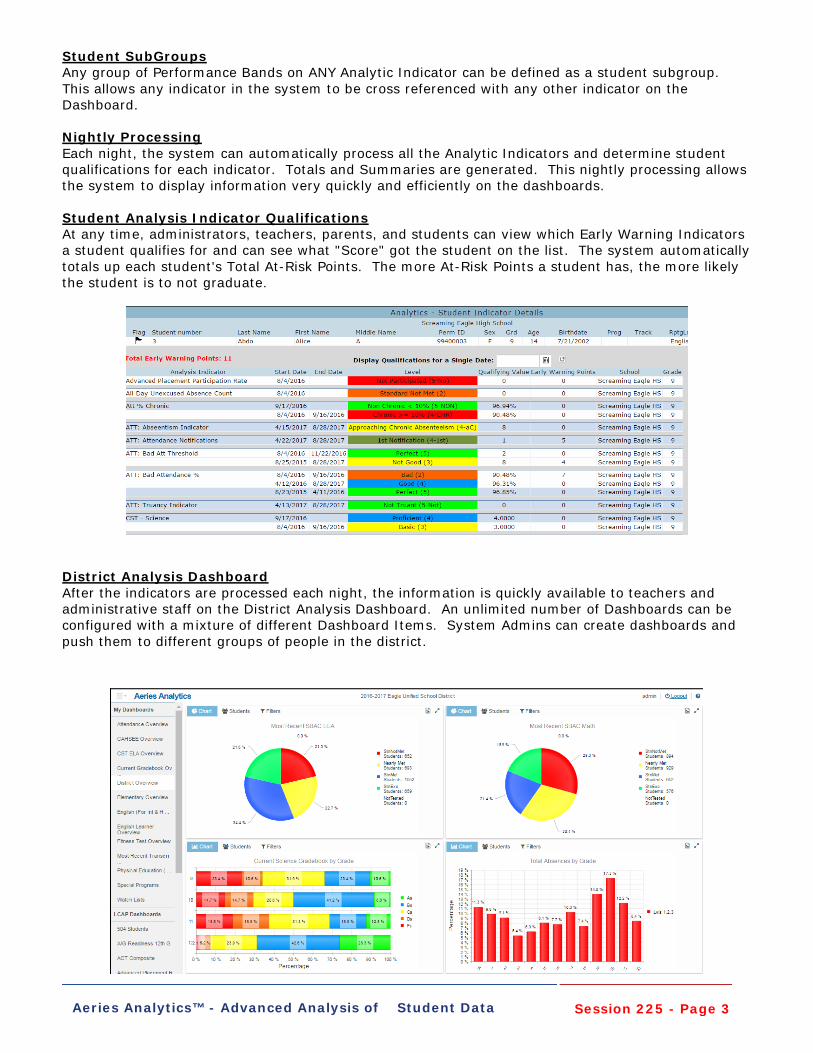
Student SubGroups Any group of Performance Bands on ANY Analytic Indicator can be defined as a student subgroup. This allows any indicator in the system to be cross referenced with any other indicator on the Dashboard. Nightly Processing Each night, the system can automatically process all the Analytic Indicators and determine student qualifications for each indicator. Totals and Summaries are generated. This nightly processing allows the system to display information very quickly and efficiently on the dashboards. Student Analysis Indicator Qualifications At any time, administrators, teachers, parents, and students can view which Early Warning Indicators a student qualifies for and can see what "Score" got the student on the list. The system automatically totals up each student's Total At-Risk Points. The more At-Risk Points a student has, the more likely the student is to not graduate.
District Analysis Dashboard After the indicators are processed each night, the information is quickly available to teachers and administrative staff on the District Analysis Dashboard. An unlimited number of Dashboards can be configured with a mixture of different Dashboard Items. System Admins can create dashboards and push them to different groups of people in the district.
Session 225 - Page 4 Aeries Analytics™ - Advanced Analysis of Student Data
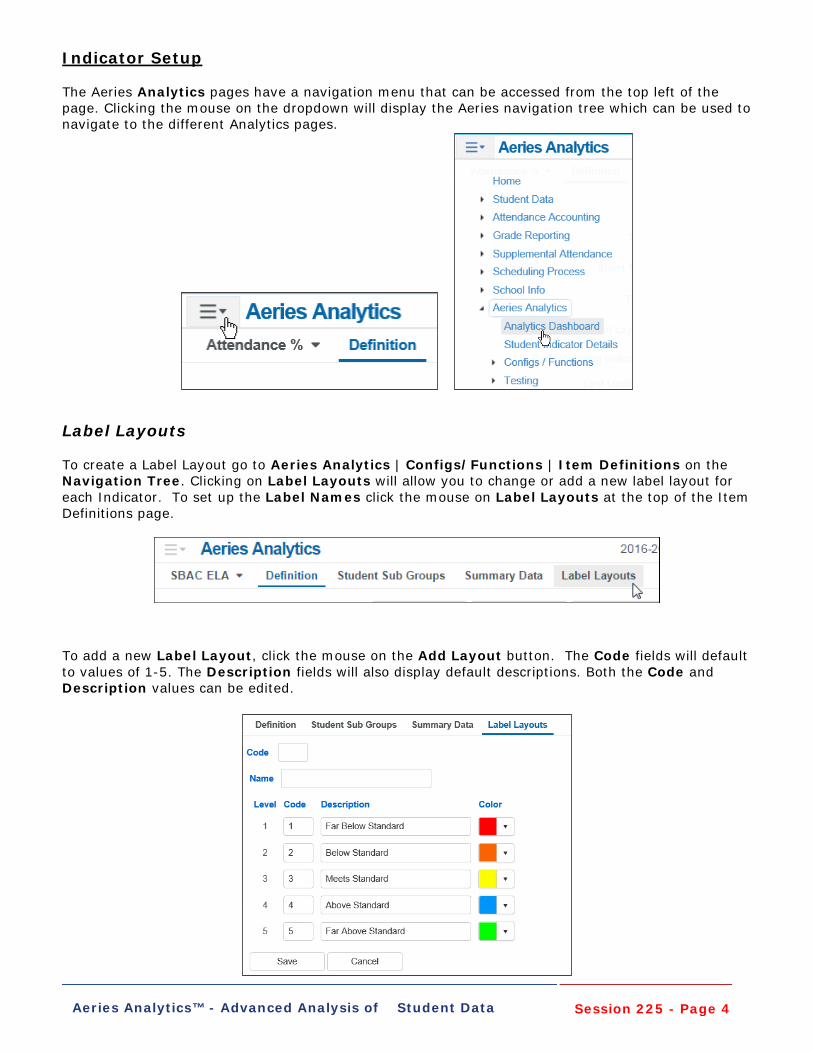
Indicator Setup The Aeries Analytics pages have a navigation menu that can be accessed from the top left of the page. Clicking the mouse on the dropdown will display the Aeries navigation tree which can be used to navigate to the different Analytics pages.
Label Layouts To create a Label Layout go to Aeries Analytics | Configs/Functions | Item Definitions on the Navigation Tree. Clicking on Label Layouts will allow you to change or add a new label layout for each Indicator. To set up the Label Names click the mouse on Label Layouts at the top of the Item Definitions page.
To add a new Label Layout, click the mouse on the Add Layout button. The Code fields will default to values of 1-5. The Description fields will also display default descriptions. Both the Code and Description values can be edited.
Session 225 - Page 5 Aeries Analytics™ - Advanced Analysis of Student Data
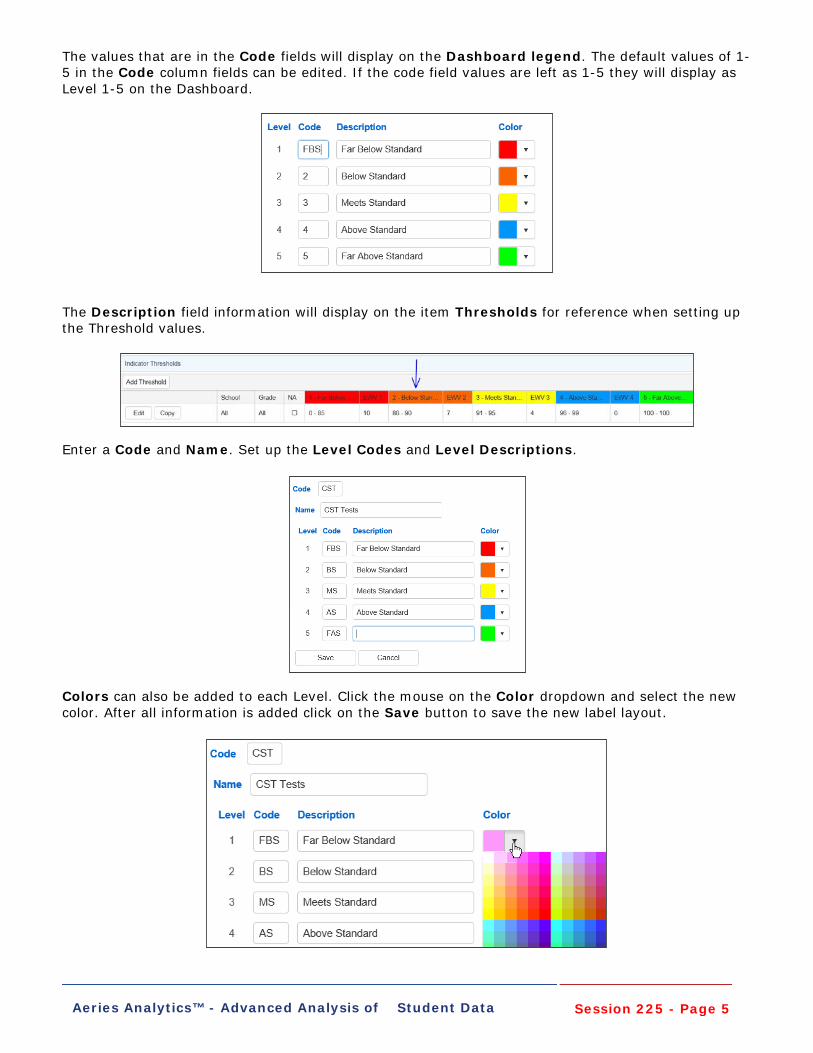
The values that are in the Code fields will display on the Dashboard legend. The default values of 1-5 in the Code column fields can be edited. If the code field values are left as 1-5 they will display as Level 1-5 on the Dashboard.
The Description field information will display on the item Thresholds for reference when setting up the Threshold values.
Enter a Code and Name. Set up the Level Codes and Level Descriptions.
Colors can also be added to each Level. Click the mouse on the Color dropdown and select the new color. After all information is added click on the Save button to save the new label layout.
Session 225 - Page 6 Aeries Analytics™ - Advanced Analysis of Student Data
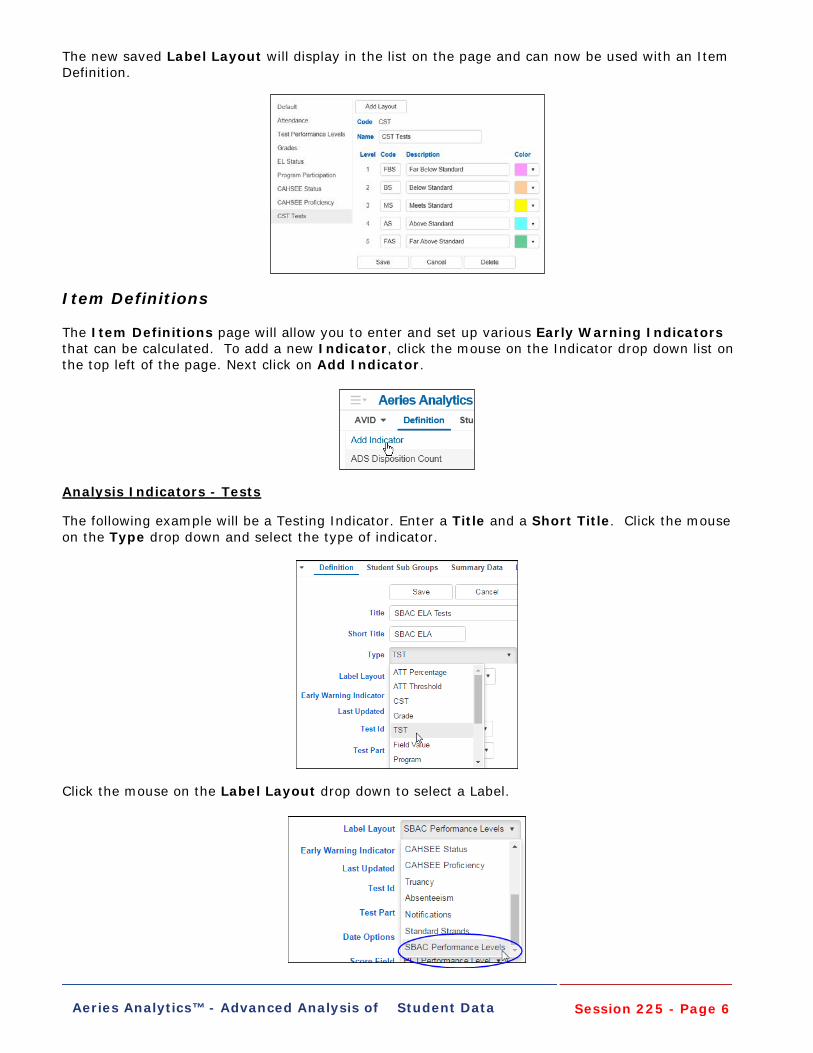
The new saved Label Layout will display in the list on the page and can now be used with an Item Definition.
Item Definitions The Item Definitions page will allow you to enter and set up various Early Warning Indicators that can be calculated. To add a new Indicator, click the mouse on the Indicator drop down list on the top left of the page. Next click on Add Indicator.
Analysis Indicators - Tests The following example will be a Testing Indicator. Enter a Title and a Short Title. Click the mouse on the Type drop down and select the type of indicator.
Click the mouse on the Label Layout drop down to select a Label.
Session 225 - Page 7 Aeries Analytics™ - Advanced Analysis of Student Data
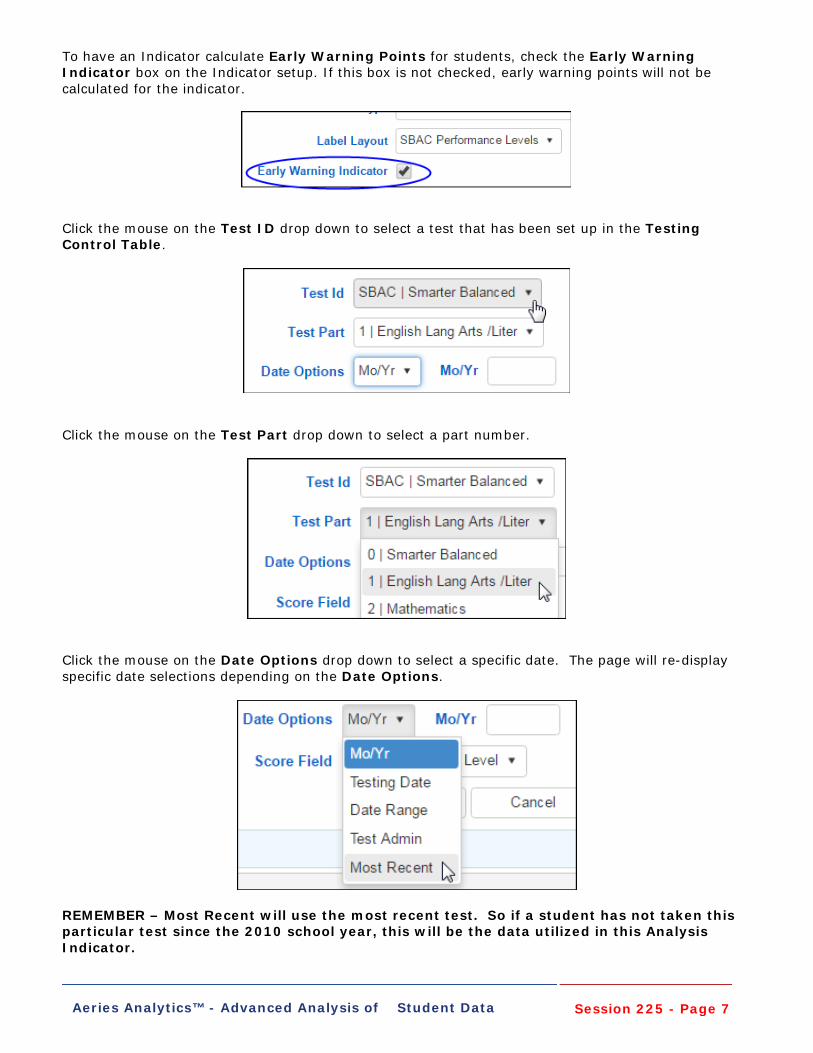
To have an Indicator calculate Early Warning Points for students, check the Early Warning Indicator box on the Indicator setup. If this box is not checked, early warning points will not be calculated for the indicator.
Click the mouse on the Test ID drop down to select a test that has been set up in the Testing Control Table.
Click the mouse on the Test Part drop down to select a part number.
Click the mouse on the Date Options drop down to select a specific date. The page will re-display specific date selections depending on the Date Options.
REMEMBER – Most Recent will use the most recent test. So if a student has not taken this particular test since the 2010 school year, this will be the data utilized in this Analysis Indicator.

Session 225 - Page 8 Aeries Analytics™ - Advanced Analysis of Student Data
Click the mouse on the Score Field drop down to select the score to be used to calculate the Students Performance Level.
Verify that all options selected for the new indicator are correct. Click the mouse on the Save button. The new indicator will display in the selection box on the left side of the page.
An Indicator Thresholds area will display for the new definition.
A default threshold will display on Indicators for School = All and Grade = All. This default Indicator is needed in order for the Process Indicator function to run correctly.
Session 225 - Page 9 Aeries Analytics™ - Advanced Analysis of Student Data
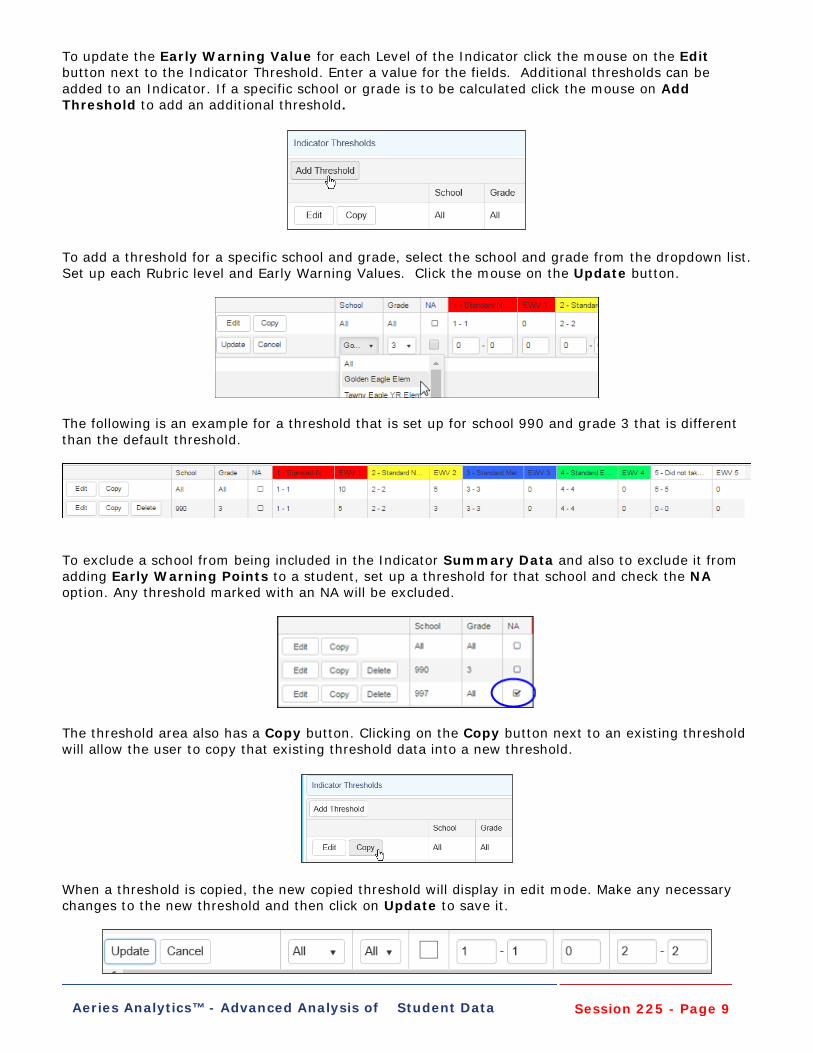
To update the Early Warning Value for each Level of the Indicator click the mouse on the Edit button next to the Indicator Threshold. Enter a value for the fields. Additional thresholds can be added to an Indicator. If a specific school or grade is to be calculated click the mouse on Add Threshold to add an additional threshold.
To add a threshold for a specific school and grade, select the school and grade from the dropdown list. Set up each Rubric level and Early Warning Values. Click the mouse on the Update button.
The following is an example for a threshold that is set up for school 990 and grade 3 that is different than the default threshold.
To exclude a school from being included in the Indicator Summary Data and also to exclude it from adding Early Warning Points to a student, set up a threshold for that school and check the NA option. Any threshold marked with an NA will be excluded.
The threshold area also has a Copy button. Clicking on the Copy button next to an existing threshold will allow the user to copy that existing threshold data into a new threshold.
When a threshold is copied, the new copied threshold will display in edit mode. Make any necessary changes to the new threshold and then click on Update to save it.
Session 225 - Page 10 Aeries Analytics™ - Advanced Analysis of Student Data
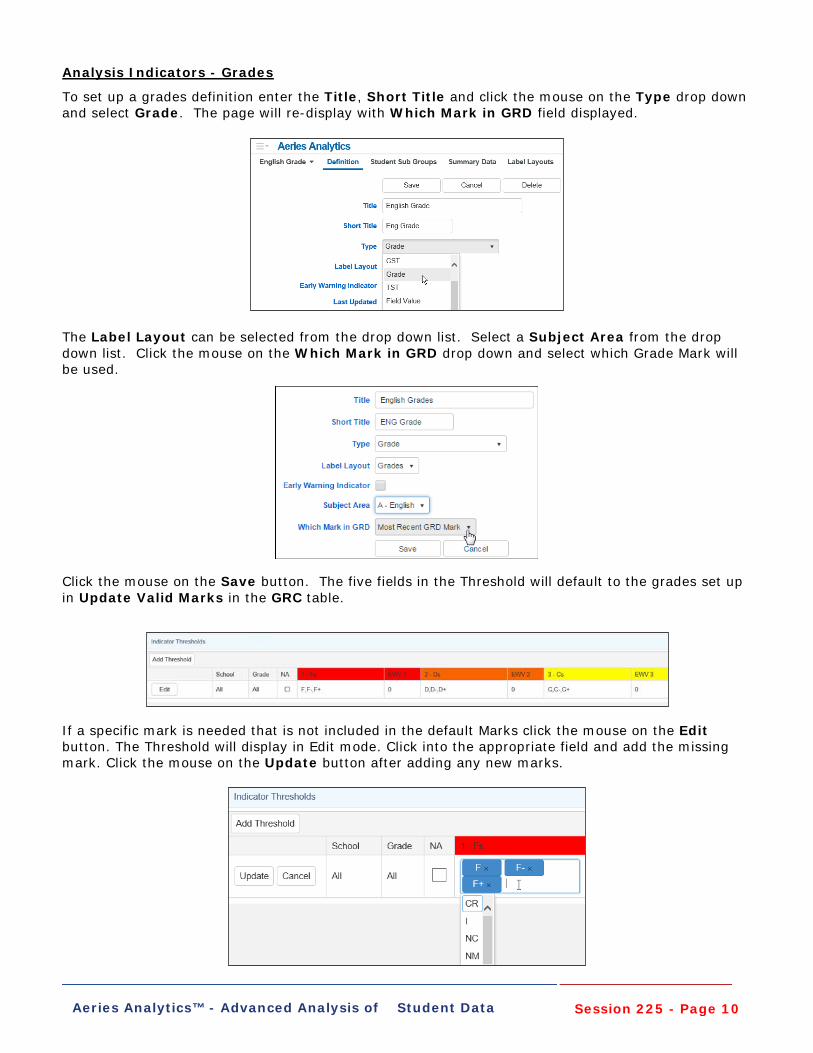
Analysis Indicators - Grades
To set up a grades definition enter the Title, Short Title and click the mouse on the Type drop down and select Grade. The page will re-display with Which Mark in GRD field displayed.
The Label Layout can be selected from the drop down list. Select a Subject Area from the drop down list. Click the mouse on the Which Mark in GRD drop down and select which Grade Mark will be used.
Click the mouse on the Save button. The five fields in the Threshold will default to the grades set up in Update Valid Marks in the GRC table.
If a specific mark is needed that is not included in the default Marks click the mouse on the Edit button. The Threshold will display in Edit mode. Click into the appropriate field and add the missing mark. Click the mouse on the Update button after adding any new marks.
Session 225 - Page 11 Aeries Analytics™ - Advanced Analysis of Student Data
The new Mark will now display in the Thresholds tab. For example below the NM mark now display under 1-F’s.
To update the Early Warning Value for each Grade Level click the mouse on the Edit button and then enter the selected value in the Early Warning fields. For example EWV1 below has been changed to 5.
Click the mouse on the Update button.The Early Warning Value will now display on the Threshold. For example below the EWV1 now displays 5.
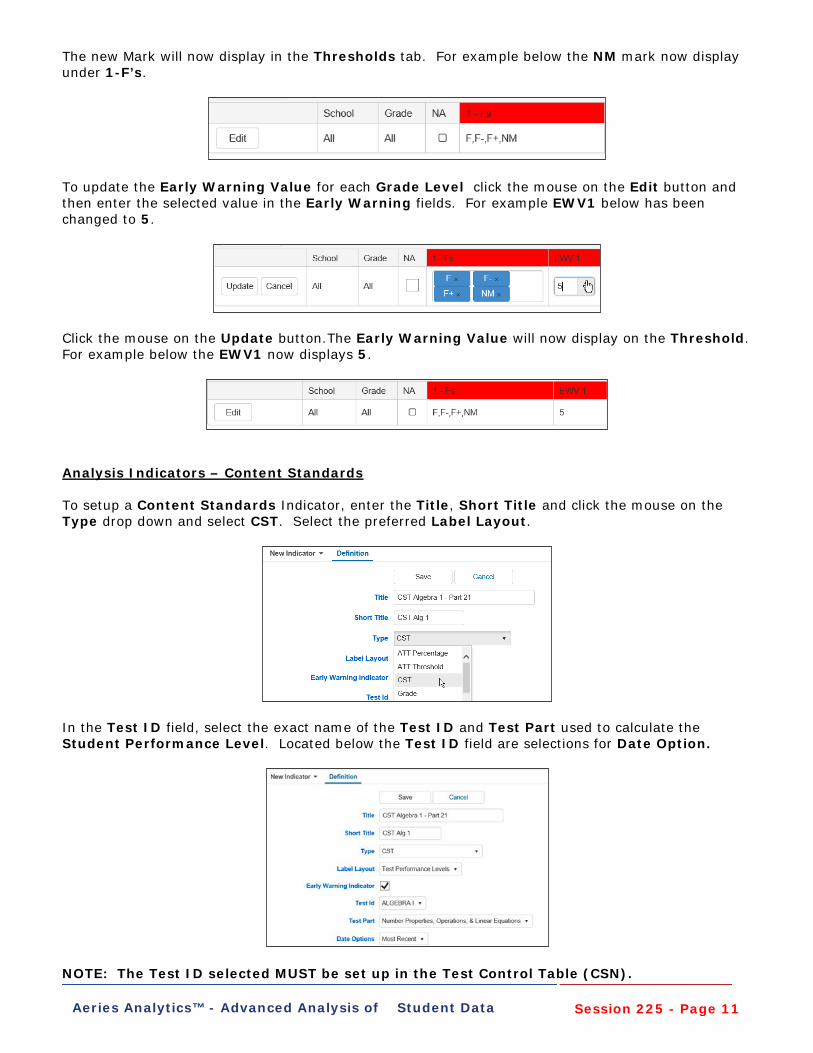
Analysis Indicators – Content Standards To setup a Content Standards Indicator, enter the Title, Short Title and click the mouse on the Type drop down and select CST. Select the preferred Label Layout.
In the Test ID field, select the exact name of the Test ID and Test Part used to calculate the Student Performance Level. Located below the Test ID field are selections for Date Option.
NOTE: The Test ID selected MUST be set up in the Test Control Table (CSN).
Session 225 - Page 12 Aeries Analytics™ - Advanced Analysis of Student Data
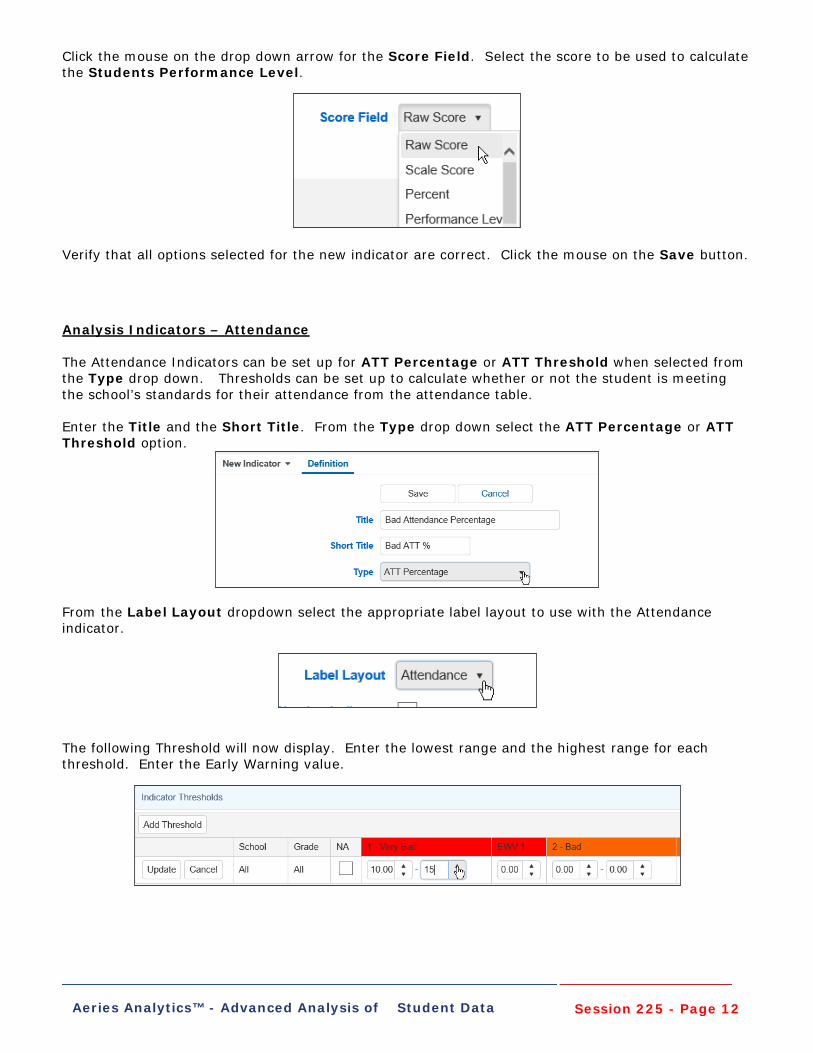
Click the mouse on the drop down arrow for the Score Field. Select the score to be used to calculate the Students Performance Level.
Verify that all options selected for the new indicator are correct. Click the mouse on the Save button.
Analysis Indicators – Attendance The Attendance Indicators can be set up for ATT Percentage or ATT Threshold when selected from the Type drop down. Thresholds can be set up to calculate whether or not the student is meeting the school’s standards for their attendance from the attendance table. Enter the Title and the Short Title. From the Type drop down select the ATT Percentage or ATT Threshold option.
From the Label Layout dropdown select the appropriate label layout to use with the Attendance indicator.
The following Threshold will now display. Enter the lowest range and the highest range for each threshold. Enter the Early Warning value.
Session 225 - Page 13 Aeries Analytics™ - Advanced Analysis of Student Data
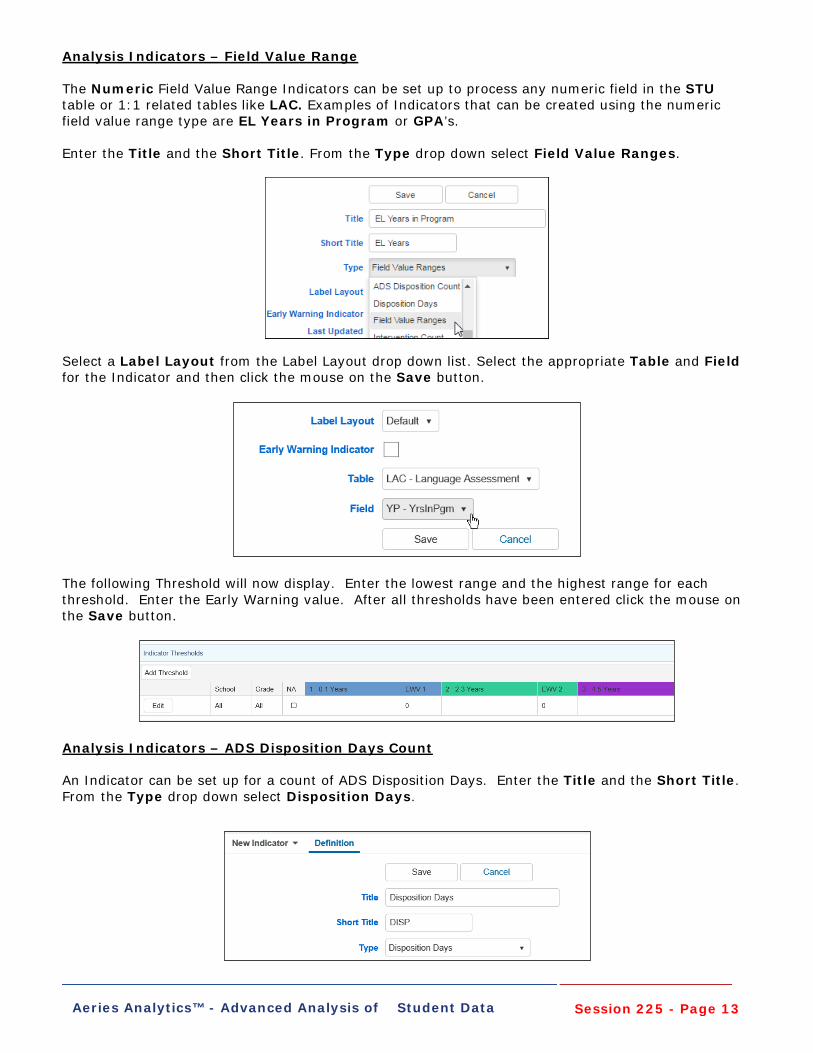
Analysis Indicators – Field Value Range The Numeric Field Value Range Indicators can be set up to process any numeric field in the STU table or 1:1 related tables like LAC. Examples of Indicators that can be created using the numeric field value range type are EL Years in Program or GPA’s. Enter the Title and the Short Title. From the Type drop down select Field Value Ranges.
Select a Label Layout from the Label Layout drop down list. Select the appropriate Table and Field for the Indicator and then click the mouse on the Save button.
The following Threshold will now display. Enter the lowest range and the highest range for each threshold. Enter the Early Warning value. After all thresholds have been entered click the mouse on the Save button.
Analysis Indicators – ADS Disposition Days Count An Indicator can be set up for a count of ADS Disposition Days. Enter the Title and the Short Title. From the Type drop down select Disposition Days.
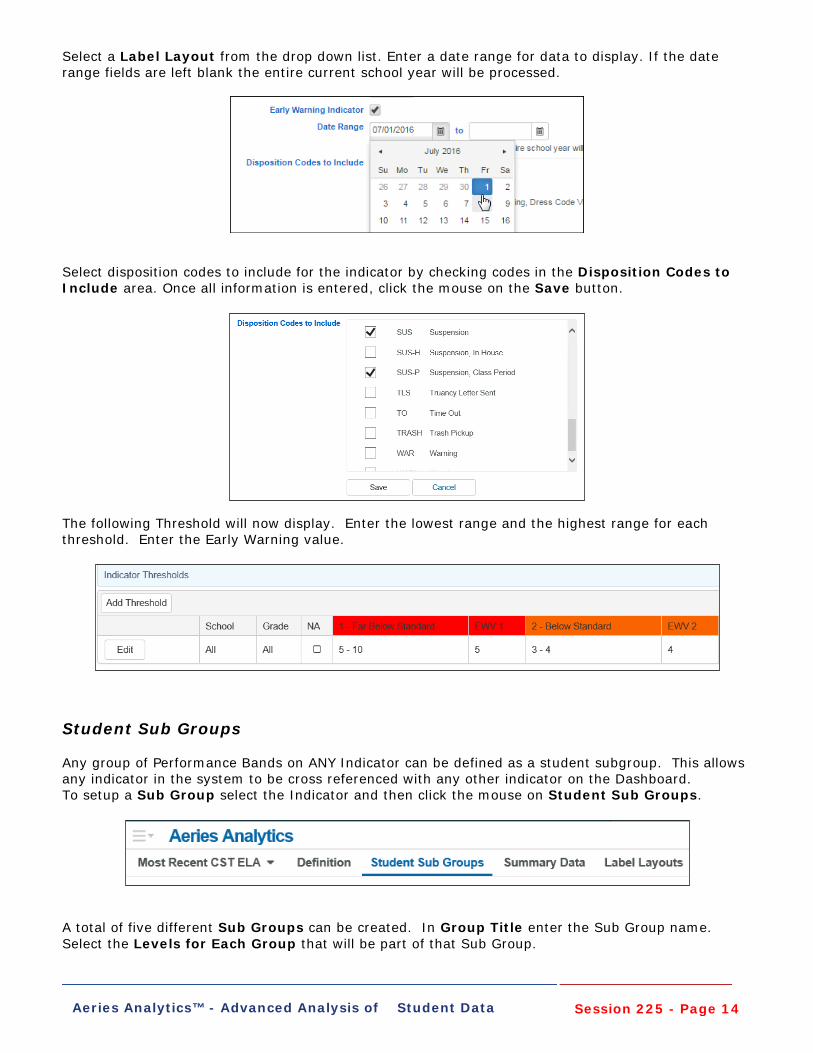
Session 225 - Page 14 Aeries Analytics™ - Advanced Analysis of Student Data
Select a Label Layout from the drop down list. Enter a date range for data to display. If the date range fields are left blank the entire current school year will be processed.
Select disposition codes to include for the indicator by checking codes in the Disposition Codes to Include area. Once all information is entered, click the mouse on the Save button.
The following Threshold will now display. Enter the lowest range and the highest range for each threshold. Enter the Early Warning value.
Student Sub Groups Any group of Performance Bands on ANY Indicator can be defined as a student subgroup. This allows any indicator in the system to be cross referenced with any other indicator on the Dashboard. To setup a Sub Group select the Indicator and then click the mouse on Student Sub Groups.
A total of five different Sub Groups can be created. In Group Title enter the Sub Group name. Select the Levels for Each Group that will be part of that Sub Group.

Session 225 - Page 15 Aeries Analytics™ - Advanced Analysis of Student Data
In the below example the Low Performing SBAC ELA sub group includes students that earned Performance Levels 1 and 2, and the High Performing SBAC ELA sub group includes students that earned Performance Levels 3 and 4. Verify all options are correct for the Student Sub Group. Click the mouse on the Save button.
Summary Data After an Indicator and Student Sub Groups have been set up, the Summary Data area can be used to view the summary data related to the indicator. Click the mouse on Summary Data.
To view Summary Data results for the Indicator, the Indicator first needs to be processed. The Process All Indicators button on Summary Data will update ALL Analysis Indicators. The Process Current Indicator button will update only the Analytic Indicator selected and displayed.
Once the Indicators are calculated, summary totals will display. Clicking on the icon next to a summary total will display all students associated with that percentage.
Session 225 - Page 16 Aeries Analytics™ - Advanced Analysis of Student Data
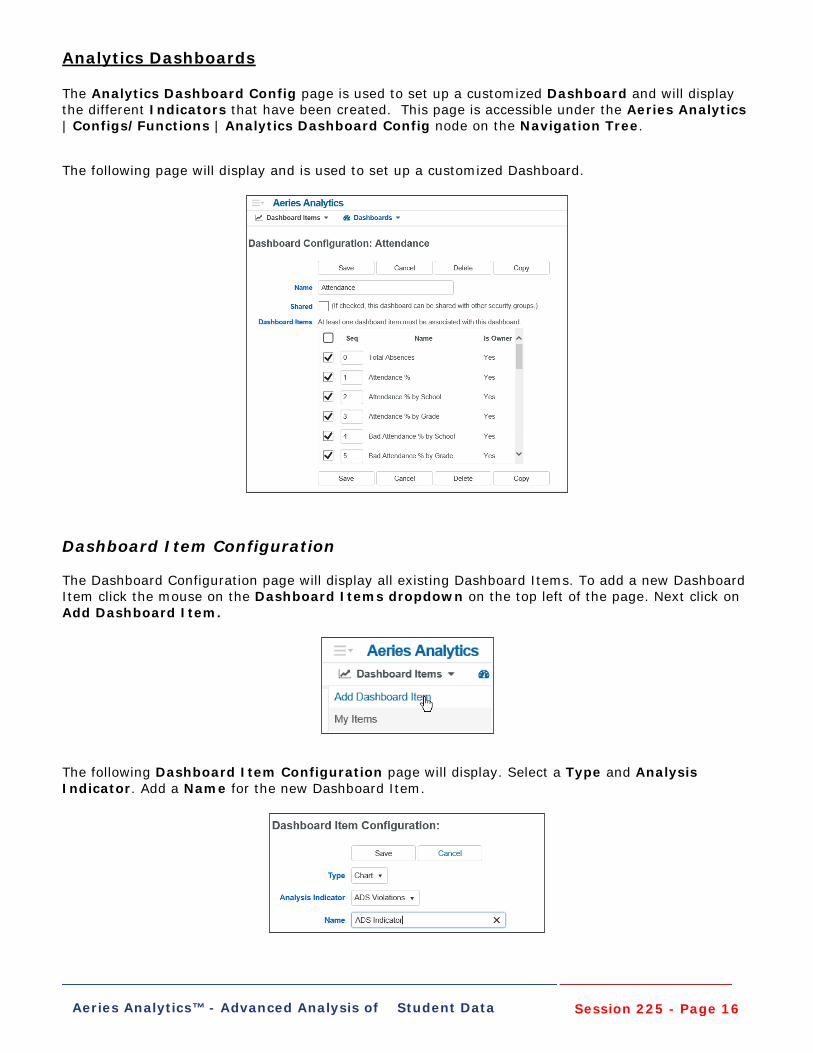
Analytics Dashboards The Analytics Dashboard Config page is used to set up a customized Dashboard and will display the different Indicators that have been created. This page is accessible under the Aeries Analytics | Configs/Functions | Analytics Dashboard Config node on the Navigation Tree. The following page will display and is used to set up a customized Dashboard.
Dashboard Item Configuration The Dashboard Configuration page will display all existing Dashboard Items. To add a new Dashboard Item click the mouse on the Dashboard Items dropdown on the top left of the page. Next click on Add Dashboard Item.
The following Dashboard Item Configuration page will display. Select a Type and Analysis Indicator. Add a Name for the new Dashboard Item.
Session 225 - Page 17 Aeries Analytics™ - Advanced Analysis of Student Data
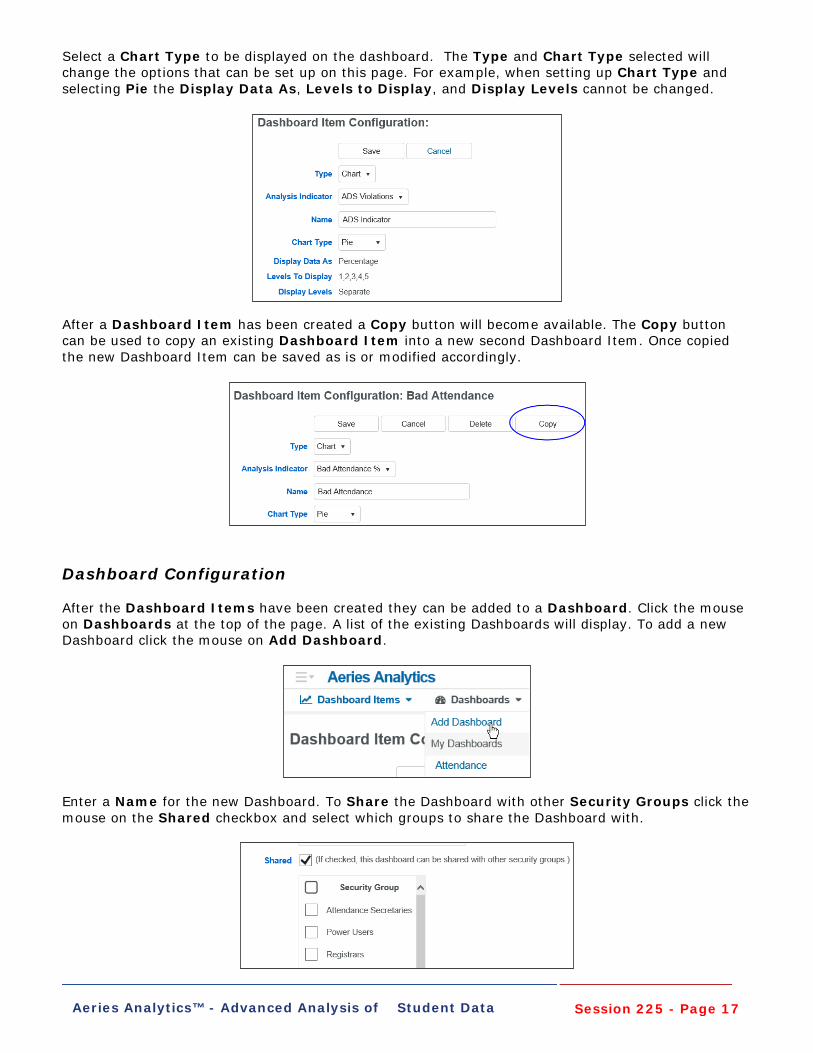
Select a Chart Type to be displayed on the dashboard. The Type and Chart Type selected will change the options that can be set up on this page. For example, when setting up Chart Type and selecting Pie the Display Data As, Levels to Display, and Display Levels cannot be changed.
After a Dashboard Item has been created a Copy button will become available. The Copy button can be used to copy an existing Dashboard Item into a new second Dashboard Item. Once copied the new Dashboard Item can be saved as is or modified accordingly.
Dashboard Configuration After the Dashboard Items have been created they can be added to a Dashboard. Click the mouse on Dashboards at the top of the page. A list of the existing Dashboards will display. To add a new Dashboard click the mouse on Add Dashboard.
Enter a Name for the new Dashboard. To Share the Dashboard with other Security Groups click the mouse on the Shared checkbox and select which groups to share the Dashboard with.
Session 225 - Page 18 Aeries Analytics™ - Advanced Analysis of Student Data
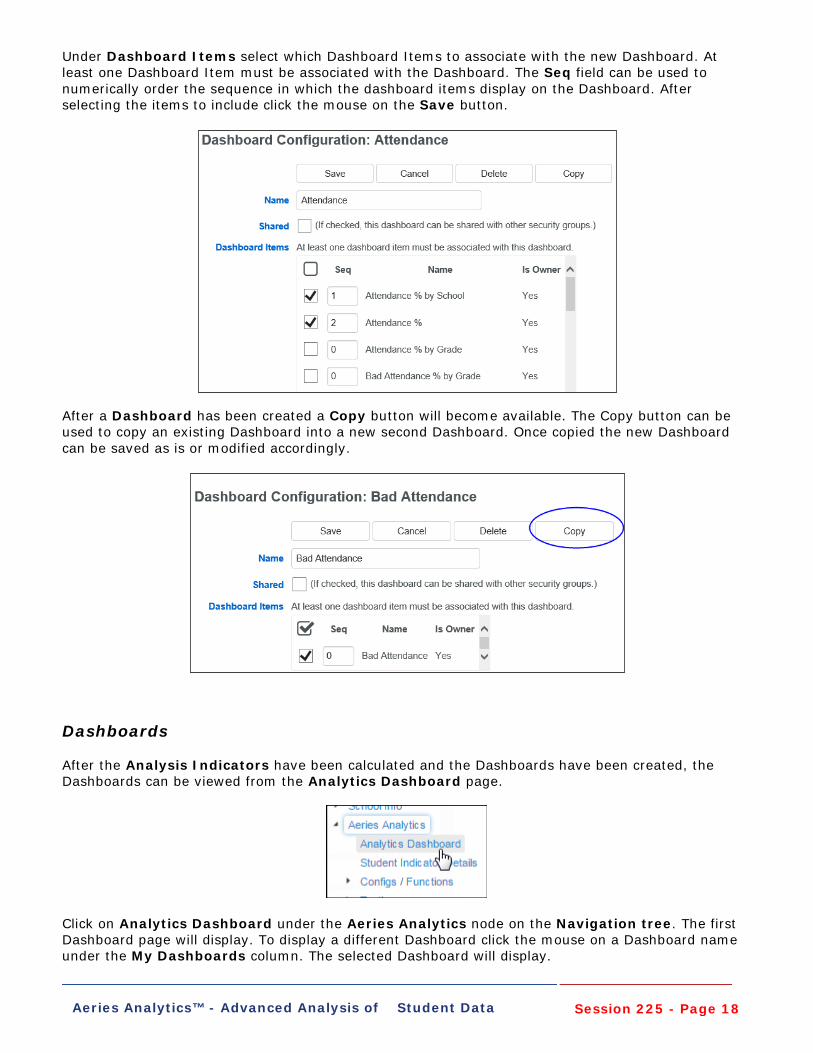
Under Dashboard Items select which Dashboard Items to associate with the new Dashboard. At least one Dashboard Item must be associated with the Dashboard. The Seq field can be used to numerically order the sequence in which the dashboard items display on the Dashboard. After selecting the items to include click the mouse on the Save button.
After a Dashboard has been created a Copy button will become available. The Copy button can be used to copy an existing Dashboard into a new second Dashboard. Once copied the new Dashboard can be saved as is or modified accordingly.
Dashboards After the Analysis Indicators have been calculated and the Dashboards have been created, the Dashboards can be viewed from the Analytics Dashboard page.
Click on Analytics Dashboard under the Aeries Analytics node on the Navigation tree. The first Dashboard page will display. To display a different Dashboard click the mouse on a Dashboard name under the My Dashboards column. The selected Dashboard will display.
Session 225 - Page 19 Aeries Analytics™ - Advanced Analysis of Student Data
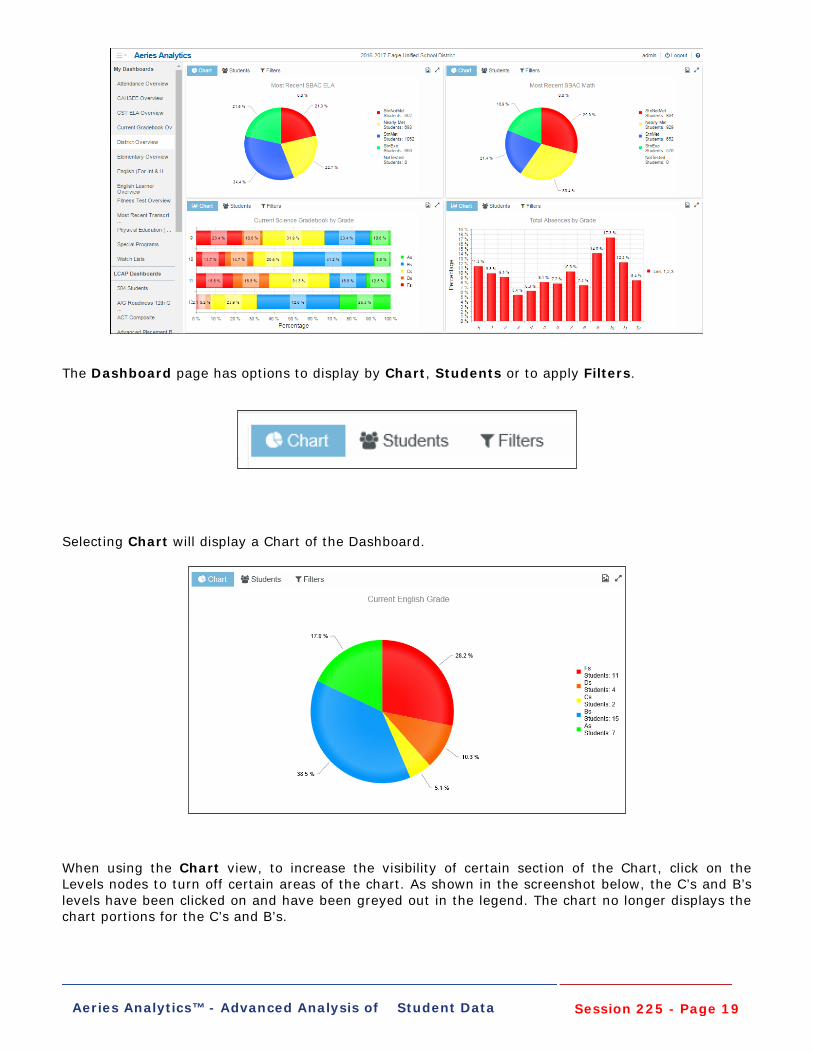
The Dashboard page has options to display by Chart, Students or to apply Filters.
Selecting Chart will display a Chart of the Dashboard.
When using the Chart view, to increase the visibility of certain section of the Chart, click on the Levels nodes to turn off certain areas of the chart. As shown in the screenshot below, the C’s and B’s levels have been clicked on and have been greyed out in the legend. The chart no longer displays the chart portions for the C’s and B’s.
Session 225 - Page 20 Aeries Analytics™ - Advanced Analysis of Student Data
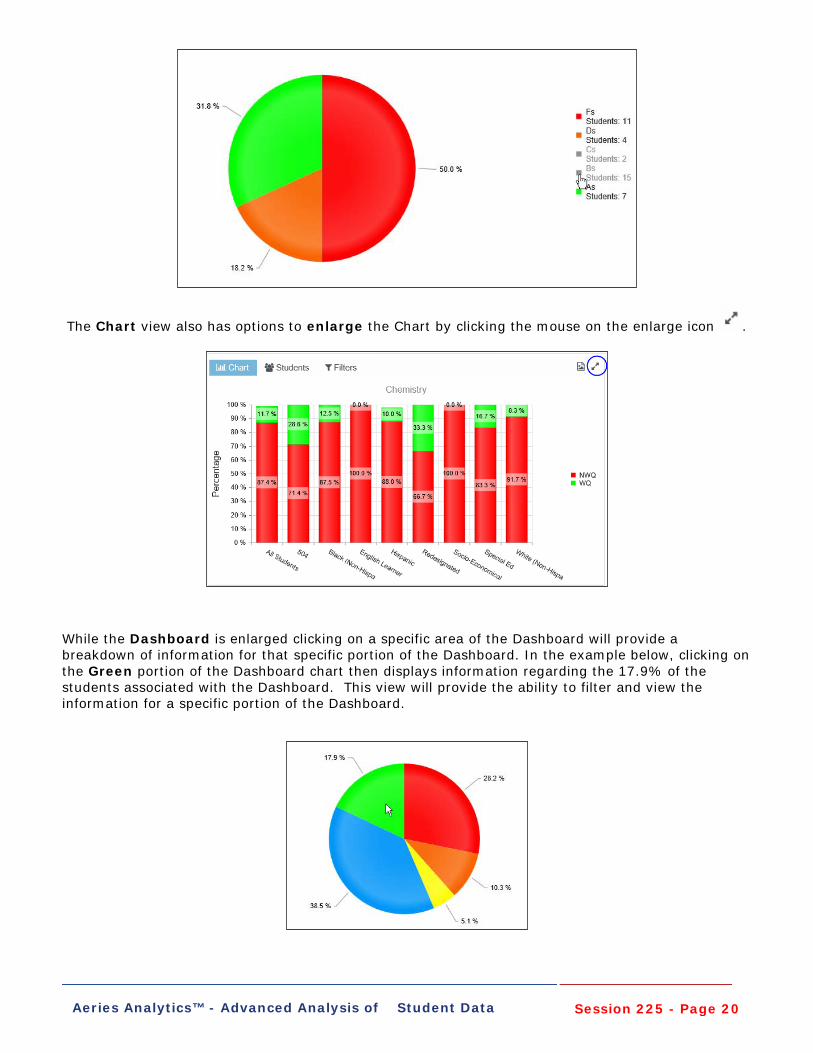
The Chart view also has options to enlarge the Chart by clicking the mouse on the enlarge icon .
While the Dashboard is enlarged clicking on a specific area of the Dashboard will provide a breakdown of information for that specific portion of the Dashboard. In the example below, clicking on the Green portion of the Dashboard chart then displays information regarding the 17.9% of the students associated with the Dashboard. This view will provide the ability to filter and view the information for a specific portion of the Dashboard.
Session 225 - Page 21 Aeries Analytics™ - Advanced Analysis of Student Data
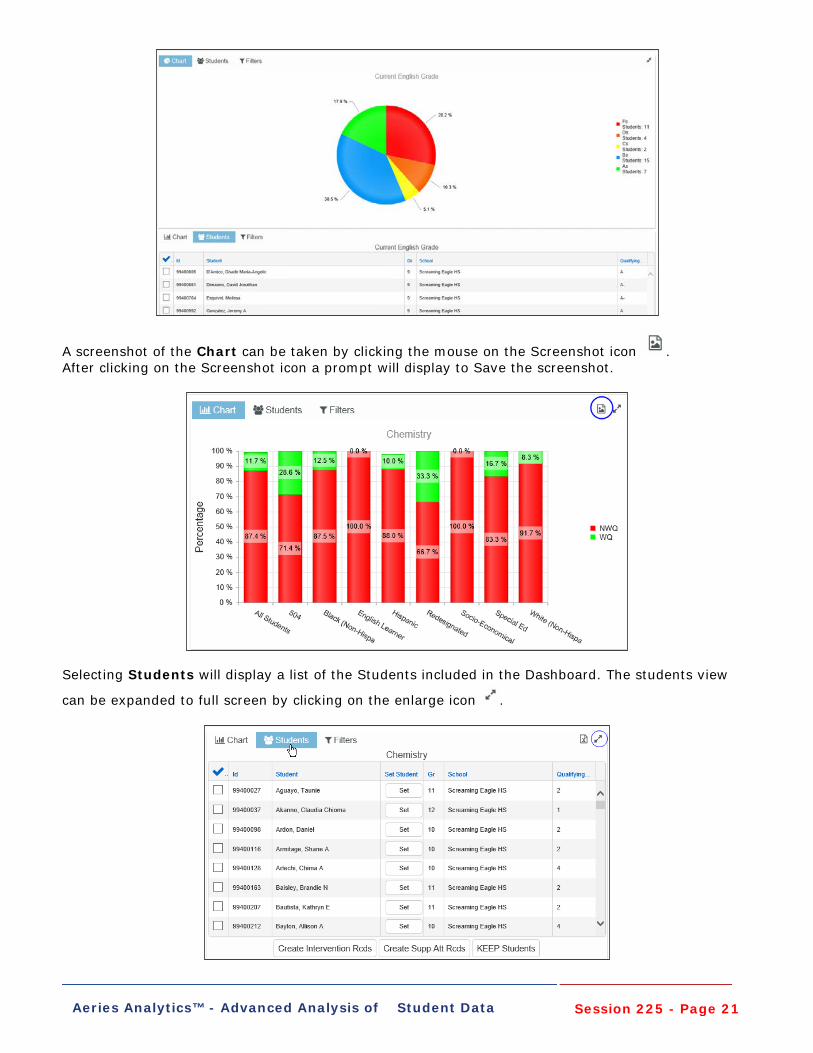
A screenshot of the Chart can be taken by clicking the mouse on the Screenshot icon . After clicking on the Screenshot icon a prompt will display to Save the screenshot.
Selecting Students will display a list of the Students included in the Dashboard. The students view
can be expanded to full screen by clicking on the enlarge icon .
Session 225 - Page 22 Aeries Analytics™ - Advanced Analysis of Student Data
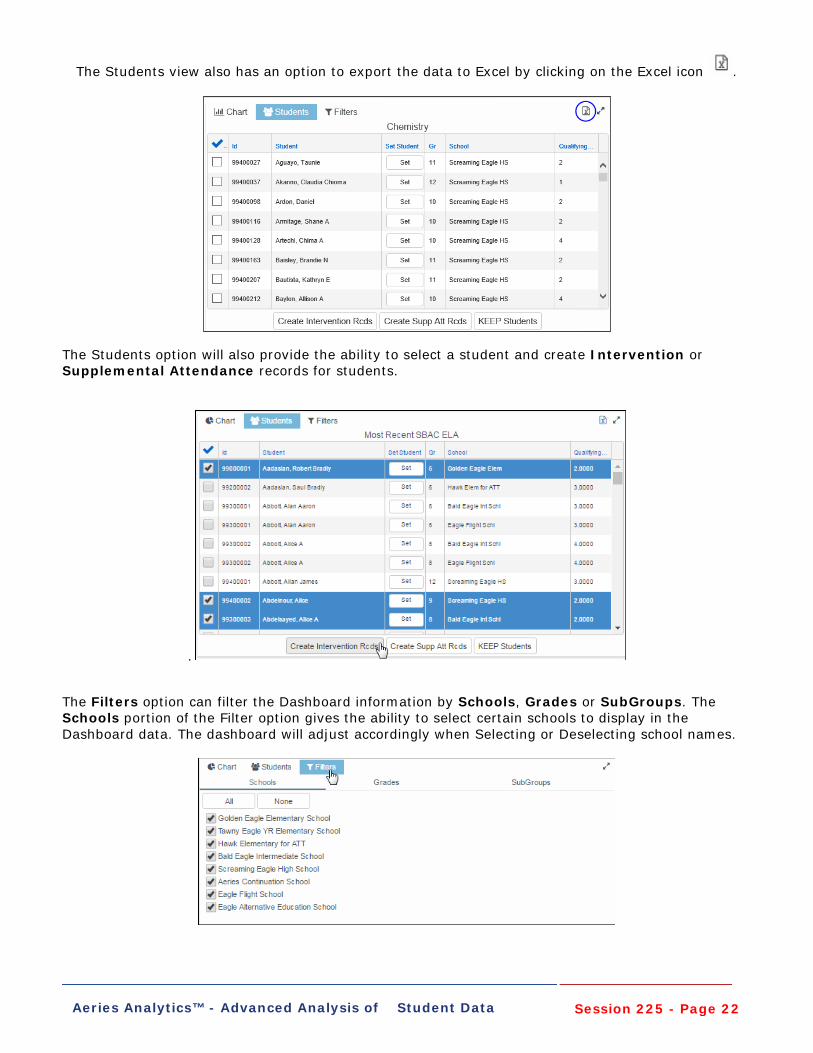
The Students view also has an option to export the data to Excel by clicking on the Excel icon .
The Students option will also provide the ability to select a student and create Intervention or Supplemental Attendance records for students.
.
The Filters option can filter the Dashboard information by Schools, Grades or SubGroups. The Schools portion of the Filter option gives the ability to select certain schools to display in the Dashboard data. The dashboard will adjust accordingly when Selecting or Deselecting school names.
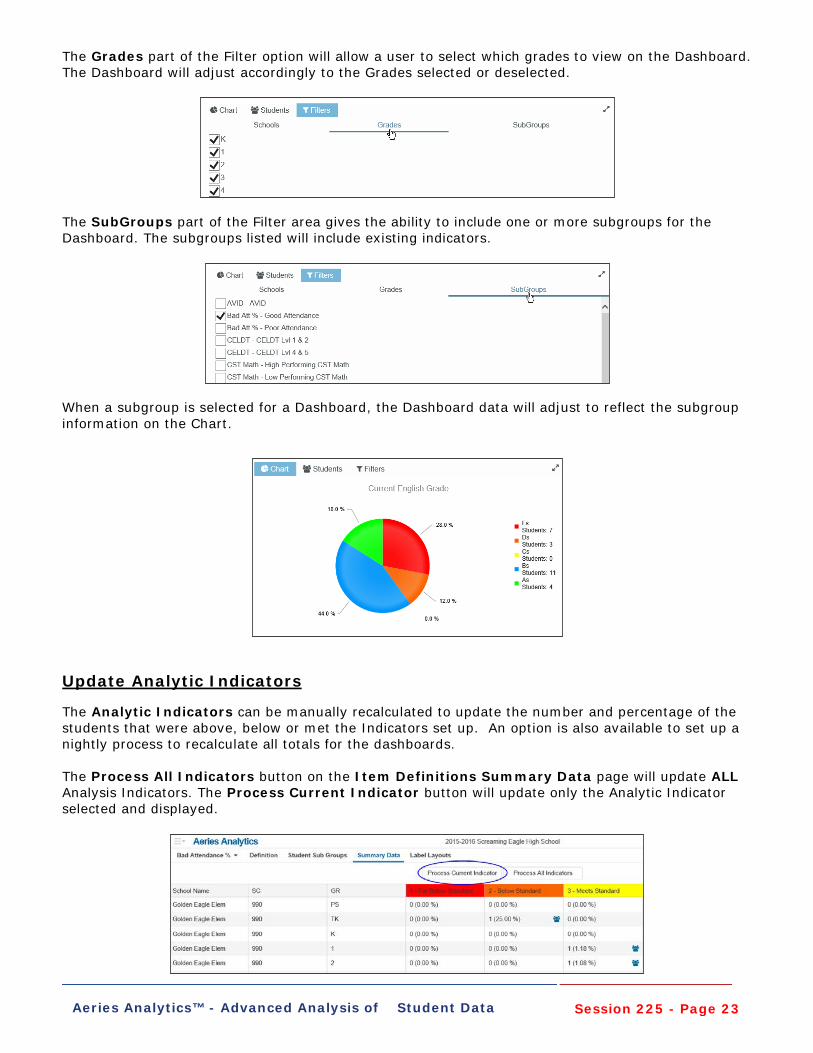
Session 225 - Page 23 Aeries Analytics™ - Advanced Analysis of Student Data
The Grades part of the Filter option will allow a user to select which grades to view on the Dashboard. The Dashboard will adjust accordingly to the Grades selected or deselected.
The SubGroups part of the Filter area gives the ability to include one or more subgroups for the Dashboard. The subgroups listed will include existing indicators.
When a subgroup is selected for a Dashboard, the Dashboard data will adjust to reflect the subgroup information on the Chart.
Update Analytic Indicators The Analytic Indicators can be manually recalculated to update the number and percentage of the students that were above, below or met the Indicators set up. An option is also available to set up a nightly process to recalculate all totals for the dashboards. The Process All Indicators button on the Item Definitions Summary Data page will update ALL Analysis Indicators. The Process Current Indicator button will update only the Analytic Indicator selected and displayed.
Session 225 - Page 24 Aeries Analytics™ - Advanced Analysis of Student Data
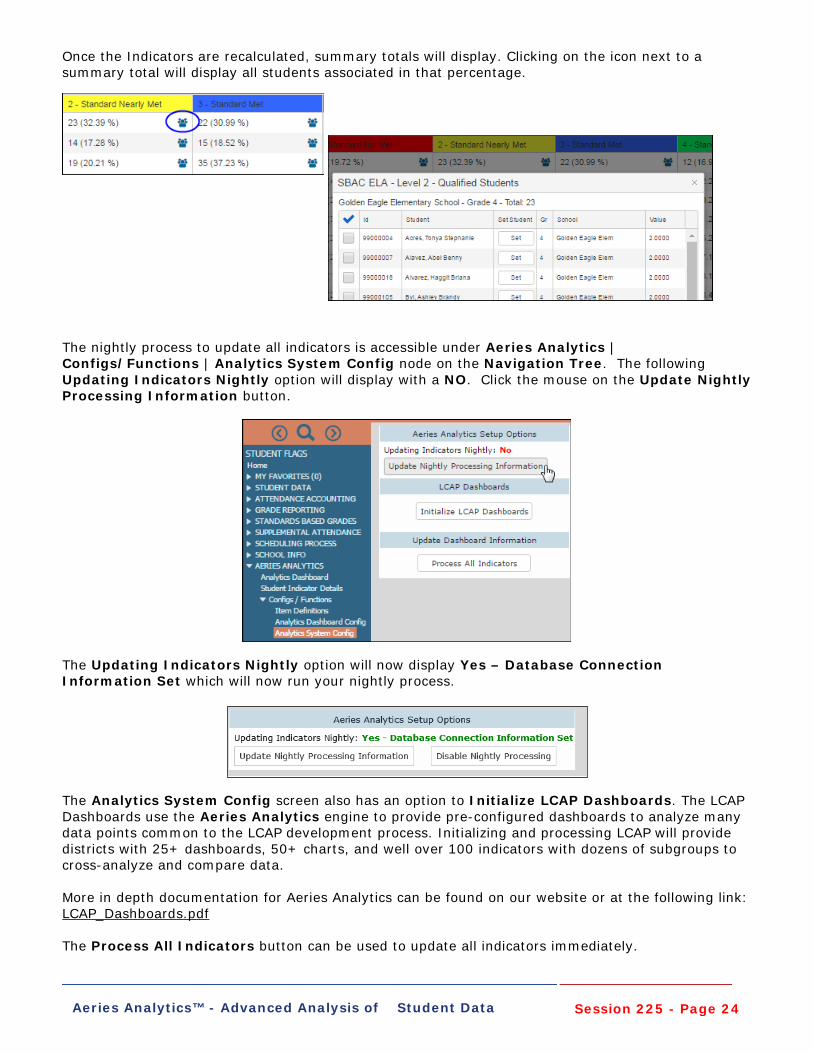
Once the Indicators are recalculated, summary totals will display. Clicking on the icon next to a summary total will display all students associated in that percentage.
The nightly process to update all indicators is accessible under Aeries Analytics | Configs/Functions | Analytics System Config node on the Navigation Tree. The following Updating Indicators Nightly option will display with a NO. Click the mouse on the Update Nightly Processing Information button.
The Updating Indicators Nightly option will now display Yes – Database Connection Information Set which will now run your nightly process.
The Analytics System Config screen also has an option to Initialize LCAP Dashboards. The LCAP Dashboards use the Aeries Analytics engine to provide pre-configured dashboards to analyze many data points common to the LCAP development process. Initializing and processing LCAP will provide districts with 25+ dashboards, 50+ charts, and well over 100 indicators with dozens of subgroups to cross-analyze and compare data. More in depth documentation for Aeries Analytics can be found on our website or at the following link: LCAP_Dashboards.pdf The Process All Indicators button can be used to update all indicators immediately.