africa’s leading independent oil...
TRANSCRIPT
First Energy Global Energy Conference 2015 Tullow Oil plc
Angus McCoss – Exploration Director First Energy Global Energy Conference– 22nd September 2015
AFRICA’S LEADING INDEPENDENT OIL COMPANY
First Energy Global Energy Conference 2015
This presentation contains certain forward-looking statements that are subject to the usual risk factors and uncertainties associated with the oil and gas exploration and production business.
Whilst Tullow believes the expectations reflected herein to be reasonable in light of the information available to them at this time, the actual outcome may be materially different owing to factors beyond the Group’s control or within the Group’s control where, for example, the Group decides on a change of plan or strategy.
The Group undertakes no obligation to revise any such forward-looking statements to reflect any changes in the Group’s expectations or any change in circumstances, events or the Group’s plans and strategy. Accordingly no reliance may be placed on the figures contained in such forward looking statements.
Disclaimer
Slide 2

First Energy Global Energy Conference 2015
FIRST ENERGY GLOBAL ENERGY CONFERENCE 2015

First Energy Global Energy Conference 2015
Business re-set for $50 oil price environment
Slide 4
1H 2015 financials in line with expectations
Funding in place with significant liquidity & headroom
Growing high margin cash flow underpinned by hedging
Major projects on schedule and on budget
Major cost cutting completed

First Energy Global Energy Conference 2015
FIRST ENERGY GLOBAL ENERGY CONFERENCE 2015

First Energy Global Energy Conference 2015
Financing Strategy
Slide 6
• Proactive measures already taken to manage business in a low oil price environment
• Quality assets and hedging programmes have allowed us financial flexibility and headroom;
• Financial strategy going forwards to significantly deleverage company beyond benefit from TEN production:
- Continued focus on high margin production and active hedging, cost and capital management
- Active portfolio management and farmdown activity
- Management of East Africa development capex
- Target Net Debt / EBITDAX <2X
De-leveraging will create capacity to reinstate the dividend and increase exploration capital expenditure up to $400 million per annum

First Energy Global Energy Conference 2015
2015 capital expenditure
Slide 7
$1.9 billion capex for full year 2015
• Ghana: Jubilee & TEN developments - $1,210m
• Other West Africa: Non-op production - $190m
• Europe: Maintaining mature production - $25m
• Uganda and Kenya: Pre-development activities
supporting FID - $225m
• Kenya: Exploration & appraisal drilling - $100m
• New Ventures exploration activities - $150m
1H 2015 capital split:
$521m
West Africa
$186m
East Africa
$76m
New Ventures
Notes: i) 2013 Capital Expenditure excludes the Spring acquisition expenditure ii) 2013, 2014 & 2015 Exploration expenditure is net of Norwegian tax refund
0 500 1,000 1,500 2,000 2,500
2012
2013
2014
2015
$2,020m
$1,800m
$1,870m
Development & Operations Exploration & Appraisal
$1,900m
1H 2015 $783m
$250m $1,650m
$800m $1,220m
$990m $810m
$1,060m $810m
2016 Capex guidance: $1.2 to $1.4 billion

First Energy Global Energy Conference 2015
$m Commitment size Maturity
RBL 3,700 Oct 2019
Corporate Facility 1,000 Apr 2017
6% Senior Notes 650 Nov 2020
6¼% Senior Notes 650 Apr 2022
EFF 1 ~280 Dec 2018
(1) Norwegian Exploration Finance Facility, NOK2.25bn (2) Final maturity; RBL amortises linearly from October 2016 – 2019
$m 30 June 2015 31 Dec 2014
Cash and cash equivalents 488 319
Debt outstanding
RBL Facilities 2,634 1,987
EFF 1 164 135
Corporate Facility - -
Senior Notes 1,300 1,300
Total debt 4,098 3,422
Net debt 3,610 3,103
Facility headroom plus free cash 2,348 2,381
Debt maturity profile Key metrics
EFF1
$m
1H 2015 Financing Initiatives
• Liquidity: $450m increase in bank facilities
• RBL: draw capacity maintained
• Financial covenant: relaxed
164
2,634
650 650 1,000
0
1,000
2,000
3,000
4,000
2017 2018 2019 2020 2021 2022
Strong liquidity position through TEN first oil
Slide 8
~$2.3bn of facility headroom plus free cash end 1H 2015; Expect ~$1bn debt facility headroom mid-2016
Senior Notes
RBL2 3,700
Corporate Facility Senior
Notes
Facility headroom
Drawings

First Energy Global Energy Conference 2015
Hedge strategy • Hedge strategy is approved by the Board and reviewed quarterly
• Hedges are executed rateably on a three year forward rolling basis
• Hedge by purchasing a mix of Dated Brent options (puts, collars, 3-way collars)
Current Portfolio • Approximately 60% of 2015 oil entitlement volumes is hedged at ~$86/bbl
• MTM as at 30 June ~$0.3bn
Oil Hedging
Hedge Position (as at 30 June 2015) 2H 2015 2016 2017 2018
Oil Volume (bopd) 34,500 31,257 19,500 5,000
Average floor price protected ($/bbl) 85.98 79.29 76.68 68.04
MTM value at 30 June 2015 ($m)* 111.0 130.1 57.7 -1.2
The hedging programme has helped to significantly mitigate the impact of lower oil prices; $146m benefit to 1H 2015 revenues with ~$300m mark-to-market value looking forwards
Slide 9
*Net of hedge premium

First Energy Global Energy Conference 2015
FIRST ENERGY GLOBAL ENERGY CONFERENCE 2015
First Energy Global Energy Conference 2015
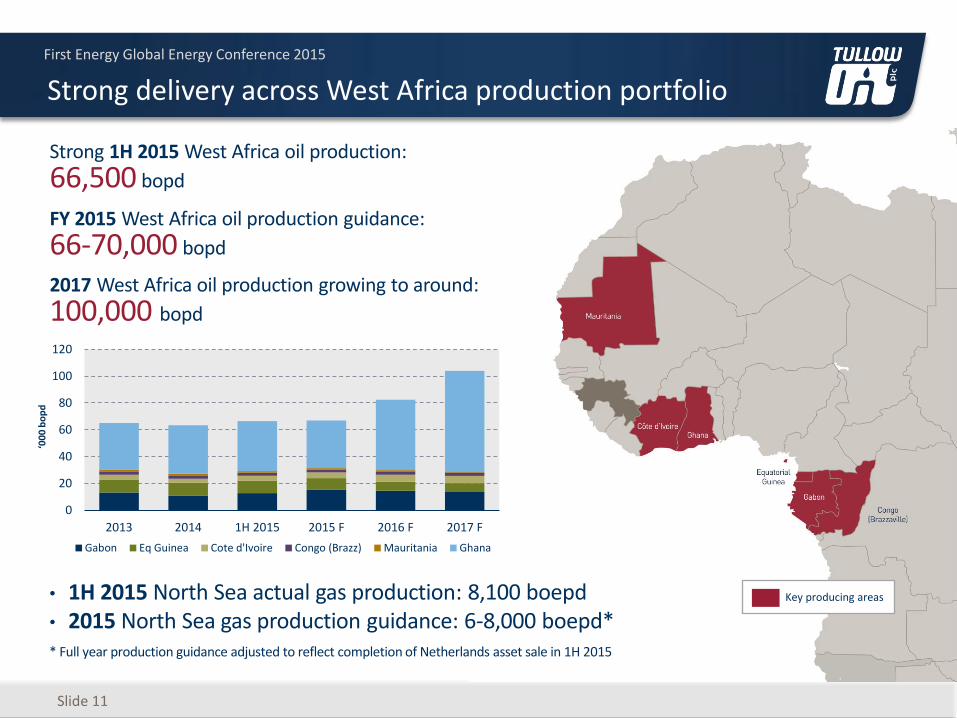
Strong delivery across West Africa production portfolio
Slide 11
• 1H 2015 North Sea actual gas production: 8,100 boepd • 2015 North Sea gas production guidance: 6-8,000 boepd* * Full year production guidance adjusted to reflect completion of Netherlands asset sale in 1H 2015
‘00
0 b
op
d
0
20
40
60
80
100
120
2013 2014 1H 2015 2015 F 2016 F 2017 F
Gabon Eq Guinea Cote d'Ivoire Congo (Brazz) Mauritania Ghana
Strong 1H 2015 West Africa oil production:
66,500 bopd
FY 2015 West Africa oil production guidance:
66-70,000 bopd
Key producing areas
2017 West Africa oil production growing to around:
100,000 bopd
First Energy Global Energy Conference 2015
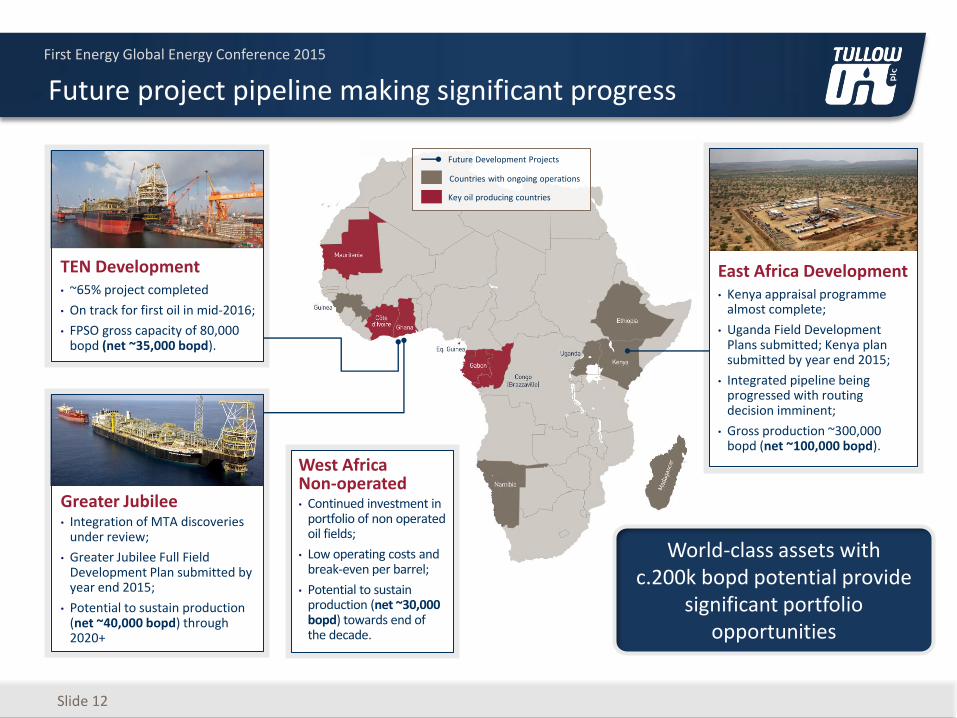
Future project pipeline making significant progress
Slide 12
Countries with ongoing operations
Key oil producing countries
Future Development Projects
World-class assets with c.200k bopd potential provide
significant portfolio opportunities
East Africa Development • Kenya appraisal programme
almost complete;
• Uganda Field Development Plans submitted; Kenya plan submitted by year end 2015;
• Integrated pipeline being progressed with routing decision imminent;
• Gross production ~300,000 bopd (net ~100,000 bopd).
TEN Development • ~65% project completed
• On track for first oil in mid-2016;
• FPSO gross capacity of 80,000 bopd (net ~35,000 bopd).
Greater Jubilee • Integration of MTA discoveries
under review;
• Greater Jubilee Full Field Development Plan submitted by year end 2015;
• Potential to sustain production (net ~40,000 bopd) through 2020+
West Africa Non-operated • Continued investment in
portfolio of non operated oil fields;
• Low operating costs and break-even per barrel;
• Potential to sustain production (net ~30,000 bopd) towards end of the decade.

First Energy Global Energy Conference 2015
Slide 13
Strong Jubilee performance year-to-date • 1H15 average gross production: 105 kbopd
• FY15 guidance: 100 kbopd; impacted by short term gas compression issue
• Gas export averaging c.80mmscfd since commissioning
• Reduced gas injection allowing FPSO capacity to rise to ~115kbopd
Strong focus on cost management • 1H15 opex per barrel: $10.9/bbl
• On-track to meet FY15 target: <$10/bbl
• TEN provides opportunity to further reduce Ghana opex/bbl
Future investment opportunities • Additional infill well being drilled this year in JUA
• Greater Jubilee Development Plan submission by end 2015
- Optimal integration of MTA discoveries under review
- Long term infill drilling plans to extend production plateau
- Reviewing options to expand FPSO capacity
Jubilee development options present growth opportunities

First Energy Global Energy Conference 2015
TEN project on schedule and on budget for first oil mid-2016
Slide 14
DRILLING
Project c.65% complete
• FPSO Conversion (92%)
- All major installation work complete
- On track for sailaway around year-end
- Field installation completion 2Q15
• Subsea Fabrication (95%) & Installation (45%)
- All major fabrication complete
- Subsea installation campaign underway
- Optimisation of program to first oil underway
• Drilling (100%) and Completions (25%)
- All eleven start-up wells drilled
- 2 of 10 well completions installed, third underway
Plateau production targeted early 2017
TEN Gross Development Capex US$bn
-
0.5
1.0
1.5
2.0
2013 2014 2015 2016 2017 2018 2019
First Energy Global Energy Conference 2015
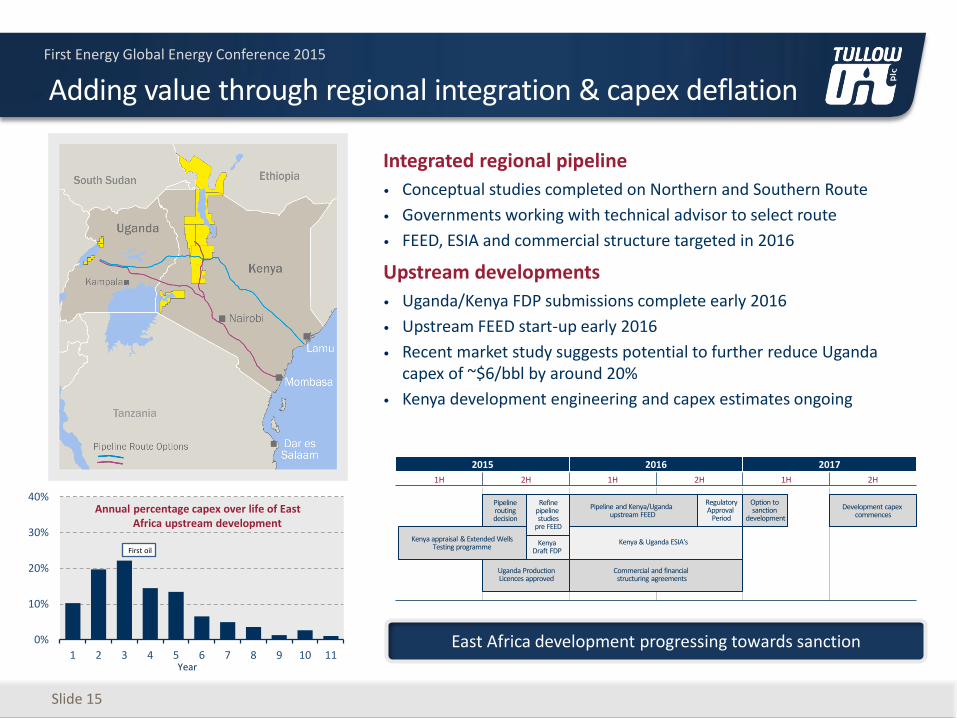
Integrated regional pipeline
• Conceptual studies completed on Northern and Southern Route
• Governments working with technical advisor to select route
• FEED, ESIA and commercial structure targeted in 2016
Upstream developments
• Uganda/Kenya FDP submissions complete early 2016
• Upstream FEED start-up early 2016
• Recent market study suggests potential to further reduce Uganda capex of ~$6/bbl by around 20%
• Kenya development engineering and capex estimates ongoing
0%
10%
20%
30%
40%
1 2 3 4 5 6 7 8 9 10 11
First oil
Slide 15
Adding value through regional integration & capex deflation
Annual percentage capex over life of East Africa upstream development
Year
2015 2016 2017
1H 2H 1H 2H 1H 2H
Pipeline routing decision
Refine pipeline studies
pre FEED
Pipeline and Kenya/Uganda upstream FEED
Regulatory Approval
Period
Option to sanction
development
Development capex commences
Kenya appraisal & Extended Wells Testing programme
Kenya Draft FDP
Uganda Production Licences approved
Commercial and financial structuring agreements
East Africa development progressing towards sanction
Kenya & Uganda ESIA's
First Energy Global Energy Conference 2015
FIRST ENERGY CAPITAL CONFERENCE 2015

First Energy Global Energy Conference 2015
Adapting our E&A strategy to current environment
Slide 17
Adapted to mitigate risks & expense • Reduce cost exposure: Farm-out early to spread risk & earn carries
• Revised risk screening: High-grade exploration programmes to tougher decision thresholds
• Avoid complex wells: Target normally pressured oil plays in onshore & simple offshore settings
• Focused human resources: Deploy Geoscientists to portfolio rejuvenation & oil field development
Consistent long-term focus on high-impact exploration portfolio
• Conventional Light Oil: materially-valuable ‘core play’ campaigns using cost-effective technologies
• Africa & Atlantic: in-house geological experience & strong above-ground relationships
• Infrastructure-led exploration: building on our West Africa & East Africa hubs
• Finding the next hub: frontier new ventures to open new plays or basins
Investing for our future: drill high-graded ‘trigger wells’ & replenish portfolio with new ventures

First Energy Global Energy Conference 2015
Finding oil onshore East Africa
Slide 18
Location Activity
Uganda
Lake Albert Basin
• 17+ oil fields discovered (90% success)
• 1.7 billion barrels of oil discovered
Kenya
South Lokichar Basin
• 9/11 wildcat oil discoveries
• + 2 technical discoveries (tight oil plays)
• Discovered 600 mmbo resources (Pmean)
• New plays & prospects to be tested
Kerio Basin • Basin margin play unsuccessful at Kodos-1
• Epir-1 established a working petroleum system
• Independent plays in main basin untested
North Turkana Basin
• Basin margin play unsuccessful at Engomo-1
• Independent plays away from basin margin untested
Ethiopia
Omo Basin • Working petroleum system seen (oil shows)
Chew Bahir Basin
• Dry hole – Reviewing potential away from volcanics
Exciting basin & new play testing wildcats
Several undrilled basins being tested Q3 2015 to end 2016 • Cheptuket (Kerio Valley Basin), Tausi (North Lokichar Basin)

First Energy Global Energy Conference 2015
Q&A FIRST ENERGY GLOBAL ENERGY CONFERENCE 2015

First Energy Global Energy Conference 2015
Tullow Oil plc 9 Chiswick Park
566 Chiswick High Road London, W4 5XT United Kingdom
Tel: +44 (0)20 3249 9000 Fax: +44 (0)20 3249 8801
Email: [email protected]
Follow Tullow on: