afrl-rh-wp-tr-2017-0069 - dtic.mil · using government drawings, ... afrl-rh-wp-tr-2017-0069 has...
TRANSCRIPT

AFRL-RH-WP-TR-2017-0069
Safety parameter considerations of anodal transcranial Direct Current Stimulation in rats
R. Andy McKinley Ryan Jankord
Applied Neuroscience Branch Warfighter Interface Division
Mark P. Jackson Dennis Truong Marom Bikson
Department of Biomedical Engineering The City College of The City University of New York
Dr. Milene L. Brownlow
Research Associate Program, National Research Council (NRC)
Jessica A. Wagner Infoscitex (IST)
October 2017
Interim Report
DISTRIBUTION STATEMENT A. Approved for public release: distribution is unlimited.
STINFO COPY
AIR FORCE RESEARCH LABORATORY
711 HUMAN PERFORMANCE WING AIRMAN SYSTEMS DIRECTORATE
WRIGHT-PATTERSON AFB, OH 45433 AIR FORCE MATERIEL COMMAND
UNITED STATES AIR FORCE

NOTICE AND SIGNATURE PAGE Using Government drawings, specifications, or other data included in this document for any purpose other than Government procurement does not in any way obligate the U.S. Government. The fact that the Government formulated or supplied the drawings, specifications, or other data does not license the holder or any other person or corporation; or convey any rights or permission to manufacture, use, or sell any patented invention that may relate to them. This report was cleared for public release by the 88th Air Base Wing Public Affairs Office and is available to the general public, including foreign nationals. Copies may be obtained from the Defense Technical Information Center (DTIC) (http://www.dtic.mil). AFRL-RH-WP-TR-2017-0069 HAS BEEN REVIEWED AND IS APPROVED FOR PUBLICATION IN ACCORDANCE WITH ASSIGNED DISTRIBUTION STATEMENT. //signed// //signed// WESLEY S. BAKER. 1LT CLIFFORD N. OTTE Work Unit Manager Chief, Applied Neuroscience Branch Applied Neuroscience Branch Warfighter Interface Division //signed// KRISTOFFER A. SMITH-RODRIGUEZ, LTCOL, USAF Chief, Warfighter Interface Division Airman Systems Directorate This report is published in the interest of scientific and technical information exchange, and its publication does not constitute the Government’s approval or disapproval of its ideas or findings.

REPORT DOCUMENTATION PAGE Form Approved OMB No. 0704-0188
The public reporting burden for this collection of information is estimated to average 1 hour per response, including the time for reviewing instructions, searching existing data sources, searching existing data sources, gathering and maintaining the data needed, and completing and reviewing the collection of information. Send comments regarding this burden estimate or any other aspect of this collection of information, including suggestions for reducing this burden, to Department of Defense, Washington Headquarters Services, Directorate for Information Operations and Reports (0704-0188), 1215 Jefferson Davis Highway, Suite 1204, Arlington, VA 22202-4302. Respondents should be aware that notwithstanding any other provision of law, no person shall be subject to any penalty for failing to comply with a collection of information if it does not display a currently valid OMB control number. PLEASE DO NOT RETURN YOUR FORM TO THE ABOVE ADDRESS.
1. REPORT DATE (DD-MM-YY) 2. REPORT TYPE 3. DATES COVERED (From - To) 17-10-17 Interim Oct 2015 to Sep 2017
4. TITLE AND SUBTITLE Safety parameter considerations of anodal transcranial Direct Current Stimulation in rats
5a. CONTRACT NUMBER FA8650-14-D-6500
5b. GRANT NUMBER 5c. PROGRAM ELEMENT NUMBER
N/A 6. AUTHOR(S)
R. Andy McKinley* Milene L. Brownlow†† Ryan Jankord* Jessica A. Wagner** Mark P. Jackson† Dennis Truong† Marom Bikson†
5d. PROJECT NUMBER
N/A 5e. TASK NUMBER
TO 0003 5f. WORK UNIT NUMBER
H083 (2313RC12) 7. PERFORMING ORGANIZATION NAME(S) AND ADDRESS(ES) 8. PERFORMING ORGANIZATION Infoscitex Corporation** Department of Biomedical Engineering† Research Associateship Program†† Colonel Glenn Hwy, Suite 210 The City College of The City University of New York National Research Council Dayton , Oh 45431-4027 85 St. Nicholas Terrace, New York, NY 10031 Washington DC 20001
REPORT NUMBER
9. SPONSORING/MONITORING AGENCY NAME(S) AND ADDRESS(ES) 10. SPONSORING/MONITORING Air Force Materiel Command* Air Force Research Laboratory 711 Human Performance Wing Airman Systems Directorate Warfighter Interface Division Applied Neuroscience Branch Wright-Patterson AFB, OH 45433
AGENCY ACRONYM(S) 711 HPW/RHCP 11. SPONSORING/MONITORING AGENCY REPORT NUMBER(S) AFRL-RH-WP-TR-2017-0069
12. DISTRIBUTION/AVAILABILITY STATEMENT DISTRIBUTION STATEMENT A. Approved for public release: distribution is unlimited. 13. SUPPLEMENTARY NOTES
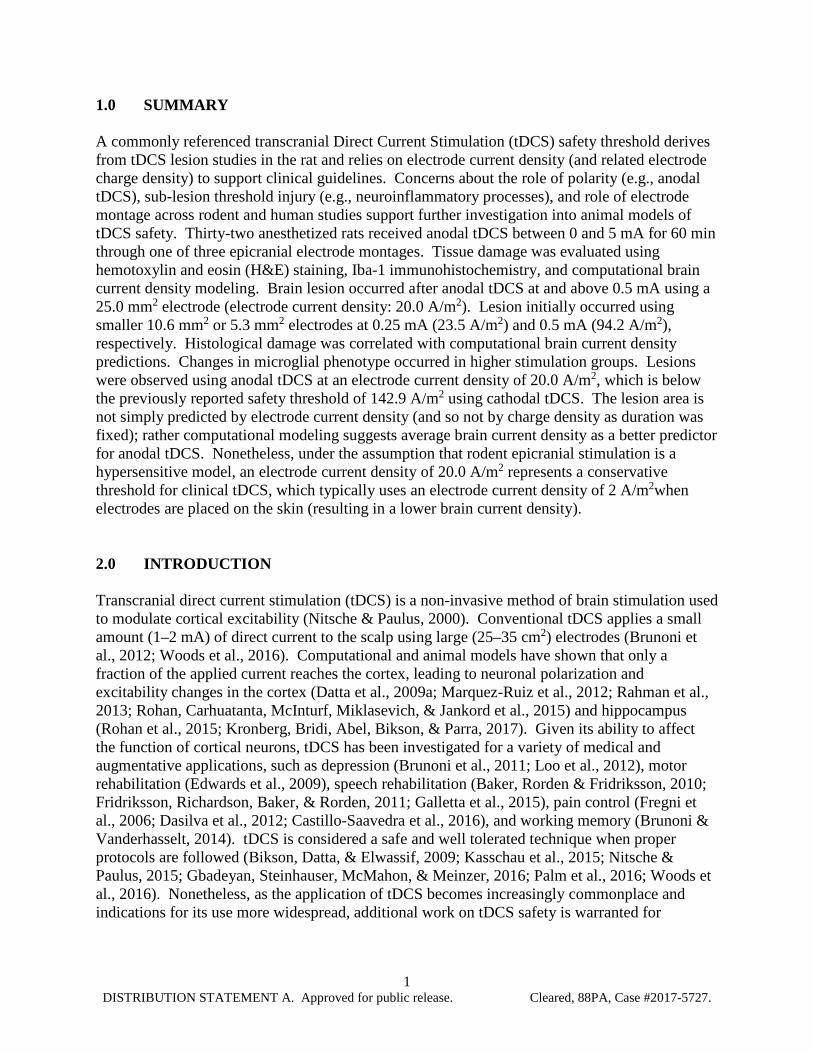
88ABW Cleared 11/15/2017; 88ABW-2017-5727. 14. ABSTRACT A commonly referenced transcranial Direct Current Stimulation (tDCS) safety threshold derives from tDCS lesion studies in the rat and relies on electrode current density (and related electrode charge density) to support clinical guidelines. Concerns about the role of polarity (e.g., anodal tDCS), sub-lesion threshold injury (e.g., neuroinflammatory processes), and role of electrode montage across rodent and human studies support further investigation into animal models of tDCS safety. Thirty-two anesthetized rats received anodal tDCS between 0 and 5 mA for 60 min through one of three epicranial electrode montages. Tissue damage was evaluated using hemotoxylin and eosin (H&E) staining, Iba-1 immunohistochemistry, and computational brain current density modeling. Brain lesion occurred after anodal tDCS at and above 0.5 mA using a 25.0 mm2 electrode (electrode current density: 20.0 A/m2). Lesion initially occurred using smaller 10.6 mm2 or 5.3 mm2 electrodes at 0.25 mA (23.5 A/m2) and 0.5 mA (94.2 A/ m2), respectively. Histological damage was correlated with computational brain current density predictions. Changes in microglial phenotype occurred in higher stimulation groups. Lesions were observed using anodal tDCS at an electrode current density of 20.0 A/m2, which is below the previously reported safety threshold of 142.9 A/m2 using cathodal tDCS. The lesion area is not simply predicted by electrode current density (and so not by charge density as duration was fixed); rather computational modeling suggests average brain current density as a better predictor for anodal tDCS. Nonetheless, under the assumption that rodent epicranial stimulation is a hypersensitive model, an electrode current density of 20.0 A/m2 represents a conservative threshold for clinical tDCS, which typically uses an electrode current density of 2 A/m2 when electrodes are placed on the skin (resulting in a lower brain current density). 15. SUBJECT TERMS tDCS; Rat cortex; Direct Current Stimulation; Current density; tDCS modeling; Microglia
16. SECURITY CLASSIFICATION OF: 17. LIMITATION OF ABSTRACT:
SAR
18. NUMBER OF PAGES
28 19a. NAME OF RESPONSIBLE PERSON (Monitor)
a. REPORT Unclassified
b. ABSTRACT Unclassified
c. THIS PAGE Unclassified
1Lt Wesley S. Baker 19b. TELEPHONE NUMBER (Include Area Code)
Standard Form 298 (Rev. 8-98)
Prescribed by ANSI Std. Z39-18

i
TABLE OF CONTENTS
LIST OF FIGURES ..................................................................................................................................... ii
LIST OF TABLES ....................................................................................................................................... ii
ACKNOWLEDGEMENTS ......................................................................................................................... iii
1.0 SUMMARY ...................................................................................................................................... 1
2.0 INTRODUCTION ............................................................................................................................ 1
3.0 MATERIALS and METHODS ......................................................................................................... 3
3.1 25.0 mm² electrode placement surgery ......................................................................................... 3
3.2 10.6 mm² and 5.3 mm² electrode placement surgery .................................................................... 4
3.3 tDCS application ........................................................................................................................... 4
3.3.1 25.0 mm² electrode stimulation ............................................................................................. 4
3.3.2 10.2 mm² and 5.3 mm² electrode stimulation ....................................................................... 4
3.4 Histological processing and analysis ............................................................................................ 5
3.4.1 Tissue staining: H&E, Iba1 .................................................................................................. 5
3.4.2 Image analysis ....................................................................................................................... 6
3.5 Computational modeling ............................................................................................................... 6
3.5.1 MRI data collection and segmentation .................................................................................. 6
3.5.2 Modeling of tDCS ................................................................................................................. 7
3.5.3 Statistical analysis ................................................................................................................. 7
4.0 RESULTS ......................................................................................................................................... 9
4.1 Brain lesion from anodal tDCS ......................................................................................................... 9
4.2 Iba1 immunoreactivity ................................................................................................................ 14
5.0 DISCUSSION ................................................................................................................................. 15
6.0 CONCLUSIONS ............................................................................................................................. 16
7.0 REFERENCES ............................................................................................................................... 17
8.0 LIST OF SYMBOLS, ABBREVIATIONS, AND ACRONYMS .................................................. 22

ii
LIST OF FIGURES Figure 1. Micrograph representation (4X) of both H&E stained coronal sections from tDCS-induced
brain lesion and current distribution at or near -2.5 mm Bregma.. ..................................................... 10 Figure 2. Average lesion area evaluated by electrode current density. .................................................... 12 Figure 3. Averaged lesion area by brain tissue section and electrode size according to its distance from
Bregma. ............................................................................................................................................. 13 Figure 4. Effect of electrode current density and brain current density on total brain lesion area. .......... 14
Figure 5. Micrograph representation (10X) of Iba1 immunoreactive microglia counterstained with H&E in brain sections from sham (A) or tDCS groups at different current intensities: 0.5 mA (B), 1.0 mA (C) and 2.5 mA (D). .......................................................................................................................... 15
LIST OF TABLES Table 1. Summary of Electrode Parameters ................................................................................................. 5 Table 2. Summary of Stimulation Parameters ........................................................................................... 11

iii
ACKNOWLEDGEMENTS This work could not have been completed without the help of the following individuals: Wilson C. Tucker, Naomi Bechmann, Raquel Moore, Saline Hughes, Kimberly A.K. Carhuatanta, Melanie Chin, Justin Stafford, Victoria Dershem, Dick Godfrey and Andrew Jimenez. This work was supported by the Air Force Office of Scientific Research.
1 DISTRIBUTION STATEMENT A. Approved for public release. Cleared, 88PA, Case #2017-5727.
1.0 SUMMARY A commonly referenced transcranial Direct Current Stimulation (tDCS) safety threshold derives from tDCS lesion studies in the rat and relies on electrode current density (and related electrode charge density) to support clinical guidelines. Concerns about the role of polarity (e.g., anodal tDCS), sub-lesion threshold injury (e.g., neuroinflammatory processes), and role of electrode montage across rodent and human studies support further investigation into animal models of tDCS safety. Thirty-two anesthetized rats received anodal tDCS between 0 and 5 mA for 60 min through one of three epicranial electrode montages. Tissue damage was evaluated using hemotoxylin and eosin (H&E) staining, Iba-1 immunohistochemistry, and computational brain current density modeling. Brain lesion occurred after anodal tDCS at and above 0.5 mA using a 25.0 mm2 electrode (electrode current density: 20.0 A/m2). Lesion initially occurred using smaller 10.6 mm2 or 5.3 mm2 electrodes at 0.25 mA (23.5 A/m2) and 0.5 mA (94.2 A/m2), respectively. Histological damage was correlated with computational brain current density predictions. Changes in microglial phenotype occurred in higher stimulation groups. Lesions were observed using anodal tDCS at an electrode current density of 20.0 A/m2, which is below the previously reported safety threshold of 142.9 A/m2 using cathodal tDCS. The lesion area is not simply predicted by electrode current density (and so not by charge density as duration was fixed); rather computational modeling suggests average brain current density as a better predictor for anodal tDCS. Nonetheless, under the assumption that rodent epicranial stimulation is a hypersensitive model, an electrode current density of 20.0 A/m2 represents a conservative threshold for clinical tDCS, which typically uses an electrode current density of 2 A/m2when electrodes are placed on the skin (resulting in a lower brain current density). 2.0 INTRODUCTION Transcranial direct current stimulation (tDCS) is a non-invasive method of brain stimulation used to modulate cortical excitability (Nitsche & Paulus, 2000). Conventional tDCS applies a small amount (1–2 mA) of direct current to the scalp using large (25–35 cm2) electrodes (Brunoni et al., 2012; Woods et al., 2016). Computational and animal models have shown that only a fraction of the applied current reaches the cortex, leading to neuronal polarization and excitability changes in the cortex (Datta et al., 2009a; Marquez-Ruiz et al., 2012; Rahman et al., 2013; Rohan, Carhuatanta, McInturf, Miklasevich, & Jankord et al., 2015) and hippocampus (Rohan et al., 2015; Kronberg, Bridi, Abel, Bikson, & Parra, 2017). Given its ability to affect the function of cortical neurons, tDCS has been investigated for a variety of medical and augmentative applications, such as depression (Brunoni et al., 2011; Loo et al., 2012), motor rehabilitation (Edwards et al., 2009), speech rehabilitation (Baker, Rorden & Fridriksson, 2010; Fridriksson, Richardson, Baker, & Rorden, 2011; Galletta et al., 2015), pain control (Fregni et al., 2006; Dasilva et al., 2012; Castillo-Saavedra et al., 2016), and working memory (Brunoni & Vanderhasselt, 2014). tDCS is considered a safe and well tolerated technique when proper protocols are followed (Bikson, Datta, & Elwassif, 2009; Kasschau et al., 2015; Nitsche & Paulus, 2015; Gbadeyan, Steinhauser, McMahon, & Meinzer, 2016; Palm et al., 2016; Woods et al., 2016). Nonetheless, as the application of tDCS becomes increasingly commonplace and indications for its use more widespread, additional work on tDCS safety is warranted for

2 DISTRIBUTION STATEMENT A. Approved for public release. Cleared, 88PA, Case #2017-5727.
supporting basic dosing guidelines (Peterchev et al., 2012; Bikson et al., 2016; Jackson et al., 2016). Initial safety limitations for tDCS were based upon literature from other electrical brain stimulation techniques. Nitsche et al., 2003 discussed safety of tDCS (Nitsche et al., 2003) by referencing safety standards in which pulsating current was applied directly to brain tissue (Yuen, Agnew, Bullara, Jacques, & McCreey, 1981; Agnew and McCreery, 1987; McCreery, Agnew, Yuen, & Bullara, 1990; Merrill, Bikson, & Jefferys, 2005). In 2009, Liebetanz et al. conducted a canonical study in rodents to better define the minimum dosage at which cortical tissue damage occurs during cathodal tDCS: 0.5 mA for a stimulation duration of 10 min (Liebetanz et al., 2009). The findings reported by Liebetanz are widely cited in tDCS literature and have served as a guide for clinical safety limits (Holland & Crinion, 2012; Brunoni, Boggio, Ferrucci, Priori, & Fregni, 2013; Truong, Magerowski, Blackburn, Bikson & Alonso-Alonso, 2013). Though not extensively tested, Liebetanz suggested the metric of average electrode current density (A/m2), calculated as the applied current divided by the electrolyte-body contact area – corresponding in their electrode montage to 143 A/m2 – along with electrode charge density (C/m2), which multiplies current density by time, as two generalized safety parameters for dosing guidelines (Bikson et al., 2009). Building upon this framework for rodent safety studies, other tDCS paradigms were evaluated for lesion induction in the mouse (Rueger et al., 2012; Pikhovych et al., 2016a, Pikhovych et al., 2016b), where the lowest current intensity that produced detectable cortical damage using a transcranial electrode paradigm was 0.5 mA (220 A/m2 electrode current density) for both anodal and cathodal tDCS groups (Pikhovych et al., 2016b). However, damage was not consistently observed for 0.5 mA cathodal and 1.0 mA anodal stimulation groups (Pikhovych et al., 2016a, Pikhovych et al., 2016b), which indirectly suggests a role for polarity. More recently, lesions have been reported at an anodal current intensity of 0.6 mA (47.8 A/m2 electrode current density) (Gellner, Reis, & Fritsch, 2016), suggesting the lesion threshold in rats may be lower than previously reported. Rodent studies evaluating tDCS safety through microglial analysis have shown microglial activation can occur after anodal or cathodal stimulation at 0.5 mA for 15 min (Rueger et al., 2012) (c.f. (Liebetanz et al., 2009)). Microglial changes in morphology associated with neurodegeneration after anodal tDCS have been reported at current intensities as low as 0.4 mA (31.8 A/m2 electrode current density) (Gellner et al., 2016). Considering the available lesion safety data and the variations in polarity, animal, animal size, and electrode area used across studies, the robustness of average electrode current density (or electrode charge density) as a generalized predictor of injury remains unclear, undermining the use of animal data to support clinical safety thresholds. Indeed, computational current models notably show brain current density is not simply a function of the electrode current density, but also anatomy and details of electrode size and position (Datta et al., 2009a, Datta, Truong, Minhas, Parra, & Bikson, 2012; Miranda, Faria, & Hallett, 2009; Saturnino, Antunes, & Thielscher, 2015). Therefore, animal models of tDCS safety can benefit from being updated in regards to: 1) variation of stimulation polarity/dose (anodal vs. cathodal); 2) alternative indications of injury (Wachter et al., 2011; Rueger et al., 2012; Wong, Jow, Kaizaki, Fan, & Tein, 2014; Gellner et al., 2016); and, 3) given computational current models show brain current density is not a simple, linear function of the applied current or electrode current density (Datta

3 DISTRIBUTION STATEMENT A. Approved for public release. Cleared, 88PA, Case #2017-5727.
et al., 2009a, Datta et al., 2012; Miranda et al., 2009; Saturnino et al., 2015), the suitability of electrode parameters to set a safety threshold. We initially developed and report data from an in vivo rodent model of anodal tDCS using a 25.0 mm2 electrode and evaluated the effect of various stimulation dosages on tissue damage. We evaluated current intensity (0.15–2.5 mA) which span the range of previously established safety limits (Liebetanz et al., 2009; Rueger et al., 2012; Gellner et al., 2016). Ionized calcium-binding adapter molecule 1 (Iba1) activation was also examined as a more sensitive predictor of brain lesion. Brain tissue histology indicated lesions at a lower electrode current density (20.0 A/m2) than previously reported. Therefore, we systematized our next experiments to critically evaluate this 20.0 A/m2 limit while controlling the number and area of electrodes (10.6 mm2 and 5.3 mm2). Dissociating current intensity from electrode current density (e.g. same current intensity but different electrode current density), combined with high-resolution FEM computational models of current flow in rat, supported testing the hypothesis that brain current density, rather than simply electrode current intensity or electrode current density, predicts the propensity for lesions. This has important implications for how animal models of tDCS, especially aimed at safety, are rationalized and applied to develop clinical guidelines. 3.0 MATERIALS and METHODS All procedures were approved by the Wright-Patterson Air Force Base (WPAFB) institutional animal care and use committee and performed in accordance with the 2011 Guide for the Care and Use of Laboratory Animals. The experiments were performed on 32 male Sprague-Dawley rats (Charles River, Wilmington, MA), weighing 300-500 grams. Rats were pair-housed under standard laboratory conditions, including a 12 hour light/dark cycle with food and water available ad libitum. Following a ten day quarantine/acclimation period, all rats underwent surgery to place an electrode on the skull. After surgery, rats were singly housed and allowed to recover at least 7 days prior to inclusion in any experiments. 3.1 25.0 mm² electrode placement surgery Rats were anesthetized with isoflurane (Piramal Critical Care, Shop Med Vet, Mettawa, IL) using 5% induction and 2–3% maintenance. Rats were treated with standard pre- and postsurgical care. The rat was placed into a stereotaxic apparatus and a caudo-rostral incision was made on top of the head, followed by a lateral incision was made at the shoulders. The periosteum was removed, the skull wiped clean, and a head electrode of 0.25 cm² (Valutrode, Axelgaard Manufacturing Co., Fallbrook, CA, 1.25-inch diameter electrode cut to 5 mm x 5 mm) with SignaGel (Parker Laboratories, Fairfield, NJ) was applied to the skull with the center of the electrode resting on the midline 2.5 mm caudal to Bregma (rostro-caudal: 0.0 mm to -5.0 mm). The insulated electrode wire was tunneled subcutaneously and exited the lateral incision made at shoulders. The electrode was held in place by a plastic head clamp which caught on the ridges of the skull (AFRL designed and produced) and two types of adhesives: C&B Metabond Adhesive Luting Cement (Parkell Inc., Edgewood, NY) was applied to the electrode and skull to create an initial bond, followed by acrylic cement (Stoelting, Co. Fisher Scientific, Pittsburgh, PA) to bond the electrode to the clamp. Incisions were sutured closed around cement and wire. The rats were allowed to recover from surgery for at least 1 week prior to inclusion in experiments. Prior to

4 DISTRIBUTION STATEMENT A. Approved for public release. Cleared, 88PA, Case #2017-5727.
stimulation, rats were randomly placed into six anodal tDCS treatment groups: 0.15 mA (n = 4), 0.3 mA (n = 4), 0.5 mA (n = 2), 1.0 mA (n = 4), 2.5 mA (n = 3), and sham stimulation (n = 3). 3.2 10.6 mm² and 5.3 mm² electrode placement surgery Rats were prepared as described above and an electrode jacket with a surface area of 5.3 mm2 (DIXI Medical, Besançon, France) was placed at _2.5 mm Bregma and 2.5 mm left of sagittal suture. The electrode jacket was secured with FUJI I glass ionomer (Dental Wholesale Direct, FL, USA), and a layer of dental cement was placed on top to further secure the electrode. Prior to stimulation, rats were assigned into 2 groups based on electrode placement: 1) a single 5.3 mm2
electrode placed _2.5 mm Bregma and _2.5 mm left of the sagittal line (n = 7), and 2) two 5.3 mm2 electrodes placed at _2.5 mm Bregma and 2.5 mm from the midline bilaterally, for a total electrode surface area of 10.6 mm2 (n = 5). Prior to stimulation, the rats were assigned into stimulation groups based on lesion results from the previous 25.0 mm2 electrode experiment. The single electrode stimulation group was subdivided into groups based on current intensity: 2.0 mA (n = 1), 1.0 mA (n = 1), 0.75 mA (n = 1), 0.5 mA (n = 2), 0.05 mA (n = 1), and Sham (n = 1). The dual electrode group was also divided into subgroups based on current intensity: 2.0 mA (n = 1), 1.0 mA (n = 1), 0.5 mA (n = 1), 0.25 mA (n = 1), and sham (n = 1). 3.3 tDCS application
3.3.1 25.0 mm² electrode stimulation Rats were anesthetized with isoflurane (Piramal Critical Care, Shop Med Vet, Mettawa, IL), using a 5% induction and 2–3% maintenance schedule. The reference electrode (8.04 cm², Valutrode, Axelgaard Manufacturing Co., Fallbrook, CA) was placed between the shoulders and SignaGel (Parker Laboratories, Fairfield, NJ) electrode gel was used as a conducting medium. A Petflex cohesive bandage (Andover, Shop Med Vet, Mettawa, IL) was wrapped around the midsection of the rat’s torso to hold the reference electrode in place. tDCS was applied using a constant current stimulator (Magstim DC-stimulator, NeuroConn, Ilmenau, Germany) for 60 min in addition to a ramp-up/ramp-down period of 10 s. The sham rat group experienced the same experimental set-up as the treatment group, except the constant current stimulator was off. The highest current the stimulator could provide (based on the current-delivery limitations of the stimulator) is 5.0 mA, which was intended to be the highest stimulation group. Throughout the stimulation at the highest intensity, however, the resistance levels of the circuit would increase and cause the stimulator to shut off. Following the automated shut down, the device was restarted at a current intensity 0.5 mA below the previous current intensity. The total duration remained at 60 min, but the current intensity varied during stimulation from 5.0 mA to 2.0 mA for the highest intensity group. The average intensity over the 60-min duration for this group was approximately 2.5 mA and is referred to as the 2.5 mA condition throughout this manuscript.
3.3.2 10.2 mm² and 5.3 mm² electrode stimulation Rats were anesthetized with isoflurane (Piramal Critical Care, Shop Med Vet, Mettawa, IL), using a 5% induction and 2–3% maintenance schedule. The reference electrode (surface area: 1.3 cm²; DIXI medical, Besançon, France) was placed on the chest and either saline or SignaGel was used as the electrolyte (Table 1). A Petflex bandage was wrapped around the
5 DISTRIBUTION STATEMENT A. Approved for public release. Cleared, 88PA, Case #2017-5727.
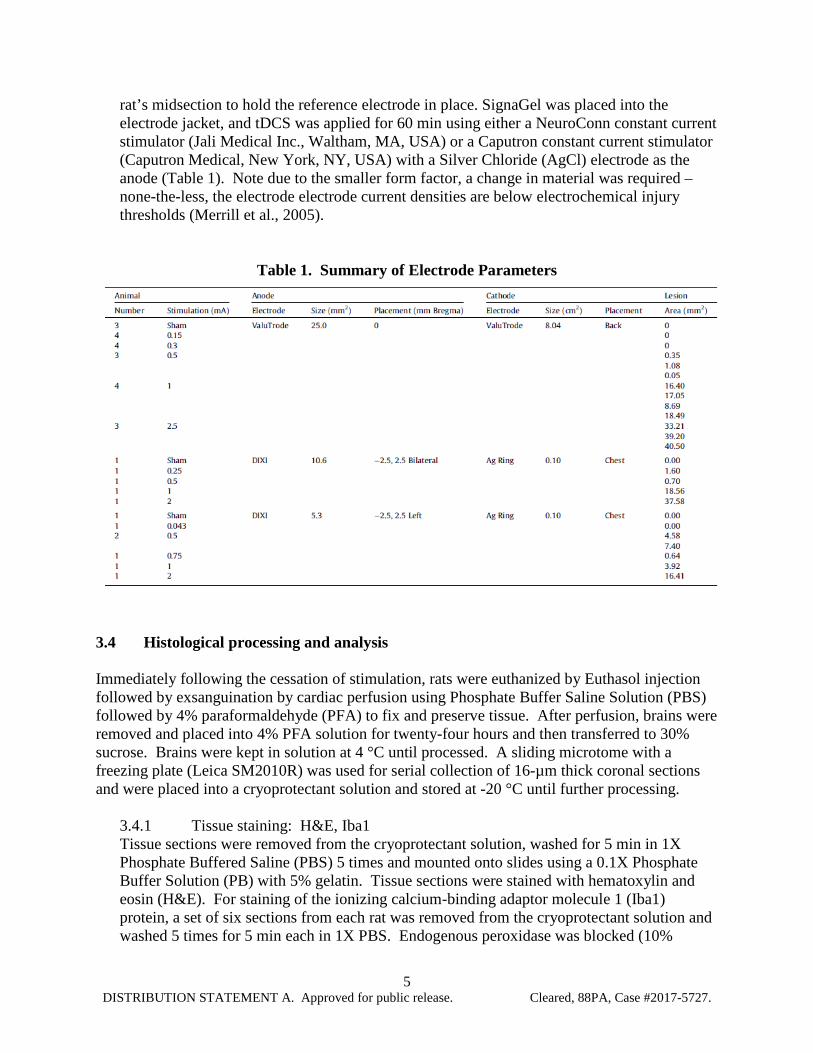
rat’s midsection to hold the reference electrode in place. SignaGel was placed into the electrode jacket, and tDCS was applied for 60 min using either a NeuroConn constant current stimulator (Jali Medical Inc., Waltham, MA, USA) or a Caputron constant current stimulator (Caputron Medical, New York, NY, USA) with a Silver Chloride (AgCl) electrode as the anode (Table 1). Note due to the smaller form factor, a change in material was required – none-the-less, the electrode electrode current densities are below electrochemical injury thresholds (Merrill et al., 2005).
Table 1. Summary of Electrode Parameters
3.4 Histological processing and analysis Immediately following the cessation of stimulation, rats were euthanized by Euthasol injection followed by exsanguination by cardiac perfusion using Phosphate Buffer Saline Solution (PBS) followed by 4% paraformaldehyde (PFA) to fix and preserve tissue. After perfusion, brains were removed and placed into 4% PFA solution for twenty-four hours and then transferred to 30% sucrose. Brains were kept in solution at 4 °C until processed. A sliding microtome with a freezing plate (Leica SM2010R) was used for serial collection of 16-µm thick coronal sections and were placed into a cryoprotectant solution and stored at -20 °C until further processing.
3.4.1 Tissue staining: H&E, Iba1 Tissue sections were removed from the cryoprotectant solution, washed for 5 min in 1X Phosphate Buffered Saline (PBS) 5 times and mounted onto slides using a 0.1X Phosphate Buffer Solution (PB) with 5% gelatin. Tissue sections were stained with hematoxylin and eosin (H&E). For staining of the ionizing calcium-binding adaptor molecule 1 (Iba1) protein, a set of six sections from each rat was removed from the cryoprotectant solution and washed 5 times for 5 min each in 1X PBS. Endogenous peroxidase was blocked (10%
6 DISTRIBUTION STATEMENT A. Approved for public release. Cleared, 88PA, Case #2017-5727.
methanol, 3% H2O2 in PBS) for 15 min and slices were then transferred into blocking buffer (PBS solution with 5% Triton-X100 and 2% goat serum) for one hour. Sections were then incubated with the rabbit polyclonal anti-ionized calcium binding adapter molecule antibody (Iba1, Wako Chemicals USA, Inc., Richmond, VA, USA, 1: 3000 dilution) in blocking buffer solution refrigerated overnight on a Thermo Scientific MaxQ 4000 shaker at 75 rpm. The sections were washed and incubated for 2 h at room temperature with the biotinylated secondary goat anti-rabbit antibody (Vector Laboratories, Burlingame, CA at 1: 3000 dilution) in blocking buffer solution for 2 h. Sections were washed again and incubated for 1 h with Vectastain Elite ABC kit (Vector Laboratories, Burlingame, CA, USA) for enzyme conjugation. Finally, sections were stained using 0.05% diaminobenzidine and 0.5% nickel ammonium sulfate and 0.03% H2O2. Tissue sections were then mounted onto slides and allowed to dry at room temperature overnight. Subsequently, sections were counterstained with H&E as previously described for co-localization of lesion and microglial cells. DPX mountant (Sigma, Saint Louis, MO, USA) was used as a coverslip adhesive. 3.4.2 Image analysis All images were collected using an Olympus BX63 microscope with a Q100 Blue Camera designed for CellSens Dimension Software. Researchers quantifying lesion were blinded to treatment groups throughout tissue processing, image collection and analysis. CellSens Dimension software was used to determine and quantify the area of lesion damage, and a Rat Brain Atlas (Paxinos & Watson, 2007) was used to order sections rostral to caudal according to their distance from Bregma (mm). Lesion was visually identified by parenchymal discoloration and striation in addition to visible gross cellular alterations such as edema, karyolysis and apparent cell loss in the outermost cortical layer. Percent area of Iba-1 positive staining was quantified in cortical samples per electrode placement group using 10X magnification. The software used hue, saturation and intensity (HSI) to segment the image fields. Thresholds for object segmentation were established with images of high and low levels of staining to identify positive staining over any background level. These limits were held constant for the analysis of every section in the study. Cell body area and roundness outcomes were measured using the count and measure component from CellSens Dimension software. Briefly, cell bodies were outlined from a sampled cortical area from each section. Placement of the region of interest analyzed was kept constant at all sections and positioned in areas where current-induced lesions were mostly likely to occur. Cell body area (in µm²) and roundness were measured, where perfectly round objects are scored as 1.
3.5 Computational modeling To determine the effect of various current densities on brain lesion, a state-of-the-art model was constructed from an MRI (7.0 Tesla 70/30 Bruker Biospec) and micro-CT scan (Siemens Inveon) of a female rat (Song, Truong, Bikson, & Martin, 2015).
3.5.1 MRI data collection and segmentation MRI resolution was 0.282-mm, as previously mentioned (Song et al., 2015). The scans were segmented into 9 tissues: skin, skull, cerebral spinal fluid (CSF), air, gray matter, white matter, hippocampus, cerebellum, and spinal cord. A Rat Brain Atlas (Paxinos & Watson,

7 DISTRIBUTION STATEMENT A. Approved for public release. Cleared, 88PA, Case #2017-5727.
2007) was used to identify the hippocampal region of the brain, and the remaining brain regions were appropriately grouped as either gray or white matter. Manual segmentation was used to generate an initial segmentation of scalp, skin, CSF, air, gray matter, white matter, hippocampus, cerebellum, and spinal cord. Tissue continuity was verified after segmentation by extensively reviewing the data, and further manual adjustments were made to guarantee continuity and improve the segmentation accuracy to closely match the tissue masks to the real anatomy of the rodent using ScanIP 7.0 (Simpleware Ltd, Exeter, UK).
3.5.2 Modeling of tDCS The three in vivo electrode placement protocols described above were modeled in SolidWorks (Dassault Systemes Corp. Waltham, MA) and imported into ScanIP for meshing. Three montages were modeled: 1) 5 mm x 5 mm anode (surface area: 23.21 mm2) placed on the skull at 0.0 mm Bregma; 2) a single 5.3 mm2 electrode (surface area: 4.84 mm2) placed on the skull at – 2.5 mm Bregma and 2.5 mm left of the sagittal suture; and 3) two 5.3 mm2 electrodes (total surface area: 9.68 mm2) placed on the skull at -2.5 mm Bregma and 2.5 mm bilaterally from the sagittal suture. The first montage used an 8.04 cm2 cathode placed between the shoulder blades, while the last two used a 1.3 cm2 cathode placed on the chest. An adaptive tetrahedral meshing algorithm was used in ScanIP to generate meshes of 8 x 10⁶ quadratic elements. FEM models were created in COMSOL Multiphysics 4.3 (COMSOL, Inc., Burlington, MA) using the meshes mentioned above. Models were created using electrostatic volume conductor physics with material conductivities defined as follows (in S/m): skin, 0.465; skull, 0.01; CSF, 1.65; air, 1e-15; spinal cord, 0.126; gray matter, 0.276; white matter, 0.126; hippocampus, 0.126; cerebellum, 0.276; dental cement, 1e-15; electrode jacket, 1e-15; saline, 1.4; and electrode, 5.99e7. These conductivity values were taken from a combination of in vitro and in vivo measurements (Datta, Elwassif, & Bikson, 2009b; Minhas et al., 2010). Current boundaries were applied to simulate direct current stimulation, and internal boundaries between tissues were assigned the continuity condition (n * (J1 - J2) = 0), and the Laplace equation (∇ *(σ∇𝑉𝑉) = 0) was solved. The surface of the cathode was grounded (V = 0) while the surface of the anodes for the three stimulation montages had a current density at which lesion first appeared in vivo: 1) 20.0 A/m2; 2) 23.5 A/m2; and 3) 94.2 A/m2. All other exterior surfaces were electrically insulated, and brain current density data from the medial cortex between the most superficial regions of the corpus callosum were collected and averaged for analysis. High-resolution models predicted the concentration and distribution of brain current density for each in vivo stimulation group using the three electrode montages. Brain current density is shown for representative coronal sections in false-color, where brain current density values less than 0.34184 A/m2 are represented in blue, and brain current density values greater than 7.04619 A/m2 are presented in dark red. The maximum threshold was determined by preliminary analysis corresponding the first appearance of lesion in vivo.
3.5.3 Statistical analysis Statistical analysis was performed using SigmaPlot (SigmaPlot 11.0, San Jose, CA) for only the 25.0 mm2 electrode group unless otherwise noted. One-way analysis of variance

8 DISTRIBUTION STATEMENT A. Approved for public release. Cleared, 88PA, Case #2017-5727.
(ANOVA) was used for group comparisons followed by Tukey post hoc test. Statistical significance was established with p < 0.05 for all tests. Two-way ANOVA, three-way ANOVA, and one tailed t-tests were also used and are distinguished in the text.

9 DISTRIBUTION STATEMENT A. Approved for public release. Cleared, 88PA, Case #2017-5727.
4.0 RESULTS
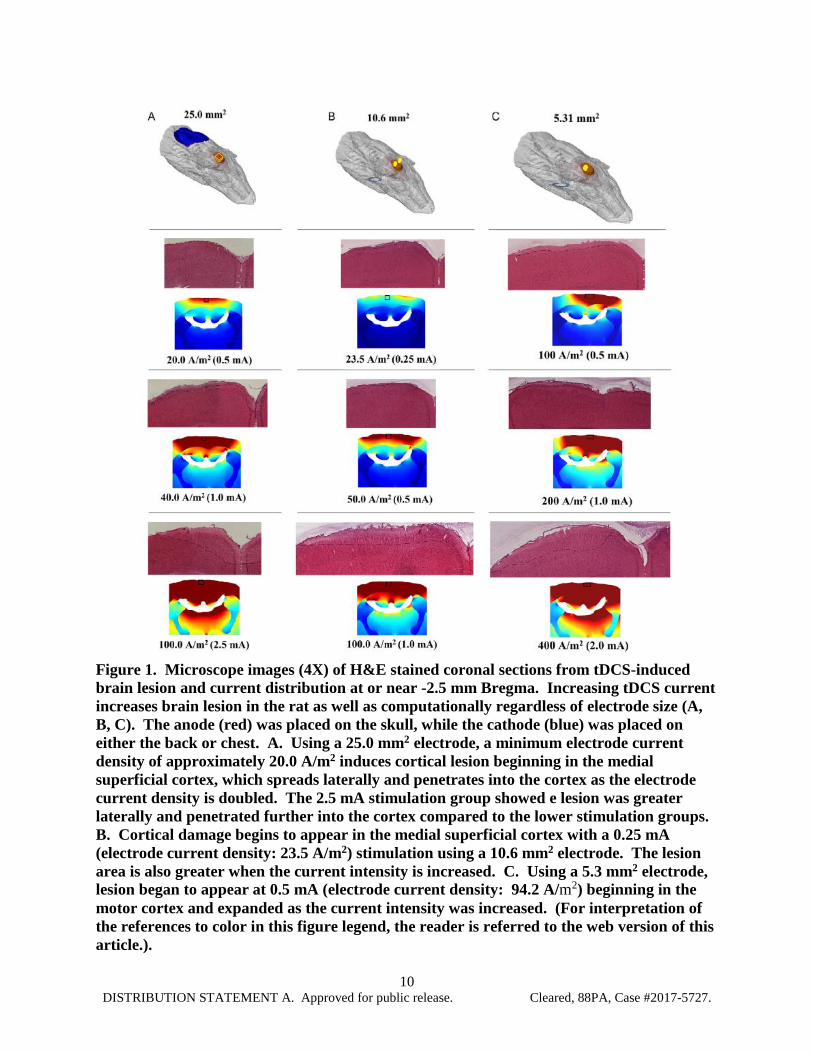
4.1 Brain lesion from anodal tDCS This study aimed to compare the effects of electrode size (25.0 mm2, 10.6 mm2, and 5.3 mm2) on brain lesion at various electrode current densities using anodal tDCS (Table 1). Computational modeling was used to further analyze and compare histological brain lesion (Fig. 1). No apparent lesions were present using the 25.0 mm2 electrode in the sham, 0.15 mA, or 0.3 mA stimulation groups, whereas the 0.5 mA, 1.0 mA, and 2.5 mA stimulation groups had increasingly larger areas of parenchymal discoloration and cellular alterations. Tissue sections from the 0.5 mA stimulation group showed small lesions at the medial cortex on the outer cortical surface (Fig. 1A). Compared to tissue sections obtained from the 0.5 mA group, morphological changes in the 1.0 mA group were more extensive, penetrating deeper into the cortex and expanding laterally across the outer cortical layer. Lesion in the 2.5 mA group was the most extensive compared to the other stimulation groups (Fig. 1A) (Table 2). FEM analysis predicts the greatest brain current density (above 7.04619 A/m2) will occur in the medial cortex and in deeper and more lateral brain regions at higher applied currents, such as the corpus callosum, hippocampus, and thalamus (Fig. 1A). Histologically, however, the alterations in morphology from each stimulation group were only observed in cortical brain regions. Histological lesion was not present in the Sham group using the dual electrode design (total electrode surface area: 10.6 mm2), but lesion was present on the medial cortex at current intensities at and above 0.25 mA (Fig. 1B). Lesions were more extensive for higher stimulation groups, spreading laterally and penetrating deeper into the tissue. Brain current density analysis of the dual electrode design at 0.25 mA showed brain current density was greatest in the superficial cortical regions. At 0.5 mA, brain current density above 0.34184 A/m2 was present in the entire medial cortex as well as the medial corpus callosum at 1.0 mA (Fig. 1B). Histological observation of tissue damage was only noted in the superficial cortical regions. The single 5.3 mm2 electrode design did not produce histological lesions in the Sham or 0.043 mA stimulation groups, but morphological changes were detected at 0.5 mA, 0.75 mA, 1 mA, and 2mA (Fig. 1C). The morphological changes began in the motor cortical region at 0.5 mA, and spread laterally across the outer cortex at higher stimulation groups; there was bilateral lesion present at 2.0 mA (Fig. 1C; bottom). The greatest brain current densities (above 7.04619 A/m2) for the single 5.3 A/m2 electrode occurred unilaterally in the cortex and corpus callosum with an applied current of 0.5 mA (Fig. 1C) and spread bilaterally at greater applied current intensities. Brain current densities above 0.34184 A/m2 were bilaterally present in the cortex and unilaterally in the CA1 region of the hippocampus using 1.0 mA. At 2.0 mA, brain current densities above 7.04619 A/m2 were seen bilaterally in the corpus callosum, hippocampus, and superficial thalamus (Fig. 1C).
10 DISTRIBUTION STATEMENT A. Approved for public release. Cleared, 88PA, Case #2017-5727.
Figure 1. Microscope images (4X) of H&E stained coronal sections from tDCS-induced brain lesion and current distribution at or near -2.5 mm Bregma. Increasing tDCS current increases brain lesion in the rat as well as computationally regardless of electrode size (A, B, C). The anode (red) was placed on the skull, while the cathode (blue) was placed on either the back or chest. A. Using a 25.0 mm2 electrode, a minimum electrode current density of approximately 20.0 A/m2 induces cortical lesion beginning in the medial superficial cortex, which spreads laterally and penetrates into the cortex as the electrode current density is doubled. The 2.5 mA stimulation group showed e lesion was greater laterally and penetrated further into the cortex compared to the lower stimulation groups. B. Cortical damage begins to appear in the medial superficial cortex with a 0.25 mA (electrode current density: 23.5 A/m2) stimulation using a 10.6 mm2 electrode. The lesion area is also greater when the current intensity is increased. C. Using a 5.3 mm2 electrode, lesion began to appear at 0.5 mA (electrode current density: 94.2 A/m2) beginning in the motor cortex and expanded as the current intensity was increased. (For interpretation of the references to color in this figure legend, the reader is referred to the web version of this article.).
11 DISTRIBUTION STATEMENT A. Approved for public release. Cleared, 88PA, Case #2017-5727.
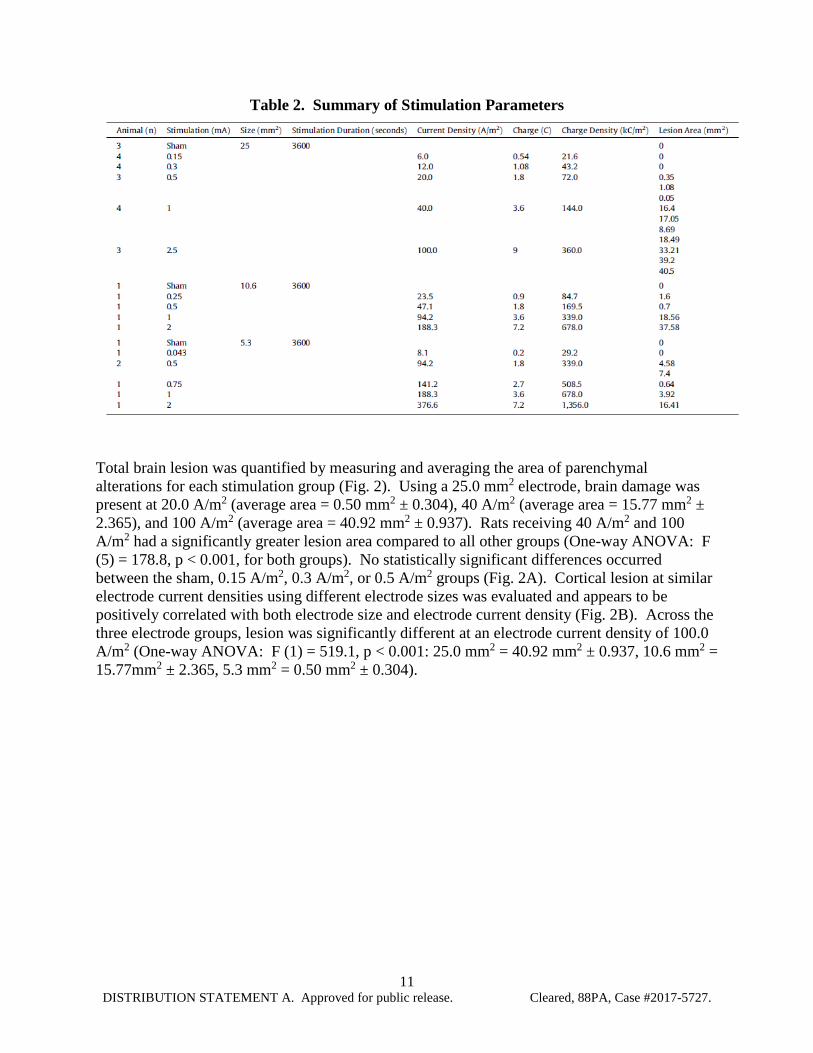
Table 2. Summary of Stimulation Parameters
Total brain lesion was quantified by measuring and averaging the area of parenchymal alterations for each stimulation group (Fig. 2). Using a 25.0 mm2 electrode, brain damage was present at 20.0 A/m2 (average area = 0.50 mm2 ± 0.304), 40 A/m2 (average area = 15.77 mm2 ± 2.365), and 100 A/m2 (average area = 40.92 mm2 ± 0.937). Rats receiving 40 A/m2 and 100 A/m2 had a significantly greater lesion area compared to all other groups (One-way ANOVA: F (5) = 178.8, p < 0.001, for both groups). No statistically significant differences occurred between the sham, 0.15 A/m2, 0.3 A/m2, or 0.5 A/m2 groups (Fig. 2A). Cortical lesion at similar electrode current densities using different electrode sizes was evaluated and appears to be positively correlated with both electrode size and electrode current density (Fig. 2B). Across the three electrode groups, lesion was significantly different at an electrode current density of 100.0 A/m2 (One-way ANOVA: F (1) = 519.1, p < 0.001: 25.0 mm2 = 40.92 mm2 ± 0.937, 10.6 mm2 = 15.77mm2 ± 2.365, 5.3 mm2 = 0.50 mm2 ± 0.304).
12 DISTRIBUTION STATEMENT A. Approved for public release. Cleared, 88PA, Case #2017-5727.
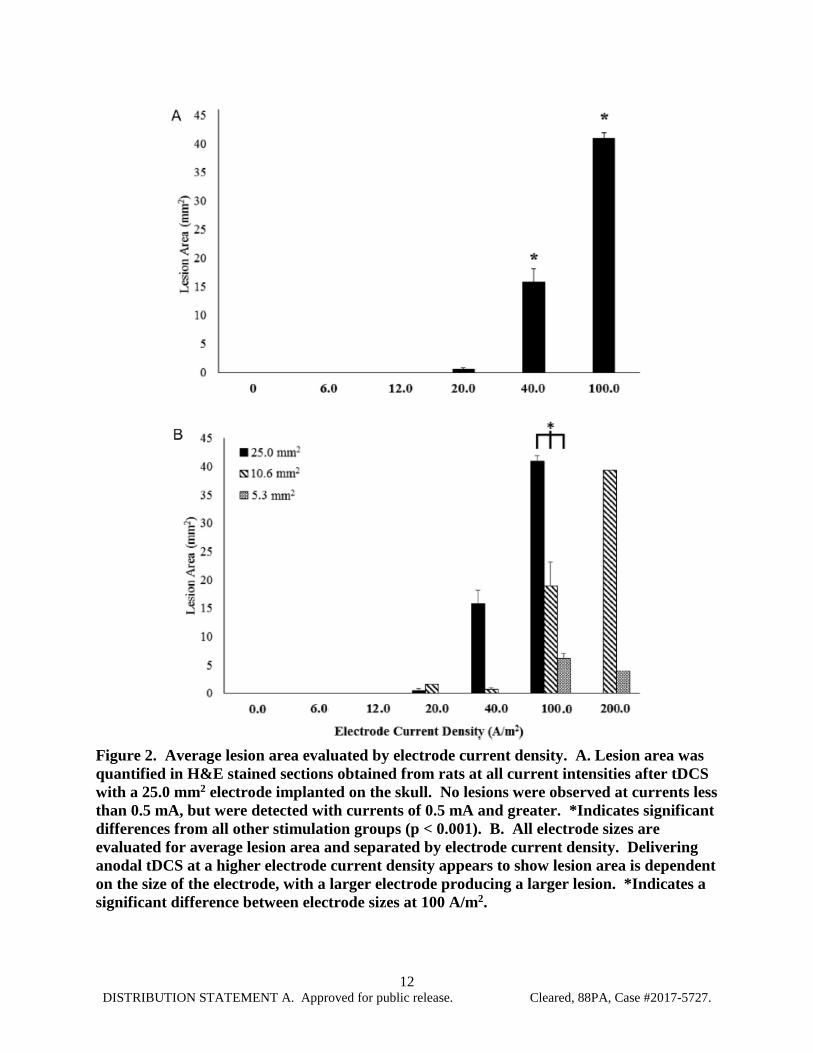
Figure 2. Average lesion area evaluated by electrode current density. A. Lesion area was quantified in H&E stained sections obtained from rats at all current intensities after tDCS with a 25.0 mm2 electrode implanted on the skull. No lesions were observed at currents less than 0.5 mA, but were detected with currents of 0.5 mA and greater. *Indicates significant differences from all other stimulation groups (p < 0.001). B. All electrode sizes are evaluated for average lesion area and separated by electrode current density. Delivering anodal tDCS at a higher electrode current density appears to show lesion area is dependent on the size of the electrode, with a larger electrode producing a larger lesion. *Indicates a significant difference between electrode sizes at 100 A/m2.
13 DISTRIBUTION STATEMENT A. Approved for public release. Cleared, 88PA, Case #2017-5727.
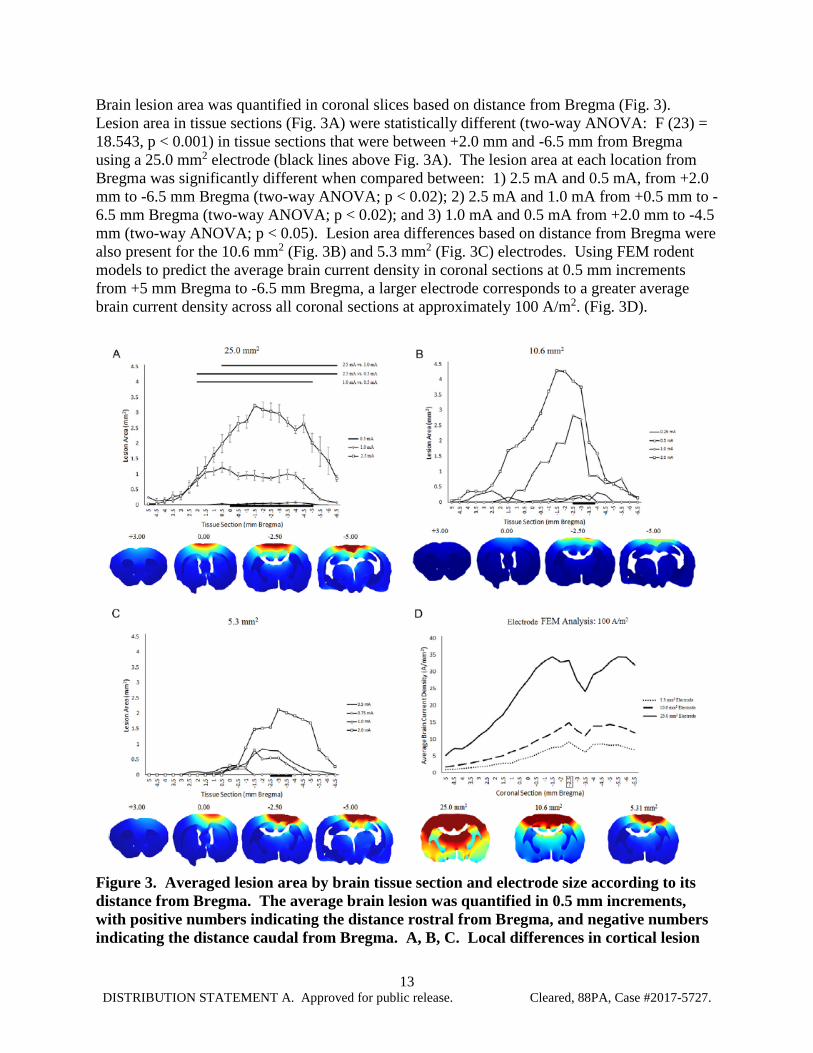
Brain lesion area was quantified in coronal slices based on distance from Bregma (Fig. 3). Lesion area in tissue sections (Fig. 3A) were statistically different (two-way ANOVA: F (23) = 18.543, p < 0.001) in tissue sections that were between +2.0 mm and -6.5 mm from Bregma using a 25.0 mm2 electrode (black lines above Fig. 3A). The lesion area at each location from Bregma was significantly different when compared between: 1) 2.5 mA and 0.5 mA, from +2.0 mm to -6.5 mm Bregma (two-way ANOVA; p < 0.02); 2) 2.5 mA and 1.0 mA from +0.5 mm to -6.5 mm Bregma (two-way ANOVA; p < 0.02); and 3) 1.0 mA and 0.5 mA from +2.0 mm to -4.5 mm (two-way ANOVA; p < 0.05). Lesion area differences based on distance from Bregma were also present for the 10.6 mm2 (Fig. 3B) and 5.3 mm2 (Fig. 3C) electrodes. Using FEM rodent models to predict the average brain current density in coronal sections at 0.5 mm increments from +5 mm Bregma to -6.5 mm Bregma, a larger electrode corresponds to a greater average brain current density across all coronal sections at approximately 100 A/m2. (Fig. 3D).
Figure 3. Averaged lesion area by brain tissue section and electrode size according to its distance from Bregma. The average brain lesion was quantified in 0.5 mm increments, with positive numbers indicating the distance rostral from Bregma, and negative numbers indicating the distance caudal from Bregma. A, B, C. Local differences in cortical lesion

14 DISTRIBUTION STATEMENT A. Approved for public release. Cleared, 88PA, Case #2017-5727.
for the 25.0 mm2 (A), 10.6 mm2 (B), and 5.3 mm2 (C) electrodes, separated by the stimulation group. FEM images show rostro-caudal changes in brain current density at representative coronal sections. The black line at the bottom of the figure indicates the location of the electrode. Significant differences between current intensity and the average lesion produced at specific locations from Bregma are indicated at the top of (A). D. FEM analysis of brain current density in the medial cortex corresponding with in vivo tissue sections (mm Bregma). The box around -2.5 mm Bregma indicates the location of the FEM images below the figure. We compared the reliability of electrode current density and average brain current density from models for predicting brain lesion area across the three electrode sizes (Fig. 4). For each electrode, lesion area increased linearly (R2 = 0.2442) with electrode current density, but the electrode’s sensitivity (slope) to lesion varied (Fig. 4A). At an electrode current density of 100 A/m2, the lesion area for the 5.3 mm2, 10.6 mm2, and 25.0 mm2 electrodes are 6.1 mm2, 18.9 mm2, and 40.9 mm2, respectively. Lesion area also increased linearly with brain current density (R2 = 0.8139) and sensitivity to lesion development was similar across the three electrode sizes (Fig. 4B).
Figure 4. Effect of electrode current density and brain current density on total brain lesion area. Electrode size was found to be a relevant variable when measuring tissue lesion obtained from brains stimulated at different current densities. A. Larger electrodes induced more lesion at similar electrode current densities. B. Across electrode sizes, cortical lesion was related to predicted brain current density (R = 0.8139). 4.2 Iba1 immunoreactivity To investigate whether tDCS affected inflammation in the brain, tissue sections were stained with an antibody against Iba1, a protein that is present in macrophages and microglia and upregulated when in their active state (Hanisch & Kettenmann, 2007). There were no differences in the percentage of positive Iba1 staining in the cortical areas immediately below the electrode (p = 0.50, data not shown). However, microglial morphology trended towards a more activated phenotype, with enlarged cell bodies and thickened processes, in stimulation groups

15 DISTRIBUTION STATEMENT A. Approved for public release. Cleared, 88PA, Case #2017-5727.
that produced lesion (0.5 mA and higher; Fig. 5). No statistical differences occurred in Iba1 positive cell body surface area (p = 0.61, Fig. 5E), but there was a statistical significance between current intensity and cell body roundness. At 1.0 mA, microglial cell bodies were significantly more rounded compared to all other groups (p = 0.02, Fig. 5F).
Figure 5. Micrograph representation (10X) of Iba1 immunoreactive microglia counterstained with H&E in brain sections from sham (A) or tDCS groups at different current intensities: 0.5 mA (B), 1.0 mA (C) and 2.5 mA (D). Cell body area (E) and roundness (F) were additionally measured and quantified to assess lesion-induced changes in microglial morphology. Immunostaining was digitally quantified by Olympus CellSens Dimension software and no differences were observed in the percentage of positive area for Iba1 positive microglia (E). 5.0 DISCUSSION We detected cortical lesions during anodal stimulation using an electrode current density of 20.0 A/m2, which is well below the commonly referenced cathodal electrode current density threshold of 142.9 A/m2 (Liebetanz et al., 2009). Histological analysis did not reveal any lesion at or below 0.3 mA using a 25.0 mm2 electrode, corresponding to an electrode current density of 12 A/m2. This was the greatest applied current intensity that could be administered for 60 min without evidence of tissue damage using the 25.0 mm2 electrode. The lesions from our study expanded laterally and penetrated deeper into the tissue as the electrode current density was increased (Fig. 1). However, the lesion induced from the Liebetanz study appeared to penetrate more deeply and less laterally with increasing electrode current densities, which may reflect differences in electrode montage (including position of the return electrode) or polarity specific mechanisms of injury (anodal vs. cathodal tDCS). Once correcting for average brain current density, our finding of comparable dose response across changes in electrode material, shape, and number are consistent with brain current flow, rather than superficial electrochemistry, causing injury. Microglial cells have been shown to increase
16 DISTRIBUTION STATEMENT A. Approved for public release. Cleared, 88PA, Case #2017-5727.
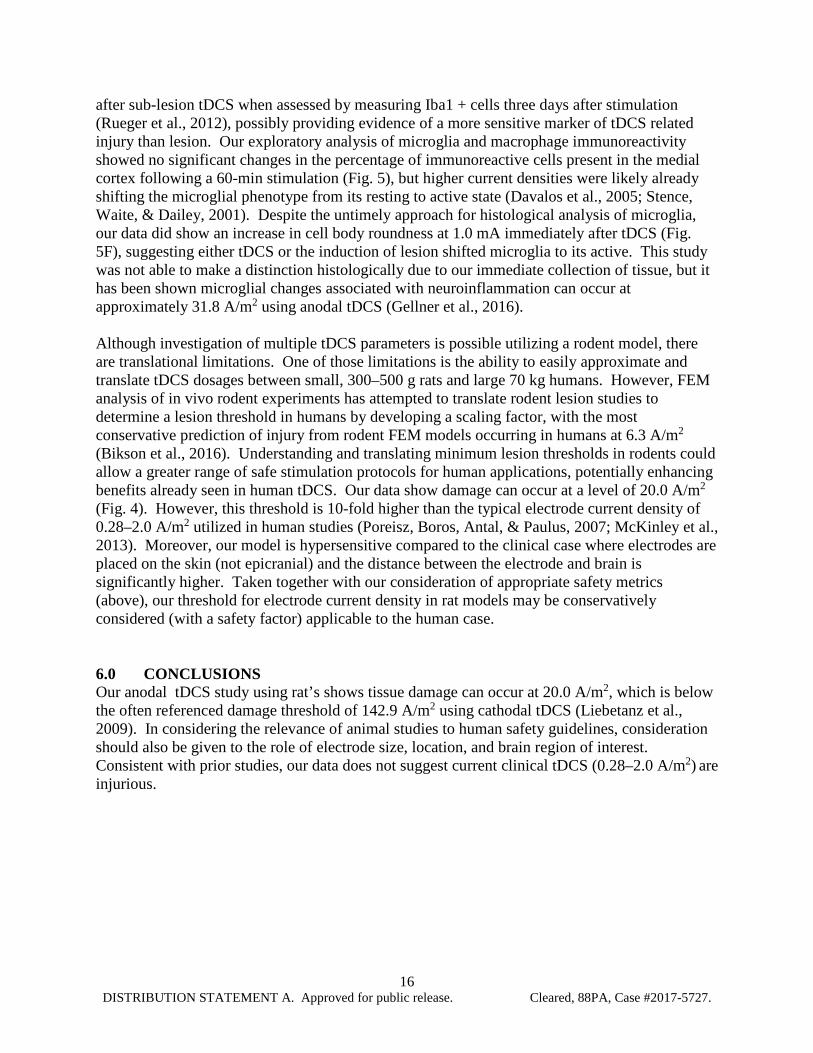
after sub-lesion tDCS when assessed by measuring Iba1 + cells three days after stimulation (Rueger et al., 2012), possibly providing evidence of a more sensitive marker of tDCS related injury than lesion. Our exploratory analysis of microglia and macrophage immunoreactivity showed no significant changes in the percentage of immunoreactive cells present in the medial cortex following a 60-min stimulation (Fig. 5), but higher current densities were likely already shifting the microglial phenotype from its resting to active state (Davalos et al., 2005; Stence, Waite, & Dailey, 2001). Despite the untimely approach for histological analysis of microglia, our data did show an increase in cell body roundness at 1.0 mA immediately after tDCS (Fig. 5F), suggesting either tDCS or the induction of lesion shifted microglia to its active. This study was not able to make a distinction histologically due to our immediate collection of tissue, but it has been shown microglial changes associated with neuroinflammation can occur at approximately 31.8 A/m2 using anodal tDCS (Gellner et al., 2016). Although investigation of multiple tDCS parameters is possible utilizing a rodent model, there are translational limitations. One of those limitations is the ability to easily approximate and translate tDCS dosages between small, 300–500 g rats and large 70 kg humans. However, FEM analysis of in vivo rodent experiments has attempted to translate rodent lesion studies to determine a lesion threshold in humans by developing a scaling factor, with the most conservative prediction of injury from rodent FEM models occurring in humans at 6.3 A/m2 (Bikson et al., 2016). Understanding and translating minimum lesion thresholds in rodents could allow a greater range of safe stimulation protocols for human applications, potentially enhancing benefits already seen in human tDCS. Our data show damage can occur at a level of 20.0 A/m2
(Fig. 4). However, this threshold is 10-fold higher than the typical electrode current density of 0.28–2.0 A/m2 utilized in human studies (Poreisz, Boros, Antal, & Paulus, 2007; McKinley et al., 2013). Moreover, our model is hypersensitive compared to the clinical case where electrodes are placed on the skin (not epicranial) and the distance between the electrode and brain is significantly higher. Taken together with our consideration of appropriate safety metrics (above), our threshold for electrode current density in rat models may be conservatively considered (with a safety factor) applicable to the human case. 6.0 CONCLUSIONS Our anodal tDCS study using rat’s shows tissue damage can occur at 20.0 A/m2, which is below the often referenced damage threshold of 142.9 A/m2 using cathodal tDCS (Liebetanz et al., 2009). In considering the relevance of animal studies to human safety guidelines, consideration should also be given to the role of electrode size, location, and brain region of interest. Consistent with prior studies, our data does not suggest current clinical tDCS (0.28–2.0 A/m2) are injurious.
17 DISTRIBUTION STATEMENT A. Approved for public release. Cleared, 88PA, Case #2017-5727.
7.0 REFERENCES Agnew, W.F., McCreery, D.B., 1987. Considerations for safety in the use of extracranial
stimulation for motor evoked potentials. Neurosurgery 20, 143– 147. Baker, J.M., Rorden, C., Fridriksson, J., 2010. Using transcranial direct-current stimulation to
treat stroke patients with aphasia. Stroke 41, 1229–1236. Bikson, M., Datta, A., Elwassif, M., 2009. Establishing safety limits for transcranial direct
current stimulation. Clin. Neurophysiol. 120, 1033–1034. Bikson, M., Grossman, P., Thomas, C., Zannou, A.L., Jiang, J., Adnan, T., et al., 2016. Safety of
transcranial direct current stimulation: evidence based update 2016. Brain Stimul. Brunoni, A.R., Vanderhasselt, M.A., 2014. Working memory improvement with noninvasive
brain stimulation of the dorsolateral prefrontal cortex: a systematic review and meta-analysis. Brain Cogn. 86, 1–9.
Brunoni, A.R., Ferrucci, R., Bortolomasi, M., Vergari, M., Tadini, L., Boggio, P.S., et al., 2011.
Transcranial direct current stimulation (tDCS) in unipolar vs. bipolar depressive disorder. Prog. Neuropsychopharmacol. Biol. Psychiatry 35, 96–101.
Brunoni, A.R., Nitsche, M.A., Bolognini, N., Bikson, M., Wagner, T., Merabet, L., et al., 2012.
Clinical research with transcranial direct current stimulation (tDCS): challenges and future directions. Brain Stimul. 5, 175–195.
Brunoni, A.R., Boggio, P.S., Ferrucci, R., Priori, A., Fregni, F., 2013. Transcranial direct current
stimulation: challenges, opportunities, and impact on psychiatry and neurorehabilitation. Front. Psychiatry 4, 19.
Castillo-Saavedra, L., Gebodh, N., Bikson, M., Diaz-Cruz, C., Brandao, R., Coutinho, L., et al.,
2016. Clinically effective treatment of fibromyalgia pain with high definition transcranial direct current stimulation: phase II open-label dose optimization. J. Pain 17, 14–26.
Dasilva, A.F., Mendonca, M.E., Zaghi, S., Lopes, M., Dossantos, M.F., Spierings, E.L., et al.,
2012. TDCS-induced analgesia and electrical fields in pain-related neural networks in chronic migraine. Headache 52, 1283–1295.
Datta, A., Bansal, V., Diaz, J., Patel, J., Reato, D., Bikson, M., 2009a. Gyri-precise head model
of transcranial direct current stimulation: improved spatial focality using a ring electrode versus conventional rectangular pad. Brain Stimul. 2, 201–207.
Datta, A., Elwassif, M., Bikson, M., 2009b. Bio-heat transfer model of tDCScomparison of
conventional pad versus ring electrode. Conf. Proc. IEEE Eng. Med. Biol. Soc., 670–673

18 DISTRIBUTION STATEMENT A. Approved for public release. Cleared, 88PA, Case #2017-5727.
Datta, A., Truong, D., Minhas, P., Parra, L.C., Bikson, M., 2012. Inter-individual variation during transcranial direct current stimulation and normalization of dose using MRI-derived computational models. Front. Psychiatry 3, 91.
Davalos, D., Grutzendler, J., Yang, G., Kim, J.V., Zuo, Y., Jung, S., et al., 2005. ATP mediates
rapid microglial response to local brain injury in vivo. Nat. Neurosci. 8, 752–758. Edwards, D.J., Krebs, H.I., Rykman, A., Zipse, J., Thickbroom, G.W., Mastaglia, F.L., et al.,
2009. Raised corticomotor excitability of M1 forearm area following anodal tDCS is sustained during robotic wrist therapy in chronic stroke. Restor. Neurol. Neurosci. 27, 199–207.
Fregni, F., Boggio, P.S., Lima, M.C., Ferreira, M.J., Wagner, T., Rigonatti, S.P., et al., 2006. A
sham-controlled, phase II trial of transcranial direct current stimulation for the treatment of central pain in traumatic spinal cord injury. Pain 122, 197– 209.
Fridriksson, J., Richardson, J.D., Baker, J.M., Rorden, C., 2011. Transcranial direct current
stimulation improves naming reaction time in fluent aphasia: a doubleblind, sham-controlled study. Stroke 42, 819–821.
Galletta, E.E., Cancelli, A., Cottone, C., Simonelli, I., Tecchio, F., Bikson, M., et al., 2015. Use
of computational modeling to inform tDCS electrode montages for the promotion of language recovery in post-stroke aphasia. Brain Stimul.
Gbadeyan, O., Steinhauser, M., McMahon, K., Meinzer, M., 2016. Safety, tolerability, blinding
efficacy and behavioural effects of a novel MRI-compatible, high definition tDCS set-up. Brain Stimul. 9, 545–552.
Gellner, A.K., Reis, J., Fritsch, B., 2016. Glia: a neglected player in non-invasive direct current
brain stimulation. Front. Cell. Neurosci. 10, 188. Hanisch, U.K., Kettenmann, H., 2007. Microglia: active sensor and versatile effector cells in the
normal and pathologic brain. Nat. Neurosci. 10, 1387–1394. Holland, R., Crinion, J., 2012. Can tDCS enhance treatment of aphasia after stroke?
Aphasiology 26, 1169–1191. Jackson, M.P., Rahman, A., Lafon, B., Kronberg, G., Ling, D., Parra, L.C., et al., 2016. Animal
models of transcranial direct current stimulation: methods and mechanisms. Clin. Neurophysiol. 127, 3425–3454.
Kasschau, M., Sherman, K., Haider, L., Frontario, A., Shaw, M., Datta, A., et al., 2015. A
protocol for the use of remotely-supervised transcranial direct current stimulation (tDCS) in multiple sclerosis (MS). J. Vis. Exp., e53542

19 DISTRIBUTION STATEMENT A. Approved for public release. Cleared, 88PA, Case #2017-5727.
Kronberg, G., Bridi, M., Abel, T., Bikson, M., Parra, L.C., 2017. Direct current stimulation modulates LTP and LTD: activity dependence and dendritic effects. Brain Stimul. 10, 51–58.
Liebetanz, D., Koch, R., Mayenfels, S., Konig, F., Paulus, W., Nitsche, M.A., 2009. Safety
limits of cathodal transcranial direct current stimulation in rats. Clin. Neurophysiol. 120, 1161–1167.
Loo, C.K., Alonzo, A., Martin, D., Mitchell, P.B., Galvez, V., Sachdev, P., 2012. Transcranial
direct current stimulation for depression: 3-week, randomised, sham-controlled trial. Br. J. Psychiatry 200, 52–59.
Marquez-Ruiz, J., Leal-Campanario, R., Sanchez-Campusano, R., Molee-Ardekani, B.,
Wendling, F., Miranda, P.C., et al., 2012. Transcranial direct-current stimulation modulates synaptic mechanisms involved in associative learning in behaving rabbits. Proc. Natl. Acad. Sci. U.S.A. 109, 6710–6715.
McCreery, D.B., Agnew, W.F., Yuen, T.G., Bullara, L., 1990. Charge density and charge per
phase as cofactors in neural injury induced by electrical stimulation. IEEE Trans. Biomed. Eng. 37, 996–1001.
McKinley, R.A., McIntire, L., Bridges, N., Goodyear, C., Bangera, N.B., Weisend, M.P., 2013.
Acceleration of image analyst training with transcranial direct current stimulation. Behav. Neurosci. 127, 936–946.
Merrill, D.R., Bikson, M., Jefferys, J.G., 2005. Electrical stimulation of excitable tissue: design
of efficacious and safe protocols. J. Neurosci. Methods 141, 171–198. Minhas, P., Bansal, V., Patel, J., Ho, J.S., Diaz, J., Datta, A., et al., 2010. Electrodes for high-
definition transcutaneous DC stimulation for applications in drug delivery and electrotherapy, including tDCS. J. Neurosci. Methods 190, 188–197.
Miranda, P.C., Faria, P., Hallett, M., 2009. What does the ratio of injected current to electrode
area tell us about current density in the brain during tDCS? Clin. Neurophysiol. 120, 1183–1187.
Nitsche, M.A., Paulus, W., 2000. Excitability changes induced in the human motor cortex by
weak transcranial direct current stimulation. J. Physiol. 527 (3), 633–639. Nitsche, M.A., Paulus, W., 2015. Vascular safety of brain plasticity induction via transcranial
direct currents. Neurology 84, 556–557. Nitsche, M.A., Nitsche, M.S., Klein, C.C., Tergau, F., Rothwell, J.C., Paulus, W., 2003. Level
of action of cathodal DC polarisation induced inhibition of the human motor cortex. Clin. Neurophysiol. 114, 600–604.
20 DISTRIBUTION STATEMENT A. Approved for public release. Cleared, 88PA, Case #2017-5727.
Palm, U., Segmiller, F.M., Epple, A.N., Freisleder, F.J., Koutsouleris, N., Schulte-Korne, G., et al., 2016. Transcranial direct current stimulation in children and adolescents: a comprehensive review. J. Neural. Transm. (Vienna).
Paxinos, G., Watson, C., 2007. The Rat Brain in Stereotaxic Coordinates. Elsevier Science. Peterchev, A.V., Wagner, T.A., Miranda, P.C., Nitsche, M.A., Paulus, W., Lisanby, S.H., et al.,
2012. Fundamentals of transcranial electric and magnetic stimulation dose: definition, selection, and reporting practices. Brain Stimul. 5, 435–453.
Pikhovych, A., Stolberg, N.P., Jessica Flitsch, L., Walter, H.L., Graf, R., Fink, G.R., et al.,
2016a. Transcranial direct current stimulation modulates neurogenesis and microglia activation in the mouse brain. Stem Cells Int. 2016, 2715196.
Pikhovych, A., Walter, H.L., Mahabir, E., Fink, G.R., Graf, R., Schroeter, M., et al., 2016b.
Transcranial direct current stimulation in the male mouse to promote recovery after stroke. Lab. Anim. 50, 212–216.
Poreisz, C., Boros, K., Antal, A., Paulus, W., 2007. Safety aspects of transcranial direct current
stimulation concerning healthy subjects and patients. Brain Res. Bull. 72, 208–214. Rahman, A., Reato, D., Arlotti, M., Gasca, F., Datta, A., Parra, L.C., et al., 2013. Cellular
effects of acute direct current stimulation: somatic and synaptic terminal effects. J. Physiol. 591, 2563–2578.
Rohan, J.G., Carhuatanta, K.A., McInturf, S.M., Miklasevich, M.K., Jankord, R., 2015.
Modulating hippocampal plasticity with in vivo brain stimulation. J. Neurosci. 35, 12824–12832.
Rueger, M.A., Keuters, M.H., Walberer, M., Braun, R., Klein, R., Sparing, R., et al., 2012.
Multi-session transcranial direct current stimulation (tDCS) elicits inflammatory and regenerative processes in the rat brain. PLoS One 7, e43776.
Saturnino, G.B., Antunes, A., Thielscher, A., 2015. On the importance of electrode parameters
for shaping electric field patterns generated by tDCS. Neuroimage120, 25–35. Song, W., Truong, D.Q., Bikson, M., Martin, J.H., 2015. Transspinal direct current stimulation
immediately modifies motor cortex sensorimotor maps. J. Neurophysiol. 113, 2801–2811. Stence, N., Waite, M., Dailey, M., 2001. Dynamics of microglial activation: a confocal time-
lapse analysis in hippocampal slices. Glia 33, 256–266. Truong, D.Q., Magerowski, G., Blackburn, G.L., Bikson, M., Alonso-Alonso, M., 2013.
Computational modeling of transcranial direct current stimulation (tDCS) in obesity: impact of head fat and dose guidelines. Neuroimage Clin. 2, 759–766.

21 DISTRIBUTION STATEMENT A. Approved for public release. Cleared, 88PA, Case #2017-5727.
Wachter, D., Wrede, A., Schulz-Schaeffer, W., Taghizadeh-Waghefi, A., Nitsche, M.A., Kutschenko, A., et al., 2011. Transcranial direct current stimulation induces polarity-specific changes of cortical blood perfusion in the rat. Exp. Neurol. 227, 322–327.
Wong, C.S., Jow, G.M., Kaizaki, A., Fan, L.W., Tien, L.T., 2014. Melatonin ameliorates brain
injury induced by systemic lipopolysaccharide in neonatal rats. Neuroscience 267, 147–156. Woods, A.J., Antal, A., Bikson, M., Boggio, P.S., Brunoni, A.R., Celnik, P., et al., 2016. A
technical guide to tDCS, and related non-invasive brain stimulation tools. Clin. Neurophysiol. 127, 1031–1048.
Yuen, T.G., Agnew, W.F., Bullara, L.A., Jacques, S., McCreery, D.B., 1981. Histological
evaluation of neural damage from electrical stimulation: considerations for the selection of parameters for clinical application. Neurosurgery 9, 292–299.

22 DISTRIBUTION STATEMENT A. Approved for public release. Cleared, 88PA, Case #2017-5727.
8.0 LIST OF SYMBOLS, ABBREVIATIONS, AND ACRONYMS tDCS transcranial Direct Current Stimulation PFA paraformaldehyde PBS Phosphate Buffered Saline FEM Finite Element Method H&E Hemotoxylin and Eosin ANOVA Analysis of Variance (ANOVA)