agenda
DESCRIPTION
Agenda. Introductions – Mary Lou Fleissner, Dr.PH. NIOSH Update – Terri Pearce, Ph.D. UConn Update – Eileen Storey, M.D. Questions and Answers. August 2004 Survey 25 Sigourney Street. Terri A. Pearce, Ph.D. – Project Officer - PowerPoint PPT PresentationTRANSCRIPT

Agenda• Introductions – Mary Lou Fleissner,
Dr.PH.• NIOSH Update – Terri Pearce, Ph.D.• UConn Update – Eileen Storey, M.D.• Questions and Answers

August 2004 Survey25 Sigourney Street
Terri A. Pearce, Ph.D. – Project Officer
National Institute for Occupational Safety and Health
Division of Respiratory Disease Studies Field Studies Branch
Morgantown, West Virginia

Questions about 25 Sigourney Street
• Has health improved?• Has the environment
improved?• What happens next?

Overall Summary• There is evidence of improvement in
symptoms reported in the 12 months prior to the 2004 survey
• Some occupants of 25 Sigourney Street continue to have ongoing respiratory illness
• Previous water damage is likely to have contributed to the health complaints
• Ongoing health surveys are required to assess the effectiveness of dampness remediation

NIOSH Investigation
• Union health hazard evaluation request in response to employee reports of physician-diagnosed diseases and symptoms
• Became a joint request when management learned of the concerns

NIOSH 2001 and 2002 Surveys
• September 2001 - Health questionnaire survey offered to everyone in the building
• April 2002 – Environmental sampling• June 2002 – Offered medical testing
to some employees

2001 and 2002 Findings
• Two to three times the expected number of employees with asthma or wheezing
• Persons reporting symptoms or respiratory diagnoses frequently had abnormal lung test results or asthma medication use
• Mold and endotoxin levels in dust were associated with respiratory and skin symptoms

Building Repairs• Exterior repairs to correct balcony
drainage, brick failure, window leaks, roof replaced
• Interior replacement of water and mold damaged sheetrock
• Interior repairs to bathroom core• Replacement of carpeting on some
floors• Vacuuming of carpets, chairs, and
partitions

Has the health improved?

2004 Post-Repair Survey
• 7-8 months after roof repair• 3-4 months after post-repair cleaning• Health Assessment – Questionnaires
and medical testing • Building Assessment – Dust sampling
and real-time monitoring

Participation
• 888 people in 2001 and 771 in 2004• About 70% for both surveys
481 290407
2001 2004

New Diagnoses from January 2003 to August
2004• In employees hired 2003-2004
1 asthma diagnosis
• In employees hired before 2003 6 asthma diagnoses 1 hypersensitivity pneumonitis diagnosis* 1 sarcoidosis diagnosis
* also diagnosed with asthma

Respiratory Illness - 2004
ConditionDRS (%)
DSS (%)
Current asthma 13.7 15.5
Hypersensitivity pneumonitis
2.1 0.3
Sarcoidosis 0.4 1.4

One or more symptoms in the
last 12 months - 2004
0
10
20
30
40
50
60
70
80
90
100
Lower Respiratory Upper Respiratory
Per
cen
t o
f P
arti
cip
ants
DRS
DSS

One or more symptoms each week for the last 4 weeks -
2004
0
10
20
30
40
50
60
70
80
90
100
Lower Respiratory Upper Respiratory
Pe
rce
nt
of
Pa
rtic
ipa
nts
DRS
DSS

Non-Respiratory Symptoms - 2004
In Last 12 months and 4 Weeks
0
10
20
30
40
50
60
70
80
90
100
HypersensitivityPneumonitis-like
Sick Buildingsymptoms
Itchy Skin
Per
cen
t o
f P
arti
cip
ants
Last 12 months
Weekly in last 4 weeks
Summary of 2004 questionnaire survey
• DRS and DSS similar for physician diagnoses and respiratory symptoms
• About half of participants reported lower and non-respiratory symptoms and 30% reported skin symptoms
• More upper than lower respiratory symptoms

Has the percent of symptomatic employees
changed between the 2001 and 2004 surveys?
• We compared the results for the 481 employees who participated in both surveys

2001Percent
2004Percent
Wheeze 26 18
Shortness of breath (SOB)
18 13
Chest tightness 20 14
Cough attack 30 15
Awakened by breathing difficulty
10 6
Asthma-like symptoms in the last 12 months, but not in the
last 4 weeks

2001Percent
2004Percent
Wheeze 12 17
Shortness of breath (SOB)
15 15
Chest tightness 18 16
Cough attack 22 22
Awakened by breathing difficulty
7 7
Asthma-like symptoms weekly in the last 4 weeks

Have you had symptoms that you think may be related to the building?
Comparison between 2001 and 2004 surveys
0
10
20
30
40
50
60
70
80
90
100
DRS DSS
Pe
rce
nt
of
Pa
rtic
ipa
nts
2001
2004

Summary of comparison2001/2002 to 2004
• There were decreases in the percent of employees reporting symptoms in the last 12 months but not occurring in the last 4 weeks
• There were no decreases in the percent of employees reporting symptoms occurring weekly in the last 4 weeks
• Decrease for DRS when asked: Have you had symptoms that you think
may be related to the building?
Did medical testing results change?
• Lung function test results show similar relationships with symptom status in 2002 and 2004
• Positive allergy skin tests have decreased for all symptom groups
• Persons with post-occupancy asthma continue to have fewer positive skin allergy tests than persons with pre-occupancy asthma

Abnormal Lung Function Tests – 2002 and 2004
Subgroup June 2002 August 2004
Respiratory Case Group
39% (44/114) 36% (26/72)
Fewer Symptoms Group
29% (16/55) 16% (8/50)
Comparison Group 11% (4/37) 18% (5/28)
The participants in the 2002 and 2004 surveys were not all the same people

Has the environment improved?

Median Dust Levels
0
0.1
0.2
0.3
0.4
0.5
0.6
0.7
0.8
0.9
1
2002 2004
Survey Year
Gra
ms
pe
r s
qu
are
me
ter
Building
DRS
DSS

Median Fungi Levels
0
1000
2000
3000
4000
5000
6000
7000
8000
9000
10000
2002 2004 IICRC SuggestedBackground Level
Co
lon
y F
orm
ing
Un
its
pe
r S
qu
are
Me
ter
BuildingDRSDSS
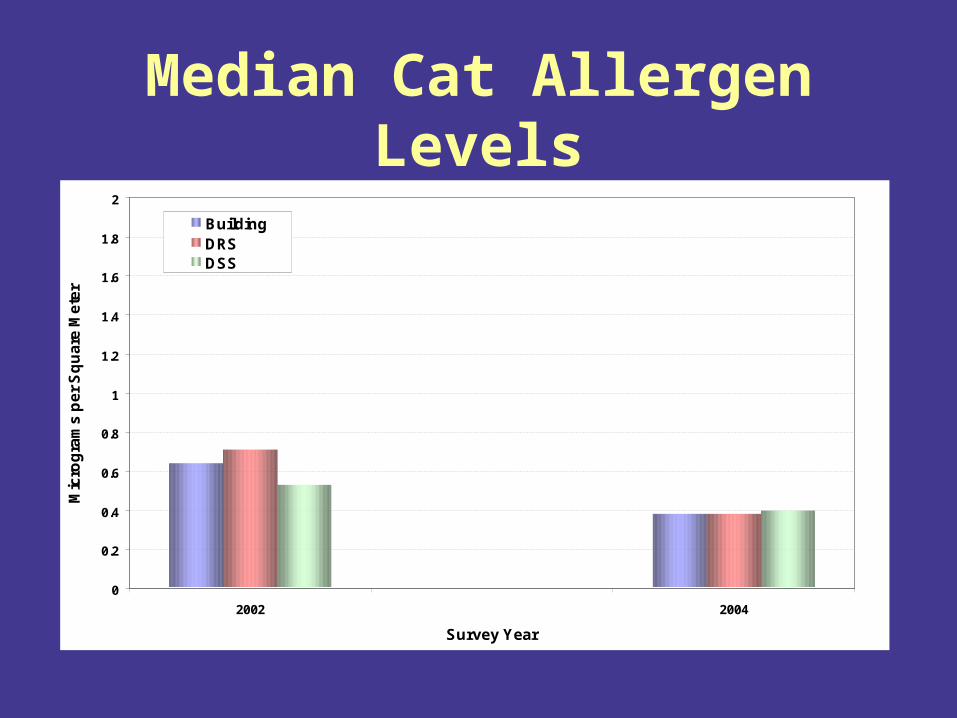
Median Cat Allergen Levels
0
0.2
0.4
0.6
0.8
1
1.2
1.4
1.6
1.8
2
2002 2004
Survey Year
Mic
rog
ram
s p
er
Sq
ua
re M
ete
r
BuildingDRSDSS

Have the dust levels changed?
• Amounts of dust in the carpet are somewhat higher than measured in 2002
• Amounts of culturable fungi and endotoxin in floor dust are also slightly higher than in 2002
• Amounts of cat and dog allergen are lower than in 2002

Real-time Monitoring
• Temperature and relative humidity were within the recommended ranges
• Some carbon dioxide measurements on 15th floor were above the recommended level
• Water activity of some carpets could support microbial growth

Have we answered the questions?
• There were decreases in the percent of employees reporting symptoms in the last 12 months but not occurring in the last 4 weeks
• There were no decreases in the percent of employees reporting symptoms occurring weekly in the last 4 weeks
• Dust levels were similar with fungi and endotoxin levels being somewhat higher in carpets with cat and dog allergen being somewhat lower

What happens next?
Next Steps• August health and environmental
surveys• Follow-up for new employees• Building systems evaluation

Overall Summary• There is evidence of improvement in
symptoms reported in the 12 months prior to the 2004 survey
• Some occupants of 25 Sigourney Street continue to have ongoing respiratory illness
• Previous water damage is likely to have contributed to the health complaints
• Ongoing health surveys are required to assess the effectiveness of dampness remediation

NIOSH - Morgantown
1-800-232-2114
Terri Pearce, Ph.D. – Project Officer