aggregate impacts of natural and human-made disasters in...
TRANSCRIPT

1
Aggregate Impacts of Natural and Human-Made Disasters in the Global Economy
(Are Global Market and Non-market Insurance Mechanisms Effective
to Cope with Natural and Human-Made Disasters?)
by
Yasuyuki Sawada
Faculty of Economics
University of Tokyo
and Research Institute for Economy,
Trade and Industry (RIETI)
Phone: +81-3-5841-5572
Fax: +81-3-5841-5521
Tomoaki Kotera*
Graduate School of Economics,
University of Tokyo
Phone: +81-3-3812-2111
Rima Bhattacharyay
Desautels Faculty of Management
McGill Univeristy
Phone: 514-398-4000
Fax: 514-398-3876
November 4, 2011
Abstract
This paper formally tests effectiveness of global market and non-market mechanisms against
natural and human-made disasters using cross-country panel data of 189 countries between
1968 and 2001. By doing so, we compare the degrees of effective incompleteness of
insurance mechanisms against various disasters quantitatively. We mostly reject the global
consumption risk sharing hypothesis. Around 20-40% of income shocks arising from
disasters could not be diversified away globally through a variety of market and non-market
insurance mechanisms. In the short term, natural disasters generate the largest negative
welfare impacts as captured by per capita GDP and consumption growth, followed by wars
and economic disasters. Intriguingly, in the long term, natural disasters and wars have
positive impacts on welfare. Wars affect large economies more than they affect small
economies while natural disasters affect small economies disproportionately.
Keywords: Risks; Natural Disasters; Man-Made Disasters
JEL classification codes: O1; Q54
* This research is an output of the project undertaken at the Research Institute of Economy, Trade
and Industry (RIETI), whose generous financial support is gratefully acknowledged. The authors
would like to thank Masahisa Fujita and the other participants of RIETI workshops for their useful
comments. The opinions expressed in this paper solely reflect those of the authors and do not
necessarily reflect those of RIETI or the Ministry of Economy, Trade and Industry of Japan.
2
I. Introduction
Recently, a number of high-profile natural and man-made disasters have hit both
developed and developing countries alike. We see vividly the ongoing 2011 devastating
earthquake, tsunami, and nuclear radiation crisis in Japan that has killed tens of thousands
people and resulting in damages of around 200 to 300 billion dollars (Cabinet Office, 2011),
the Eyjafjallajökull volcanic eruption in 2010 in Iceland that gravely disturbed the European
airline industry, and the 2010 oil spill in the Gulf coast cost about several billion in the short
term. Hundreds of thousands of lives were lost in the Indian Ocean tsunami, Hurricane
Katrina, and the earthquakes in central Chile, Haiti, Sichuan province of China, northern
Pakistan, and the Hanshin area of Japan. The 2008 global financial and economic crisis has
caused a worldwide problem, slowing global economic growth, with far-reaching effects
similar to the Great Depression of the 1930s. As such, man-made disasters can also generate
serious negative impacts not only on lives, but on the survivors' livelihoods (Barro, 2009).
Indeed, people around the world face a wide variety of risks arising from health,
weather, and policy related shocks (Fafchamps, 2001; Dercon, 2006). However, natural
disasters, (hydro-meteorological, geophysical, and biological disasters) and technology
related disasters such as chemical spills and transportation accidents, can generate the most
serious consequences ever known, disabling the head of a household or even an entire
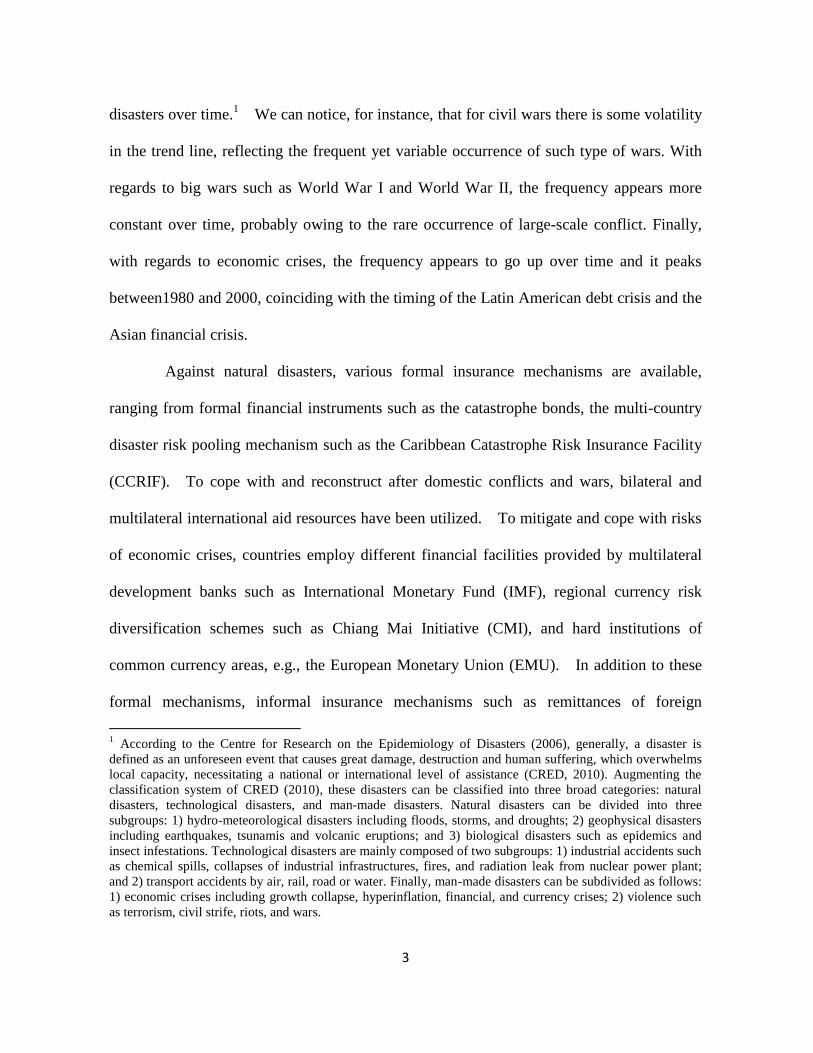
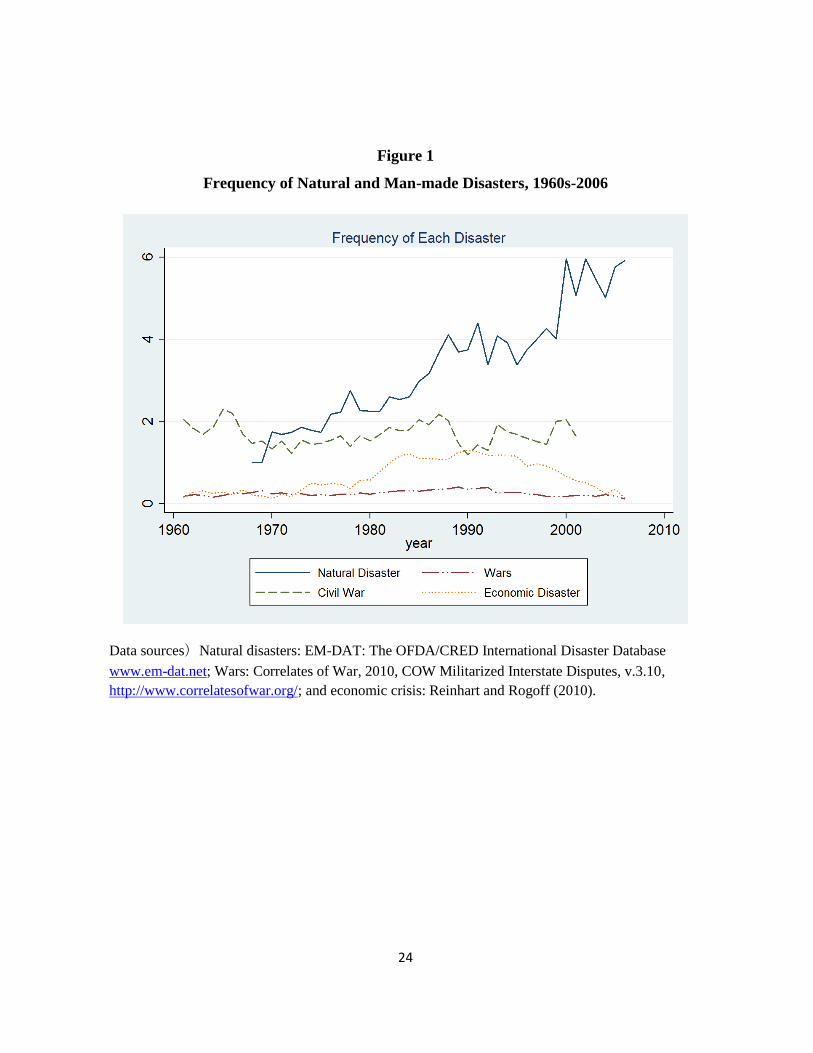
family or community. To compound issues, there is an apparent increasing trend of natural
disasters over the years (Figure 1). In addition to natural and technological disasters,
economies also face a specter of man-made disasters including financial crises, credit crunch,
terrorist attacks, civil conflicts, and wars. The economic and social costs of such disasters
have occurred continuously as per Figure 1, which indicates the frequency of man-made
3
disasters over time.1 We can notice, for instance, that for civil wars there is some volatility
in the trend line, reflecting the frequent yet variable occurrence of such type of wars. With
regards to big wars such as World War I and World War II, the frequency appears more
constant over time, probably owing to the rare occurrence of large-scale conflict. Finally,
with regards to economic crises, the frequency appears to go up over time and it peaks
between1980 and 2000, coinciding with the timing of the Latin American debt crisis and the
Asian financial crisis.
Against natural disasters, various formal insurance mechanisms are available,
ranging from formal financial instruments such as the catastrophe bonds, the multi-country
disaster risk pooling mechanism such as the Caribbean Catastrophe Risk Insurance Facility
(CCRIF). To cope with and reconstruct after domestic conflicts and wars, bilateral and
multilateral international aid resources have been utilized. To mitigate and cope with risks
of economic crises, countries employ different financial facilities provided by multilateral
development banks such as International Monetary Fund (IMF), regional currency risk
diversification schemes such as Chiang Mai Initiative (CMI), and hard institutions of
common currency areas, e.g., the European Monetary Union (EMU). In addition to these
formal mechanisms, informal insurance mechanisms such as remittances of foreign
1 According to the Centre for Research on the Epidemiology of Disasters (2006), generally, a disaster is
defined as an unforeseen event that causes great damage, destruction and human suffering, which overwhelms
local capacity, necessitating a national or international level of assistance (CRED, 2010). Augmenting the
classification system of CRED (2010), these disasters can be classified into three broad categories: natural
disasters, technological disasters, and man-made disasters. Natural disasters can be divided into three
subgroups: 1) hydro-meteorological disasters including floods, storms, and droughts; 2) geophysical disasters
including earthquakes, tsunamis and volcanic eruptions; and 3) biological disasters such as epidemics and
insect infestations. Technological disasters are mainly composed of two subgroups: 1) industrial accidents such
as chemical spills, collapses of industrial infrastructures, fires, and radiation leak from nuclear power plant;
and 2) transport accidents by air, rail, road or water. Finally, man-made disasters can be subdivided as follows:
1) economic crises including growth collapse, hyperinflation, financial, and currency crises; 2) violence such
as terrorism, civil strife, riots, and wars.
4
emigrants and charitable giving are available for victims of different disasters to cope with
them (Yang, 2008).
Yet, to the best of our knowledge, there has been no study to formally test
effectiveness of global market and non-market mechanism against natural and human-made
disasters.6 Also, there has been no unified study to compare the welfare costs of different
disasters, barring Barro (2009) who quantified aggregate welfare impacts of major
consumption disasters. This paper aims at bridging this gap in the existing literature by
6 There have been a number of macroeconomic and microeconomic studies undertaken on the
causes and consequences of different natural and man-made disasters (Sawada, 2007). Hallegatte and
Przyluski (2010) distinguish natural disaster impacts between direct and indirect losses where direct losses are
defined as the immediate consequences of disasters on physical capital stock. Indirect losses are defined as
damages which “are not provoked by the disaster itself, but by its consequences” such as the reduction in
economic output. On the direct costs, Kahn (2005) finds that while richer nations do not suffer fewer shocks
compared to poorer ones, the number of deaths, the number of people injured and the number of homeless
decreases significantly as income rises. This finding is also confirmed by Skidmore and Toya (2007) and Noy
(2009). With regards to the indirect costs of natural disasters, Stromberg (2007) notes that from 1980 to 2004,
the estimated economic cost from natural disasters was around $1 trillion. Skidmore and Toya (2002) employ
cross-country empirical analyses to examine the long run determinants of growth rate of real per-capita GDP
between 1960 and 1990. Intriguingly, they find that higher frequencies of climatic disasters are associated with
higher rates of human capital accumulation, increases in total factor productivity and long-run economic
growth. Furthermore, disasters affect growth by leading to improvements in total factor productivity.
As for man-made disasters, inflation crises induced by a large currency depreciation or a global food
crisis can also create negative welfare effects (Heady and Fan, 2010; Joachim von Braun, 2008). Indeed, the
number of complex economic crises also seems to be increasing. A cerebrated work by Kaminsky and
Reinhart (1999) reveals that the number of currency crises per year did not increase much during the 1980’s
and 1990’s, while the number of banking crises and of simultaneous banking-and-currency crises, i.e., “twin
crises,” increased sharply over the same period. A credit crunch arising from a financial crisis is likely to
damage small firms disproportionately because unlike large listed firms, the only source of their external
funding for investments are bank loans (Claessens et al., 2002, p.26). As a result, many owners of small
firms or businesses went bankrupt (Kang and Sawada, 2008). Such negative welfare impacts will also appear
with increased unemployment, decreased wage rates, and stagnant consumption (Sawada et. al, 2011).
With regards to violence related man-made disasters such as terrorisms, riots, civil conflicts, and
wars, it should be noted that the number of conflicts is not necessarily declining over time according to
information from the Uppsala Conflict Data Program <www.ucdp.uu.se/database>. Hess (2003) combines the
framework of Lucas’ (1987) welfare cost estimates with cross-country data sets, finding that the welfare cost
of conflicts and wars amounts to approximately eight percent of people’s current level of consumption.
Furthermore, Davis and Weinstein (2002), Battman and Miguel (2010), and Miguel and Roland (2011) find
that while the short-run impact of war is clearly disastrous, there is mixed evidence on how long the economic
effects on human capital and quality of life persist. Blomberg et al. (2004) finds that, on average, the incidence
of terrorism may have an economically significant negative effect on growth, albeit one that is considerably
smaller and less persistent than that associated with either external wars or internal conflict. They also find that
there are heterogeneities in the incidence and the economic consequences of terrorism.

5
making two contributions. First, we formulate and test the global risk sharing hypothesis
against disasters by using disaster related information as instrumental variables. Seocnd,
we carefully compare the relative impacts of damages arising from a wide variety of
disasters, ranging from hydro-meteorological disasters to civil conflicts. Our approach is to
employ cross-country panel data to quantify the degrees of negative welfare effects by these
disasters over time and across countries.
To preview our findings, we find overall evidence against consumption risk sharing
at the global level. in the short term, natural disasters generate the largest negative welfare
impacts which are followed by wars and economic disasters. Intriguingly, in the long term,
natural disasters and wars have positive impacts on per capita GDP growth. Wars affect
large economies more than small economies while natural disasters affect small economies
disproportionately.
The rest of this paper is organized as follows. In Section II, we set up the
econometric framework to estimate relative welfare impacts of different natural and
man-made disasters. Section III outlines the data sources, variables, and descriptive statistics
in our study. In Section IV, we present and interpret the empirical findings and discuss the
relative magnitude of welfare impacts of different disasters. The last section provides
concluding remarks together with related policy implications.
II. Theoretical and Econometric Framework
In the last fifteen years, there has been a remarkable progress in formulating and
testing full consumption risk sharing (Mace, 1991; Cochrane, 1991; Townsend, 1994;
Hayashi, Altonji, and Kotlikoff, 1996; Ligon, 1998; Ogaki and Zhang, 2004; Dubois et al.,
6
2008; Kinnan, 2010). Since the test of full consumption risk sharing can be interpreted as
a test of overall insurance mechanisms which are composed of formal market mechanisms,
informal or non-market mechanisms, and self-insurance mechanisms, the framework is an
appropriate benchmark model to compare the welfare impacts of various disasters
quantitatively.
The canonical model of consumption risk sharing shows that under complete
markets, idiosyncratic income changes should be absorbed by all other members in the same
insurance network. As a result, after controlling for aggregate shocks, idiosyncratic
income shocks should not affect consumption when risk sharing is efficient. To derive
these implications of complete consumption risk sharing or of consumption insurance, we
could solve a benevolent social planner’s problem by maximizing the weighted sum of
representative agent’s lifetime utilities given social resource constraints (Mace, 1991;
Cochrane, 1991; Townsend, 2004).7 In addition, we would follow the approach of Lewis
(1996) who incorporated consumption of nontradables to test the international consumption
risk sharing hypothesis.
Suppose that the world economy is composed of N infinitely-lived countries, each
facing serially independent income or endowment draws. In this pure exchange economy,
we can set up a social planner’s problem to derive conditions for full consumption
risk-sharing with non-tradables (Lewis, 1996):
7 In order to derive tractable and testable implications, we impose additional assumptions: First, all market
participants can perfectly observe uncertainty realizations. In other words, there is no private information and
thus the information structure is symmetric. Second, the contingent securities span the state space and thus
markets are complete. Third, the probability distribution of state realization, πi
(st
), is identical across agents;
i.e., agents have identical beliefs about future. Fourth, agents have identical utility functions with identical
time discount rates.
7
(1)
, ,
, , ..
,1
1 max
11
11}{
ttN
jt
tN
jt
tN
j
tT
jt
N
j
tT
jt
tN
jt
tT
jt
t
t s
t
j
N
j
j
,cc
ssysc
ssyscts
scscusπδ
λtNT
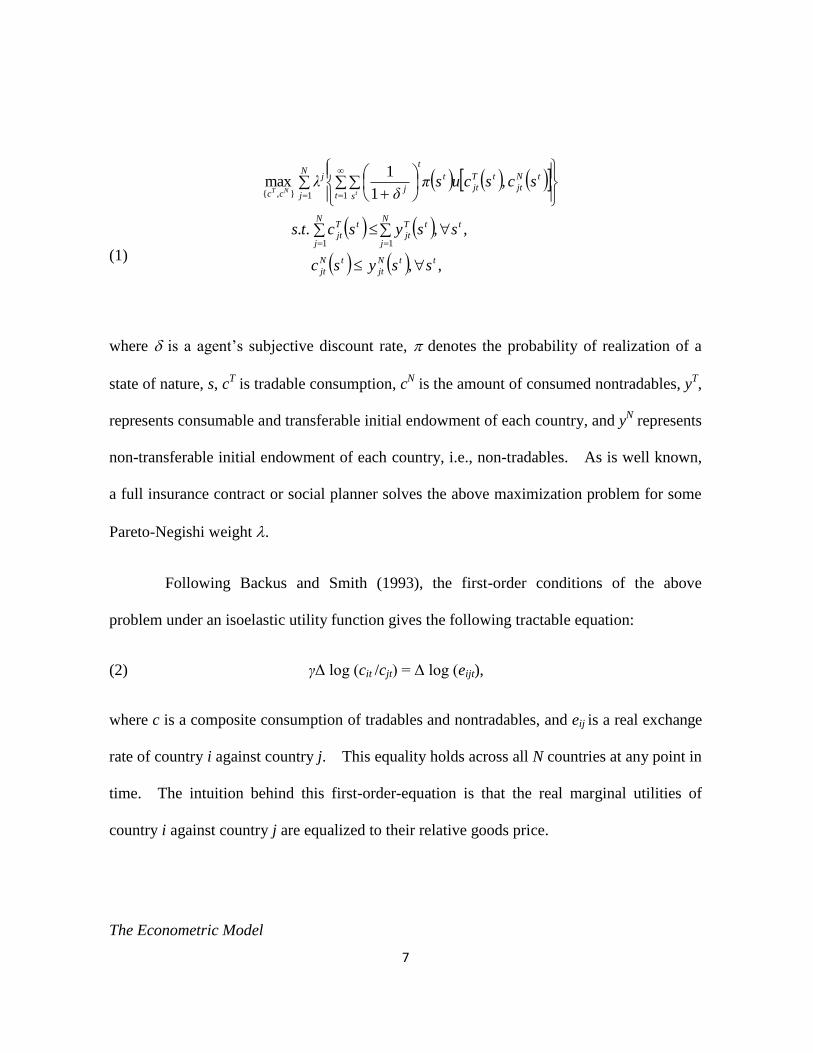
where is a agent’s subjective discount rate, denotes the probability of realization of a
state of nature, s, cT is tradable consumption, c
N is the amount of consumed nontradables, y
T,
represents consumable and transferable initial endowment of each country, and yN represents
non-transferable initial endowment of each country, i.e., non-tradables. As is well known,
a full insurance contract or social planner solves the above maximization problem for some
Pareto-Negishi weight .
Following Backus and Smith (1993), the first-order conditions of the above
problem under an isoelastic utility function gives the following tractable equation:
(2) γΔ log (cit /cjt) = Δ log (eijt),
where c is a composite consumption of tradables and nontradables, and eij is a real exchange
rate of country i against country j. This equality holds across all N countries at any point in
time. The intuition behind this first-order-equation is that the real marginal utilities of
country i against country j are equalized to their relative goods price.
The Econometric Model

8
By summing across these N equalities of equation (2), we have the following
testable equation:
(3) ,loglog
1log
1log
1
2
1
1 itijt
N
j
jt
N
j
it yeN
acN
ac
where ∆ is a first-difference operator, and y is per capita GDP. Note that, in equation (3),
income shock variables, ∆ log y, are added where the full consumption risk sharing
hypothesis implies that =0. In actual empirical implementation of equation (3), we
follow Ravallion and Chaudhuri (1998) and replace network average consumption by time
dummies. The average real exchange rate in the second term of equation (3) is replaced by
country fixed effects and the log first difference of real effective exchange rate, REER.
Accordingly, an estimable version of equation (3) becomes:
(4) ∆ log cit = a0 + αt + αi + αR ∆ log REERit + g ∆ log yit + uit,
where αi is the country fixed effect, αt is the time effect, and uit is a well-behaved error term.
In equation (4), we are interested in estimating the sensitivity parameter, g: A null
hypothesis that g=0 corresponds to the full consumption risk sharing hypothesis. Also, the
parameter, g, summarizes welfare impact of income change on consumption change.
Yet, estimating equation (4) by OLS may involve the endogeneity bias arising from
the correlation between unobserved consumption growth factor in the error term and per
capita GDP growth rate. Since this correlation is likely to be positive, an OLS estimate of
equation (1) may generate an upward bias in the estimated level of the sensitivity parameter
g. To handle this endogeneity problem and also to capture the impacts of disasters, our

9
basic idea is to use natural and man-made disaster information as identifying instrumental
variables for income change, ∆ log y, in equation (4). While natural and man-made
disasters will affect income level significantly, by nature, disasters, especially natural
disasters, are not necessarily manipulated by human beings or individuals.8 Disasters are
less likely to correlate with the error term of equation (4). Hence, we believe that our
identification approach will mitigate the endogeneity bias effectively. Accordingly, we
postulate the following first stage regression equation:
(5) ∆ log yit = Nit βN + Wit βW + Eit βE + γi + γt + εit,
where N, W, and E represent a set of variables related to natural disasters, wars and conflicts,
and economic crises, respectively. We also include country fixed effects, γi, and time effect,
γt. Our econometric model is a standard instrumental variable estimation with fixed effects
based on equations (4) and (5).
In equation (5), we can utilize the estimated coefficients, bN, bW, and bE,
respectively, for βN, βW, and βE to decompose per capita GDP change rate into three
subcomponents: per capita GDP change rate driven by natural disasters, NitbN; wars and
conflicts, WitbW; and economic crises, EitbE. By comparing these values, we can formally
compare which disaster has the greatest impact on welfare: by combining equations (4) and
(5), the total welfare impact of each disaster can be quantified by ĝNitbN, ĝWitbW, and ĝEitbE
8 In fact, Kahn (2005) found that an increase in GDP per capita has no effect on the probability that a natural
disaster takes place.

10
for natural disasters, conflict & wars, and economic crises, respectively, where ĝ is the
estimated income growth coefficient, g, in equation (4). In other words, we quantify and
compare the impacts of a variety of natural and man-made disasters on welfare by setting
per capita GDP and per capita consumption as the criteria for welfare evaluation.
III. Data Sources, Variables, and Descriptive Statistics
For the empirical analysis, we focus primarily on three broad categories: first,
natural and technological disasters; second, economic disasters; and third, war and conflicts.
The list of variables used, their definitions, and their data sources is shown in Table 1. We
use these variables on natural and man-made disasters as instrumental variables in equation
(2). First, with regards to the macroeconomic data such as per capita consumption and
GDP, we use the Penn World Table (PWT) Version 6.3 and World Development Indicators
(WDI) of the World Bank covering the 189 nations in our study. The real effective
exchange rate index, REER, is taken from International Monetary Fund’s International
Financial Statistics. The index represents a nominal effective exchange rate index, i.e., the
ratio of an index of a currency’s period- average exchange rate to a weighted geometric
average of exchange rates for the selected benchmark currencies, adjusted for relative
movements in national price.
Second, our data on natural disasters and technological disasters come from the
publicly available Emergency Events Database (EM-DAT) maintained by the Center for
Research on the Epidemiology of Disasters (CRED). The CRED classifies natural disasters
based on the following criterion: ten or more people were killed; 100 or more people were
affected, injured, or homeless; significant damage was incurred; a declaration of a state of

11
emergency and/or an appeal for international assistance was made. We use six variables
related to natural disasters 1) geological disasters including earthquakes and volcanic
eruptions; 2) meteorological disasters including storms; 3) hydrological disasters such as
floods, 4) climatological disasters such as droughts; 5) biological disasters such as
epidemics and insect infestations; and 6) technological disasters including industrial
accidents and transport accidents.9
Finally, data on man-made disasters is classified into two subcategories: first, we
use economic crises variables including growth collapse, hyperinflation, and financial,
and/or currency crisis. Data are extracted from the Carmen Reinhart’s Crisis Database
(Reinhart and Rogoff, 2010). As for violence related disasters relating to wars and conflicts,
we extract available information from multiple data sources, i.e., Correlates of War (COW)
database (Correlates of War, 2010); UPPSALA database (UPPSALA Conflict Database,
2010); and Carmen Reinhart Crisis database (Reinhart, 2010).
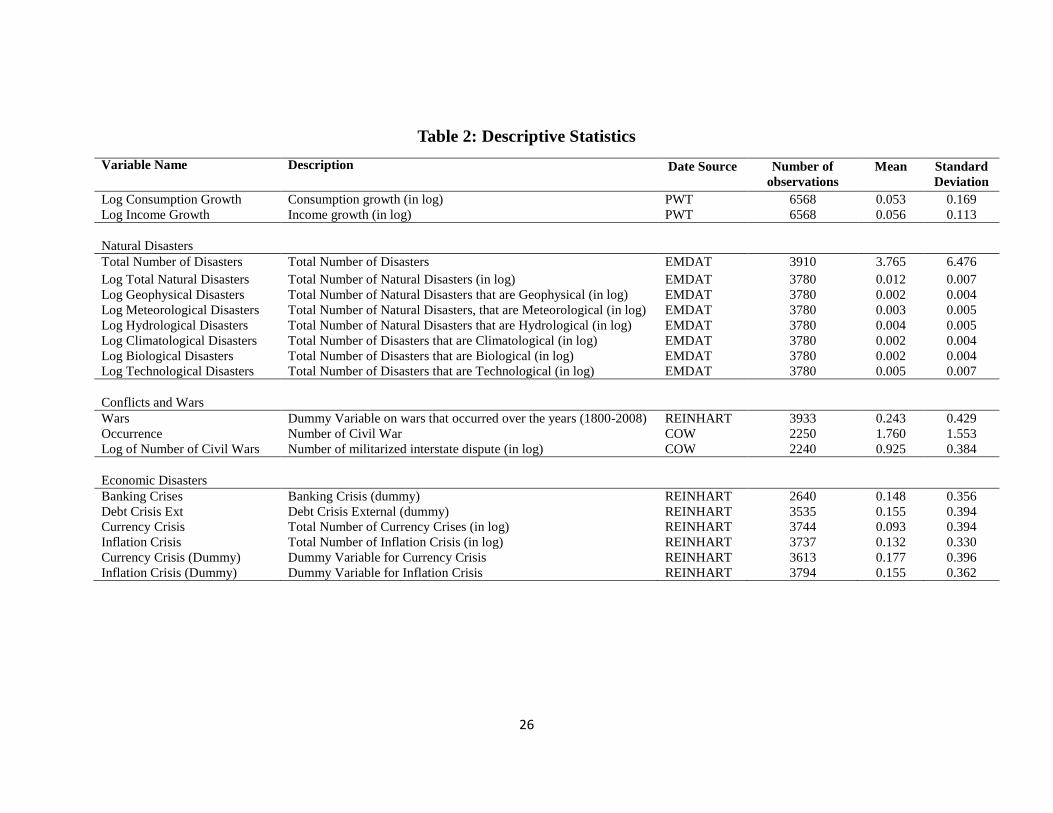
Descriptive statistics of the variables used are summarized in Table 2. According
to Table 2, on average, a country encounters 3.75 natural disasters per year; one war every
five years; and one economic crisis, i.e., banking, debt, currency or inflation crisis, every
other year.
IV. Empirical Findings
9 Strobl (2011) notes in his paper that, at least for hurricanes strikes in the in the Central American and
Caribbean regions, using EM-DAT data may not be appropriate. However, the purpose of our paper is to
compare the relative impacts of different natural and man-made disasters. Hence, we believe that our
empirical strategy is the most suitable among feasible approaches.

12
In actual estimation of equations (4) and (5), we use six different lags for growth
rates, i.e., one year, three years, ten years, 15 years, 20 years, and 25 years. By
investigating short run and long run impacts separately, we believe we can separately
consider the direct immediate net costs and indirect long term net losses from disasters as
addressed in Hallegatte and Przyluski (2010) and Skidmore and Toya (2007). In all
specifications reported in the following tables, we have also included the country fixed
effects and the year dummies.
Short Term Impacts
Table 3 shows the basic results of equation (2), i.e., the first stage per capita GDP
growth regression over a year. First, overall disasters have a significant negative impact on
GDP per capita. Moreover, once we incorporate detailed disaster variables, the
climatological disasters variable takes negative and statistically significant coefficient.
Intriguingly, biological disasters involve positive effects. In addition, wars and banking
crises have significant negative impacts.
Table 4 presents the results of the second stage regression, in reference to Equation
(4), which allows us to observe the relationship between consumption growth and income
growth rates. The estimated coefficients of income growth rate are consistently positive
and statistically significant in three out of four cases using the instrumental variable method,
indicating that global risk sharing is not necessarily working. Moreover, the point
estimates for the income coefficient using OLS are larger than those based on the
instrumental variable method, suggesting that there may be upward bias arising from
positive correlation between income and unobserved heterogeneities in the error term in

13
equation (4). These results indicate that natural and man-made disasters negatively affect
per capita GDP which may be translated into negative per capita consumption level. To
interpret the post estimates, around 20-40% of income shocks arising from disasters could
not be diversified away globally through a variety of market and non-market mechanimsms.
Note that the F statistics from the first stage regression and the Hansen’s J statistics for the
over identification tests support the validity of our econometric model. Moreover, even if we
use data of three year lagged log per capita GDP and consumption, basic qualitative results
are maintained.10
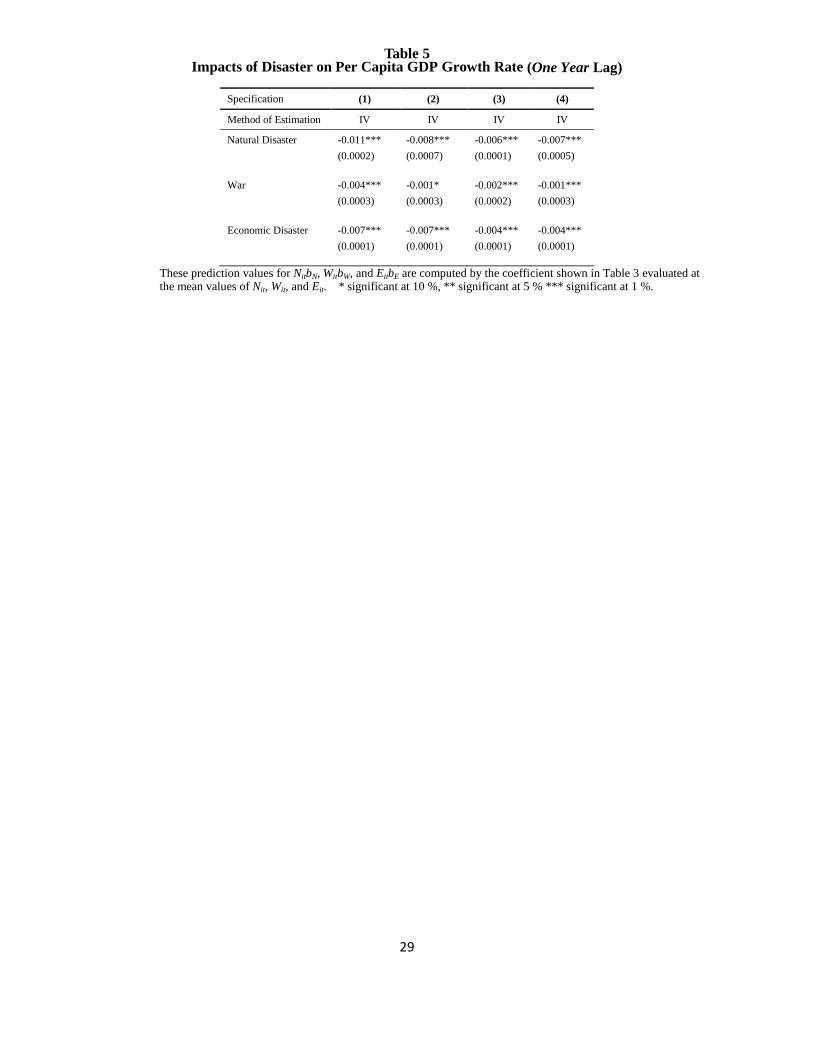
To capture the overall impacts of each disaster category, we decompose the
predicted average income growth rates into components of natural disasters, wars and
economic disasters evaluated at mean values. The decomposition results, i.e., the values of
NitbN, WitbW, and EitbE. evaluated at their average levels, are shown in Table 5.11
According to the second specification in Table 3, natural disasters decrease per capita GDP
growth rate by 1.1% points because the average number of natural disasters in log is 0.012
per year (Table 2). Similar computations have been made to construct Table 5 which
shows impacts of different disasters on per capita GDP growth rate. There are two
findings we can see from Table 5. First, we can see that natural disasters, wars, and
economic disasters generate statistically significant negative welfare impacts jointly.
Second, we can verify that, on average, natural disasters generate the largest negative
welfare effects in short term which is followed by wars and economic disasters.
10
The results are available from the corresponding author upon request.
11 Even using the results of the first stage regression for 3 years lag, the qualitative results are
maintained. These results are not shown in this paper but are available from the corresponding
author upon a request.

14
Long Term Impacts
So far, our analyses are based on one-year and three year lagged variables,
implying that the results reflect the very short term impact of disasters. In order to
examine long term impacts of disasters on consumption growth rate, we employ 15 years,
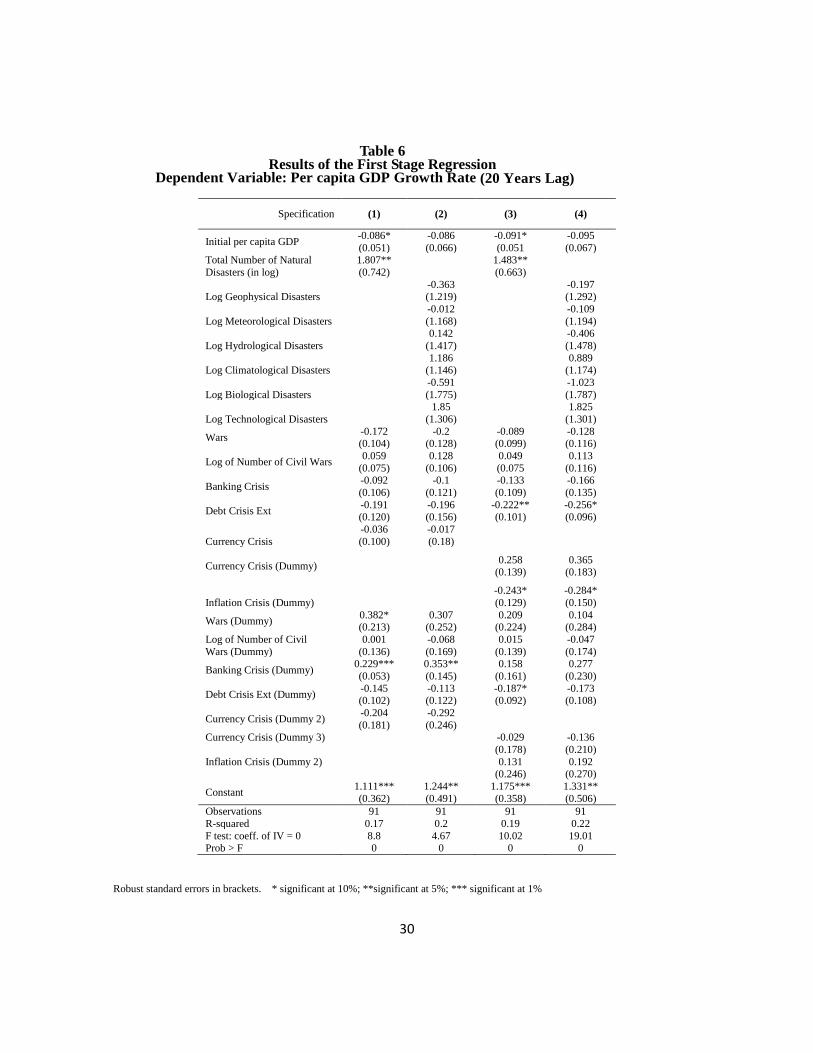
20 years, and 25 years lags. In estimating these models, we follow Skidmore and Toya
(2002) to include initial log income per capita as an additional explanatory variable in the
first stage regression equation (2).12
Based on the results in Table 6 which shows that the results based on 20 years lag,
we find that numbers of natural disasters in total have positive and statistically significant
coefficients.13
In contrast, with regards to economic disasters, the results of debt, currency
and inflation crises reveal negative effects over 20 years. To quantify the overall welfare
impacts, Table 7 represents the decomposition results of the model of 20 years lags. As we
can see, natural disasters have the largest positive impact on per capita GDP growth in the
long term. The estimated average negative impact of natural disasters ranges from 8.3% to
23.1% losses of per capita GDP over 20 years. In fact, these results are consistent with
Skidmore and Toya (2002) who find that climatic disasters are associated with higher rates
of long-run economic growth.14
As a new finding in the literature, our results show that
12
This is a version of the estimable transition equation of the Solow model.
13 When we use the first stage regression for 15 years and 25 years lag, the qualitative results are
maintained. These results are not shown in this paper but are available from the corresponding author upon a
request.
14 Cavallo and Noy (2009) and Skidmore and Toya (2002) suggest that a rationale for this counterintuitive
positive growth effect of natural disasters is that disasters maybe accelerating the “Schumpeterian” creative
destruction process.
15
wars have a similar positive effect on per capita GDP growth in the long term. In contrast,
economic disasters generate negative effects for 20 years.
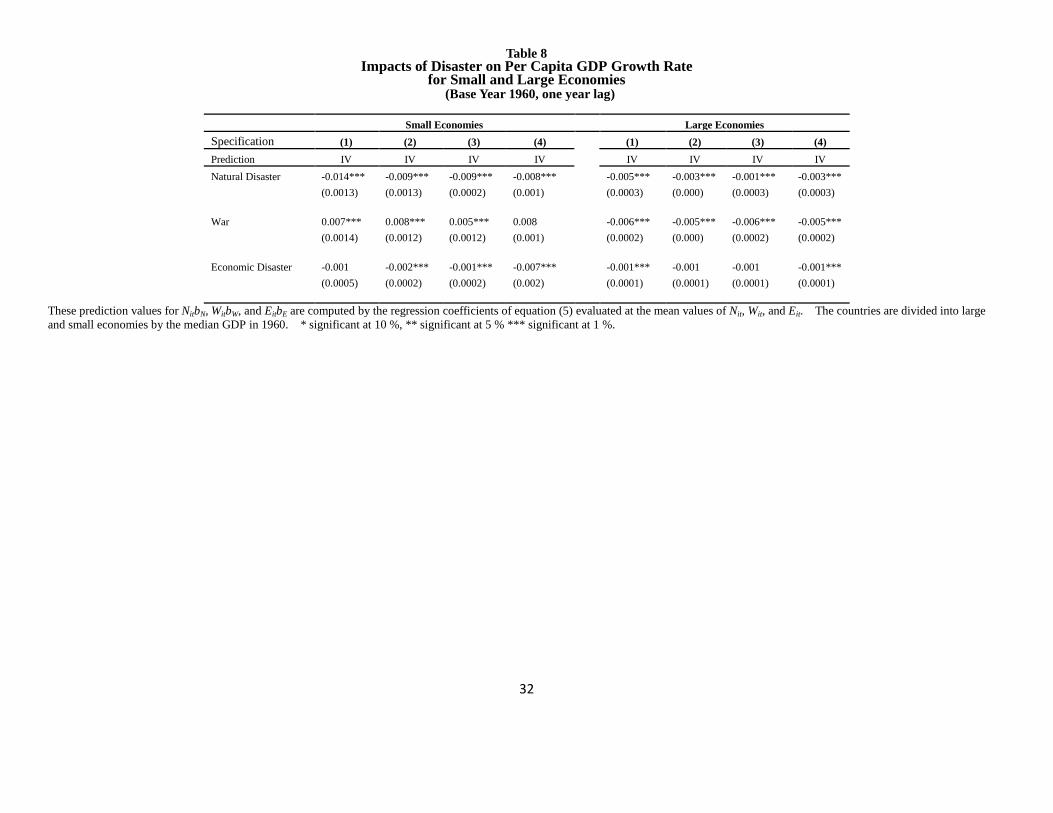
Large versus Small Economies
To investigate the differentiated impacts of natural disasters depending on the
varying size of economies, we follow Noy (2009) to divide the countries in our sample into
large and small countries on the basis of their GDP. We use GDP data in 1960 or 2006 to
split countries into two groups: “small” countries with below-median GDP and “large”
countries with above-median GDP. Based on the regression results for large countries and
small economies by the threshold of GDP data in 1960,15
overall decomposition figures are
summarized in Table 8. While wars indicate the largest negative welfare effect in the case
of large economies, impacts of natural disasters are biggest in small economies.
Moreover, in the 1960 GDP split, natural disasters have a smaller impact in large
economies than in small economies, as natural disasters are, in general, geographically
concentrated by nature. Hence, smaller economies, which occupy smaller area size on
average, are more detrimentally impacted by the effects of natural calamities. In contrast,
wars can affect a whole nation regardless of the size of the economy. As to the second
stage regression results of the log of consumption growth for the case of small and large
economies, as the estimated coefficients of income growth rate are positive and significant
in most cases, our results indicate that international consumption risk sharing is not working
within each group.
15
The regression results are available from the corresponding author upon request.

16
The Nexus between Natural and Man-made Disasters
While our study as well as Barro’s (2009) analyses both natural and man-made
disasters, the existing studies including ours treat natural and man-made disasters as
independent incidents. Yet, there may be an interrelationship between them. For
example, in the case of Japan’s 1923 earthquake, one of the most devastating earthquakes in
the country’s history, the impact of the earthquake was followed by a sharp decline in the
country’s GDP. Japan’s earthquake can be considered as an example of an exogenous
economic shock, whose effects are temporary-as a result of the earthquake, there was a
slowdown in output growth, and higher current account deficits in 1923 and 1924 (Obstfeld,
Rogoff, p76). In our study, we tried to examine if there existed any systemic relationship
between natural disasters and economic disasters. We looked at the simple pairwise
correlations between the numbers of different natural and man-made disasters. As per our
findings we conclude that natural disasters are not systematically related to man-made
disasters. In contrast, Miguel et al. (2004) used data from 41 African countries during
1981–99 to identify the causal impact of negative economic growth on civil conflict.
Intriguingly, they also find that the impact of negative growth shocks on conflict is not
significantly different in richer, more democratic, or more ethnically diverse countries.
Further investigations on the inter-relationships among natural disasters, wars, and
economic disasters should be undertaken in future research.
V. Concluding Remarks
In this paper, we compared the impacts of various man-made and natural disasters
quantitatively. We carefully constructed cross-country panel data of 189 countries from
17
1968 to 2001 on a wide variety of natural disasters such as hydrological, geophysical, and
biological disasters as well as man-made disasters such as economic crises, civil conflicts
and wars.
There are four main empirical findings that have emerged from our analysis. First,
in the short term, natural disasters, wars, and economic disasters involve statistically
significant negative impacts, i.e., declines in per capita GDP growth rates. Furthermore,
natural disasters generate the largest negative welfare effects which are followed by wars
and economic disasters. Second, in the long term, natural disasters and wars have positive
impacts on per capita GDP growth and welfare. In contrast, economic disasters
continuously generate negative impacts. Third, wars affect large economies more than
small economies; while natural disasters affect small economies disproportionately. Finally,
we test the full consumption risk sharing hypothesis in our model by regressing per capita
consumption growth rates on per capita GDP growth rates as their idiosyncratic shock
variables. Based on our results, overall, we find evidence against global consumption risk
sharing. Our empirical results suggest that stronger emphasis should be placed on
short-term post-disaster rehabilitations for natural disasters, conflicts and warfare and on
long-term continuous interventions against economic crises. In terms of policy
implications, it is important to note that losses and damages caused by natural disasters are
physical, and thus they are visible for reconstruction and rehabilitation. In the longer term,
these damages fade away by a variety of rehabilitation and reconstruction investments.
However, the impacts of economic crises are largely intangible. Thus there is a need for
devising long term reconstruction measures for addressing the after-effects of economic
crises, such as the recent global financial crisis. Furthermore, in addition to ex-post policy

18
emphasis, it is also extremely important to focus and invest in ex-ante risk mitigation
strategies such as formal regional and/or global risk pooling facilities.
In our paper we examine cross-country variation in consumption welfare. Future
studies should explore heterogeneities within countries. It would be worth investigating how
within a country consumption variation or income distribution is affected by disasters.

19
REFERENCES
Bacus, D., and G. W. Smith. “Consumption and Real Exchange Rates in Dynamic
Economies with Non-Traded Goods.” Journal of International Economics, 35, 1993,
297-316.
Barro, R. “Rare Disasters, Asset Prices, and Welfare Costs.” American Economic Review,
99, 2009, 243-64.
Baxter, M., and U. J. Jermann. “Household Production and the Excess Sensitivity of
Consumption to Current Income.” American Economic Review, 89 , 1999, 902-920.
Baxter, M., and U. J. Jermann, and R. G. King. “Nontraded goods, nontraded factors, and
international non-diversification.” Journal of International Economics, 44, 1998, 211-229.
Blattman, C., and E. Miguel. “Civil War.” Journal of Economic Literature, 48, 2010,
3-57.
Blomberg, S. B., G. D. Hess, and O. Athanasios. "The Macroeconomic Consequences of
Terrorism." Journal of Monetary Economics, 51, 2004, 1007-1032.
Braun. J. V. “Food and Financial Crises: Implications for Agriculture and the Poor.”
International Food Policy Research Institute (IFPRI), 2008.
Cabinet Office (2011), Getsurei Keizai Hokoku (Monthly Economic Report), March 2011,
the Government of Japan.
Cavallo, E. and I. Noy. "The Economics of Natural Disasters: A Survey," RES Working
Papers No. 4649, I2009.
Cochrane, J. H., “A Simple Test of Consumption Insurance.” Journal of Political
Economy, 99, 1991, 957-976.
20
Correlates of War. COW Militarized Interstate Disputes (v.3.10), Available online at
http://www.correlatesofwar.org. 2010.
Claessens, S., S. Djankov, and L. Xu. “Corporate Performance in the East
Asian Financial Crisis.” World Bank Research Observer, 15, 2000, 23-46.
Davis, Donald and David E. Weinstein. “Bones, Bombs, and Break Points: The Geography
of Economic Activity,” American Economic Review 92, 2002, 1269-89.
Dercon, S. ed., Insurance against Poverty. London: Oxford University Press, 2005.
Dubois, P, B. Jullien, and T. Magnac. “Formal and Informal Risk Sharing in LDCs: Theory
and Empirical Evidence,” Econometrica, 76,2008, 679-725.
EM-DAT: The OFDA/CRED International Disaster Database. Univeristy Catholique de
Louvain, Brussels, Belgium. Available online at http://www.em-dat.net. 2010.
Fafchamps, M. Rural Poverty, Risk and Development. London: Edward Elgar Publishing
2004.
Fallon, P. R., and E. B. R.Lucas. “The Impact of Financial Crises on Labor Market,
Household Incomes, and Poverty: A Review of Evidence.” World Bank Research Observer,
17, 2002, 21–45.
Hallegate, S. and V. Pruzyluski. “The Economics of Natural Disasters”, CESIfo Forum 11,
2010, 14-24.
Hayashi, F., J. Altonji, and L. Kotlikoff. “Risk-Sharing Between and Within Families.”
Econometrica 64, 1996, 261-94.
21
Headley, D. and S. Fan. Reflections on the Global Food Crisis. International Food Policy
Research Institute (IFPRI), 2010.
Hess, G. “The Economic Welfare Cost of Conflict: An Empirical Assessment.”CESIfo
Working Paper No. 852, 2003.
Kahn, M. “The Death Toll From Natural Disasters: The Role of Income, Geography, and
Institutions.” Review of Economics and Statistics, 87, 2005, 271-284.
Kang, S., and Y. Sawada. "Credit Crunch and Household Welfare: The Case of the Korean
Financial Crisis.” Japanese Economic Review, 59, 2008, 438-458.
Kaminsky, G. L., and C. M. Reinhart. “The Twin Crisis: The Causes of Banking and
Balance-of-Payments Problems.” American Economic Review, 89, 1999, 473-500.
Kinnan, C “Distinguishing barriers to insurance in Thai villages.” mimeographed,
Northwestern University, 2010.
Kunreuther, H., and A. Rose eds. . The Economics of Natural Hazards I and II. Edward
Elgar Publishers, Inc, 2004.
Lewis, K. “What Can Explain the Apparent Lack of International Consumption
Risk-Sharing?” Journal of Political Economy, 104, 1996, 267-297.
Ligon, Ethan. Risk sharing. Palgrave Macmillan, 2nd edition, 2008.
Lucas, R. Models of Business Cycles. New York: Basil Blackwell, 1987.
Mace, Barbara J. “Full Insurance in the Presence of Aggregate Uncertainty.” Journal of
Political Economy, 99, 1991, 928-996.
Miguel, E. and G. Roland. “The Long Run Impact of Bombing Vietnam.” Forthcoming,
Journal of Development Economics, 2011.

22
Miguel, E., S. Satyanath and E. Sergenti. “Economic Shocks and Civil Conflict: An
Instrumental Variable Approach.” Journal of Political Economy, 112, 2004, 725-752.
Noy, I. "The Macroeconomic Consequences of Disasters." Journal of Development
Economics. 88, 2009, 221-231.
Obstfeld, M.and K. Rogoff. Foundations of International Economics. Massachusetts: The
MIT Press, 1996.
Ogaki, M., and Z. Qian. “Decreasing Relative Risk Aversion and Tests of Risk Sharing.”
Econometrica, 69, 2001, 515-26.
Ravallion, M. and M. Lokshin.“Lasting Local Impacts of an Economywide Crisis.” World
Bank Policy Research Working Paper No. 3503, 2005.
Reinhart, C. and K. Rogoff. “Financial Crash to Debt Crisis.” NBER Working Paper No.
15795, March 2010, forthcoming in American Economic Review.
Sachs, J., and A. Warner. "Trade Openness Indicators.” Available at
http://www.cid.harvard.edu/ciddata/warner_files/sachswarneropen.xls, 2010.
Sawada, Y.,“The Impact of Natural and Manmade Disasters on Household Welfare.”
Agricultural Economics, 37, 2007, , 59-73.
Sawada, Y., K. Nawata, M. Ii, and Lee, M. “Did the Financial Crisis in Japan Affect
Household Welfare Seriously?” Journal of Money, Credit, and Banking 43, 2011, 297-324.
23
Sawada, Y., and S. Shimizutani. “How Do People Cope with Natural Disasters? Evidence
from the Great Hanshin-Awaji (Kobe) Earthquake in 1995.” Journal of Money, Credit and
Banking, 40, 2008, 463–88,.
Skidmore M., and H. Toya.“Do Natural Disasters promote Long-run Growth.” Economic
Inquiry, 40, 2008, 664-687.
Strobl, E. “The Economic Growth Impact of Natural Disasters in Developing Countries:
Evidence from Hurricane strikes in Central American and Caribbean regions.” Journal of
Development Economics, 2011
Strömberg, D. "Natural Disasters, Economic Development, and Humanitarian Aid." Journal
of Economic Perspectives, 21, 2007, 199–222.
Townsend, R. M. ”Risk and Insurance in Village India.” Econometrica, 62, 1994, 539-591.
Toya, H., and M. Skidmore.“Economic Development and the Effects of Natural
Disasters.”Economics Letters, 94, 2007, 20-25.
Penn World Tables Version 6.3. Available at http://pwt.econ.upenn.edu. 2010.
UPPSALA Conflict Database (UCDP), UCDP One-sided Violence Dataset v 1.3 1989-2007
and UCDP Battle-related deaths dataset v5 2002-2007, Available at
http://www.pcr.uu.se/research/UCDP/data_and_publications/datasets.htm. 2010.
WDI. World Development Indicators 2010. Available at
http://databank.worldbank.org/ddp/home.do. 2010.
Yang, D., "Coping with Disaster: The Impact of Hurricanes on International Financial
Flows, 1970-2002." B.E. Journal of Economic Analysis and Policy Advances, 1, 2008.
24
Figure 1
Frequency of Natural and Man-made Disasters, 1960s-2006
Data sources)Natural disasters: EM-DAT: The OFDA/CRED International Disaster Database
www.em-dat.net; Wars: Correlates of War, 2010, COW Militarized Interstate Disputes, v.3.10,
http://www.correlatesofwar.org/; and economic crisis: Reinhart and Rogoff (2010).

25
Table 1 Definition and Sources of Variable
Variables
Definition Source
Per capita consumption
growth rate (in log)
Logarithm of per capita consumption rate PWT
Per Capita GDP growth
rate (in log)
Logarithm of percentage change in per capita GDP PWT
Real effective exchange
rate
Real effective exchange rate index IFS
Geophysical disasters Geophysical disasters (originating from solid earth Earthquake,
Volcano, Mass Movement)
EMDAT
Meteorological disasters Events caused by short-lived/small to meso scale atmospheric
processes (in the spectrum from minutes to days) such as storms
EMDAT
Hydrological disasters Hydrological disasters (caused by deviations in the normal water
cycle and/or overflow of bodies of water caused by wind set-up)
such as floods
EMDAT
Climatological disasters Climatic disaster events caused by long-lived/meso to macro scale
processes (in the spectrum from intra-seasonal to multi-decadal
climate variability) such as extreme temperature, droughts, wildfire
EMDAT
Technological disasters Industrial accidents such as chemical spills, collapses of industrial
infrastructures, fires, and radiation; or transport accidents by air,
rail, road or water means of transport
EMDAT
Biological disasters Biological disaster events caused by the exposure of living
organisms to germs and toxic substances such as Epidemics, Insect
infestations, Animal Stampedes
EMDAT
Number of civil wars Number of militarized interstate disputes, i.e., disputes that are
united historical cases of conflict in which the threat, display or use
of military force short of war by one member state is explicitly
directed towards the government, official representatives, official
forces, property, or territory of another state. Disputes are composed
of incidents that range in intensity from threats to use force to actual
combat short of war.
COW
Big wars Wars that occurred over the years (1800-2008) REINHART
Currency crises An annual depreciation versus the US dollar of 15 percent or more REINHART
Inflation crises An annual inflation rate 20 percent or higher (Hyperinflation) REINHART
Banking crises Two types of events: (1) bank runs that lead to the closure, merging,
or takeover by the public sector of one or more financial institutions;
and (2) if there are no runs, the closure, merging, takeover, or
large-scale government assistance of an important financial
institutions (or group of institutions), that marks the start of a string
of similar outcomes for other financial institutions
REINHART
Debt crises domestic Default or rescheduling on domestic debt (includes deposit
freezes)
REINHART
Debt crises external Default or rescheduling on foreign debt REINHART
Data Sources) COW: Correlates of War (2010), COW Militarized Interstate Disputes (v.3.10), http://www.correlatesofwar.org/;
EMDAT:"EM-DAT: The OFDA/CRED International Disaster Database www.em-dat.net; IFS: International Financial Statistics online,
International Monetary Fund; PWT: Penn World Tables (2010); WDI: World Development Indicators (2010); UPPSALA: UPPSALA
Conflict Database (UCDP); REINHART: Database for Reinhart and Rogoff (2010).
26
Table 2: Descriptive Statistics
Variable Name Description Date Source Number of
observations
Mean Standard
Deviation
Log Consumption Growth Consumption growth (in log) PWT 6568 0.053 0.169
Log Income Growth Income growth (in log) PWT 6568 0.056 0.113
Natural Disasters
Total Number of Disasters Total Number of Disasters EMDAT 3910 3.765 6.476
Log Total Natural Disasters Total Number of Natural Disasters (in log) EMDAT 3780 0.012 0.007
Log Geophysical Disasters Total Number of Natural Disasters that are Geophysical (in log) EMDAT 3780 0.002 0.004
Log Meteorological Disasters Total Number of Natural Disasters, that are Meteorological (in log) EMDAT 3780 0.003 0.005
Log Hydrological Disasters Total Number of Natural Disasters that are Hydrological (in log) EMDAT 3780 0.004 0.005
Log Climatological Disasters Total Number of Disasters that are Climatological (in log) EMDAT 3780 0.002 0.004
Log Biological Disasters Total Number of Disasters that are Biological (in log) EMDAT 3780 0.002 0.004
Log Technological Disasters Total Number of Disasters that are Technological (in log) EMDAT 3780 0.005 0.007
Conflicts and Wars
Wars Dummy Variable on wars that occurred over the years (1800-2008) REINHART 3933 0.243 0.429
Occurrence Number of Civil War COW 2250 1.760 1.553
Log of Number of Civil Wars Number of militarized interstate dispute (in log) COW 2240 0.925 0.384
Economic Disasters
Banking Crises Banking Crisis (dummy) REINHART 2640 0.148 0.356
Debt Crisis Ext Debt Crisis External (dummy) REINHART 3535 0.155 0.394
Currency Crisis Total Number of Currency Crises (in log) REINHART 3744 0.093 0.394
Inflation Crisis Total Number of Inflation Crisis (in log) REINHART 3737 0.132 0.330
Currency Crisis (Dummy) Dummy Variable for Currency Crisis REINHART 3613 0.177 0.396
Inflation Crisis (Dummy) Dummy Variable for Inflation Crisis REINHART 3794 0.155 0.362

27
Table 3
Results of the First Stage Regression
Dependent Variable: Per Capita GDP Growth Rate (One Year Lag)
Specification
(1) (2) (3) (4)
Total Number of Natural Disasters (in log) -0.785* (0.449)
-0.573 (0.460) -
Log Geophysical Disasters
-0.665
(0.507) -0.739
(0.561)
Log Meteorological Disasters
0.006
(0.412) 0.034
(0.422)
Log Hydrological Disasters
-0.338 (0.403)
-0.256
(0.398)
Log Climatological Disasters
-1.456***
(0.523) -1.303**
(0.538)
Log Biological Disasters
1.553
(0.994) 1.984* (1.079)
Log Technological Disasters
-0.36 (0.351)
-0.348
(0.353)
Wars -0.016**
(0.006)
-0.016***
(0.006)
-0.019***
(0.006)
-0.019***
(0.006)
Log of Number of Civil Wars 0.001
(0.006)
0.001
(0.006)
0.001
(0.006)
0.001
(0.006)
Banking Crisis -0.015***
(0.005)
-0.014**
(0.005)
-0.015***
(0.005)
-0.013**
(0.005)
Debt Crisis Ext -0.009
(0.010)
-0.0011
(0.011)
-0.016
(0.011)
-0.018
(0.011)
Currency Crisis 0.004 (0.014)
0.003 (0.013)
Inflation Crisis -0.029
(0.027) -0.018
(0.026)
Currency Crisis (Dummy)
-0.003
(0.009) -0.006 (0.009)
Inflation Crisis (Dummy)
0.017
(0.011) 0.020* (0.011)
Observations 512 512 503 503 Year Dummy No No No No
Fixed Effect Yes Yes Yes Yes
R-squared 0.63 0.64 0.64 0.65 F test: coeff. of IV = 0 4.34 3.55 4.96 3.86
Prob > F 0.01 0.00 0.00 0.00
Robust standard errors in brackets
* significant at 10%; ** significant at 5%; *** significant at 1%

28
Table 4 Results of the Second Stage Regression
Dependent Variable: Per Capita Consumption Growth Rate (One Year Lag)
Specification (1) (2) (3) (4)
Method of Estimation OLS IV IV IV IV
Log Income Growth
0.471***
(0.000)
0.449*
(0.271)
0.316*
(0.177)
0.435**
(0.201)
0.192
(0.223)
Real Effective Exchange Rate 0.421
(1.978)
1.264
(2.224)
0.056
(0.201)
0.047
(0.203)
0.057
(0.205)
Constant
0.081***
(0.020) 0.131*** (0.028)
0.105*** (0.032)
0.093*** (0.035)
0.119*** (0.037)
Observations 399 365 365 358 358 Year Dummy Yes Yes Yes Yes Yes
Fixed Effect Yes Yes Yes Yes Yes
R-squared 0.54 0.47 0.47 0.47 0.47 Overid-Test 5.7 14.9 7.94 10.8
Chi-sq P-val 0.4 0.49 0.49 0.12
Robust standard errors in brackets
* significant at 10%; ** significant at 5%; *** significant at 1%
29
Table 5 Impacts of Disaster on Per Capita GDP Growth Rate (One Year Lag)
Specification (1) (2) (3) (4)
Method of Estimation IV IV IV IV
Natural Disaster
-0.011***
(0.0002)
-0.008***
(0.0007)
-0.006***
(0.0001)
-0.007***
(0.0005)
War
-0.004***
(0.0003)
-0.001*
(0.0003)
-0.002***
(0.0002)
-0.001***
(0.0003)
Economic Disaster
-0.007***
(0.0001)
-0.007***
(0.0001)
-0.004***
(0.0001)
-0.004***
(0.0001)
These prediction values for NitbN, WitbW, and EitbE are computed by the coefficient shown in Table 3 evaluated at the mean values of Nit, Wit, and Eit. * significant at 10 %, ** significant at 5 % *** significant at 1 %.
30
Table 6
Results of the First Stage Regression Dependent Variable: Per capita GDP Growth Rate (20 Years Lag)
Specification (1) (2) (3) (4)
Initial per capita GDP -0.086*
(0.051)
-0.086
(0.066)
-0.091*
(0.051
-0.095
(0.067) Total Number of Natural
Disasters (in log)
1.807**
(0.742)
1.483**
(0.663)
Log Geophysical Disasters
-0.363 (1.219)
-0.197 (1.292)
Log Meteorological Disasters
-0.012
(1.168)
-0.109
(1.194)
Log Hydrological Disasters
0.142
(1.417)
-0.406
(1.478)
Log Climatological Disasters
1.186 (1.146)
0.889
(1.174)
Log Biological Disasters
-0.591
(1.775)
-1.023
(1.787)
Log Technological Disasters
1.85
(1.306)
1.825
(1.301)
Wars -0.172 (0.104)
-0.2 (0.128)
-0.089 (0.099)
-0.128 (0.116)
Log of Number of Civil Wars 0.059
(0.075)
0.128
(0.106)
0.049
(0.075
0.113
(0.116)
Banking Crisis -0.092
(0.106)
-0.1
(0.121)
-0.133
(0.109)
-0.166
(0.135)
Debt Crisis Ext -0.191 (0.120)
-0.196 (0.156)
-0.222** (0.101)
-0.256* (0.096)
Currency Crisis
-0.036
(0.100)
-0.017
(0.18)
Currency Crisis (Dummy)
0.258
(0.139) 0.365
(0.183)
Inflation Crisis (Dummy)
-0.243*
(0.129)
-0.284*
(0.150)
Wars (Dummy) 0.382* (0.213)
0.307 (0.252)
0.209 (0.224)
0.104 (0.284)
Log of Number of Civil
Wars (Dummy)
0.001
(0.136)
-0.068
(0.169)
0.015
(0.139)
-0.047
(0.174)
Banking Crisis (Dummy) 0.229***
(0.053)
0.353**
(0.145)
0.158
(0.161)
0.277
(0.230)
Debt Crisis Ext (Dummy) -0.145 (0.102)
-0.113 (0.122)
-0.187* (0.092)
-0.173 (0.108)
Currency Crisis (Dummy 2) -0.204
(0.181)
-0.292
(0.246)
Currency Crisis (Dummy 3) -0.029
(0.178)
-0.136
(0.210)
Inflation Crisis (Dummy 2) 0.131
(0.246)
0.192
(0.270)
Constant 1.111***
(0.362)
1.244**
(0.491)
1.175***
(0.358)
1.331**
(0.506)
Observations 91 91 91 91
R-squared 0.17 0.2 0.19 0.22
F test: coeff. of IV = 0 8.8 4.67 10.02 19.01 Prob > F 0 0 0 0
Robust standard errors in brackets. * significant at 10%; **significant at 5%; *** significant at 1%

31
Table 7
Impacts of Disaster on Per Capita GDP Growth Rate (20 Years Lags)
Specification (1) (2) (3) (4)
Method of Estimation IV IV IV IV
Natural disaster 0.231***
(0.013)
0.120***
(0.016)
0.190***
(0.016)
0.083***
(0.010)
War 0.129***
(0.012)
0.095***
(0.010)
0.080***
(0.007)
0.039***
(0.005)
Economic disaster -0.066***
(0.009)
-0.44***
(0.008)
-0.009
(0.007)
-0.019**
(0.008)
These prediction values for NitbN, WitbW, and EitbE are computed by the coefficient shown in Table 6 evaluated at
the mean values of Nit, Wit, and Eit. * significant at 10 %, ** significant at 5 % *** significant at 1 %.
32
Table 8 Impacts of Disaster on Per Capita GDP Growth Rate
for Small and Large Economies (Base Year 1960, one year lag)
Small Economies Large Economies
Specification (1) (2) (3) (4)
(1) (2) (3) (4)
Prediction IV IV IV IV IV IV IV IV
Natural Disaster
-0.014***
(0.0013)
-0.009***
(0.0013)
-0.009***
(0.0002)
-0.008***
(0.001)
-0.005***
(0.0003)
-0.003***
(0.000)
-0.001***
(0.0003)
-0.003***
(0.0003)
War
0.007***
(0.0014)
0.008***
(0.0012)
0.005***
(0.0012)
0.008
(0.001)
-0.006***
(0.0002)
-0.005***
(0.000)
-0.006***
(0.0002)
-0.005***
(0.0002)
Economic Disaster
-0.001
(0.0005)
-0.002***
(0.0002)
-0.001***
(0.0002)
-0.007***
(0.002)
-0.001***
(0.0001)
-0.001
(0.0001)
-0.001
(0.0001)
-0.001***
(0.0001)
These prediction values for NitbN, WitbW, and EitbE are computed by the regression coefficients of equation (5) evaluated at the mean values of Nit, Wit, and Eit. The countries are divided into large
and small economies by the median GDP in 1960. * significant at 10 %, ** significant at 5 % *** significant at 1 %.